This PDF is a selection from an out-of-print volume from the National Bureau of Economic Research
Volume Title: The American Economy in Transition Volume Author/Editor: Martin Feldstein, ed. Volume Publisher: University of Chicago Press Volume ISBN: 0-226-24082-7 Volume URL: http://www.nber.org/books/feld80-1 Publication Date: 1980
Chapter Title: The Role of Government: Taxes, Transfers, and Spending Chapter Author: George F. Break, George P. Shultz, Paul A. Samuelson Chapter URL: http://www.nber.org/chapters/c11303 Chapter pages in book: (p. 617 - 674)
9
The Role of Government: Taxes, Transfers, and Spending 1. George F. Break 2. George P. Shultz 3. Paul A. Samuelson
1. George F. Break The role of government during the postwar period has been the subject of much passionate debate and has greatly enlivened the lecture, cocktail, and many other circuits too numerous to mention. The purpose of this paper is not to extend those discussions of what should be done about the government, or to add to the already extensive analyses of why governments grow. Rather it is the more sober one of taking a close look at the revenues and expenditures of United States governments during the past thirty years or so in order to identify the main structural changes that may have occurred during that period. Some of these changes, of course, are already well-known and broadly recognized, others may be less conspicuous, and still others may call forth dispute and discussion. The focus throughout will be on what may be termed the official fiscal record of governmental spending and taxing. Two sources of data are available for this purpose—the national income and product accounts (NIPA) and the Bureau of the Census, Governmental Finances series (BOC:GF). For the federal government, in addition, there is the annual budget document and the accompanying special analyses. These are the George F. Break is professor of econmics at the University of California at Berkeley. I wish to thank David Arsen for assistance in collecting and analyzing the data and Michael J. Boskin and Richard A. Musgrave for their very helpful comments on the first draft of the paper. 617
618
George F. Break/George P. Shultz/Paul A. Samuelson
statistical series studied, for what they do show, for what they don't show, and for what they could show with suitable adjustments. 9.1
Broad Expenditure Changes
By any of the standard measures, government expenditures have grown significantly during the postwar period. Table 9.1 summarizes the official record for all levels of government together. Bureau of the Census accounts show two broad expenditure measures, one covering general government activities only (table 9.1, section A), and the other adding to general expenditures those of public utilities, government liquor stores, and insurance trust funds (table 9.1, section B). The national income and product accounts show one expenditure series (table Table 9.1
Alternate Measures of Government Expenditure Growth during the Postwar Period Average Annual Growth Rate During Period
Expenditure Measures
Terminal Years
A. BOCGF General Expenditures*
1948
1976-77
Nominal dollars (billions) Nominal dollars per capita Billions of 1972 dollars* Constant dollars per capita Ratio of current dollar expenditures to GNP
50.1 342 89.6 900
514.0 2,380 375.7 1,682
B. BOCGF Total Expenditures*
1948
1976-77
55.1 376 98.6 990
680.3 3,150 497.3 2,229
1. 2. 3. 4. 5.
1. 2. 3. 4. 5.
Nominal dollars (billions) Nominal dollars per capita Billions of 1972 dollarsb Constant dollars per capita Ratio of current dollar expenditures to GNP
C. NIPA Total Expenditures* 1. 2. 3. 4. 5. a b
Nominal dollars (billions) Nominal dollars per capita Billions of 1972 dollars* Constant dollars per capita Ratio of current dollar expenditures to GNP
.272
.193
.360
.213 7947
1977
42.5 295 80.5 559
621.7 2,866 441.9 2,037
.183
.325
8.4 7.0 5.1 2.2 1.1
9.2 7.7 5.8 2.8 1.8
9.3 7.8 5.8 4.4 1.9
Intergovernmental expenditures are excluded from total expenditures of grantors. Computed using the NIPA implicit deflator for personal consumption expenditures.
619
The Role of Government: Taxes, Transfers, and Spending
9.1, section C) which differs both in conceptual framework and in measurement procedures from the BOC:GF series.1 Absolute dollar expenditures (lines A.I, B.I, and C.I in table 9.1) show the most striking, and least meaningful, picture of postwar government growth. Clearly, one should make some allowance for the growth of population (lines A.2, B.2, C.2), for increases in the general price level (lines A.3, B.3, C.3), and for both together (lines A.4, B.4, C.4). Neither adjustment, however, is free of ambiguities. Unchanged expenditures on pure public goods yield unchanged public benefits to everyone as population grows, though per capita expenditures thereon decline steadily. Choice of the proper price index to convert different kinds of government expenditures to constant-dollar terms is a complex issue that will be discussed below. For the moment the best single measure of the postwar growth in the total expenditures of all levels of government in this country appears to be their ratio to gross national product (GNP) with both the numerator and denominator measured in nominal (current) dollars (lines A.5, B.5, C.5).2 Relative to the size of the economy, then, all three broad expenditure measures have grown significantly during the past thirty years. BOC general expenditures rose from 19 percent of GNP in 1948 to 27 percent in 1976-77, BOC total expenditures rose from 21 to 36 percent of GNP during the same period, and NIPA expenditures increased from 18 to 32.5 percent of GNP between 1947 and 1977. 9.1.1 Economic Composition of Expenditures The national income accounts distinguish five major economic categories of government expenditure. These show the different ways in which the government goes about its many activities, as distinct from the purposes or functions served thereby, to be discussed later. When the economic structure of all government activities in the country in 1977 or 1978 is compared with the structures in 1948, little change shows up (table 9.2). Purchases of goods and services were 63 percent of the total in all three years, and a modest rise in transfer payments from 29 to 32 percent of the total was matched by an equal fall, from 8 to 4 percent, in net interest payments. Indeed, for those who treat debt interest as one kind of transfer payment there would be virtually no change in the economic structure of government spending (see, for example, Rolph 1948; 1954). When the federal and state-local sectors are separated, however, three structural changes that merit attention show up. Federal purchases of goods and services shrank from 43 to 33 percent of the budget, while state-local resource using programs grew from 87 to 93 percent, solidifying further their dominant position in that sector. Opposite shifts moved
V^ ^ f —* ON n * ff\ H
1)
vo " T-H ON
CO
ON 1-1
C3 I—t
fS ta e (
4
_ _
20
_
im
en ts-
f
MM
10
1948 50
52
54
56
58
60
62
64
66
68
70
72
74
76 1978 est.
FISCAL YEARS
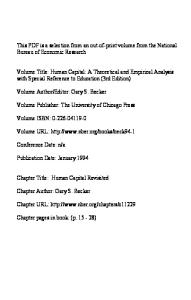
Fig. 9.2
The growing state and local dependency on outside aid, selected years 1948-78. (Outside aid as a percentage of general revenue from own sources.) Data from ACIR, Significant Features of Fiscal Federalism, 1978-79 Edition, Report M-115 (May 1979), p. 80.
Though no sharp reversal in these trends appears to be imminent, there are signs that here too postwar growth rates may be slowing markedly. Federal grants are projected in the 1981 United States budget to grow less rapidly than the economy, falling to 3.5 percent of GNP in 1979 and to 3.4 percent in 1981.9 If these projections are realistic, they represent a new phase in intergovernmental relations. With relatively less federal money flowing in, states may slow the growth in their own aid to local governments. It will be some time, however, before the full significance of these developments is revealed. In a federal fiscal system with significant flows of intergovernmental aid two distinct measures of the relative importance of different levels of
634
George F. Break/George P. Shultz/Paul A. Samuelson
government can be constructed. Like transfer payments in the national income accounts, intergovernmental grants may be treated in aggregate fiscal accounting by either the deduct-add or the omission rule (Rolph 1948). Under the latter they are simply omitted from total expenditures of all grantors. This yields for each level of government a measure of spending made directly for the benefit of the private sector, or what the Bureau of the Census calls direct expenditures. The focus here is on the provision of final services to consumers or intermediate services to business, regardless of whether the financial means came from the operating level of government or from outside sources. Under the deduct-add rule, in contrast, intergovernmental expenditures are recorded in the spending totals of grantors but then, in order to arrive at a nonduplicating total for all levels of government, intergovernmental revenues are deducted from the recorded expenditures of grantees. The focus here is on the expenditures made by each level of government that are financed by that same level, or what may be called own-financed expenditures. The changes that have occurred during the postwar period in both measures of relative fiscal importance are shown in table 9.11. For this purpose BOC measures of general expenditures are used because of their availability for all three levels of government throughout the postwar period. The first change of note, in direct general expenditure (DGE) shares, is the decline in the importance of the federal government as a provider of services to the private sector. Its share fell from 65 percent of total direct general expenditures in 1948 to one of 47 percent in 1976-77. These losses in relative importance were added more or less equally to the state and local DGE shares. As a financing agent, however, the federal government has remained supreme throughTable 9.11
Federal, State, and Local Percentage Shares of Direct General Expenditures and Own-Financed General Expenditures, Selected Years, 1948-77 Direct General Expenditures
Own-Financed General Expenditures
Years
Federal
State
Local
Federal
State
Local
1948 1950 1960 1965-66 1970-71 1975-76 1976-77
65 62 65 56 50 46 47
12 13 15 15 19 20 20
23 24 20 28 31 34 33
66 67 71 63 59 59 60
15 16 17 18 22 22 22
19 17 12 19 20 19 18
Sources: U.S. Bureau of Census, 1977 Census of Governments, vol. 6, Topical Studies, no. 4, Historical Statistics on Governmental Finances and Employment, tables 3, 5, and 6.
635
The Role of Government: Taxes, Transfers, and Spending
out the postwar period. Its share of own-financed general expenditures (OFGE) did vary from one year to another but never fell much below 60 percent. During the period, state governments steadily increased the relative importance of their financing role from 15 percent of OFGE in 1948 to 22 percent in 1976-77, while local governments stayed close to the 18 to 20 percent range. Three-level estimates of government receipts and expenditures on a NIPA basis have recently been made available for the 1959-76 period (Levin 1978). Intergovernmental shares for direct and own-financed expenditures, computed from these data, are shown in table 9.12. Some of the same trends show up for both types, but the conceptual and measurement differences between the two sources alter other trends. Federal dominance of direct spending does decline during the period but less rapidly than is shown in BOC data. In 1976 the federal share of direct expenditures was 57 percent on a NIPA basis but only 46-47 percent on a BOC basis. In both series the state share of direct expenditures rises by one-third between 1960 and 1976, but the local share rises by only one-eighth in NIPA data compared to a two-thirds increase in BOC measures. In the own-financed expenditure series the federal government leads the other two sectors by comparably wide margins, but the trends are different. In NIPA measures the federal share is 68 percent in both 1960 and 1976 but declines from the 66 to 71 percent range at the beginning of the period to 60 percent at the end in the BOC measures. The local share stays close to 18-20 percent throughout the period in BOC data (except for 1960), but falls from 17 to 14 percent in NIPA data. In both sets of measures the state share of own-financed expenditures rises during the postwar period. 9.3
Public Sector Functions
Three major changes in the functional structure of government expenditures have occurred during the postwar period: (1) domestic proTable 9.12
Federal, State, and Local Percentage Shares of NIPA Direct and Own-Financed Expenditures, Selected Years, 1960-76 Direct Expenditures
Own-Financed Expenditures
Year
Federal
State
Local
Federal
State
Local
1960 1965 1970 1975 1976
64 60 58 57 57
12 14 16 16 16
24 26 26 27 27
68 66 65 67 68
15 17 19 18 18
17 17 16 15 14
Source: Levin 1978, pp. 16-17.
636
George F. Break/George P. Shultz/Paul A. Samuelson
grams have gained significantly in relation to defense programs; (2) social security and welfare spending has risen rapidly; and (3) social investment expenditures in health, education, and other areas have also increased in relative importance, but less dramatically. There are a number of sources that could be used to document these trends. The basic statistical data used here are those given in the NIPA tables on "Government Expenditures by Type and Function" (table 3.14 in recent years). They were chosen because they provide a valuable cross-classification by government ends and means—dividing expenditures into twenty major functional classes and forty-three subclasses, all carried out by the four major economic methods shown earlier in table 9.2.10 Discussion of these basic data is again supplemented by reference to the fiscal analyses made in the Brookings Institution's Setting National Priorities series. Various measures of the postwar shift from defense to domestic spending, differing in their allocation of particular spending programs to the two broad categories, are readily available. Table 9.13 shows the Pechman-Hartman breakdown, which simply separates national defense budget outlays from all others. In their measures defense spending declines from 49 percent of total federal outlays in fiscal 1960 to 23 percent in 1978 and 1979. Schultze combines federal budget outlays for national defense and foreign affairs in his baseline series and classifies all others as domestic. In this treatment domestic programs rise from 7 to nearly 15 percent of nonrecession GNP between 1955 and 1977, while national security programs fall from 11 percent to 5 percent (table 9.14). A still broader definition of defense spending is used by the Advisory Commission on Intergovernmental Relations (ACIR). It includes national defense, international affairs and finance, space research and technology, and an allocated portion of net federal interest payments. In their tabulations federal domestic own-financed expenditures begin the postwar period in the 6 to 8 percent of GNP range (between 1949 and 1959) and rise to a 15-16 percentage plateau in the late 1970s (table 9.15). During the past quarter decade, then, government domestic programs have gained significantly with the structural shift away from defense spending, In the nature of the case, that shift could not continue indefinitely, and indeed President Carter's 1981 budget indicates that it may soon be stopped, or even reversed. Within the domestic sector itself, the largest growth in relative importance has occurred in education programs (mainly at the state and local level), and in social security and welfare services (mainly at the federal level). Table 9.16 provides the details. The NIPA tabulations used begin with 1952, but since that year was significantly influenced by the Korean War, 1955 is also given in table 9.16 as an alternative initial year for the identification of postwar
637
The Role of Government: Taxes, Transfers, and Spending
changes in functional shares. Whichever early year is taken, the large relative decline in national defense expenditures stands out. The other major fall in relative importance occurred in transportation programs, but in the state and local sector only. Education expenditures rose from 12 percent of total direct government expenditures in 1955 to 18 percent in 1978, from 36 to 38 percent of state-local direct expenditures, and from 0.6 to 2.7 percent of total federal expenditures over the same Table 9.13
Federal Budget Outlays as a Percentage of Total Outlays, by Major Category, Fiscal Years 1960-79 Nondefense
Grants in Aid to State and Local Governments0
Fiscal Year 8
Defense
Total
Payments for Individuals'5
1960 1961 1962 1963 1964 1965
49.0 47.7 45.9 45.0 43.5 40.1
51.0 52.3 54.1 55.0 56.5 59.9
24.8 26.5 25.4 25.7 25.1 25.7
7.5 6.9 6.4 6.9 6.9 7.2
18.7 18.9 22.3 22.4 24.5 27.0
7.6 7.3 7.4 7.7 8.6 9.2
1966 1967 1968 1969 1970
40.7 43.1 44.0 43.0 40.0
59.3 56.9 56.0 57.0 60.0
25.5 25.3 25.7 28.6 30.4
7.0 6.5 6.2 6.9 7.3
26.8 25.1 24.1 21.5 22.3
9.6 9.6 10.4 11.0 12.2
1971 1972 1973 1974 1975
35.9 33.0 30.2 28.8 26.2
64.1 67.0 69.8 71.2 73.8
35.3 36.8 38.8 41.2 43.7
7.0 6.7 7.0 8.0 7.1
21.8 23.5 24.0 22.0 23.0
13.3 14.8 16.9 16.1 15.3
1976 1977 1978 1979
^H
oq oo
« H N6 d
o
© *O ft t^
ft
H
00 t— VO *O f^l
pi d d
^
d ** d d d d
a •8 8
00
ft
I^I
< s t~- *>©
^' d
dodo
Nd
d -H
ft \o m M « O W Is;
2
o r-
rn oo v^ oo oo o »—i i—i ft rr, 00 t~»
ft
Q VO Xt
t"; —i *-?
G
S
B
O > X »u a < mH
1
vo
»-H
rn en
«
00
«
O
VO
vov^
^tfM^"'/^'^
vo©ododr~-
oc5t~»vovo'vo
vo
io ^* Ti-Tt
ON © ON ON c^ m'^-irivo'vd
^f oo ON ^ IH vo'r^r^r^ON
en *-* en en c^ ^ en ONONC5C>C4 r4r«^
qd dq coi o o dq od od od o o
© © q © © ©'©'©'©© © © © © ©
o o o o G o o ©' © o © © © © ©
© © ©
ON ON ON ON
ON ON ON ON
fS TJ- vo oo © irt l o w in « ON ON ON ON ON
i n vo vo ON ON
3
© © © P © ©
© ©
ONONONON
ON
ON
q © ©
»-5 6 6 o\
ON 0 0 0 0
vd>o»oio««t
o >»
c4c4rir4c>i
ONONOOOOON
a< D H
q O O O\
§1 C3
w-;vosq
6
qoo
H
ONOOOO
o
3-
•a
O
»H ON ON
r-J 1-1
ON
1^ \O
r-
'i © ©
< a
© 00
t/5
O
i—l
o c5
H
N
H
ON ON
vo vo t»j
o od
21
o\ oo
vc Tt q ^ to vdt^oo'odod
C-; t-» ON O VI ON »-< r4 cn co
« N N —i 3 .-5
i53&H
ppp p O © O O O pop pop p d c> d d d © o d © © o © © © © © o d ©d o o ooo o
vo vo vo ON O N O N
vot-ooON© vovovovor^
i-ir>oovo**oo H H O O 9 \ m N O
0
ca" "ca
'Zu 0
«b" "~100 00 vo" ON 1—1
1
60 3 tn O
© ON
ON r- CN "fr oo © vo# %! £ i cn Ci CN "fr t-^
1 I
»*
^ ^ ^s.1
/T\
#^\
^*-
r+\
X
7S .> »
|
25
11S
^ u 3g ft t 3 2 13 o « R C g 4,> s a .2 Mg -
o -a -a a 3
s S,g-S >
cn _
o 3 i- o
0(2
73
u '>
8£
60
3
O\~*©CN00r-;00ON ©^ CN en Zl vd vd ^H i-H ON
x -2 ,2 « 5 a u c .ts 3
og
II O cU
.9 (5 ^ o ca "X3 3 ea
& i••2 og cn
©
82 £
13
•S o
1 isS 8 8.9 § S, x•9 c
1!135
'S*S 3 c Jo 2
SB i
.9 c
Jg,S 13
X nfc.
2 «s
S ft S _
« .2 O
g -s 2 5 PH
§ §2 S V3^ ^ 2
C
*l
652
George F. Break/George P. Shultz/Paul A. Samuelson
"normal" income tax structure simply involve elimination of the present 60 percent exclusion of long-term capital gains, or would it also include full deductibility of capital losses from ordinary income, indexation of capital gains and losses for inflation, and the substitution of a full accrual
Index (1970 100) 400
350 Tax expenditures
300
250
200
150 Income tax revenue
100
50
1970
Fig. 9.3
71
72
73
74
75
J
I
76
77
78
79
80
Trends in tax expenditures and other measures of federal finances, 1970-80. Data from table 9.25.
653
The Role of Government: Taxes, Transfers, and Spending
Table 9.26
The Top Ten Federal Tax Expenditure Categories, Fiscal Year 1980 (Amounts in $ Billions)
Category11 1. 2. 3. 4. 5. 6. 7. 8.
Capital gains Investment tax credit State and local nonbusiness taxes Exclusion of pension contributions and earnings Medical expense exclusions and deductions Interest on home mortgages and consumer credit Charitable contributions Exclusion of social security and railroad retirement benefits 9. Interest on state and local debt 10. Excess of percentage over cost depletion; expensing of exploration and development costs
Estimated Revenue Loss: Individuals and Corporations 23.3 19.1 17.7 15.1 12.7 12.2 9.0 8.4 7.7 3.4
Source: Special Analyses (1979, pp. 207-11). a Constructed in some cases from separate items in the official tax expenditure list; addition of separate revenue loss estimates subject to the qualifications discussed in the text.
basis for the current realization basis of the tax? The answers given to these questions, which are likely to differ from one expert to another, would make a great deal of difference in the reported size of the capital gains tax expenditure, as indicated by a recent study of corporate capital gains and losses by Feldstein and Slemrod (1978). According to their calculations for 1973 the taxation of real corporate capital gains at ordinary tax rates with full deductibility for real capital losses would have raised only slightly more revenue, assuming no investor reactions to tax change, than did the existing tax law.15 According to this definition of the "normal" tax structure, then, virtually no capital gains tax expenditure was made in 1973.16 Even if all the individual tax expenditure items were, by some ideal standard, correctly defined and measured, further difficulties would be encountered in adding them together to obtain separate totals for particular functional areas or a grand total for the whole set, since the presence of important interactions among them would make the revenue loss from any one of them a function of the tax treatment of various others. The revenue to be gained from eliminating two tax expenditure items, then, may be either larger or smaller than the sum of their individual estimated costs.17 Official tabulations of tax expenditures, in fact, deliberately omit functional and grand totals. To expect people not to add together the individual items, however, is like expecting no one to climb Mount Everest. They will be added because they are there. What insights may be obtained from such exercises, however, are highly prob-
654
George F. Break/George P. Shultz/Paul A. Samuelson
lematical. For the moment it seems best to note the presence and development of federal tax expenditures but not to add them formally to any of the expenditure series discussed earlier. 9.6
Summary
This paper has scrutinized alternative measures of government expenditures and revenues, assessed their usefulness as indicators of postwar fiscal trends, and identified what appear to be the major structural changes that have occurred in this area during the past thirty years. Among these changes are the following: 1. The government sector is larger than it was at the beginning of the period, but in many of its dimensions it has been growing recently less rapidly than the economy as a whole. 2. The federal government's tax-transfer programs have grown rapidly, especially in the domestic program sector. 3. Defense spending has declined significantly, but that trend may be stopped, or reversed, soon. 4. Social insurance expenditures and the payroll taxes that finance them have been major growth components of the public sector. 5. The public sector's share of national output has not grown significantly since 1953, but state and local governments have replaced the federal government as the major partner in these activities. 6. Intergovernmental grants have grown rapidly, and the public sector has consequently become significantly more interdependent. 7. The state-local sector has become more centralized, especially in the financing of its major programs. 8. Federal grants made directly to local governments have become an important part of the intergovernmental picture and have converted traditional hierarchical relations into triangular ones. 9. The federal tax structure has become more homogeneous during the postwar period. Insurance trust programs are mainly financed by payroll taxes and the general fund relies heavily on individual and corporation income taxes. 10. State-local tax systems, in contrast, have become more diversified and more responsive to economic growth and inflation. 11. The property tax remains the dominant contributor to own-source local government revenues, but its position is considerably less secure than it was at the beginning of the period, and there are now wide variations in its relative use among different kinds and sizes of local governments. 12. Federal tax expenditures appear to have grown rapidly, but the significance of these developments cannot readily be discerned.
655
The Role of Government: Taxes, Transfers, and Spending
13. Strong inflationary pressures in recent years have not only complicated the measurement of fiscal trends, but they may also be causing important structural changes that are only beginning to appear on the scene. Extrapolation of past trends is always a dangerous game; it appears to be especially so at this time.
Notes 1. Table 3.18 in the NIPA accounts, published each year in the July issue of the Survey of Current Business, shows the relation between NIP A and BOC:GF measures of state and local government receipts and expenditures. 2. Even that measure can be questioned for its choice of the two terminal years used. In principle, one would like two years when the economy was at peacetime levels of full, or comparably high, employment. In practice, one must use single years that fall short of those requirements, averages of several years that may obscure important changes, or single years adjusted to estimate what peacetime full employment values would have been. The terminal years used in table 9.1, while not ideal, seem good enough to show the broad trends sought at this point. 3. See, for example, the discussion of the treatment of federal government sponsored enterprises and of the offsetting of receipts against expenditures for particular programs in the federal budget in the President's Commission on Budget Concepts (1967), pp. 187-95 and 245-76, respectively. 4. This was the term used in the first edition of A Study in Public Finance. In the second Pigou changed it to "real" expenditures and in the third to "non-transfer" expenditures. Of the three the most memorable and distinctive is surely the first (Pigou 1947, p. 19). 5. In the 1976 revisions the measurement of real factor inputs in the government sector was changed so as to distinguish, within the limits of data availability, between wage bill increases created by the hiring of better qualified workers or the promotion of employees on the basis of merit, which are interpreted as increases in the quality of government inputs, and wage bill increases resulting from general upward adjustments in the whole pay structure, which are not. Estimates of constant-dollar purchases from business were also improved by the use of new information on prices and the composition of the inputs. Survey of Current Business, Part I, January 1976, p. 22. 6. Schultze used a 5 percent rate as a matter of convenience but noted the use of a 4 or a 6 percent rate would have made little difference (1976, pp. 327-28). 7. Economic Report of the President 1979, pp. 72-76. 8. Business Week 1978, pp. 73-77; 1979, p. 26; the Internal Revenue's first attempt to study tax noncompliance comprehensively, Estimates of Income Unreported on Individual Income Tax Returns, was released in September 1979. 9. Special analyses (1980, pp. 8, 254). 10. Transfer and interest payments are combined in NIP A table 3.14. 11. Census publications do not provide the needed detail, but NIPA data for the state and local sector show that in 1977, for example, education, health, and hospital charges were 75 percent of the "nontax" category of total receipts. 12. State retail sales taxes were 2.8 percent of total tax revenues in 1948 and 5.8 percent in 1978. The corresponding shares of general tax revenues were 3 per-:
656
George F. Break/George P. Shultz/Paul A. Samuelson
cent in 1948 and 7.7 percent in 1978. In addition, local general sales taxes increased from 3 percent of general tax revenues in 1948 to 8 percent in 1978 (table 9.22). 13. Special analyses (1979, p. 183). 14. Ibid. The basic conception and its importance for policy analysis was developed by Stanley S. Surrey as assistant treasury secretary in the Johnson administration in 1967 and later (Surrey 1973; see also Feldstein 1975). 15. The amounts were $1,138 million from the 1973 tax law and $1,193 from the revised structure indicated (Feldstein and Slemrod 1978, p. 114). 16. All tax expenditure estimates are impact measures. That is, they take no account of the potential effects on tax revenues of taxpayer reactions to elimination of the particular tax expenditure item under study. In the situation under discussion here, as studies by Feldstein and his associates strongly suggest, any tightening of the capital gains tax rules, while retaining a realization basis, would significantly reduce capital asset sales with correspondingly important effects on federal income tax revenues (Feldstein, Slemrod, and Yitzhaki 1978; Feldstein and Yitzhaki 1978). 17. See for example, Special analyses (1979, pp. 189-93).
2. George P. Shultz The Comparative Advantage of Government No one can question that government's role in the postwar economy has grown tremendously, changed qualitatively, and has affected markedly virtually every aspect of economic activity. We all know that government is legitimate and necessary and that government is here to stay. But, along with other leading institutions in our society, its performance is now widely criticized and reactions to its size, power, and pervasiveness are increasingly sharp. The postwar surge of its spending, taxing, regulating, and judging has produced some important accomplishments, but also much to worry us. Not least of these worries is the uneasy and widespread feeling that the juggernaut may be out of control—powered by a dynamic of its own, unrelated to our broad concerns almost because of its close relation to our parochial concerns, with results that are as disagreeable for our allies and friends around the world as they are for us. Certain issues stand out; that illustrate problems brought about by the role that government has played in changing the postwar American economy. I will discuss five such issues in this commentary. Issue: Comparative advantage (and disadvantage) in the tasks that government undertakes: the need for limits. George P. Shultz is vice-chairman of the Bechtel group of companies and professor at the Graduate School of Business, Stanford University.
657
The Role of Government: Taxes, Transfers, and Spending
Even governments need to recognize that a given form of organization or aggregation of people cannot do everything. Competence is important and it demands specialization. But as the reach of government has extended more and more into our economic and private lives, government officials have been led more and more into areas where they have no comparative advantage and may even be out of their element entirely. Government increasingly has come to dominate the production of essential goods and services and their allocation to various uses, substituting a system of bureaucratic command and control for the incentives of private enterprise and the pulls and hauls of the marketplace. Private enterprises operating in a competitive market have a clear comparative advantage whenever the objective is efficiency in the use of resources, adaptation to variations in local and individual needs, or responsiveness to meet new issues and changed conditions. The superiority of the private market over governmental command and control of large sectors of the economy derives in part from its superiority in the essential tasks of collecting and evaluating information, of giving opportunity for the expression of individual tastes, and of driving producers to seek the lowest cost methods for transforming raw materials into goods that people want and value. In addition, important managerial distinctions may be drawn between government and private business that bear on their respective areas of comparative advantage. These distinctions start with the deliberately flat organization structure of the federal government, stemming from the very concept of checks and balances. The resulting disposition to delay has been compounded in recent years by the wide distribution of actionstopping power among Congress, the executive branch, the judiciary, and the regulatory agencies. Government action is crablike at best, with an overwhelming emphasis on criticism and on policy formulation as opposed to execution of concrete tasks. By contrast, the pyramidal structure of organization described in most textbooks does reasonably resemble the reality of business. A "doing" organization must be set up to force the decisiveness that gets action. One of the first lessons I learned in moving from government to business is that in business you must be very careful when you tell people who are working for you to do something, because the probability is high that they will do it. In government, no way! For, among other things, they don't necessarily consider themselves to be really working for you in the first place. This contrast between "debating" and "criticizing" organizations with their disposition to delay, and "doing" organizations with their spirit of action underlies the comparative disadvantage of government in managing important parts of the economy. And many of our economic problems today result from the large and increasing proportion of economic
658
George F. Break/George P. Shultz/Paul A. Samuelson
decisions being made through the political process rather than the market process. The problem is nowhere better or more tragically illustrated than in the field of energy. Decisions as to price, allocation of supplies, and siting of plants are based heavily on political rather than market considerations. Now the proposed bill, S.I246, if passed, would further extend the government's political intrusion into the allocation of capital within the energy industry. The inevitable result is that a potentially efficient system for producing and consuming energy becomes ensnarled by highvisibility politics, dominated by regional considerations, varying corporate interests and their different abilities to exert political influence, and, importantly, attempts to use the energy system as a means for distributing welfare benefits. By this time, everyone knows the result is a mess. Perhaps the situation is serious enough and the mess is obvious enough to allow the operation of Katz's law: "When things get bad enough, people will do even obvious and sensible things." If so, government should back off from its areas of comparative disadvantage and spend its time and the taxpayer's money in areas where it has special capabilities and responsibilities. In a field such as energy, these areas include seeing that externalities (e.g., the costs of dealing with pollutants) are reflected in the marketplace and insuring that the markets themselves are competitive. More generally, government has a clear comparative advantage in the raising and distributing of money. In the postwar period government has in fact become, in considerable measure, an income redistribution system. But to perform this function, government need not, as it has, get into the business of providing health, housing, and a host of other inkind services, where it operates at a comparative disadvantage. The feeling is widespread today that administration of these efforts is wasteful, unfair, and unwise—a feeling borne out by detailed analysis of the income maintenance system. But government's special responsibility must primarily be the provision of a framework of law and security for people pursuing their own objectives, and the development of a military capacity able to defend the country's vital interests. We all rely on government to perform well in these areas of comparative advantage and unique responsibility. Issue: Regulations and, even more, the uncertainties created by the processes of implementing them—a real wild card—inhibit thinking and actions geared to long-term objectives and requiring longterm capital commitments. Regulations and the regulatory process are receiving increasing attention these days for a number of very good reasons. The problems to
659
The Role of Government: Taxes, Transfers, and Spending
which government regulations are addressed are heavily publicized. Sometimes publicity is based on faulty analysis or on dramatization of "horror" stories, both of which invite political overreaction. Nevertheless, many real problems do exist. Government must particularly concern itself with areas where externalities are involved, such as the cases of air and water pollution, although a pricing approach (e.g., an effluent tax) rather than a command and control approach is frequently preferable on grounds of fairness and efficiency. At the same time, one experiment in deregulation, with airlines, is moderately successful and others should be tried, though they may not be. Certainly the time is long past when regulation of the railroads can be justified on the grounds that railroads possess a monopoly in the field of transportation, and there never was any economic justification for the regulation of trucking. Wide-ranging efforts are being made to estimate the costs of complying with regulation, with contributions coming from the academic, business, and governmental communities. Approximations like "$100 billion per year and growing," conservative in that they take into account only a part of the problem, increasingly force attention to the questions: What are the benefits? And are they really worth it? Important though it is to question the need for certain regulations and to estimate their costs as well as their benefits, it is even more essential to think through the long-term consequences of the extreme uncertainties inherent in the processes through which regulation is implemented. An individual project can be subject to a myriad of regulations administered by various levels and agencies of government with different jurisdictions and objectives. It often seems impossible to get a definitive decision, especially given the number of intervenors who have standing to interpose legal challenges at almost any stage of a project. It is worth noting that the Alaska Pipeline could only be built after Congress passed a law overriding all previous laws that were blocking its construction. And the proposed Energy Mobilization Board, still another level of bureaucracy, is based on the assumption that a supra-agency is necessary to cut through the maze of red tape if significant energy projects are to get under way. A well-publicized example of difficulties posed by the regulatory maze involved Sohio's efforts to move oil from the West Coast inland by pipeline. In January 1975 the company began the process of securing necessary permits and government approvals: a total of approximately 700 permits were required from about 140 local, state, federal, or private agencies. On 13 March 1979, fifty months later, the decision was reached to abandon the project. In the interim, Sohio had spent $50 million and managed to secure only 250 of the 700 permits required. When the oil company abandoned the project, it was spending at a rate of $1 million
660
George F. Break/George P. Shultz/Paul A. Samuelson
per month in the approval procedures. Governments regulated this project right out of existence. The volume of permits Sohio had to obtain and of government bodies before whom it had to appear suggest another aspect of the problem. Adam Smith once remarked that specialization increases with the size of the market. Perversely, the vast increase in regulation in recent years has been accompanied by a form of specialization that amounts to a "balkanization" of problems. A whole host of federal, state, and local agencies regulate various aspects of what to a business is one problem. The legitimate concern is not just a matter of the time involved to go to so many different places for answers. Action can be completely hung up by differences of view among those who represent regulatory interests that are deliberately insulated from each other by statute. A friend of mine once remarked that "whatever is not prohibited nowadays is required." I am forced to amend his statement to "whatever is prohibited may also be required." These regulatory uncertainties continue into the operations phase of any major undertaking, and they are having a devastating impact on major long-term undertakings. The proposition involved here is fairly obvious: The greater the uncertainty connected with future benefits from an investment, the more these benefits are discounted. The result surely is to skew the investment process into short-term undertakings and to discourage just those kinds of long-term efforts needed to make effective progress on such problems as energy. It is sometimes remarked that only the government can handle major undertakings with long-term consequences. That may well describe the world we now live in, but that unappealing situation is created not by the market, not by the inability of private enterprises to organize huge undertakings or by their unwillingness to assume risk. Rather it reflects the facts that government has injected unnecessary uncertainties and risks, including the risks of price and profit controls in the future, and that only government can use compulsion to raise capital for an unprofitable venture or one for which the wild card of regulatory uncertainty looms too large. The impending result: more government activity in areas of its comparative disadvantage. A far better course is to reduce regulatory uncertainty so that private capital can seek out the most promising ventures for the long term. Issue: High marginal rates of taxation at all income levels bring major distortions in economic activity and increasing resistance at the voting booth and in individual economic behavior. This problem is all too familiar for middle and high income earners. The distortions of economic activity involved in the avid search for tax shelters and the fact that relatively little revenue is collected at the high-
661
The Role of Government: Taxes, Transfers, and Spending
est marginal rates testify to their basic futility. The relentless way in which inflation projects middle income earners into ever-higher tax rate brackets has received increasing commentary, so that now the idea of "indexing" the tax system can almost be taken out of quotation marks. Unfortunately, even such a simple and basic change as indexing has not been made. Nevertheless, attention to and recognition of these undesirable consequences suggests that some action may well be in the offing. Less attention has been paid to the high marginal rates of taxation on the poor and to the fact that they, too, react predictably and negatively. Of course, they can't afford tax lawyers, but they have found effective ways to shelter income. Reliance on government transfer payments instead of employment is one available tax shelter for the poor. Work in the underground economy, where people are paid in kind or cash, not reported for tax or GNP purposes, is another. Unfortunately, neither the NBER nor anyone else has produced convincing evidence regarding the size and rate of growth of the underground economy. The more enthusiastic estimates range from 10 to 27 percent of the GNP ($200 to $500 billion) with recent growth at rates of from 20 to 40 percent per year. Though I doubt that the high end of these estimates can be taken seriously, this subject deserves much more attention. Intuitively, it is highly plausible that the poor will react to the high direct rates of taxation on earnings (in the form of withdrawal of benefits) and the high indirect taxes on spending by concealing earnings and acquiring goods and services so far as possible in ways that escape much or all indirect tax. Anecdotally, I have seen some astounding examples on a personal level—and not just confined to those in lower income brackets. The other day I noticed a judge insist on payment in cash for performing services at a wedding. The implications of this government-induced change in the postwar economy are important, if the phenomenon itself is important. A growing underground economy means that, even at the low end of the range mentioned above, the rate of increase in real GNP is being underestimated by one percentage point and levels of unemployment are being significantly overestimated. Such mistakes give an obvious inflationary bias to economic policy. But I wonder if a different and more powerful point is in the making. The electorate in eleven states has recently voted for greater control of spending or of tax rates at the state and local level, where control can be more direct than at the federal level; and thirty states have endorsed a constitutional amendment calling for a balanced federal budget. At the level of individual economic behavior another manifestation of this political reaction may well be the underground economy. If it is anywhere near as sizable as some estimates suggest, the implied tax revolt is very real indeed. As limits of government's overall size become more real and
662
George F. Break/George P. Shultz/Paul A. Samuelson
compelling, decisions about the composition of government activity become as difficult as they are crucial. Increasingly, the answer to "which?" may no longer be "both," even in capitol cities. Issue: How do we provide for an adequate defense when an already high rate of taxation and expenditure reflects government's major role as the redistributor of income? The numerical facts involved are well brought out in Professor Break's paper: Total government expenditures have risen from 21 to 36 percent of the GNP during the period 1948 through 1977. These estimates do not take account of off-budget finance or spending required of the private sector by government, both growth areas. Meanwhile, drawing from Professor Break's paper, "domestic programs rise from 7 to nearly 15 percent of nonrecession GNP between 1955 and 1977, while national security programs fall from 11 percent to 5 percent"; "the federal government's tax-transfer programs have grown rapidly, especially in the domestic program sector"; and "social insurance expenditures and the payroll taxes that finance them have been major growth components of the public sector." As is well known, the chief characteristic of government transfer programs is their "entitlement" nature, with people entitled to a payment based upon such characteristics as income, age, minority status, or place of residence. Sometimes, in fact, they are paid as a result of their ingenuity in beating the system. It is a misnomer to talk of a budget for these programs since the best that can be done is simply to estimate how heavy the drawings will be on the entitlements. With 46 percent of the families in the United States receiving a transfer payment of some kind, it is easy to see that this large and growing sector of the budget has considerable momentum behind it. I speak with some feeling as a former OMB director who, with scars and without success, tried to curtail school lunch spending on behalf of children of middle and upper income parents. If there is anything to the idea that taxpayers are in a rebellious frame of mind about paying for burgeoning government growth, then the momentum behind the redistributive functions of government can overwhelm our ability to finance an adequate defense. This internally generated threat to our national security deserves sober thought and decisive action. Some way must be found, at a minimum, to make the transfer payment system more internally efficient, as one approach to curbing its growth. In the end, though, the entitlements themselves must be subject to critical scrutiny. Issue: The escalating rate of inflation is one postwar change in the American economy in which government's role is central and about which it is all too easy to be pessimistic.
663
The Role of Government: Taxes, Transfers, and Spending
Without belaboring the whole gamut of budget, tax, regulatory, and other government actions that raise costs and the chronic monetary accommodation of rising prices, I will simply assert here that inflation, including our current roaring version, is rooted in government policy and behavior. However broad the agreement with this observation, the practical outcome seems to be—almost as though drawn toward it by a magnet—some form of wage and price controls. As these controls move into center stage, unwillingness to conform with them becomes conveniently tagged as the reason for inflation, and those unwilling to conform as the villains. This process of shifting blame from culprit to victim obscures the main point of government responsibility. Economic miseducation is given an added boost when prominent managements feel impelled to make public statements in support of such programs. The activities of OPEC and the political vulnerability of large oil companies offer apparently irresistible opportunities to shift political blame further. Such scapegoating may be good politics, but it is certainly lousy economics. Inflation has been with us long enough now and has become enough of a preoccupation that many question whether the problem can be dealt with at all. The answer is a clear "yes." Our own prior experience in the fifties and early sixties with relatively stable prices shows that it can be done. And today the experience of other countries has given us evidence that inflation is not an international disease. Even among tightly linked countries like those of the Common Market, rates of inflation vary tremendously (in 1978 the highest rate, in Italy, was over four times the lowest, in West Germany). We know what to do. Classical economic measures—disciplined fiscal and monetary action and a tax and regulatory environment conducive to capital formation and productivity—have worked for us in the past and work for others at present. The problem is not what to do but how to do it. The problem is to rearrange the political landscape so that the necessary is also the doable. The Bottom Line Political attitudes may be changing, with the public lowering its expectations about the ability of government to solve problems, insisting that legislators recognize limits to the tolerable level of taxation, give more attention to the importance of investment and productivity, and deal more effectively with high and rising rates of inflation. I hope.these changes are for real, in part because such developments would help government do better those things where it has a comparative advantage and where, as citizens, we count on exemplary performance. One prime objective involves the need in a stable and healthy society to serve the twin objectives of equity and efficiency. Clearly the system
664
George F. Break/George P. Shultz/Paul A. Samuelson
of markets and enterprise, driven as it is by competitive pressures, is the way to an efficient society. Beyond efficiency, the market system metes out a great measure of equity and it is a profound respecter of the importance of individual choice. Nevertheless, fairness demands attention to equality of opportunity and to access, at least on some minimum level, to essential goods and services. We have seen many changes sweep through our society, a much more heterogeneous one than most, and yet it has held together. I believe a measure of the credit for this achievement must go to those elements of equity provided through the political process. Transfer payments, with all their faults, are the principal vehicle for the political expression of equity. That equity arguments are all too often used as a guise to support narrow self-interest does not alter the basic appeal to the body politic of the "fair shake." Certainly a key problem for policy is to recognize the legitimacy of concern for the poor and the disadvantaged, but to avoid having the rhetoric of poverty become the servant of well-placed interests. Unfortunately, when this happens, as it does all too frequently, the systems for equity and efficiency become so entangled as to be almost indistinguishable. By the time our energy industry is transformed into a system for geographic and industrial redistribution of oil, let alone for redistribution of income, it is no wonder that so little progress is made toward solving the energy problem. This form of government effort to redistribute income is subverting the very processes that produce the income in the first place. Returning to the concept of government's comparative advantage, our system of income maintenance should be simplified drastically, concentrating on cash payments rather than the provision of in-kind benefits. These cash payments should become the principal vehicle through which the political process pursues the goal of equity. Other changes are as essential if the government role in the decades ahead is to reflect its comparative advantages and disadvantages. These changes call for a reversal of many postwar trends, for reduction and simplification in areas like taxes, spending, and regulation, and for reliance more on the use of market incentives to get the regulatory job done. Such changes imply a rearrangement of the political landscape since, in the end, government is a mirror of our aspirations, our understanding, ind our determination. The hope is, however, that we can follow the idea of comparative advantage: a less comprehensive government role can allow more concentration on areas of prime government responsibility, where first class performance is essential.
665
The Role of Government: Taxes, Transfers, and Spending
3. Paul A. Samuels on The Public Role in the Modern American Economy This is not the first time that groups like the NBER have taken a broad look at the cosmic future. Let us hope we are a bit luckier in the present exercise. One almost hesitates to mention the 1929 Recent Economic Trends, commissioned by the confident President Herbert Hoover and blessed by Wesley Clair Mitchell, our founder and patron saint, then at the apex of his scholarly career. That group of economists took a careful look at the United States economy and reported it to be in great shape with a sunny future ahead. That was in 1929! Then again I recall that, before World War II was over, a National Bureau group consisting of a Harvard statistician and a* Wall Street financier published a volume on the subject I am asked particularly to comment on today: the future state of the government finance. It was a sorry performance. It is easy to see in retrospect how woefully it underestimated the scale of post-1945 fiscal activity. But even at the time, this objective study reeked of wishful thinking and of editorializing in favor of the conservative views of its authors. I remember my old master Alvin Hansen commenting to me that no one alive would ever see a federal budget less than twice this volume's predicted numbers. And, as Hansen later explained to me when I asked him how he thought his prewar doctrine of secular stagnation had actually worked out in the postwar epoch: "Paul, my numbers for federal expenditure, fiscal deficits, and tax revenues—which were considered so outlandish in 1939 and 1944—turned out to be far short of the actual mark. Nature never got the chance to perform the needed experiment for us to know what would have happened if the postwar budget had been always in balance at a low level" (and, I may add in 1980, if the low birthrate had continued after 1939—the only trend anyone had a right to extrapolate in 1939). So, it is well that I as a commentator am chastened by the demonstrated complexity in forecasting the future and in understanding the present before it has become history. But it is also well that at least some of the scholars who have prepared the surveys that we are all to discuss should have been bold in their speculations and should have nominated theses for us to agree with or try to shoot down. It is part of the eclectic diversity of the National Bureau, preserved in each of its reincarnations, that its authors should differ in substance and style. Thus, Professor Mansfield has cautiously reported some of the available facts about Paul A. Samuelson is professor of economics at M.I.T.
666
George F. Break/George P. Shultz/Paul A. Samuelson
productivity and research, mentioned a few of the current hypotheses some have put forward to explain them, but has eschewed advancing a grand thesis of his own. Professor Easterlin, from the same university, has perceived the postwar movements in birthrates through the spectacles of his own self-generating every-other-generation cycle, giving his brainchild all the rope it can use. Professor Break, whose paper surveys my topic of government finance, has chosen to present the domestic facts in an analytical mode, so that at least our theories can know what it is they are purporting to explain. What I want to do today is to examine critically some broad views about government that people outside of economics have been hotly debating. Here is (what, prior to hearing some of the speakers at this conference, I thought to be) a caricature, almost a parody, of what most businessmen believe. In a lower keyed version, but still in essentially the same thesis, I suspect it is a view that the majority of college graduates would essentially subscribe to. The thesis follows: The Roosevelt New Deal brought in some needed reforms. But this last half century has witnessed an overshoot of government regulations, taxation, and deficit spending. The vigor of the market economy has thereby been sapped—just as it has been in so many of the mixed economies abroad. United States inflation, stagnation in productivity, class struggle, and popular unrest is the inevitable consequence of the cancerous growth of the public sector engineered by powerseeking bureaucrats and politicians. Britain provides an archetypical case to prove that the hand of government withers progress and efficiency, and fails to make good on the "equity" it promises. As well, a comparative survey of all the mixed economies will bear out the same perverse correlation between the usurpations of the public sector and shortfalls of economic performance—Switzerland versus Sweden, Japan and West Germany versus Italy and the United States, and so forth. Notice that I have included nothing in the above statement about the importance of limiting government for the sake of liberty itself. A Hayek, even if you could demonstrate to him a mixed economy where government planning, stabilization, and redistribution really worked well, would reject it in the same way he would reject a well-run jail. Such a view is still a minority view with the electorate, but where it does gain support from fellow travelers is to the degree that the actual "jails"—by which I mean the mixed economies as we know them—are not well run. Tasting Puddings What I wish to do here is to display that "respect for the facts" which Arthur Burns once proclaimed must be the National Bureau's watchword. Is all of the above thesis borne out by the available facts?
667
The Role of Government: Taxes, Transfers, and Spending
Is any of it? What is the cautious reading of experience on these controversial matters? These are not easy questions. Since time is scarce, let me reveal at the beginning that I do not think the caricature as stated is unequivocally supported by the historical record. That doesn't mean it's wrong. It might be correct. But a fair-minded jury is under no compulsion to swallow its contentions on the basis of the empirical observations available. Wishes of Bureaucrats Here is one part of it that I find farfetched. Bureaucrats would of course like to have their empires grow; and politicians do prefer, other things equal, to be elected rather than defeated. It does not follow from this that I am able to make sense about trends, and to make good predictions, by assuming that it is the desires and psyches of Washington inhabitants that I must look to in explaining actual political happenings. Social security is a good instance. As George Break observes, it has been one of the fastest growing elements of public expenditure and taxation. Those numerous clerks in Baltimore have been of least importance in the process. I have known most of the head actuaries in that program from the beginning. Their causal role has been, if not negligible, certainly minor. Indeed it was over their objections that so many of the evolving features have become dominant. Why then the growth? It was immanent from the beginning—once the national decision was made to introduce a general insurance scheme. Few of us had the imagination and courage to extrapolate what was immanent. But that is the usual story in these matters. My point is not that this has all been a beneficent thing. Franco Modigliani and Martin Feldstein may turn out to be right that the social security system is the cause of a reduced effective rate of saving and investing in the American economy. My point is that how Main Street and Congress feel about this matter, and not how civil servants do, is what has given us whatever it is we now have. My old teacher, Josef Schumpeter, tried to set forth a theory of public finance based on the realpolitik of getting elected. I welcome modern revivals of this seminal idea. But all theories of revealed preference must be subject to the check of comparison with empirical data. And the innuendo that it is the power wishes of government officials that explains the police state is not a hypothesis that stands up well to explain the complexity of facts that need explaining. Post Hoc, b u t . . . The middle third of the twentieth century goes into the record book as the era in which the tax share of the public sector soared. The final third, we can confidently predict, is not going to be able to show a sim-
668
George F. Break/George P. Shultz/Paul A. Samuelson
ilar acceleration. This is so, if only because of the nature of a fraction, which has to be bounded by one. But it is also so because, as the market sector shrinks, one can expect there will be a resistance and backlash rather like that we have begun to see in recent years. How has real GNP fared in this middle third of the century in which governments grew like a cancer? Would a Hayek have predicted in 1933 that the patient would show the debilitation of cancer? Would a Schumpeter in 1942 have written about "capitalism in an oxygen tent" on its march to socialism? Of course. And that is what I was taught at the University of Chicago was the likely future to look forward to after 1935. But when we turn to the real world, we see it has been a different story. Of course, the recoveries from the world depression consequent upon deficit financing in North America, Germany, and elsewhere in Europe are easy to understand in terms of short-term fluctuations. But what Schumpeter was writing about in Capitalism, Socialism and Democracy was the long pull. If he came back to Vienna, Bonn, and Cambridge today, he would be as surprised as that urbane mind could admit to, by what the Kuznetses and Denisons have measured to be the postwar miracles of growth by the mixed economy. Am I arguing that, because the public sector was burgeoning from 1932 to 1970, that is why world GNP outperformed the growth rates previously witnessed under the gales of creative capitalistic destruction? No. What I am precisely warning against in this commentary is such a facile attempt to read into the chaos of facts the theses you want to believe about them (theses which may even have important germs of truth in them). Thus, Switzerland and Sweden show almost identical paths of Kuznetsian progress. If I gave you their two time series blind, you couldn't tell them apart. More than that. It is a great mistake to think that Switzerland is a Walrasian economy and Sweden a totalitarian state. If you examine the long vector of attributes of these two, you will find them surprisingly alike; and also you will find some surprising reversals of the usual stereotypes. Debaters and lawyers are always trying to overstate their cases. I recall how, just after the mid-1940s, conservative friends used to point to Belgium and Holland. Belgium, they claimed was a market economy and it was prospering. Holland was allegedly a controlled economy and it was stagnating. If you inquired about the different degrees of bombing of the ports of Antwerp and Rotterdam, they lost patience with your pedantry. But of course in a few years, both economies showed marked departures from laissez-faire; and their relative growth rates showed no simple patterns of dominance. What is relevant to the present session is to look at the numbers Dr. Break has given for the United States and compare them with similar
669
The Role of Government: Taxes, Transfers, and Spending
numbers abroad. Everyone knows that Germany and France, to say nothing of the Low Countries and Scandinavia, have grown more in the postwar than has the United States. Is it then the case, as the above thesis would require, that these fast growing countries show a larger fraction for the market economy than we do? I have just had the occasion to prepare the eleventh edition of my elementary textbook Economics. Every four years I get reeducated on the world economy, and an economic historian could do worse—as Bob Gordon has indicated in footnoting his paper for this conference—than to use these successive revisions as a documentary source to chronicle both the change in events and in beliefs about them. What I found, when preparing a table of comparative shares of GNP that taxes take, was that Switzerland and the United States each tax about the same fraction of national income. That paragon of growth and the free market, West Germany, has a larger total tax fraction than the United States or the United Kingdom do. And Germany, unlike America or Israel, has little call to spend on national defense. The Netherlands and Sweden are two nations whose public sectors have leaped above half their GNPs. Has Providence punished them for this profligacy? Not yet. Their growth rates have for decades been exceeding our best performances. I happen to think that their future productivity trends will be adversely affected by this heavy load. But that thought of mine is not a National Budget thought: It is not a finding of statistical analysis or even a deducible lemma from a compelling model; but like so many of my best insights it is a Bayesian hunch that could never deserve the Mitchell-Burns imprimatur. If you match your hunches against mine, who is to be the referee to adjudicate between them? Even Britain cannot serve as the whipping youth for the determined empiricist. For all the talk about the "British sickness," the United Kingdom's government's fraction of GNP expended on goods and services has averaged out to less than those reported for the United States in Dr. Break's tables. And, just to confuse the parable, Britain's productivity trend in the third quarter of the century turns out to have surpassed that of the United States—just as growth rate in the United States production index has outperformed production growth in Switzerland and Germany in the 1970s. I've made my point: Only ideologues can see simple morals writ large in historical record. The facts tell their own story, but it is not the simple story that so many want to hear. Welfare and Mutual Reinsurance Thanks to earlier National Bureau authors, we have been reminded that conventional measures of product and productivity do not capture all the elements of welfare that the citizenry are concerned with. William
670
George F. Break/George P. Shultz/Paul A. Samuelson
Nordhaus and James Tobin constructed their rough Measure of Economic Welfare (MEW) to make clear that there are offsets to the reduction in productivity which may result from environmental pollution standards and from occupational safety regulations. My neighbors and I go to the polls and by majority vote make sure that if we should happen to be unemployed, or blind, or penuriously old, we shall still receive some minimum of income payments. In agreement with Alan Blinder's paper, even though the ordinary measures of income inequality—e.g., Gini coefficients of Lorenz curves, Pareto-curve parameters—show no strong trends for the last three decades, it is my observation that there has been a perceptible reduction in lifetime inequality. Fewer people do go to bed hungry in present-day America; and life is not so short, nasty, and brutish for the poor as I can remember it being in my youth. None of this is accomplished in a Pareto Optimal way. From the beginning of time such a state of thermodynamic efficiency has never been remotely approached. If economists were to wait for that day in which income redistributions are done in the Pareto Efficient way, they would wait forever. And society's members would wait with them. Economists are a minority, no more numerous than chiropractors. Noneconomists go whole hours without thinking about Pareto Optimality. It is noneconomists who constitute our clients. We are their not-soefficient servants. They are our not-so-clear-thinking masters. Once democracies decide to second-guess the outcome of the market, the programs take on a momentum of their own. When I was a young student of what was to come to be known as macroeconomics, we all took for granted that F.D.R.'s new expenditures on welfare and unemployment compensation would have to last only so long as the economy remained significantly below its full employment potential. After recovery was achieved, those expenditures would recede in the simple anticyclical manner. That was the naive expectation I shared. Of course it didn't happen. You might think that this was the result of "politics"—a reflection of the weakness in the voting system that tends to make it easier to expand the economy than to restrain and contract it. Well, you would be wrong in thinking so. There may well be such a political bias in the workings of the mixed economy. But what I came to realize belatedly in the late 1930s—and it came from the writings of Bill Haber of the University of Michigan, writings that did not appear in refereed proper economic journals—that once society decided that people should not fall below certain minimum levels of well-being and income, the total of the welfare load would grow and grow. And so it has, no longer to my surprise, these last forty years. My Worries I have reached the age to scold and nag. So I must not fail you. Although for the most part my own value judgments applaud the eco-
671
The Role of Government: Taxes, Transfers, and Spending
nomic trends that have been the trends of my times, my reason and experience with economic models leave me with a concern. Markets are more effective for many facets of economic activity than people have been able to make fiats and commands be. Any new nation freed from colonial bindings can give itself a socialist constitution and type out a crisp Five-Year Plan. But so often, we know from experience, these good intentions are not worth the paper they are written on. The mixed economy is mixed. That is its strength: to mobilize for human ends the mechanisms of the market and to police those mechanisms to see that they do not wander too far away from the desired common goals. The market can be a strong horse under us. But every horse has its limits. Those limits may not show up at once. A Sweden or Holland can for a time pile onto the horse ever greater relative loads. No one is wise enough to state exact limits beyond which the mechanism must begin to falter. But that doesn't mean limits are not there. The problem for the United States, I have come to think, is to move beyond our good intentions. Our challenge is to preserve the useful features of the market—as when we want whatever slack there is in the economy to put effective downward pressure on prices and wage costs. But that should not mean that we have to submit to all the thoughtless consequences of the market's solution. To paraphrase Alfred Marshall of ninety-five years ago, economists need to put their cool heads to the service of their warm hearts. And that's what the American economy itself needs urgently to do in the years ahead.
Summary of Discussion The discussion turned first to the redistributing role of government. Benjamin Friedman suggested that the tables on income redistribution through government in the Break paper understate its true extent. Government expenditures on goods and services also have a large redistributional component. Procurement policies are often targeted to achieve specific distributional aims. Even military spending has some of this character, as evidenced by the difficulty of removing military bases from some Congressional districts even when the bases are not justified on defense grounds. Friedman asserted that a realistic debate about government would be not about the level of public goods provision but rather about how much redistribution we want. Friedman expressed puzzlement about the failure to debate that issue squarely. Wilbur Cohen suggested in response that redistribution has never captured the imagination of the noneconomist, as it is antithetical to middle class and even populist values. Martin Feldstein emphasized that the net redistribution of in-
672
George F. Break/George P. Shultz/Paul A. Samuelson
come through government is far less than the gross redistribution, given the variety and often conflicting goals of redistributive programs. But since each program has negative incentive effects, the efficiency burden of the programs is related to the extent of gross, and not net, redistribution. In response to a question, Paul Samuelson reiterated that any inverse correlation between government spending as a proportion of income and the rate of economic growth, is not strong, and that part of any simple correlation is spurious. Since public goods generally have an income elasticity greater than one, wealthier (and presumably slower growing) countries devote a larger share of income to public goods. Milton Friedman declared that these correlations would in any event understate the true burden of government spending on economic welfare, since the income statistics give equal welfare weight to public and private spending. This is because government spending is valued at factor cost and not at market price. Herbert Giersch challenged Samuelson's comparison of United States and German manufacturing growth. The German manufacturing sector was overgrown in the 1960s because of an undervaluation of the DM exchange rate. It thus could have been expected to decline in the 1970s. While this happened with regard to employment, productivity growth accelerated. A comparison of productivity growth rates between the United States and Germany gave a picture completely different from Samuelson's comparison.
References Andrews, William D. 1972. Personal deductions in an ideal income tax. Harvard Law Review 86: 309-85. Baumol, William J. 1967. Macroeconomics of unbalanced growth: The anatomy of urban crisis. American Economic Review 54: 415-26. Boskin, Michael J. 1979. Some neglected economic factors behind recent tax and spending limitation movements. National Tax Journal 32 (supplement): 37-42. Break, George F. 1977. Social security as a tax. In The crisis in social security, ed. Michael J. Boskin, pp. 107-23. San Francisco: Institute for Contemporary Studies. . Forthcoming. Tax principles in a federal system. In Essays on tax policy, ed. Henry J. Aaron and Michael J. Boskin. Washington, D.C.: The Brookings Institution. Business Week. 1978. The fast growth of the underground economy (13 March), pp. 73-77.
673
The Role of Government: Taxes, Transfers, and Spending
. 1979. A new report expands the "irregular" economy (10 December), p. 26. Dubin, Elliot. 1977. 'The expanding public sector: Some contrary evidence'—A comment. National Tax Journal 30: 95. (The original article of this title by Beck, Morris). 1976. National Tax Journal 29 (March): pp. 15-21. Economic report of the president. 1979. Transmitted to the Congress in January. Washington: Government Printing Office. Eisner, Robert, and Nebhut, David H. 1979. An extended measure of government product: Preliminary results for the United States, 19461976. Paper presented at the Sixteenth General Conference of the International Association for Research in Income and Wealth, Portschach, Austria, August. Feldstein, Martin. 1975. The theory of tax expenditures. Discussion Paper no. 435. Harvard Institute of Economic Research, Harvard University. Feldstein, Martin, and Slemrod, Joel. 1978. Inflation and the excess taxation of capital gains on corporate stock. National Tax Journal 31: 107-18. Feldstein, Martin; Slemrod, Joel; and Yitzhaki, Shlomo. 1978. The effects of taxation on the selling of corporate stock and the realization of capital gains. NBER Working Paper no. 250. New York: National Bureau of Economic Research. Feldstein, Martin, and Yitzhaki, Shlomo. 1978. The effects of the capital gains tax on the selling and switching of common stock. Journal of Public Economics 9: 17-36. Hulten, Charles R. 1979. A solution to the problem of measuring public sector productivity. Working Paper no. 1124-06. Washington: The Urban Institute. Levin, David J. 1978. Receipts and expenditures of state governments and of local governments, 1959-76. Survey of Current Business vol. 58 (May), pp. 15-21. Manvel, Allen D. 1979. Tax expenditures continue to grow. Tax Notes 8 (19 February): 207. Musgrave, Richard A. 1959. The theory of public finance. New York: McGraw-Hill, chap. 9. Pechman, Joseph A., ed. 1979. Setting national priorities: The 1980 budget. Washington, D.C.: The Brookings Institution. Pechman, Joseph A., and Hartman, Robert W. 1979. The 1980 budget and the budget outlook. In Setting national priorities: The 1980 budget, ed. Joseph A. Pechman. Washington, D.C: The Brookings Institution. Perry, David B. 1979. 1979 international tax comparisons. Canadian Tax Journal 27: 212-18, using data from the latest edition of the
674
George F. Break/George P. Shultz/Paul A. Samuelson
Organization for Economic Co-operation and Development's Revenue statistics of OECD member countries. Perry, George L. 1970. Changing labor markets and inflation. Brookings papers on economic activity 3: 1970, pp. 411-41. Pigou, A. C. 1947. A study in public finance. 3d ed. rev. New York: Macmillan. President's Commission on Budget Concepts. 1967. Staff papers and other materials reviewed by the president's commission (October). Washington, D.C.: Government Printing Office. Rolph, Earl R. 1948. The concept of transfers in national income estimates. Quarterly Journal of Economics 62: 327-60. . 1954. The theory of fiscal economics. Berkeley and Los Angeles: University of California Press, chap. 4. Schultze, Charles L. 1976. Federal spending: Past, present, and future. In Setting national priorities: The next ten years, ed. Henry Owen and Charles L. Schultze. Washington, D.C.: The Brookings Institution. Shoup, Carl S. 1947. Principles of national income analysis. New York: Houghton-Mifflin, chap. 7. . 1969. Public finance. Chicago: Aldine, chap. 20. Special analyses. 1979. Budget of the United States government. Fiscal year 1980. Washington, D.C.: Government Printing Office, pp. 183— 93, 207-11, 225. . 1980. Budget of the United States government: Fiscal year 1981. Washington, D.C.: Government Printing Office. Stanbury, William T. 1973. Productivity and the measurement of the relative size of the public sector. Working Paper no. 189. Faculty of Commerce and Business Administration, University of British Columbia. Surrey, Stanley S. 1973. Pathways to tax reform. Cambridge: Harvard University Press. U.S. Department of Commerce, Bureau of Economic Analysis. Survey of Current Business. Various issues.