Economic Situation and Prospects for Maryland Agriculture
Bruce L. Gardner Robert Chase Michael Haigh Erik Lichtenberg Loretta Lynch Wesley Musser Doug Parker
September 2002
Center for Agricultural and Natural Resource Policy 2200 Symons Hall • University of Maryland • College Park, MD 20742 • Tel. (301) 405-0057 http://www.arec.umd.edu/Policycenter/ Douglas Parker, Director:
[email protected] • Liesl Koch, Administrator:
[email protected] POLICY ANALYSIS REPORT No. 02-01 Copyright © 2002 by Center for Agricultural and Natural Resource Policy
Table of Contents ACKNOWLEDGMENTS ........................................................................................................................ vii EXECUTIVE SUMMARY ....................................................................................................................... ix Situation and Trends .................................................................................................................................... ix Future Prospects............................................................................................................................................ x Policy Considerations ................................................................................................................................. xii INTRODUCTION....................................................................................................................................... 1 SITUATION AND TRENDS ..................................................................................................................... 3 Land in Farms ............................................................................................................................................... 3 Forested Land................................................................................................................................................ 5 Land Use Conversion Under Economic Development ................................................................................. 5 Farm Numbers ............................................................................................................................................ 10 Economics of Maryland Agriculture........................................................................................................... 11 Capital Gains on Farmland ................................................................................................................. 14 Farm Debt ............................................................................................................................................ 15 Off-Farm Income.................................................................................................................................. 18 Types and Structure of Farms .............................................................................................................. 19 Resource Base for Maryland Agriculture ................................................................................................... 24 Agriculture-Related Sectors........................................................................................................................ 28 OUTLOOK: KEY FACTORS IN THE FUTURE OF AGRICULTURE ........................................... 37 Implications for the Future.......................................................................................................................... 39 National Commodity Markets............................................................................................................... 39 Maryland’s Competitive Advantages ................................................................................................... 40 Future Land Conversion to Nonagricultural Uses............................................................................... 49 Environmental Pressures ..................................................................................................................... 51 Labor Constraints................................................................................................................................. 57 Loss of Respect for Agriculture ............................................................................................................ 57 Transportation Issues ........................................................................................................................... 58 Financial Constraints........................................................................................................................... 59
i
Overall Outlook .......................................................................................................................................... 60 POLICY ISSUES AND ALTERNATIVES ............................................................................................ 65 Overarching Issues in Policy ...................................................................................................................... 71 ANNEXES Annex I. Study Procedures ........................................................................................................................ 73 Annex II. Stakeholder Groups and Individuals Consulted......................................................................... 74 Annex III. Details of Selected Crop and Livestock Enterprise Budgets.................................................... 78 Annex IV. Federal Estate Taxes and Farms in Maryland .......................................................................... 88 Annex V. Foreign Farmworker Program ................................................................................................... 90 Annex VI. Details of Analysis of the Maryland Water Quality Improvement Act ................................... 91 Annex VII. Small Farms in Maryland ....................................................................................................... 93 REFERENCES.......................................................................................................................................... 97
ii
List of Tables Table 1.
Annual Percentage Change in Land in Farms.......................................................................... 3
Table 2.
Stock of Growing Timber in Maryland ................................................................................... 5
Table 3.
Land Use Change in Maryland, 1973-1997............................................................................. 6
Table 4.
Changes in Farmland, Three Regions of Maryland ................................................................. 8
Table 5.
Farm Acreage, Number of Farms, and Acres per Farm, 1949-1997 ..................................... 10
Table 6.
Revenue Sources and Cost Items, Maryland Farms .............................................................. 12
Table 7.
Balance Sheet of Maryland Farms......................................................................................... 16
Table 8.
Off-Farm Income by Source, 1999 ........................................................................................ 19
Table 9a.
Maryland Farms by Sales Category, 1997............................................................................. 21
Table 9b.
Maryland Farms by Acreage Category .................................................................................. 23
Table 10.
Farms with Irrigation in Maryland and United States, 1974-1997 ........................................ 25
Table 11.
Economic Multipliers in Maryland Agriculture .................................................................... 31
Table 12.
Maryland’s Leading Commodities by Cash Receipts, 2000.................................................. 31
Table 13.
Greenhouse and Nursery Products, Value of Maryland Production...................................... 32
Table 14.
Agricultural Product Intensities (Relative to the United States) in Maryland ....................... 33
Table 15.
Legal Organization of Farms in Maryland and United States, 1997 ..................................... 35
Table 16.
Maryland Farms by Crop Concentration, 1997 ..................................................................... 45
Table 17.
Maryland Specialized Livestock Farms, 1997....................................................................... 46
Table 18.
Maryland’s Federal Program Payments, 2000....................................................................... 66
ANNEXES Table A-1. Net Income per Acre for Field Crops in Maryland, 2001...................................................... 80 Table A-2. Net Income per Acre for Vegetable and Fruit Crops in Maryland, 2001 .............................. 81 Table A-3. Net Income from Selected Animal Enterprises in Maryland, 2001....................................... 82 Table A-4. 1996-2000 Average of 33 Maryland Dairy Farms................................................................. 83 Table A-5. Average Opportunity Costs and Net Income of 33 Dairy Farms........................................... 84 in Maryland, 1996-2000 Table A-6. Farm Broiler Production ........................................................................................................ 86
iii
Table A-7. Number of Farms by Value of Real Estate in Maryland, 1997 ............................................. 88 Table A-8. H-2A Farmworker Program in Maryland, 2000 and 2001, by Region .................................. 90 Table A-9. H-2A Farmworker Program in Maryland, 2000 and 2001, by Agricultural Sector............... 90 Table A-10. Classifications of Farms in Maryland by County Groups, 1997............................................ 94 Table A-11. Maryland Sales by Commodity and Farm Size, 1997 ........................................................... 95
iv
List of Figures Figure 1.
Land Use in Maryland, 1997 ................................................................................................... 4
Figure 2.
Agricultural Land Use, 1997: Maryland and Selected States .................................................. 4
Figure 3.
Maryland’s Land in Farms....................................................................................................... 7
Figure 4.
New Housing Units Authorized for Construction in Maryland, 1980-2000............................ 8
Figure 5.
Land in Farms: Three Types of Counties ................................................................................ 9
Figure 6.
Harvested Cropland, Three Types of Counties........................................................................ 9
Figure 7.
Average Size of Farms........................................................................................................... 11
Figure 8.
Maryland Agricultural Output, Income, and Government Payments .................................... 13
Figure 9.
Real Net Farm Income per Farm, 1980-2000 ........................................................................ 13
Figure 10.
Real Farmland Values in Maryland and United States, 1950-2000....................................... 15
Figure 11.
Farm Debt to Asset Ratio, 1970-2000 ................................................................................... 17
Figure 12.
1999 Net Farm Income and Off-Farm Income for U.S. and Selected States......................... 19
Figure 13.
Share of Maryland Farms and Market Value of Agricultural Products Sold, by Sales Category, 1997............................................................ 20
Figure 14.
Concentration of Acreage ...................................................................................................... 22
Figure 15.
Corn and Soybean Yields per Harvested Acre ...................................................................... 24
Figure 16.
Maryland Farms and Agricultural Employment, 1969-1999................................................. 26
Figure 17.
Hired Labor on Maryland Farms ........................................................................................... 27
Figure 18.
Average Earnings of Hired Farm and Nonfarm Workers in Maryland ................................. 27
Figure 19.
Employment in Maryland Agricultural Supplies and Services, 1988-2000 .......................... 29
Figure 20.
Maryland Farms Growing Selected Commodities................................................................. 34
Figure 21.
Farm Operators’ Average Age............................................................................................... 38
Figure 22
Total Factor Productivity Indexes.......................................................................................... 41
Figure 23.
Corn Yields in Maryland and United States, 1965-2000 ....................................................... 42
v
Figure 24.
Soybean Yields in Maryland and United States, 1965-2000 ................................................. 43
Figure 25.
Grain Prices Received by Farmers, Maryland Minus U.S. Average ..................................... 43
Figure 26.
Cash Rental Rates for Cropland............................................................................................. 44
Figure 26a. Maryland Acreage Harvested by Crop .................................................................................. 46 Figure 27.
Maryland’s Milk Production and Prices ................................................................................ 47
Figure 28.
Hay Yields in Maryland and United States, 1965-2000 ........................................................ 48
Figure 29.
Projected Maryland Land Use in 2020 .................................................................................. 49
Figure 30.
Population Density on Non-Agricultural Acres in Maryland ................................................ 51
Figure 31.
Percentage of Total U.S. Grain Exports Through the Port of Baltimore ............................... 58
Figure 32.
Projected Farm Numbers by Type of County ........................................................................ 61
Figure 33.
Projected Land in Farms by Type of County......................................................................... 61
Figure 34
Harvested Cropland, Maryland Counties............................................................................... 62
Figure 35.
Government Payments per Farm, 1980-2000 ........................................................................ 66
vi
ACKNOWLEDGMENTS This report was commissioned in early 2000 by the Maryland Department of Agriculture (MDA), and carried out at the Center for Agricultural and Natural Resource Policy in the University of Maryland’s Agricultural and Resource Economics Department. MDA financed the project, including funding the position of Robert Chase as a researcher during 2000-01. We thank Secretary Hagner Mister and his staff, especially Pat McMillan, for their continuing interest and support. The College of Agriculture and Natural Resources at the University of Maryland also provided resources for the effort, and we thank Dean Thomas A. Fretz for his support. We also thank the MidAtlantic Farm Credit cooperative for providing data relevant to the financial situation of Maryland farm enterprises. Contributors to the study included Robert Chase, Michael Haigh, Erik Lichtenberg, Loretta Lynch, Dale Johnson, Wesley Musser, and Doug Parker, with technical and editorial assistance from Liesl Koch, Janet Carpenter, Uddin Hellal, and Valerie Mueller, and with Bruce Gardner as overall project leader. Robert Chase devoted full time to this project during his term as visiting researcher in the Department of Agricultural and Resource Economics from September 2000 to September 2001. The others on the team are faculty, graduate students, or staff members of the Agricultural and Resource Economics Department. The study team is responsible for all errors or omissions, and the findings and interpretations are those of the authors and are not positions of the Maryland Department of Agriculture or of the College of Agriculture and Natural Resources.
vii
viii
EXECUTIVE SUMMARY Situation and Trends Maryland’s farm numbers and land in farms are declining, and in the most suburbanized counties commercial agriculture is particularly at risk. Even in the more rural parts of the state the prospect of continuing conversion of farmland to nonagricultural uses has raised concerns about the future. These concerns are amplified by increased regulation of farming and potentially eroding support for policies needed to keep agriculture commercially viable. The costs of farming in this situation, along with the historically weak markets for the major crop and livestock products, raise the issue of the economic sustainability of commercial agriculture in Maryland. But at the same time there are a number of positive elements and opportunities that help counter these concerns. A summary of the main negative and positive elements of the situation are as follows: Indicators of problems: # Many farms have gone out of business in recent years, especially notable in hog and dairy production. Acreage of some commodities, notably vegetables for processing, has declined substantially, and tobacco is on the verge of disappearance. # The age of farm operators has been rising for two decades, and the average Maryland farm operator is now over 54 years old – indicating the importance of a flow of new replacement farmers. # Small-scale and part-time farming is increasing as a fraction of the state’s farms, and the majority of these operations have expenses greater than receipts. This suggests an eroding base for commercially viable agriculture in the state as a whole. # Farmland continues to be lost to suburban development at a rate that threatens the maintenance of a critical mass of agricultural activity in some areas of the state. # Public perception of farming appears to have shifted toward seeing agriculture as a threat to water quality and other environmental values, and this is reflected in policies that are imposing increasing regulatory burdens on farmers.1 Positive indicators: # Farming remains a viable way of life for thousands of people, and agriculture remains a major factor in Maryland’s economy, the single biggest factor in the economy of
1
Most notably, agricultural activity has been associated with nitrogen and phosphorus runoff that is held responsible for declines in water quality in the Chesapeake Bay and its tributaries.
ix
many areas of the state.2 And, since 1990 the rates of loss of farm numbers and farmland have moderated from the losses of earlier decades. # The incomes of farm operator households in Maryland are on average favorable as compared to other states.3 For small and part-time farms, this is a consequence of off-farm income sources. For larger commercial farms, income from farming keeps the average operation economically viable. Commercial agriculture in Maryland, in comparison with neighboring states or the United States as a whole, is actually doing quite well in the face of difficult market conditions, by maintaining productivity growth, controlling costs, and by initiating shifts to market opportunities that have been relatively favorable compared to the traditional bulk farm commodities. # For both small and large operations, the relatively high value of farmland owned is a source of asset value, despite the barriers posed for those who wish to enter farming or add to their land ownership. Maryland farms have lower debt/asset ratios than are typical in other states, and the net worth of the average farm at the beginning of 2000 was $501,000 in Maryland as compared to $429,000 for the U.S. as a whole, despite the smaller average size of Maryland’s farms. # At both state and federal levels, policies have recently been enacted, and amplified in the 2002 farm bill, that are aimed at preserving land in farming, assisting farmers in environmental stewardship, and providing support for commodity producers to offset currently low prices. Future Prospects Above and beyond statistics indicating declining economic health of Maryland and U.S. agriculture in recent years, many farmers and others closely connected with agriculture have expressed a lack of confidence that current national, state, and local policies are adequate to address agriculture’s problems. Our meetings with stakeholder groups and individuals indicate two basic sources of such worries. The first is that the already fragile economic viability of many Maryland farm operations will be subject to further economic stress from low returns and rising costs. The second, a broader concern that leads to pessimism about whether the necessary steps will be taken to keep people involved with and investing in agriculture, is that agriculture is underappreciated by the nonfarm population, including the predominant tenor of local and state government.
2
The farming sector and its related industries (e.g., agricultural inputs and services and food processing) accounted for about $5 billion (3 percent) of the Maryland gross state product in 1999 and employed 62,700 people (12,400 farm operators, 5,900 farm laborers, and 44,300 in farm input and service supply and agricultural processing). These contributions are not declining over time, even though the share of the state’s economic activity accounted for by agriculture is declining in Maryland as in other states because non-agricultural sectors are growing faster. 3 In 2000, Maryland’s average net income per farm, estimated at $33,000 by USDA’s Economic Research Service, was well above not only Pennsylvania and Virginia, but exceeded the US average substantially and was even well ahead of Iowa’s $27,000 despite the larger average farm size there. Moreover, Maryland’s relative economic success was not just a matter of 2000 being exceptional. Since 1980 the trend rate of growth of net income per farm has been higher in Maryland than in neighboring states and the U.S. as a whole.
x
Further risks arise from the possibility that the declines in farms and farm acreage may, over the next 20 years, go so far as to seriously impair the economic health of nonmetropolitan areas of the state. For example, if the grain-broiler economy of the Shore begins to decline, might that generate an accelerating downward economic cycle as the land or production base falls below some critical level needed to sustain the industry at an efficient scale? And, even if the nonfarm population’s view of agriculture is more positive than pessimistic views suppose, that is not sufficient to guarantee policies that will translate to an improved economic situation for traditional, commercially based agriculture. The nonfarm public may be equally happy to see 300 acres devoted to several small recreational horse farms as to a working dairy farm; but many in agriculture would see the conversion from the latter to the former as a substantial social and economic loss. Similarly, increased uses of land for environmental protection purposes is what the public desires, but in many instances land is thereby removed from traditional commercial crop use and hence squeezes commercial agriculture further. Particular problems arise for crop producers who must rent land beyond the acreage they own in order to attain an economically viable scale of operation. In order to project the likely future evolution of Maryland agriculture, in terms of farm numbers, land in farms, and value added to the state’s economy, it is important to understand the reasons underlying recent trends. The reasons are economic. That is, land disappears from farming, and farm operators leave agriculture and are not replaced by a new generation of farmers because the economic rewards from farming are less than the rewards from alternative nonagricultural uses of people’s land and labor. The question is then, what forces lie behind the decreased economic opportunities in farming as compared to nonagricultural pursuits? Explanatory factors that surfaced in our interviews and reviews of studies carried out on the agricultural economy of other states and the U.S. as a whole are: # # # # # #
weak markets for traditional commodities, causing declining prices limitations and constraints on alternative marketing opportunities development pressures causing land conversion to nonfarm uses environmental regulations and programs labor constraints other costs hindering Maryland’s competitive advantage
Each of these factors are discussed in detail in the body of the report that follows. A complication is that Maryland’s farms are very heterogeneous, not only with respect to size of operation and other individual characteristics of farm enterprises, but also in facing very different problems in different regions of the state. For purposes of our analysis, three geographic regions are distinguished, based on degree of urbanization of counties (using U.S. Department of Commerce criteria for metro areas): # Central metropolitan counties have the largest populations and are found along the Baltimore-Washington, DC axis (Anne Arundel, Baltimore, Howard, Montgomery, and Prince George’s);
xi
# Other metropolitan counties located a greater distance from the BaltimoreWashington, DC axis (Allegany, Calvert, Carroll, Cecil, Charles, Frederick, Harford, Queen Anne’s, and Washington); # Non-metropolitan counties located on the Eastern Shore and southern and western Maryland (Caroline, Dorchester, Garrett, Kent, St. Mary’s, Somerset, Talbot, Wicomico, and Worcester). Overall, farms in the large metropolitan counties collectively produce only 10 percent of Maryland’s farm output (measured in terms of market value), while farms in the other metropolitan and non-metropolitan areas contribute about 32 percent and 58 percent, respectively. While the majority of farms are small in all regions,4 the share of all farms is higher in the two metropolitan regions (89 percent in large metro; and 80 percent in other metro) compared with the non-metropolitan region (62 percent). Residential-lifestyle farms (operators relying mainly on an off-farm occupation) and retirement farms5 predominate within the metropolitan counties. The large number of small, retired, and residential farms in the metropolitan areas indicates a different type of agriculture than the traditional commercial farms. Many differences in trends between Maryland and the U.S. as a whole are largely a matter of Maryland being a highly urbanized state, but the difference is not a matter of the rate of overall population growth crowding out farming. Maryland’s population is growing at almost exactly the rate of the U.S. as a whole, faster than Pennsylvania’s and slower than Virginia’s. The loss of farmland is more specifically tied to the diffusion of residences and associated businesses through the formerly rural areas of metro-area counties, i.e., suburban sprawl. Since 1980 the annual rate of decline of land in farms in the central metro counties has been 2.1 percent, while in the rest of the state the rate of decline is less than 1 percent annually. Stakeholders interviewed for this report, even on the nonmetropolitan Eastern Shore, almost uniformly saw suburban sprawl as the number 1 or 2 threat to the future of Maryland agriculture. This reflects the fact that only in Talbot and Worcester counties has the rate of decline of land in farms since 1980 been as slow as the 0.5 percent rate of the U.S. as a whole. Moreover, the prevailing concern is not just because of the extent of land converted to date, but also because the nonfarm residents who move into farming areas too often tend to be inhospitable to the necessities of commercial agriculture. Moreover, as farms become separated by developments and their numbers within any given area decrease, product marketing and farm service supply become more difficult and costly. Yet the rate of loss of farms and farmland in the state as a whole has so far proceeded at a sufficiently slow rate that the tide may still be stemmed before irreparable economic damage is done. Policy Considerations In view of the overall success with which Maryland’s farmers have confronted the many economic threats that have appeared over the last two decades, and the evidence that producers 4 5
In this report we define small farms as those with sales of less than $100,000 annually. These terms are used as defined by the Economic Research Service of USDA.
xii
are already adapting to the changing market and policy-driven demands placed upon them, our baseline projection for the next decade is for continued decline, but only at a relatively slow and manageable rate.6 We expect further loss of about 40,000 acres of farmland and 200 to 400 farms by 2010. We do not expect an economic crunch that would cause a general wipeout of remaining farms, or that would cause severe economic hardship or losses for the farms that remain. But the future of agriculture is at risk in Maryland because of uncertainties surrounding many of the factors we have been discussing. In part, events will depend upon climatic and market forces which no one can predict or control for a decade-long future. Most importantly, what happens will also depend on local, state, and national policies that impact agriculture. An issue that affects every region of the state is agriculture’s effect on the environment, and environmental regulations in place or on the horizon that raise costs and reduce the competitiveness of Maryland farms. Local, state, and federal policies have embodied the view that agriculture’s large land base and intensive, high-yield crop production, as well as regional concentration of animal production, pose risks of significant negative effects on water and air quality. The nutrient management requirements created by the Maryland Water Quality Improvement Act of 1998 (WQIA) are expected to affect both animal operations and crop growers. However, neither data nor reports of stakeholder groups provided evidence of significant effects that would hasten the decline of Maryland agriculture. A problem created by the regulatory situation, which goes beyond environmental problems to labor management issues (such as provision of housing and other facilities needed to meet state and federal standards) and permits needed to undertake many improvements such as irrigation or drainage projects, is a perception that the state is decreasingly friendly to agriculture and farmers. This encourages retirements and other exits from farming, and discourages new entrants. It creates a climate that furthers the current tendency to depreciate the capital stock in agriculture and to avoid new investment. To remain economically viable in the future, substantial investment is essential on Maryland farms to make the commodity and market-niche adjustments necessary to stay on the frontier of new production technology and marketing opportunities. A number of specific policies will be important but it is necessary first to confront a general division of opinion that prevails among those whom we consulted in preparing this report. One general view is that the best focal point for state-level and perhaps even national policy is a set of land preservation and conservation programs. Policies in these areas offer the most promise for maintaining land in farms while gaining support of the nonfarm population by promoting environmental goals and maintaining the scenic vistas that make rural Maryland so outstandingly attractive to all who dwell or visit. A counter-view is that these programs will accomplish little or nothing in the way of preserving agriculture as a commercial activity supporting traditional family farms. For that, what must be attained are economic conditions that enable returns to farming that will attract new entrants to farming, induce new investment, and encourage established farmers not to abandon their existing operations. The purest statement of this position is that if farming were made economically viable, farmland preservation programs would be unnecessary even in the central metro counties. 6
By “baseline,” is meant commodity markets rebounding modestly from the current lows as USDA’s long-term commodity price baselines project, and commodity and regulatory policies that essentially continue what has been in place since 1996, as reinforced by the 2002 farm legislation enacted in May 2002.
xiii
This bifurcation of views reflects the fact that urbanization is a two-edged sword for farmers. On the one hand, urbanization impinges upon farmers, making the farming enterprise more costly and difficult. Development pressures raise the price of land; reducing the economic return to farming and increasing the potential gains by switching land to nonfarm uses. On the other hand, higher land values can provide security for loans or funds for retirement. Residential expansion has also created conflict between farm operations and residential amenities in many communities. At the same time, urbanization provides opportunities for agricultural enterprises to take advantage of nearby urban markets by altering their marketing and/or changing product mixes. Prospects for off-farm employment also increase with urbanization. A policy issue that arises with respect to improving the economic viability of farming is the extent to which that end can be promoted through nationwide commodity programs. Currently, Maryland farmers receive commodity program payments that amount to about 20 percent of net farm income, focused on about half of Maryland’s producers. In order to appreciably improve the economic viability of Maryland producers significantly enough to keep their land in farming, it would take at least a doubling or tripling of current outlays, and even that would not be enough to make agricultural use of land in the central metro counties competitive with development alternatives. Some in the 2002 farm bill debate argued that a shift of emphasis to spending several billion dollars on conservation/environmental programs would serve Maryland and other Eastern farmers better than current commodity programs. A problem however is that farmers’ receipts of such funds would be tied to costly new undertakings by farmers, while current programs pay them for doing just what they are already doing anyway. On the other hand, the nonfarm population sees more of a benefit from the conservation/environment approach and is therefore more likely so support the necessary government spending over the long term. Nonetheless, it remains the case that the net gain to farmers per dollar spent on farm programs is substantially larger for current commodity programs than would be the case for conservation/environmental programs. Moreover, the hard truth is that Maryland farmers have shared as little in conservation program dollars as in commodity program dollars. In 2000, for example, Maryland accounted for 0.8 percent of the nation’s agricultural output but received only 0.3 percent of FAIR Act (production flexibility contract and loan deficiency) payments, and received only 0.2 percent of Conservation Reserve Program payments. The relatively large role of non-program commodities in Maryland means that our state is relatively disadvantaged in federal programs. Budget studies as well as recent trends indicate that our most promising future lies with nonprogram crops, including niche activities that embody substantial services beyond those of just growing the crops. However, it is important to recognize that all specialty crops, vegetables, orchards, and nursery/greenhouse crops together utilize only about 75,000 acres, while grains and soybeans occupy about 1.2 million acres. Thus, no conceivable expansion of the former set of commodities can serve to keep Maryland’s current cropland in agriculture. The traditionally grown grain and soybean crops will remain crucial. This basic agriculture, centered on the Eastern Shore, has grown symbiotically with the broiler industry and each is necessary to the other. Maryland’s grain growers are arguably placed in a better long-term economic position by the substantial premiums over Corn Belt grain prices that the demand for chicken feed creates
xiv
than by any conceivable price support program. So state-level policies that can promote the continued viability of broiler production in Maryland are arguably the most important agricultural policies the state can implement. For all the preceding reasons it is not realistic to look to national level policies to improve the long-term outlook for Maryland agriculture. What can the state government reasonably do? The general thrust that appears most promising is to undertake public investments and foster private investments that will advance the state’s comparative advantages and create new ones. Every state – including Maryland – across the country supports value-added agriculture in some fashion. The programs offered relate to the types of agriculture in each state, with state-grown product promotion and labeling programs being the most popular. Agricultural marketing assistance could be used to more effectively exploit alternative marketing channels. Export promotion has been utilized by many state agricultural departments, but this approach is relatively dubious for Maryland, apart from broilers, because Maryland is typically a grain importing area. Maryland has been effective in facilitating the development of farmers’ markets. But further issues could be explored specifically related to the barriers of increased participation in direct marketing and value-added agricultural activities. For instance, small scale farmers and food processors need assistance in complying with the panoply of food safety, labor, and environmental regulations at the federal, state, and local levels. Maryland has been a national leader in enacting farmland preservation programs including conservation easements, purchase of agricultural easement programs, right-to-farm law, and differential assessments. At the local level, Maryland jurisdictions have enacted programs centered on comprehensive planning, right-to-farm ordinances, and transfer of development rights programs. Given the overarching goal of ensuring the survival of the agricultural economy by preserving productive farmland, specific goals for these programs have included: maximizing the number of preserved acres; preserving productive farms; preserving farms most threatened by development; and preserving large blocks of land. While our research indicates that these programs have had some significant effects, much could still be done to improve participation in state and local agricultural land preservation programs and to provide a more effective use of existing resources available to purchase agricultural land easements. Another issue in farmland preservation is creating a stronger linkage among the various farmland protection, natural resource, and agricultural economic development programs in areas where the future of farmland is threatened. Some counties – in particular, those with established offices of agricultural economic development – are well on their way towards fostering such a linkage. The benefits relative to the costs of these policies remain to be established. Farm labor supply needs are persistent to farm employers and complicated by the unpredictable nature of agricultural production. Currently, foreign workers can be employed temporarily in agriculture under the H-2A provisions of the Immigration and Nationality Act. However, there are a number of limiting factors – cumbersome lead time for employers, lack of certified housing, administrative pressures – that could be corrected by increased funding and Federal legislative changes. A state program to assist with development of worker housing may
xv
facilitate the use of this program. The state could also usefully provide broader services to farmers in assisting them through the labyrinth of employer requirements and regulations. In summary, there are many areas in which state as well as federal policy could assist in promoting a prosperous agriculture that contributes to Maryland’s future economic vigor and quality of life. It is noteworthy that the most promising policies are not huge departures from current directions, but rather intensification of what is working and pulling back from what is not. If Maryland’s agricultural economy and policies were to continue on their current path, our projections suggest that that the rapid rates of loss of farm and forest resources of past decades will not return over the next ten to twenty years, although some segments of agriculture are at risk. Further losses of farmland will occur, as is inevitable as population continues to grow and affluence expands with its attendant demands for more living space for the average household. But these losses will continue to be manageable, at least for the immediate future.
xvi
ECONOMIC SITUATION AND PROSPECTS FOR MARYLAND AGRICULTURE
1
ECONOMIC SITUATION AND PROSPECTS FOR MARYLAND AGRICULTURE INTRODUCTION The future of agriculture in Maryland is clouded by a number of factors, many of them associated with the location of much of the state in a zone of rapid suburban development and with the emergence of environmental issues involving water quality in the Chesapeake Bay watershed. Some trends of recent years are concrete sources of concern. Maryland’s farm numbers and land in farms have been declining throughout the post-World War II period. The age of farm operators has been rising for two decades, and the average Maryland farm operator is now over 54 years old – indicating that a continuing flow of new replacement farmers will be needed to prevent an acceleration of declining numbers. Commercial agriculture has been hit hard for many commodities – notably a big decline in processing vegetables in earlier decades and more recently tobacco; and smaller-scale dairy farming is in difficult circumstances.7 In the suburban counties of the Baltimore-Washington corridor, it is questionable whether commercial agricultural production of traditional commodities will have a significant future. Yet in most areas of the state, and for many commodities, Maryland agriculture continues to be competitive with other parts of the country, and farming remains a viable way of life for thousands of people. Agriculture remains a major factor in Maryland’s economy, the single biggest factor in the economy of some areas of the state. A question that has to be faced by all concerned with the future of Maryland, in terms of both economic prosperity and quality of life, is whether agriculture’s large and varied contributions to Maryland’s economy and environment can be sustained. And, what can be done to help ensure the future economic health of the sector? Above and beyond statistics indicating risks to the economic health of Maryland agriculture in recent years, many farmers and others closely connected with agriculture have expressed concern about the future and a lack of confidence that current national, state, and local policies are adequate to address current problems. Our meetings with stakeholder groups and individuals indicate two basic sources of such worries. The first is that the already fragile economic viability of many Maryland farm operations will be subject to further economic stress from low returns and rising costs. The second, a broader concern that leads to pessimism about whether the necessary steps will be taken to keep people involved with and investing in agriculture, is that agriculture is underappreciated by the nonfarm population, including the predominant tenor of local and state government. This report addresses the issues in three sections: first, a review of the facts about the current situation and trends in Maryland agriculture, placed in the context of developments over time and in comparison to U.S. agriculture as a whole; second, explanation of these facts and trends, and implications for a baseline projection of the future of Maryland agriculture; and third, discussion of policy issues and alternatives for promoting agriculture and helping farmers cope with economic pressures and burdens that threaten the future economic viability of the sector. 7
More than three-fifths of Maryland’s tobacco farmers agreed to stop growing tobacco in return for state payments in 2000/2001; by 2002 more than 80 percent of the tobacco crop is expected to be gone.
1
2
SITUATION AND TRENDS Land in Farms Maryland has 2.15 million acres of farmland, over one-third of the state’s land area. Fifty years ago, over half of the state’s land area was used for farming. Maryland’s trend toward a greatly reduced land share in agriculture is similar to that of other states in the Mid-Atlantic region, all of which are seeing farming decline substantially faster than in the United States as a whole. Table 1 shows annual percentage changes in land in farms for 1959-1997, separated into two sub-periods: the most recent decade covered by Census data (1987-87), and the preceding three decades. The rate of decline is slower everywhere in the latest ten-year period than it was earlier. But Maryland lost farmland at rate faster than neighboring states in 1987-97, which was not generally the case in earlier decades. Maryland now ranks fifth among all states in percentage of land that is developed. An estimated 1.24 million acres of Maryland’s land area are defined by the Natural Resources Conservation Service (NRCS) of the U.S. Department of Agriculture (USDA) as “developed” for purposes of residential, industrial, and commercial use, amounting to 16 percent of the state’s area. About four times this much land area remains rural (Figure 1). Nearly three-fourths of Maryland’s agricultural land is cropland, with the remainder divided between pastureland, woodland, and other (e.g., houses and barns, lots, ponds, roads, and wasteland). Compared to neighboring states, except Delaware, Maryland has a higher share of farmland in crops (Figure 2). Table 1. Annual Percentage Change in Land in Farms Maryland Delaware New Jersey New York Pennsylvania Virginia U.S.
1959-1987 -1.31% -0.81% -1.55% -1.68% -1.47% -1.48% -0.51%
1987-97 -1.06% -0.48% -0.72% -1.49% -0.93% -0.53% -0.49%
Source: U.S. Census of Agriculture
3
Federal land, rural 2% Water areas 21%
Non-federal land, rural 61%
Non-federal land, developed 16%
Figure 1. Land Use in Maryland, 1997 Source: USDA, Natural Resources Conservation Service. Natural Resources Inventory, 2000. Connecticut Delaware MARYLAND
Massachusetts Cropland
New Jersey
Woodland New York
Pastureland Other land
North Carolina
Pennsylvania Virginia United States 0%
10%
20%
30%
40%
50%
60%
70%
80%
Figure 2. Agricultural Land Use, 1997: Maryland and Selected States Source: USDA, National Agricultural Statistics Service, 1997 Census of Agriculture
4
90%
100%
Forested Land About 40 percent (2.4 million acres) of Maryland’s land area is forested, and not on farms. In addition, in 1997 336,000 acres were in woodlots on farms. The percentage of forested land is high by overall U.S. standards but relatively low for the Northeast and Mid-Atlantic states. As estimated by the Northeastern Forest Research Station, Maryland’s forested area declined by 3 percent between 1986 and 1999, a rate of loss of 6,000 acres per year. The Forest Inventory Analysis of the Northeastern Forest Research Station estimated that during 1976-86 Maryland’s forests generated an average growth of 565 million board feet of sawtimber per year, of which 338 million board feet on average was removed (harvested or lost in land clearing). By 1999, the average annual growth of sawtimber had declined to 429 million board feet, and removals had declined to 273 million board feet. Thus the economically important aspect of the state’s forests has been declining faster than the state’s forested area. It is noteworthy also that of the removal in 1999, 63 percent was attributable to harvesting of continuing forests, while 37 percent was associated with land clearing. The total stock of growing timber, including trees smaller than suitable for sawtimber, has been declining at a slower rate, and the rate has a perhaps unexpected regional dimension within the state, as Table 2 shows. The stock of trees is declining at an almost negligible rate in the most urbanized counties. Table 2. Stock of Growing Timber in Maryland
Metro Counties Fringe Counties* Nonmetro Counties* State
million board feet 1986 1999 3503 3441 7601 7072 6805 5649 17910 16162
Change -62 -529 -1157 -1748
Annual % Change -0.1% -0.5% -1.3% -0.8%
Source: Northeastern Forest Experiment Station * Data for Kent (nonmetro) and Queen Anne’s (fringe) counties were unavailable separately. The combined figure has been included here as part of the fringe county total. The counties in each category are listed below.
Land Use Conversion Under Economic Development To place the declines in both farmland and forestland in a perspective that will help understand the causal factors in play, consider the conversion of land among various uses, ending with commercial and housing development. Over time, Maryland’s largely forested area at first settlement has been cleared for both agriculture and development. The long-term trend is essentially a pattern of conversion to urban uses. Dispersed development has resulted in agricultural and forestland being consumed for new homes, commercial and industrial development, and transportation infrastructure at alarming rates. Between 1973 and 1997, 376,600 acres of Maryland’s agricultural and forestland were converted to urban land uses; twothirds of this land was converted to low-density residential development (Table 3).
5
Table 3. Land Use Change in Maryland, 1973-1997 1973
1973
1997
1997
Land Use Category
Total acres
Percent of land total
Total acres
Percent of land total
Resource lands, total
5,469,957
87.7%
5,097,880
81.6%
Agricultural land
2,424,536
38.9%
2,237,409
35.8%
Forestland
2,781,454
44.6%
2,592,026
41.5%
263,968
4.2%
268,445
4.3%
Urban development, total
769,648
12.3%
1,145,927
18.4%
Low density residential
241,061
3.9%
489,539
7.8%
Medium/high residential
268,748
4.3%
357,339
5.7%
Commercial/industrial/transport
112,917
1.8%
144,363
2.3%
Institutional/open
146,922
2.4%
154,686
2.5%
6,239,605
100.0%
6,243,807
100.0%
Other resource land
Total land
Source: Maryland Department of Planning, 2001
Of the converted land, an estimated 187,100 acres came from farmland (about 8 percent of Maryland’s agricultural land in 1973) and 189,400 acres came from forestland (about 7 percent of Maryland’s forestland in 1973). Thus Maryland’s 2.42 million acres of agricultural land in 1973 had decreased to 2.24 million acres by 1997.8 The rate of loss, 7,800 acres per year, is considerably less than the average loss of 65,000 acres per year between 1945 and 1973. Within the period since 1973, the highest rate of loss of agricultural acres was between 1985 and 1990, years of high population and economic growth.9 Agricultural land was lost at a rate of 15,750 acres per year during this period, a high rate but still less than in the 1945-73 period. The rate of conversion to development decreased to 7,100 acres per year between 1990 and 1997. The overall trend in land in farms is shown in Figure 3. The slowdown in loss of farmland in recent years raises the question whether the loss of agricultural land is mainly a problem of the past, and of less concern for the future. The slower rate of conversion in recent years might suggest that. However, an alternative possibility is that conversion has slowed only because so little remains to convert in many parts of the state. To 8
Note that the Census of Agriculture data noted earlier and plotted in Figure 3 are different – 2.15 million instead of 2.24 million estimated by the Maryland Department of Planning. One source of difference is that some land for agricultural purposes is located on places that do not qualify as farms under the Census definition. Another problem is that the Census misses some farms. At the national level, the 1997 Census counted 1.97 million farms while USDA’s official tally is 2.19 million. In this report we use Department of Planning data when comparing land in agriculture to land in non-agricultural uses, and Census of Agriculture data when making comparisons of land use over long time periods and for different crops. 9 Population grew at an average annual rate of 1.7 percent while jobs increased at an average annual rate of 3.5 percent.
6
4,500,000 4,000,000
Acres of Farmland
3,500,000 3,000,000 2,500,000 2,000,000 1,500,000 1,000,000 500,000 0
1945
1950
1955
1960
1965
1970
1975
1980
1985
1990
1995
2000
2005
Figure 3. Maryland’s Land in Farms Source: Census of Agriculture
address this issue we need to look separately at regions within Maryland. Consider three kinds of counties: (a) those within the direct influence of metropolitan growth, including Anne Arundel, Baltimore, Howard, Montgomery, and Prince George’s; (b) “fringe metro” counties on the edges of metropolitan growth, including Allegany, Calvert, Carroll, Cecil, Charles, Frederick, Harford, Queen Anne’s, Washington; and (c) nonmetro counties, including Caroline, Dorchester, Garrett, Kent, Somerset, St. Mary’s, Talbot, Wicomico, and Worcester. The five most metropolitan counties account for about three-fourths of Maryland’s total population of 5.38 million people (in 2001) and economic activity (3.11 million jobs in 2000). Over the last three decades, urbanization pressures within these large metropolitan counties have added over 750,000 people and 1 million jobs. In the metro fringe group of counties, population has nearly doubled over the last thirty years and the job base has more than doubled. Moreover, while housing activity was trending downward in the most metropolitan counties, annual housing permits have more than doubled in the metropolitan fringe counties since 1980, and have increased 24 percent in just the last four years, 1997-2001 (Figure 4). Table 4 shows the annual changes in land in farms in the three regions during two periods: 1987-97, the decade previous to the latest Census of Agriculture, and for historical perspective the nearly three decades before that following the 1959 Census of Agriculture. It is true that in the category (a) counties, essentially the Baltimore-Washington corridor, the average loss of farm acreage was lower in the last ten-year period shown, even though the percentage loss was higher. So the story that loss of farmland slowed only because there was less farmland to lose applies to some extent. However, in the fringe metro counties, the loss of farmland was lower in 1987-97 in both acreage and percentage terms. In the nonmetro counties the rate of loss is consistent at just under one percent per year.
7
35,000
Housing Units Authorized
30,000 25,000 20,000 15,000 10,000 5,000 0 1980
1983
1986
Metro
1989
1992
1995
Fringe metro
1998
2001
Non-metro
Figure 4. New Housing Units Authorized for Construction in Maryland, 1980-2000 Source: Maryland Department of Planning
Table 4. Changes in Farmland, Three Regions of Maryland
(a) large metro counties (b) fringe metro counties (c) non-metro counties
1959-87 acres per year -9,534 -17,442 -10,886
1959-87 % per year -2.00% -1.36% -0.96%
1987-97 acres per year -7,979 -7,448 -8,749
1987-97 % per year -2.55% -0.73% -0.93%
Figure 5 shows the decline of farm acreage over time for each region. Even if the rate of loss is lower in recent years, the trend toward a declining farmland base is evident in every type of county. However, the situation with respect to cropland harvested is different, as shown in Figure 6. The trend declines are much less pronounced in all but the large metro counties. The greater decrease in total farmland than in cropland indicates that grassland and woodlots decreased more than cropland. That suggests higher economic returns to cropland, so that cropland is less likely to be converted to urban and other uses than other farmland. The increase in cropland in the 1970s ran counter to the long-term decreases. This increase was due to higher grain and wheat prices during this period. With higher prices, land was converted from other uses, which would not have been profitable with lower prices in previous and subsequent periods. These trends indicate that land in crops is responsive to national agricultural prices; long-term trends in cropland can be reversed with high enough prices. However, these 1970s prices depended on an unsustainable commodity boom.
8
2,000,000 1,800,000 1,600,000 1,400,000
Acres
1,200,000
large metro other metro
1,000,000
non-metro
800,000 600,000 400,000 200,000 0 1949
1954
1959
1964
1969
1974
1978
1982
1987
1992
1997
Figure 5. Land in Farms: Three Types of Counties Source: Census of Agriculture
800,000
700,000
600,000
Acres
500,000
large metro other metro
400,000
non-metro 300,000
200,000
100,000
0 1945
1955
1965
1975
1985
Figure 6. Harvested Cropland, Three Types of Counties Source: Census of Agriculture
9
1995
Farm Numbers The importance of agriculture depends not just on having land devoted to agriculture, but even more on the farming activities that take place on that land. Maryland has 12,400 farms producing more than 150 different crops and livestock products. Farms vary widely in economic activity and environmental impact per acre, from low-value, low-impact farming such as growing hay, to highvalue, high-impact enterprises such as concentrated animal feeding operations. USDA’s count of farm numbers depends on how a farm is defined, and this is a matter of controversy. The current definition, in use since 1974, defines a farm as a place from which $1,000 or more of farm products are sold or normally would be sold. This definition includes many farm operations that are commercially negligible and incapable of generating a living. Nonetheless, small farms are the means of keeping a substantial amount of land area in agriculture, and should not be neglected. Table 5 shows the trends in farm numbers, land in farms, and average farm size in Maryland as compared to the United States as a whole. In the period between 1949 and 2001, Maryland lost 48 percent of its land in farms, and since 1987 Maryland has lost 12 percent of the farmland that remained in that year. The comparable percentage losses for the U.S. as a whole are 19 percent and 2 percent. The fact that land in farms has gone out of agriculture at a more rapid pace in Maryland than in the U.S., while the difference in the rates of attrition of farm numbers is smaller, implies that Maryland’s average farm size has increased less rapidly than that of the Table 5. Farm Acreage, Number of Farms, and Acres per Farm, 1949-1997 Maryland
United States
Year
Number of Farms
Land in Farms (1,000 acres)
Average Farm Size (acres)
Number of Farms (1,000 farms)
Land in Farms (1,000 acres)
Average Farm Size (acres)
1949
36,107
4,056
112
5,388
1,161,420
216
1954
32,500
3,897
120
4,782
1,158,192
242
1959
25,122
3,457
138
3,711
1,123,508
303
1964
20,760
3,181
153
3,155
1,110,187
352
1969
17,181
2,803
163
2,730
1,062,893
389
1974
15,163
2,634
174
2,314
1,017,030
440
1978
15,540
2,614
168
2,258
1,014,777
449
1982
16,183
2,558
158
2,241
986,797
440
1987
14,776
2,397
162
2,088
964,471
462
1992
13,037
2,223
171
2,116
978,500
464
1997
12,500
2,200
176
2,190
956,000
436
2000
12,400
2,100
169
2,157
941,200
436
Source: U.S. Census of Agriculture data, except 1997 and 2000, which are USDA’s official farm count (which add farms estimated to have been missed by the Census).
10
nation as a whole, as Table 5 shows. Maryland’s farms have always been smaller than the U.S. average, and the difference has widened in recent years. Even in the eight least metropolitan counties of Maryland, group (c) as defined earlier, average farm size in 1997 was 229 acres, less than half the U.S. average. Farm size in Maryland has grown in a way similar to neighboring states, as Figure 7 shows. All the Northeastern and Mid-Atlantic states have smaller farms than the U.S. on average. Over the last two decades the average size of Maryland’s farms has grown faster than farms in these other states. 250
200
Maryland
150 acres
New Jersey New York Pennsylvania 100
Virginia
50
0 1945 1950 1955 1960 1965 1970 1975 1980 1985 1990 1995 2000
Figure 7. Average Size of Farms Source: Census of Agriculture
Economics of Maryland Agriculture Changes in land in farms, farm numbers, and farm size reflect the economic realities that farmers have to deal with. Farming has to generate returns that warrant continuation in agricultural production rather than turning to outside sources of earnings and renting out or selling the land. And, if agriculture is to flourish in the future, the expected returns to farming have to be sufficient to repay the costs of investment to maintain and improve the capital stock and to adopt new technologies that emerge. Table 6 provides data on the value of farm output, the estimated costs of major inputs, and capital consumption (depreciation) for 1990 and 2000. Figure 8 shows the total value of output and net farm income as estimated by the Economic Research Service of USDA. Figure 9 uses
11
Table 6. Revenue Sources and Cost Items, Maryland Farms 1990 2000 (thousand dollars) 550,015 659,843 825,192 841,101 173,518 250,057 12,321 12,606 23,000 33,080 59,883 108,074 78,314 96,297 -173,518 -250,057
Revenue Sources: Final crop output Final animal output Services and forestry Machine hire and custom work Forest products sold Other farm income Gross imputed rental value of farm dwellings Inventory and other adjustments Direct government payments
17,386
88,470
Costs: Manufactured inputs and services bought Fertilizers and lime Pesticides Petroleum fuel and oils Electricity Repair and maintenance of capital items Machine hire and custom work Marketing, storage, and transportation expenses Contract labor Miscellaneous expenses Motor vehicle registration and licensing fees Property taxes
228,601 63,256 30,624 34,181 17,299 67,334 15,907 70,003 4,162 139,105 2,390 34,307
283,729 63,020 43,453 41,350 21,508 87,134 27,264 59,793 4,775 197,525 2,512 37,184
Capital consumption Hired labor Net rent paid for leased land Interest payments
145,513 93,093 29,021 84,851
139,451 122,701 30,377 82,963
Total of Costs
976,406
1,130,341
Source: U.S. Department of Agriculture, Economic Research Service
the same data for a longer time period, and to adjust for inflation deflates the dollar values to give estimates of real income. Figure 9 shows real net income per farm in Maryland, and for comparison also shows Virginia, Pennsylvania, and the U.S. as a whole. By this measure Maryland farms are doing well compared to other states, both in trend and recent levels. This is especially notable given that Maryland’s farms are only half the size of U.S. farm on average in terms of acreage, pointing to higher value-added per acre in Maryland agriculture. However, the national trends are not favorable in that net farm income has been stagnant throughout the country in recent years.
12
600,000
1,800,000 1,600,000
400,000
1,200,000 1,000,000
300,000
(right scale)
800,000
200,000
600,000
$ thousands
$ thousands
500,000
(left scale)
1,400,000
400,000 100,000
(right scale)
200,000 0
0 1990
1991
1992
1993
1994
1995
1996
1997
1998
1999
2000
Value of Output Direct Government payments Net farm income
Figure 8. Maryland Agricultural Output, Income, and Government Payments Source: USDA, ERS
$40,000
Constant $96
$30,000
$20,000
$10,000
$0 1980
1985
Maryland
1990
Pennsylvania
1995
Virginia
2000
United States
Figure 9. Real Net Farm Income per Farm, 1980-2000 Source: USDA, ERS, and authors’ calculations
It is also important to note that $30,000 in net farm income indicates only a modest return to investment in agriculture. The average Maryland farm in 2000 had an estimated net worth of
13
$545,000. A return of 4 percent on this investment would be $21,800, leaving less than $10,000 return to the farm operator’s and family labor. 10 Several complications have to be addressed in order to obtain a comprehensive and accurate picture of the economic situation. First, farmland is a valuable asset that has grown significantly in value over time, and this reduces the necessity for current returns to cover the costs of ownership of farmland. Second, debt held by many farmers, especially younger farmers or those who have recently expanded or modernized their operations, complicates the story. Third, offfarm income earned by most farm households adds another source of capital and funds for living expenses. Fourth, there are important differences between the situations of farms of different kinds, most notably between large, full-time farming operations and small part-time farms. Fifth, the role of government programs, particularly the federal commodity support programs. These complications will each be addressed in this section except the matter of government programs, which will be discussed in the policy section later. Capital Gains on Farmland Figure 10 shows the value of an average acre of farmland in Maryland and the United States as a whole. The dollar values are “real” in the sense that they are deflated by the overall price level (the GDP deflator) so that the increases shown are not the result of inflation reducing the real value of a dollar. So when the price of land doubles in Figure 10, this means not just that an acre of land sells for twice as much, but that an acre of land buys twice as much of other goods and services in the economy. In Maryland as in the U.S. as a whole, farmland values rose steadily through the 1950s and 1960s, accelerated in 1975-1982, and then crashed in the farm crisis of the 1980s. Since 1990 a small upward trend in real land prices of about one percent per year has resumed. Overall, Maryland’s land prices have increased at a more rapid pace than in the nation as a whole. Maryland farmland sold for a little less than twice the U.S. average price per acre in 1950, but well over three times the U.S. average price in 2000. Maryland’s high farmland values bring both good news and bad news for the economic viability of agriculture. The good news is that the increases in value compensate in part for the low current-income returns to farming, making agriculture more economically feasible than it would otherwise be. Providers of agricultural loans are happier to continue financing and farmers can see gains that, even if not currently available for consumption or investment, will provide the basis for income in retirement. On the other hand, the increasing land values may reflect not so much agricultural prospects for farm acreage as development potential. The market is sending signals that Maryland’s land is becoming less competitive for use in agriculture as compared to development. This is apparent not only in the land conversion data that have already been presented, but also in the fact that 10
The U.S. and state-level income and net worth data in this report are estimates made by the Economic Research Service of USDA, and are mostly available on their Website, http://www.ers.usda.gov. The net income estimate has already subtracted out a capital consumption (depreciation) allowance and property taxes, so the 4 percent would truly be a net return after depreciation (and after property taxes but not income taxes).
14
$4,500
$4,000
Real dollars ($96)/acre
$3,500
$3,000
United States
$2,500
Maryland
$2,000
$1,500
$1,000
$500
$0 1950
1955
1960
1965
1970
1975
1980
1985
1990
1995
2000
Figure 10. Real Farmland Values in Maryland and United States, 1950-2000 Source: Census of Agriculture
while Maryland’s sales value of land is high relative to Midwestern farmland, the rental value of Maryland’s farmland is substantially lower on average (for details see Figure 26 below). So it is not the value of land in farming that makes Maryland’s farmland exceptionally valuable. This is not a promising situation for the future of agriculture. Farm Debt To place Maryland’s farm assets and debts in perspective, Table 7 shows details of both, with net worth (or equity) derived as assets minus debts. Maryland farms have over a billion dollars in debt, two-thirds of it borrowed against real estate. But the ratio of farm debt to assets remains low, fluctuating around an average level of about 15 in recent years, slightly below the debt/asset ratio of all U.S. farms (Figure 11). These averages do not convey the problems that some heavily indebted farm operations encounter because many debt-free farms are averaged in with others that have debts so high relative to assets that their financial viability is in question. The Economic Research Service of USDA has constructed indicators of financial stress covering farms ranging from those having insufficient cash flow to those who are facing imminent bankruptcy. In the farm crisis of the mid-1980s almost 1 in 7 U.S. commercial farms were estimated by USDA to be under severe financial stress. Since that time asset values have increased and farmers have been more 15
Table 7. Balance Sheet of Maryland Farms Thousand Dollars
Dollars Per Farm
7,899,247
637,036
6,674,009
538,227
Livestock and poultry
222,274
17,925
Machinery and motor vehicles
553,537
44,640
Crops
100,122
8,074
37,581
3,031
311,724
25,139
1,134,068
91,457
661,279
53,329
326,837
26,358
15,057
1,214
161,706
13,041
24,435
1,971
133,243
10,745
472,789
38,128
206,607
16,662
USDA, Farm Service Agency
14,305
1,154
Commercial banks
58,557
4,722
193,320
15,590
6,765,179
545,579
Farm assets Real estate
Purchased inputs Financial Farm debt Real estate Farm Credit System Farm Service Agency Commercial banks Life insurance companies Individuals and others Non real estate USDA, Farm Credit System
Individuals and others Equity Ratio Debt/equity
16.8
Debt/assets
14.4
Source: USDA, Economic Research Service
cautious in taking on debt. In Maryland, the incidence of financial stress was less than in the U.S. as a whole because land values did not decline as much as in the Midwest, and farmers’ income sources tend to be more diversified. In Maryland as in the country as a whole, the quality of farm balance sheets improved in the 1990s. Even after the poor crop years of the late 1990s, financial problems are not evident in the state-aggregate data.
16
25
20
Percent
15
10
5
0 1970
1975
1980
1985 United States
1990
1995
2000
Maryland
Figure 11. Farm Debt to Asset Ratio, 1970-2000 Source: USDA, Economic Research Service
The question remains however of the size of the minority of farms that are in financial trouble. Farms go out of business each year, some of them because of foreclosure or looming insolvency. Comprehensive data to address this issue are not available, but for purposes of this study the MidAtlantic Farm Credit cooperative provided summary data for farms in their portfolio of loans in Maryland that provide some evidence of problems. In financial data for 2,858 farms that have borrowed from MidAtlantic Farm Credit, their ratios of debt to assets are as follows: ratio of debts/assets
number of farms
greater than 1 0.75-1.0 0.50-0.75 0.25-0.50 0.0-0.25
21 160 514 1098 1044
Only 21 farms, less than one percent of the total, have recorded total liabilities in excess of their assets, and in that sense are technically insolvent. Even some of these farms have substantial net incomes and debts small enough relative to them that debt service appears feasible. But some of the 160 enterprises with ratios of debts to assets greater than 0.75 may also be in an unsustainable financial situation. Overall, however, the data indicate that while the financial condition of Maryland farms varies greatly, severe financial difficulties are relatively rare.
17
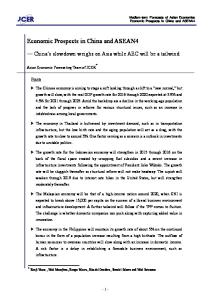
Off-Farm Income In Maryland as elsewhere most farm operators supplement net farm income with income from various off-farm sources. The importance of off-farm income has increased over time. For the U.S. as a whole, in 1960, net farm income constituted 47 percent of average farm household total income, while off-farm income accounted for 53 percent. By 1998, the proportion of total household income contributed by net farm income had declined to 12 percent, while income from off-farm sources accounted for the balance of 88 percent (USDA, ERS, 2001). Thus, despite historically low prices for a number of major commodities and financial vulnerability for many farmers,11 off-farm income has made it possible for many loss-making farms to survive and for their households to enjoy a reasonable standard of living. Indeed, the average U.S. farm household in 1999 (latest year available) had an income of $64,300 while its counterpart nonfarm household averaged $54,800, according to USDA estimates (Agricultural Outlook, Jan. 2002, Table 31). Increased dependence on off-farm income sources has made the nonfarm economy essential to farm households, especially for small-farm operators.12 In Maryland, off-farm income accounted for an estimated 70 percent of the average farm household’s total income in 1999. Farm households in other states, such as Virginia, Pennsylvania, and New Jersey, had even higher off-farm income shares (Figure 12).13 In the 1997 Census of Agriculture, 45 percent of Maryland farm operators reported working off the farm 100 or more days per year. This percentage has been essentially constant through the 1980s and 1990s, and is above Pennsylvania’s 41 percent but below Virginia’s 49 percent. Off-farm income comes from a variety of sources, as itemized in Table 8. Wages from nonfarm jobs represent the greatest share of the 1999 total of $120.1 billion, followed by net income received from other (nonfarm-related) business interests, and retirement, disability, and other public assistance payments (e.g., supplemental security income, unemployment compensation). Income from interest and dividends as well as other income sources (e.g., net income from estates and trusts, rental income from nonfarm properties, annuities, alimony, gifts and inheritance, and net gain from sales of real estate, stocks, and bonds) have increased in recent years. Net income received from farms other than that of the operator represents the lowest share of all of the off-farm sources for the nation as well as each of the selected states.
11
According to the USDA Economic Research Service, more than 170,000 farms (about 8 percent of all farms) were classified as financially vulnerable or marginally solvent in 1999. 12 There is thus a symbiotic economic relationship between farm operators and rural communities. Rural communities represent the settings for non-farm jobs for farm operators and their families. In turn, rural communities depend upon farm operators for market outlets, farm inputs and services, and farm household retail expenditures. 13 The data in Figure 12 are from two different sources: off-farm income from the 1999 follow-on survey of the 1997 Census of Agriculture, and farm income from USDA’s state-aggregate estimates. The USDA estimate at the U.S. level quoted in the preceding paragraph comes from a different estimating procedure based on USDA’s annual Agricultural Resource Management Survey. That estimate is lower ($64,300 in the preceding paragraph compared to $69,500 in Figure 12) because the ARMS survey gives much lower estimates of net farm income than the aggregate data do. One reason for this is that the aggregate data include net farm income accruing to contractors who are not farmers. We use the aggregate data here because state-level ARMS data on net income are not available.
18
$100,000 $90,000
Farm Income
$80,000
Off-Farm Income $70,000 $60,000 $50,000 $40,000 $30,000 $20,000 $10,000 $0 PA
IA
VA
NJ
US
NC
DE
MD
Figure 12. 1999 Net Farm Income and Off-Farm Income per Farm, for U.S. and Selected States Sources: USDA, Economic Research Service, Net Agricultural Value-Added tables; USDA, National Agricultural Statistics Service, Agricultural Economics and Land Ownership Survey, 1999
Table 8. Off-Farm Income by Source, 1999 Source of Income
MD
DE
PA
VA
IA
CA
U.S.
Wages paid to household members
5.1%
7.5%
3.8%
1.2%
4.9%
4.6%
2.3%
Net income received from another farm
1.4%
0.8%
1.2%
0.8%
3.3%
2.5%
1.9%
Net income from any other business
18.4%
20.5%
11.4%
15.0%
9.7%
21.9%
19.5%
Wages from nonfarm jobs
44.5%
50.4%
60.3%
58.0%
60.8%
33.2%
52.1%
Retirement, disability or other public assistance
8.5%
7.7%
12.5%
9.9%
10.2%
16.2%
10.1%
Interest or dividends
7.2%
6.1%
6.3%
5.8%
5.1%
10.0%
6.8%
15.0%
7.1%
4.5%
9.2%
5.9%
11.6%
7.3%
All other sources of income
Source: USDA, National Agricultural Statistics Service (2001). Agricultural Economics and Land Ownership Survey (1999).
Types and Structure of Farms Data on the average of all farms can be highly misleading because farms differ so much in their characteristics. The most important distinction is between commercial farms whose 19
households rely primarily on income generated by the farm operator, and the typically smaller farms that rely primarily on off-farm income sources as the source of living expenses. The most commonly used indicator of whether a farm is large enough to be a fully commercial operation in this sense is the value of sales from the farm. USDA’s Economic Research Service has developed a typology of farms in which farms with sales of less than $250,000 per year are called “small” in contrast to those above that sales level. However, many farms with less than $250,000 in sales are commercial in the sense that they involve full-time employment of the operator – for example, 60- to 80-cow dairy herds would typically generate less than $250,000 in sales. For purposes of this report, we will also consider farms with sales of between $100,000 and $250,000 as ones that may be commercially viable as the main source of the operator’s income. For a detailed discussion of smaller farms, see Annex VII. Figure 13 shows more details of the dispersion of farms by value of sales. The bar for sales of farms over $1,000,000 indicates that less than 2 percent of farms are in this category, yet they account for 30 percent of Maryland’s sales of farm products. At the other end of the scale, half of the state’s farms have sales of $10,000 or less, but altogether they account for less than 2 percent of aggregate sales. The top four sales categories, which include all farms with sales of $100,000 or more, have 21.5 percent of Maryland’s farms but account for about 90 percent of aggregate sales of farm products. Thus, these farms comprise the bulk of Maryland agriculture in the sense of contribution to the state’s output as well as being the set of farms whose operators are economically most dependent on agriculture. 60% 50%
Percent
40% 30% Farms Value
20% 10% 0% Less than $10,000
$10,000$24,999
$25,000$49,999
$50,000$99,999
$100,000$249,999
$250,000499,999
$500,000$999,999
$1,000,000 +
Figure 13. Share of Maryland Farms and Market Value of Agricultural Products Sold, by Sales Category, 1997 Source: 1997 Census of Agriculture
Table 9a shows how different the economic situation is for these two categories of farms. Average sales of the commercial farms is $452,000, and of the smaller ones $15,000. Net cash returns on the average commercial farms, as reported in the 1997 Census of Agriculture, was $82,000. Setting aside $40,000 for operator and family labor, this leaves $47,000 to cover 20
Table 9a. Maryland Farms by Sales Category, 1997 $100,000+
less than $100,000
farms % of state's farms
2,597 21.5
9,487 78.5
acres per farm % of state's total
475 57.2%
97 42.8%
cash farm income per farma (thousand dollars)
82
-2
value of real estate per farm (dollars) % land owned
1,265,691
372,826
41.9%
73.0%
value of capital equipment per farm (dollars)
151,213
35,343
5.1%
-7.9%
rate of returnb a
Cash receipts plus government payments plus payments for services to other farms minus expenses for purchased inputs, livestock, interest on farm debt, property taxes, hired labor, machinery repair and maintenance, and rental payments for leased land. b Cash farm income minus $40,000 for operator labor ($20,000 for smaller farms) minus 5 percent depreciation of capital equipment, divided by value of farm real estate times percent owned plus value of capital equipment. Source: 1997 Census of Agriculture
depreciation and return to investment, yielding a rate of return that is roughly 5 percent. In contrast, the smaller farms had negative average net cash return, a loss of $2,000, a negative rate of return to capital invested, and no return to the operator’s labor. This average does not pertain to all small farms, of course. The Census reports that 37 percent of Maryland’s farms with less than $100,000 in sales had positive net cash returns; but the losses of the other 63 percent outweighed the gains in calculating the average. It is also important to note that land in farms is concentrated on relatively few farms, although not so intensely concentrated as farm sales. Figure 14 shows the extent of concentration of farm acreage on the largest farms in Maryland, compared to comparable information for the United States as a whole. The diagram plots the cumulative percentage of farms against the cumulative percentage of all land in farms, starting from the smallest. Thus the diagram for Maryland shows that the smallest 50 percent of farms have 10 percent of Maryland’s land in farms; note that the smallest 80 percent of farms have about 32 percent of the land. That is, the largest 20 percent account for 68 percent of the state’s farmland. Thus the concentration of land on the largest farms is less than the concentration of farm sales.
21
1
Percentage of Land in Farms
0.9 0.8 0.7 0.6 0.5 0.4
Maryland
0.3 0.2
U.S.
0.1 0 0
0.1
0.2
0.3
0.4
0.5
0.6
0.7
0.8
0.9
1
Percentage of Farms
Figure 14. Concentration of Acreage Source: 1997 Census of Agriculture
If land were evenly distributed across farms – i.e., if they were all the same size – the curves shown would instead be the straight line shown on the diagonal from 0,0 to 1,1. At the other extreme, if one farm had essentially all the land and the rest had negligibly tiny plots, the curves would follow the horizontal axis at zero and then the vertical axis at 1. Thus the extent to which the concentration curves are bowed out away from the diagonal is a measure of the concentration of farmland. As Figure 14 shows, that concentration is slightly greater for the United States as a whole than for Maryland. So, for example, the largest 10 percent of U.S. farms have 59 percent of U.S. farmland, while the largest 10 percent of Maryland farms have 50 percent of Maryland’s farmland. While Maryland’s smaller farms are economically less important than larger farms in terms of agricultural output, they are responsible for the stewardship of a substantial share of the state’s farmland. Table 9a indicates that farms with less than $100,000 in sales operated 43 percent of the state land in farms. The share of land in farms that are small in terms of acreage (less than 140 acres) is only 17 percent in 1997 (Table 9b). But their share in the value of the state’s agricultural sales has not declined over the past two decades. Indeed, the smallest category of farms, those of under 50 acres, have seen their share of the Maryland’s farm sales increase from 17 percent in 1964 to 28 percent in 1997. This reflects the increasing importance of relatively high-value output from smaller farms. That 28 percent of output is produced on only 5 percent of the state’s farmland. Note also that 43 percent of Maryland’s farms are in the category of 50 acres or less, and that this percentage is no longer declining over time. The development of high-value farming on these enterprises is likely to be even more important in the future.14
14
By way of comparison, for the United States as a whole, 30 percent of all farms operated less than 50 acres, and they accounted for only one percent of all farmland and 10 percent of farm sales in 1997.
22
Table 9b. Maryland Farms by Acreage Category Acres in farm 1997
1987
1978
1964