ECONOMIC AND MONETARY DEVELOPMENTS Prices and costs
Box 4
A COMPARISON OF TRENDS IN EURO AREA COMMERCIAL AND RESIDENTIAL PROPERTY PRICES Although commercial and residential property markets differ in many ways, they have a number of common driving forces related to supply and demand factors, as well as to structural factors.1 On the demand side, income and wealth are key determinants in both markets and, on the supply side, the elasticity of the markets largely determines the price versus quantity response to changes in demand. Moreover, the response of supply to changes in prices depends on the general financing conditions, input cost dynamics, land availability and other structural factors, such as restrictions on and legislative delays in obtaining permission to build on and develop land.2 1 For a comprehensive overview of the forces driving commercial property markets, see “Commercial property markets: financial stability risks, recent developments and EU banks’ exposures”, ECB, December 2008 and the article entitled “Euro area commercial property markets and their impact on banks”, Monthly Bulletin, ECB, February 2010. 2 For more information on the structural factors affecting residential property prices, see “Structural factors in the EU housing markets”, ECB, 2003 and “Housing finance in the euro area”, Occasional Paper Series, No 101, ECB, March 2009; and for those affecting commercial property prices, see “Commercial property markets: financial stability risks, recent developments and EU banks’ exposures”, op. cit.
ECB Monthly Bulletin September 2010
53
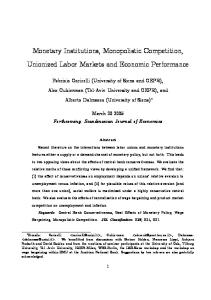
As regards structural factors, owner-occupation rates for the euro area as a whole tend to be higher in residential property markets, despite notable cross-country differences, than in commercial property markets. In terms of financing conditions, the typical maturity of loans is much longer in the residential than in the commercial property market. Moreover, a typically higher loan-to-value ratio in the residential property market could reflect differences in the collateral requirements for obtaining financing, which are partly attributable to differences in the perceived default risk in the commercial and household sectors. Such factors may also contribute to the different reactions of residential and commercial property markets to supply and demand conditions. It is important to mention that great caution is needed when analysing residential and commercial house price developments, given that issues related to the coverage, quality and representativeness of the data contribute to the high degree of uncertainty surrounding any assessment of developments in residential and commercial property prices. Moreover, comparing the two markets is particularly challenging in view of the different statistical and methodological concepts used in estimating prices. More specifically, while estimates of residential property prices are based on actual transactions, those for commercial property prices are based on valuations referring to the capital values of properties, i.e. market prices adjusted downwards for capital expenditure, maintenance and depreciation. Given that valuations are by nature subjective, there is potentially a considerable gap between estimates of commercial property prices provided by different market players, as discussed below. These differences may Chart A Euro area property prices also be due to a heterogeneous coverage of the reference market. With these caveats in mind, looking in more detail at how each market has developed over the last 13 years – the longest period for which a complete dataset is available (see Chart A) – movements in commercial property prices in the euro area have tended to be of higher amplitude and follow the business cycle much more closely than those in residential property prices. In terms of amplitude, the annual growth rate of the office and “unit shop” (defined as a retail shop located on a main shopping street) components of commercial property prices bottomed out around zero at the turn of 2002/03 and peaked between 5% and 20% – depending on the measure used – in 2007. The stark difference in amplitude of the two available measures of euro area commercial property prices may be attributable to coverage: Investment Property Databank (IPD) data capture market-wide trends, while the Jones Lang LaSalle (JLL) index captures only prime office and “unit shop” capital values. By contrast, the
54
ECB Monthly Bulletin September 2010
(nominal data; annual percentage changes) residential commercial – IPD commercial – JLL 25
25
20
20
15
15
10
10
5
5
0
0
-5
-5
-10
-10
-15
-15 1997
1999
2001
2003
2005
2007
2009
Sources: Residential property price data are based on ECB calculations and on national data, while commercial property price data are based on office and “unit shop” capital values from Jones Lang LaSalle (JLL) and Investment Property Databank (IPD). Notes: The euro area residential property price aggregate is calculated from national series covering more than 90% of euro area GDP for the whole period. Quarterly data for the residential property market are interpolated from semi-annual data for the full sample and for the commercial property market they are interpolated from annual data for the period prior to 2007.
ECONOMIC AND MONETARY DEVELOPMENTS Prices and costs
annual growth rates of residential property prices were relatively stable in the range of 4.5% to 7% between 2001 and 2007. In terms of cyclical dynamics, the clear downward movement in commercial property prices during the economic slowdown of 2001 was not evident in residential property prices. However, the recent decline in property prices has been broad-based across both sectors. The resilience of the residential property market during the downturn of 2001 could reflect the business-led nature of this slowdown. At the time, residential property markets in many countries may still have been benefiting from the transition to a lower interest rate regime after the adoption of the euro. Moreover, the peak in the growth rate of commercial property prices in the period 2006-07 appears to have lagged behind that of residential property prices. The latest available data indicate that commercial property prices increased year on year by 2.2% in the second quarter of 2010. At the same time, available data for selected euro area countries show that the pace of the decline in residential property prices appears to have abated somewhat or that the decline came to an end at the beginning of 2010, which could be an early indication that prices are stabilising. At the country level, the swings in property prices have also been far more moderate in the residential than in the commercial property market (see Chart B). At the same time, there appears to be less heterogeneity – in relative terms – across countries in residential property prices than in commercial property prices, as signalled by the relatively tight interquartile ranges.3 As discussed above, developments in both the residential and commercial property markets depend on demand conditions and are generally related to business cycle developments. Chart C compares euro area residential and commercial property price inflation with real GDP growth. It appears that commercial property prices are far more correlated with the business cycle than residential property prices. There are several possible reasons for the greater cyclicality of commercial property prices, namely: i) commercial properties, such as office blocks, 3 Notwithstanding the strong influence of outliers, with growth rates in excess of 30%, particularly in 2008.
Chart B Property prices in euro area countries (annual percentage changes; maximum, minimum, interquartile range and weighted average) weighted average a) Residential 50 40 30 20 10 0 -10 -20 -30 -40 -50 -60 1997
b) Commercial 50 40 30 20 10 0 -10 -20 -30 -40 -50 -60
2001
2005
2007
2008
2009
50 40 30 20 10 0 -10 -20 -30 -40 -50 -60 1997
2001
2005
2007
2008
2009
50 40 30 20 10 0 -10 -20 -30 -40 -50 -60 2010
Sources: Residential property price data are based on ECB calculations, national data and OECD data. Commercial property price data are based on office and “unit shop” capital values from Jones Lang LaSalle. Notes: The aggregation weights are based on nominal GDP in 2007. The estimated euro area aggregate is based on interpolated quarterly OECD data for Italy and Germany. Commercial property data for Cyprus, Malta, Slovakia and Slovenia are not available.
ECB Monthly Bulletin September 2010
55
Chart C Property prices and real GDP growth (annual percentage changes) real GDP (left-hand scale) residential property prices (left-hand scale) commercial property prices (right-hand scale) 8
25 20
6
15 4
10
2
5 0
0
-5
-2
-10 -4
-15
-6
-20 1997
1999
2001
2003
2005
2007
2009
Sources: Eurostat, Jones Lang LaSalle and ECB calculations based on national data.
“unit shops” and industrial buildings are used by companies as “input” in their process of production, which is closely linked to output and employment prospects; ii) commercial property price data are based on valuations generally made by companies for their annual reports on an annual or semi-annual basis, suggesting a higher frequency of changes in commercial property prices than in residential property prices. This could highlight a closer link between commercial property prices and business-cycle developments; iii) residential properties primarily satisfy a household’s need for shelter and are thus characterised by higher owner-occupation rates than those in the office and “unit shop” segments of commercial property markets, a factor that is likely to dampen their correlation with the economic cycle.
The profile of the build-up in property prices can be assessed on the basis of two standard simple valuation metrics that compare property prices with rents and sources of income. This comparison should be treated with caution given the short length of the time series – a long-term average is generally needed in order to assess the benchmark equilibrium level – and the simplistic nature of the valuation metrics discussed. The first indicator (price-to-rent ratio) stems from the assumption that the value of a property as an asset should not deviate significantly from the discounted flows of all its future rents, while the second (income-to-price ratio) is a measure
Chart D Valuation metrics for property prices (index: Q1 1997 = 100) commercial residential a) Asset pricing approach: house price-to-rent ratio
b) “Crude” affordability ratio in euro area property markets
165
165
120
120
155
155
110
110
145
145
100
100
135
135
90
90
125
125
80
80
115
115
70
70
105
105
60
60
95
95
50
1997
1999
2001
2003
2005
2007
2009
50 1997
1999
2001
2003
2005
2007
2009
Sources: Eurostat, Jones Lang Lasalle and ECB calculations based on national data. Notes: For the residential property market, “crude” affordability relates to the income-to-price ratio, and for the commercial property market, it relates to the corporate profits-to-price ratio. Corporate profits are defined as gross operating surplus excluding income from the self-employed.
56
ECB Monthly Bulletin September 2010
ECONOMIC AND MONETARY DEVELOPMENTS Prices and costs
of “crude” affordability.4 According to the price-to-rent ratio (see panel a) of Chart D), residential property prices exhibited a much more steady build-up in valuation gains over the period under review, whereas commercial property prices showed a pronounced and extremely strong build-up around the peak of the latest business cycle and appear to be in a more advanced phase of the ongoing correction process compared with residential property prices. In both markets, however, the “crude” affordability ratio (see panel b) of Chart D) has improved only slightly since the end of 2007. To sum up, despite a number of common driving forces, commercial and residential property markets have exhibited some diverging patterns of behaviour during the period under review. The movements in commercial property prices in the euro area have been of higher amplitude than those in residential prices, and have also followed the business cycle more closely. Recent developments point to signs of a levelling-off in the rate of decline or early signs of increases in property prices in both the commercial and residential property markets. 4 While it is possible to use several different measures of income to construct affordability indexes, disposable income is commonly used for residential property and a national accounts measure of corporate profits is used for commercial property.
ECB Monthly Bulletin September 2010
57