Economic and Environmental Aspects of Integration in Chemical Production Sites
Zur Erlangung des akademischen Grades eines Doktors der Wirtschaftswissenschaften (Dr. rer. pol.) von der Fakultät für Wirtschaftswissenschaften der Universität Karlsruhe (TH) genehmigte DISSERTATION von Nicola Karin Kimm M.Sc.
Tag der mündlichen Prüfung: 10. Juli 2008 Referent: Professor Dr. Otto Rentz Korreferent: Professor Dr. Henning Bockhorn 2008 Karlsruhe
Acknowledgements I had the pleasure of completing this dissertation while working in the chemical industry in Asia, based in Singapore. My sincerest thanks go to my supervisor, Professor Dr. Otto Rentz, for giving me the opportunity to undertake this project from afar and for providing his support and expertise. I would also like to express my gratitude to all my industry contacts who entrusted me with valuable information and answered my many questions. Additionally, I would like to thank my colleagues at the ‘Institut für Industriebetriebslehre und Industrielle Produktion, Universität Karlsruhe’ for their kind support. Karlsruhe, July 2008
Nicola Kimm
Table of Contents
i
Contents List of Tables.........................................................................................................iii List of Figures........................................................................................................iv Abbreviations........................................................................................................vii 1
Introduction ...................................................................................................1
2
The Concept of Industrial Clusters................................................................6
3
4
5
2.1
Definitions...............................................................................................6
2.2
Clusters in the Literature.........................................................................7
2.3
Industrial Ecology .................................................................................16
2.4
Industrial Symbiosis and Eco-Industrial Parks......................................22
The Integrated Chemical Production Site ...................................................27 3.1
Process Types in the Chemical Industry...............................................27
3.2
Focus of Large Chemical Companies...................................................29
3.3
Importance of Location and Feedstock Availability...............................29
3.4
Location of Major Integrated Chemical Production Sites ......................33
3.5
Examples of Integrated Sites................................................................37
3.6
Description of the ICPS ........................................................................39
3.7
Types of Integration ..............................................................................40
Methodology for Quantifying Integration Aspects .......................................58 4.1
Definition of Site Types.........................................................................58
4.2
Mapping the Site...................................................................................60
4.3
Assumptions .........................................................................................62
4.4
Materials Integration .............................................................................63
4.5
Energy Integration ................................................................................68
4.6
Logistics Integration..............................................................................71
4.7
Shared Infrastructure ............................................................................75
4.8
Environmental Aspects .........................................................................92
4.9
Economic and Environmental Benefits of Integration ...........................94
4.10
Application of the Methodology on the Plant Level ...............................95
Case Study on the Site Level....................................................................100 5.1
Material and Energy Mapping of the Site............................................100
5.2
Infrastructure for the Site ....................................................................101
Table of Contents
ii
5.3
Methodology Application.....................................................................103
5.4
Analysis ..............................................................................................106
6
Case Studies on the Plant Level ...............................................................116 6.1
Processes which Produce Useable By-products and/or Steam..........116
6.2
Case Study Selection .........................................................................125
6.3
Plant Case Study 1: Polyacrylate Dispersions....................................126
6.4
Plant Case Study 2: Aniline ................................................................155
6.5
Summary of Economic Benefits for Plant Case Studies .....................168
6.6
Environmental Aspect of Integration for Plant Case Studies ..............169
7
Integration Potential ..................................................................................176 7.1
Process Characteristics Important for Integration...............................176
7.2
Determination of Integration Potential ................................................181
7.3
Application of the Integration Potential Concept .................................182
7.4
Concluding Remarks ..........................................................................192
8
Conclusions and Outlook ..........................................................................195 8.1
General Findings from the Case Studies ............................................195
8.2
Integration Potential............................................................................196
8.3
Site Location.......................................................................................196
8.4
Advantages and Disadvantages of Integration ...................................197
8.5
Outlook ...............................................................................................199
9
Summary ..................................................................................................201 9.1
Methodology .......................................................................................202
9.2
Site Level Case Study ........................................................................204
9.3
Plant Level Case Studies....................................................................205
9.4
Integration Potential............................................................................209
9.5
Closing Remarks ................................................................................209
10
Reference List...........................................................................................210
Appendix A. Photos of Integrated Chemical Production Sites………………..………..220 Appendix B. Steam and Power Cost Calculation………………..…………………………...222 Appendix C. Steam and Power Cost Calculation for Site Case Study…………..…224 Appendix D. Schematic of the Aniline Production Process……………………………...226
List of Tables and Figures
iii
List of Tables Table 2.1 Summary of Location Theories for Clusters ........................................10 Table 3.1 Cracker Products based on Different Feedstocks...............................31 Table 3.2 Steam Cracker Production per Region in 2005...................................32 Table 3.3 Integration on Different Levels in the Chemical Industry .....................41 Table 3.4 Economic and Ecological Efficiency through Integration.....................56 Table 4.1 Facilities and Integration at Site Types for Methodology.....................59 Table 4.2 Transport Costs per Mode of Travel from Different Studies ................73 Table 4.3 Definitions of ISBL, OSBL and Infrastructure ......................................76 Table 4.4 U.S. Electricity Prices for Different Conditions ....................................78 Table 4.5 Cost for Steam and Power Generation ...............................................84 Table 4.6 Cost for Steam and Power Generation without Electricity Export .......85 Table 4.7 Examples of Cogeneration Plants and Investment Costs ...................85 Table 4.8 Emissions Factors for Different Transport Modes ...............................93 Table 4.9 Emissions Factors for CHP Power Plants ...........................................94 Table 5.1 Capacities of Plants for Site Level Case Study .................................100 Table 5.2 Cost Benefit of Useable By-products for Site Case Study.................107 Table 5.3 By-product as Fuel in Site Case Study..............................................109 Table 5.4 Steam and Power Requirements for Site Case Study ......................111 Table 5.5 Utilities Requirements for Site Case Study .......................................111 Table 5.6 Summary of Economic Benefits for Site Case Study ........................112 Table 5.7 Fossil Fuels Reduction for Site Case Study ......................................114 Table 5.8 Emissions Reduction due to Integration for Site Case Study ............114 Table 5.9 Cost, Fossil Fuel, and Emissions Reduction for Site Case Study .....115 Table 6.1 Chemical Processes with Useable By-product Formation.................117 Table 6.2 Chemical Processes with Steam Export ...........................................122 Table 6.3 Scenario Description for Polyacrylates Case Study ..........................130 Table 6.4 Comparison of Scenarios for Polyacrylates Case Study ...................131 Table 6.5 Raw Materials for a 20 kt/a Stand-alone Polyacrylates Plant............132 Table 6.6 Production Costs for the Polyacrylates Case Study..........................136 Table 6.7 Port Handling and Clearance Costs per 20 foot Container ...............142 Table 6.8 Tariff Rates for AA/AE and Acrylic Polymers ....................................143 Table 6.9 Freight Rates from Shanghai to Different Ports in Asia.....................143 Table 6.10 Freight Rates within Asia for 20 foot Container...............................144 Table 6.11 Logistics Costs for Raw Materials in PA Case Study ......................147 Table 6.12 Logistics Costs for Products in PA Case Study...............................148
List of Tables and Figures
iv
Table 6.13 Logistics Costs for Raw Materials & Products in PA Case Study....149 Table 6.14 Costs for PA Case Study with Spraydried Product .........................151 Table 6.15 Summary of Costs for PA Case Study ............................................152 Table 6.16 Scenario Description for Aniline Case Study...................................158 Table 6.17 Comparison of Scenarios for Aniline Case Study ...........................160 Table 6.18 Logistics Costs for Aniline Case Study............................................163 Table 6.19 Steam Export for Aniline Production by Fluidised-Bed Process......165 Table 6.20 Logistics and Steam Costs Relative to Aniline Sales Value ............166 Table 6.21 Summary of Economic Benefits for Case Studies...........................168 Table 6.22 Economic Benefits as % Production Costs for Case Studies..........169 Table 6.23 Emissions for Transport for PA Case Study....................................170 Table 6.24 Emissions for Transport for Aniline Case Study..............................170 Table 6.25 Transport Emissions Reduction for Plant Case Studies..................171 Table 6.26 Fuel Consumption for Transport for Plant Case Studies .................171 Table 6.27 Reduction in Natural Gas Consumption for Plant Case Studies .....173 Table 6.28 Emissions Reductions for Plant Case Studies ................................173 Table 6.29 Cost, Material and Emissions Reduction for Plant Case Studies ....175 Table 7.1 Factors for the Determination of Integration Potential.......................185 Table 7.2 Raw Materials & Products for Determining Integration Factors.........186 Table 7.3 Normalised Factors for the Determination of Integration Potential....186 List of Figures Figure 2.1 Industrial Ecosystem at Kalundborg, Denmark .................................24 Figure 3.1 Pyramid of Levels of Refinement in Chemical Production ................28 Figure 3.2 Focus of Large Chemical Companies ...............................................29 Figure 3.3 Feedstock Preparation via Refinery and Steam Cracker ..................30 Figure 3.4 Fractions from Naphtha Cracker and their use in an ICPS ...............31 Figure 3.5 Trade Flow of Light Olefin Equivalents .............................................32 Figure 3.6 West European Ethylene and Propylene Pipelines...........................33 Figure 3.7 Location of Important ICPS...............................................................34 Figure 3.8 Location of ICPS in Western Europe ................................................35 Figure 3.9 Location of Chemical Clusters in China ............................................37 Figure 3.10 Schematic of Materials and Energy Flows in an ICPS ....................39 Figure 3.11 Schematic of Input, Core and Output Systems of an ICPS.............40 Figure 3.12 Selected Value Chains for Polymer Production ..............................42 Figure 3.13 Examples of Materials Integration at BASF ....................................44
List of Tables and Figures
v
Figure 3.14. Examples of Materials Integration at Marl......................................45 Figure 3.15 Inbound/Outbound Transport at BASF Ludwigshafen ....................47 Figure 3.16 Energy Integration: Example of Utilising a Heated Stream .............50 Figure 3.17 Excess Heat Recovery in the Acetaldehyde Process at Lonza.......51 Figure 3.18 Steam Production Sources for BASF and Lonza Sites ...................52 Figure 3.19 Site wide Distribution Network for Electricity and Water .................54 Figure 4.1 Site Types for Methodology: ICPS....................................................59 Figure 4.2 Site Types for Methodology: Semi-ICPS and Stand-alone Sites ......60 Figure 4.3 Site Schematics exemplifying Nomenclature for Methodology .........61 Figure 4.4 Materials Mapping for the Different Site Types .................................64 Figure 4.5 Decision Flow Chart for By-products ................................................66 Figure 4.6 Fates of Useable By-products in Semi-ICPS or Stand-alone Site.....67 Figure 4.7 Energy Mapping for the Different Site Types ....................................70 Figure 4.8 Logistics-related Costs in a Stand-alone Site and Semi- ICPS.........71 Figure 4.9 Logistics Chain for Chemical Production ..........................................72 Figure 4.10 Specific Road Transport Cost versus Distance travelled ................74 Figure 4.11 Infrastructure Investment Costs versus Project Costs ....................77 Figure 4.12 Operating Cost including Capital Costs for Steam Boilers ..............79 Figure 4.13 Comparison of Steam and Power Provision Configurations ...........81 Figure 4.14 Efficiency of CHP Plant versus Capacity ........................................83 Figure 4.15 Comparison of Costs for Cogeneration...........................................86 Figure 4.16 Operating Cost of CHP Plant relative to Capacity...........................86 Figure 4.17 Operating Cost of Cooling Water Preparation versus Capacity ......87 Figure 4.18 Operating Cost of Process Water Preparation versus Capacity .....87 Figure 4.19 Example of Energy Integration through Cooling Water ...................88 Figure 4.20 Nitrogen Product Value relative to Capacity ...................................89 Figure 4.21 Reduction of Waste Water use through Integration ........................90 Figure 4.22 Boundaries for Application of Methodology on Plant Level .............96 Figure 5.1 Schematic of Flows in Site Case Study ..........................................104 Figure 5.2 Separated Production Blocks for Site Case Study..........................105 Figure 5.3 Materials Integration between AA/AE and Oxo Plants in ICPS.......106 Figure 5.4 Economic Benefits for Site Case Study ..........................................113 Figure 6.1 Location of Plant Case Studies in ICPS Value Chains ...................126 Figure 6.2 Value Chain for Polyacrylates within an ICPS ................................128 Figure 6.3 Production Process for Polyacrylate Dispersions ...........................129 Figure 6.4 Schematic of Scenarios for PA Case Study....................................131
List of Tables and Figures
vi
Figure 6.5 Utilities Cost for Scenarios for PA Case Study ...............................133 Figure 6.6 Production Cost Breakdown for PA Case Study .............................137 Figure 6.7 Comparison of Production Cost Breakdown for PA Case Study.....137 Figure 6.8 Production Cost Differences for PA Case Study.............................138 Figure 6.9 Production Cost Test Scenarios for PA Case Study .......................140 Figure 6.10 Freight Costs as a Function of Distance .......................................144 Figure 6.11 Logistics Cost Differences for Raw Materials in PA Case Study...145 Figure 6.12 Logistics Cost Differences for Products for PA Case Study..........146 Figure 6.13 Logistics Costs for Raw Materials & Products for PA Case Study 146 Figure 6.14 Costs for PA Case Study Scenario 1 and Test Scenarios ............150 Figure 6.15 Costs for PA Case Study Scenario 2 and Test Scenarios ............151 Figure 6.16 Total Costs for PA Case Study .....................................................152 Figure 6.17 Location of the Aniline Process in Polyurethane Value Chain ......155 Figure 6.18 Simplified Aniline Process.............................................................157 Figure 6.19 Locations and Transport Routes for Aniline Case Study...............159 Figure 6.20 Logistics Costs for Aniline Case Study .........................................164 Figure 6.21 Logistics Cost Differences for Aniline Case Study ........................164 Figure 6.22 Logistics and Steam Costs for Aniline Case Study .......................166 Figure 6.23 Cost Differences between Scenarios for Aniline Case Study........167 Figure 6.24 Economic Benefit of Integration for Plant Case Studies................169 Figure 6.25 Reduction in Fuel Consumption for Transport ..............................172 Figure 6.26 Reduction in CO2 Emissions with Integration................................174 Figure 6.27 Reduction in Fuel Consumption with Integration...........................174 Figure 7.1 Factors for the Determination of Integration Potential.....................181 Figure 7.2 Processes Investigated for Integration Potential.............................182 Figure 7.3 Integration Potential for Example Processes ..................................186 Figure 7.4 Integration Potential according to Categories .................................187 Figure 7.5 Key Process Differences relevant for Integration Potential .............188 Figure 7.6 Raw Materials Factor for Base Case and Tests..............................190 Figure 7.7 Product Factor for Base Case and Tests ........................................190 Figure 7.8 Results of Test C according to Categories......................................191 Figure 7.9 Overall Factors for Base Case and Tests .......................................191 Figure 7.10 Anticipated Trend of Integration Potential with Product Type .......194 Figure 9.1 Aspects and Benefits of Integration ................................................202
Abbreviations Abbreviations Units a h J K MW t
Annum Hour Joule Thousand Megawatt Tons
Acronyms AA/AE AN ASU BA C# CAA CHP EA 2-EHA EO/EG GTCC ICPS LCA LDPE LPG MA MDI MFA NB PA PIOT PFO S# SA Semi-ICPS Syngas WWT
Acrylic Acid / Acrylic Esters Aniline Air Separation Unit Butylacrylate Carbon compound with # Carbon atoms, eg. C2 ethylene Crude Acrylic Acid Combined Heat and Power plant Ethylacrylate 2-Ethylhexyl Acrylate Ethylene Oxide / Ethylene Glycol Gas Turbine Combined Cycle Integrated Chemical Production Site Life Cycle Assessment Low Density Polyethylene Light Petroleum Gas Methylacrylate Methylene Diphenylene Isocyanate Material Flow Analysis Nitrobenzene Polyacrylates Physical Input-Output Tables Pyrolysis Fuel Oil Case study scenario, eg. S1, S2, or S3 Stand-Alone Chemical Production Site Semi-Integrated Chemical Production Site Synthesis gas Waste Water Treatment
vii
Abbreviations
viii
Symbols ε Efficiency, % σ Standard deviation, Abbreviations C Cost, €/a c Specific cost, €/t D Distance, km e Specific energy, KJ/Kg E Energy flow, KJ/a Ff Factor fuel, tf/(tprod⋅km) Ft Factor t, €/(tprod⋅km) Fem,pp Factor em,pp, tem/MWh
Fem,t h M S v x X
Factor em,t, tem/(tprod⋅km) Enthalpy, KJ/Kg Mass flow, t/a Savings, €/a Value, €/t Normed integration factor, Integration factor, -
Indices b bp c cw d dm em el eq f fac h2O hr hs in infras l lm p
pp rm s sp st t th u u,d u,i u,s v w wd wi ww we
power plant raw material sales product all sales products for site steam transport thermal useable by-product u for disposal u for incineration u for sales value chain waste waste for disposal waste for incineration waste water waste emissions
boiler by-product captive use material cooling water disposal of waste demineralised water emissions electrical equipment fuel facilities water heat recovery heated stream incineration infrastructure logistics logistics management packaging
Introduction
1
1 Introduction Various types of chemical production sites exist throughout the world. At one end of the spectrum are stand-alone sites consisting of a single production plant and at the other end, large sites consisting of several production plants, each with their associated infrastructure. Sites consisting of several production plants are often referred to as chemical parks or chemical clusters. Chemical clusters consist of several plants located close to one other in order to derive some benefit. The benefit may be as simple as the shared use of land and infrastructure or extend to the sharing of resources or the exchange of materials. As the scale of chemical sites increases, co-location becomes of greater importance. Large chemical production facilities consist of world-scale chemicals producers and exist in various parts of the world, typically strategically located at coastal areas or waterways for port and water access. Such sites consist of individual chemical production plants which are integrated with one another in different ways and to different degrees. This integration involves individual plants exchanging feeds or products with one another. Value chains link production plants where each plant achieves a successively higher level of processing, leading to chemical products which are ultimately used to make consumer products. The linkages in such sites are not limited to materials, but extend to energy, shared facilities, and resources. Most often, several companies are involved in such a network. Since the types of chemical sites vary considerably, research into the benefits of co-location must specify the type of production site. The focus of this work is the Integrated Chemical Production Site (ICPS), which is defined here as a kind of chemical cluster in which production plants form an integrated network via ties in production, logistics, and energy. This site represents a special kind of industrial cluster where its members are physically linked to one another via pipeline. Further, members of an ICPS share facilities such as those for utilities, energy provision, and waste water treatment. Also, these sites may benefit from pooled resources and services such as raw material procurement, IT systems, personnel training, and more.
Introduction
2
It is the premise of this work that integration in such sites leads to significant cost savings and environmental benefits due to the use of chemical by-products, the onsite transport of materials, energy integration, and the shared use of facilities. The benefit of integration for an ICPS is expected to vary depending on the types of processes onsite and the site configuration; that is, if the site utilises all potentials for integration, such as available by-products or the transfer of excess heat. The aim of this work is to provide an approach for quantifying the economic and environmental benefits of integration for either a site or a plant. This research is novel and purposeful, as it aims to provide a methodology to support strategic decision-making for site planning, optimisation, or investigating alternative production scenarios. Outline and Approach The approach of this work is as follows. The objectives of the study are defined from which research questions are derived. Next, relevant literature is reviewed in order to provide a theoretical framework from which to derive a methodology. This methodology is applied to case studies in order to answer the research questions and meet the objectives of the research. An application-based, case-study approach is followed. Through application of the methodology, the abstract concepts of integration are put into quantifiable terms. The methodology is first applied to one integrated site to determine the overall economic and environmental benefits of integration for the site and to investigate which aspects of integration are most significant. This is followed by application of the methodology on the plant level. This is to demonstrate how integration affects a specific plant. Two plant level case studies are selected in order to highlight different aspects of integration. Finally, an approach is proposed to assess a particular process’ suitability for location within an integrated site. Objectives A methodology is proposed to determine the economic and environmental implications of integration. The objectives of the work are to: •
Introduce the concept of the ICPS
Introduction •
Describe types of integration present at the ICPS
•
Develop methodologies to:
3
− quantify the overall advantages of a particular ICPS − evaluate different integration scenarios for a particular plant − evaluate the suitability for a particular plant to be built in an ICPS •
Apply the methodologies to case studies
The main research questions to be answered are: •
Does an ICPS provide significant economic and environmental benefits compared to less integrated chemical production sites?
•
What are the main contributors to the potential savings: materials integration, energy integration, or shared infrastructure?
•
What considerations are important for the integration of a particular plant?
Implications of the Work The methodology may be used by the management of an existing integrated site to quantify the economic and environmental benefits according to a site’s current configuration and identify potentials for increased integration. Also, the methodology may be employed for the planning of an ICPS in order to compare alternative scenarios, such as in the evaluation of different production capacities or competing process technologies leading to different by-products or energy streams. Further, the resulting economic and environmental benefits may be utilised promotionally to increase acceptance of a chemical production site. The work aims to provide a new perspective on describing and highlighting the advantages of integration in the ICPS. Also, the work may provide a useful approach for further application or as a basis for future studies. Scope and Limitations Organisational integration forms such as knowledge sharing and integrated internal processes, which may also contribute to cost savings, will not be addressed as they are less clearly quantifiable and out of the scope of this work. The research will focus on chemicals producers. Plants at the refining end of chemical production where fossil fuels are broken down into feedstock chemicals are not the focus of this work. The types of integrated sites addressed in this
Introduction
4
work consist of world-scale plants producing various types of chemical products. The research will not investigate to a detailed degree the technology behind the processes investigated. The degree of integration within a particular ICPS inevitably depends on the process technologies present, as the use of some technologies may benefit an ICPS more than others. However, this is not the main focus of this work. Research Method The case study research method is used for this work, as it is considered to be the most appropriate for the research topic as discussed below. An overview of the case study approach and reasons for its suitability are given below. The use of case studies is widely adopted as a “research strategy which focuses on understanding the dynamics present within single settings“ (Eisenhardt, 1989, p.534). Case studies are empirical investigations which rely on multiple data sources, which through corroboration, can enhance a study’s validity. For example in an ICPS, the product flow rates cited by two inter-connected production plants ensures consistency in the data. According to Stake (1994), to follow a case study approach is not a choice of methodology, but rather the selection of an object of study. The most compelling reason for the application of the case study approach for this topic is that it is suitable for investigating the unique character of a particular system which is also representative of other cases (Stake, 1994). However, case studies may have some disadvantages. The selection of the case may be biased and there is a risk of improper interpretation (Gable, 1994). Further, due to the large amount of data and the specific characteristics of a case, an overly complex and narrow theory may be developed (Eisenhardt, 1989). The case studies in this work are particular sites or production plants. For each case study, one scenario represents an actual case and the other scenario is conceived for comparison purposes. A disadvantage of using an actual case is the problem of confidentiality regarding company data. Alternatively, the cases may be represented by design data, such as through process simulation software. This may be appropriate to support decisions in site design or plant location. However, in a simulated system, it must be ensured that the decisions
Introduction
5
made regarding process and energy streams are realistic and not overly optimistic. In applying the methodology to an actual setting, the routing of various flows is already determined and therefore the methodology is expected to yield valid results.
The Concept of Industrial Clusters
6
2 The Concept of Industrial Clusters This chapter introduces the different perspectives on clusters. Thus, relevant literature was derived from various fields of study to provide the background and theoretical foundation for this study. Below, an introduction and overview of this chapter is given. First, the terms ‘cluster’ and ‘chemical cluster’ are defined based on their use in the literature. Then a term defined for this work is introduced, the ‘Integrated Chemical Production Site’, a specific kind of chemical cluster where its members are physically linked to one another. Then, a review of the most important literature on clusters is given in order to illuminate relevant theories. This is followed by an introduction to the inter-disciplinary field of Industrial Ecology, in which the approach of Ecology (mapping of flows) is combined with Industrial Economics (Duchin and Hertwich, 2003). As Industrial Ecology deals explicitly with linked systems, it is useful in describing the interconnectedness of an ICPS. Related concepts are introduced, such Material Flow Analysis (MFA), which is used to track flows in industrial systems. Also, industrial settings which benefit from the application of Industrial Ecology principles, such as the closing of material loops, are highlighted. The literature on clusters is mainly focussed on the investigation of cooperative advantages, while Industrial Ecology focuses primarily on environmental benefits. The literature from both of these fields is helpful in providing a framework with which to develop the methodology for this work, where the tools of Industrial Ecology are applied to the chemical cluster setting to determine the economic and environmental benefits of integration. 2.1
Definitions
2.1.1 The Cluster The Oxford Dictionary defines a cluster as a “close group of things” (The Concise Oxford Dictionary, 1982). However, various theories on clusters define ‘close’ and ‘things’ in different ways. Porter (1998, p.199) defined a cluster as “a geographically proximate group of interconnected companies and associated institutions in a particular field, linked by commonalities and complementarities”
The Concept of Industrial Clusters
7
and “a system of interconnected firms and institutions the whole of which is greater than the sum of the parts”. Also, Roelandt and den Hertog (1999, p.1) noted that “economic clusters can be characterised as networks of strongly interdependent firms (including suppliers) linked to each other in a value-adding production chain.” 2.1.2 The Chemical Cluster Applying Porter’s definition (1998, p.199) to the chemicals industry, the chemical cluster describes a geographically proximate group of interconnected chemical companies which may be linked to one another through ‘commonalities and complementarities’ such as customer/supplier relationships, technology, labour, or distribution. These customer/supplier relationships may be manifested in the transfer of materials or sharing of energy. However, the term chemical cluster does not insist that the individual members of the cluster are physically linked through material or energy flows. For example, the term chemical cluster may also describe an agglomeration of chemical companies which are co-located to derive a benefit, such as proximity to customers, a port, or a shared labour pool. Since this research investigates a specific form of chemical cluster in which material and energy flows physically link its members, another term is required. Thus the Integrated Chemical Production Site (ICPS) is defined. 2.1.3 The Integrated Chemical Production Site An Integrated Chemical Production Site (ICPS) is defined here as a network of chemical producers in close physical proximity of one another in which the transfer of material and energy flows connects the individual chemical producers. The members of an ICPS are individual production plants or site facilities such as utilities. These members work together as an integrated network and rely on one another in order for daily production to function. This network combines production, energy, waste disposal, logistics, and shared infrastructure. 2.2
Clusters in the Literature
Industry cluster concepts date from the last century, but they have only become a popular topic in the literature over the last decade (Bergman and Feser, 1999). Marshall (1890) is commonly cited as the first to describe the occurrence of spatially concentrated industries. He described concentrated industrial districts
The Concept of Industrial Clusters
8
as places where firms enjoy the benefits of large, skilled pools of labour, greater opportunities for intensive specialisation (a finer division of labour), and heightened diffusion of industry-specific knowledge and information (knowledge spill-overs). Also he highlights the social, cultural, and political factors, including trust, business customs, social ties, and other institutional considerations (Bellandi, 1989). Michael Porter’s “The Competitive Advantage of Nations” (1990) acted as an impulse or seed for much literature on clusters. On account of Porter’s article and the apparent success of clusters around the world, the study of clusters has increasingly become a subject of literature. Research on clusters has attracted scholars from different disciplines and has led to a “geographical turn in economics” (Martin, 1999, p.67). Below, the most important theories related to clusters are presented, pertaining to: the development of clusters, categorisation of clusters, identification of clusters, and advantages of clusters. Finally, the relevance of this literature for the ICPS is discussed. 2.2.1 Development of Clusters Marshall (1890) attributed agglomeration to the following factors: a shared labour pool, input-output dependency (firms supplying intermediate products or services to each other), and knowledge spill-overs (benefits derived from the sharing of knowledge). Today, location theory is normally used to explain why clusters develop. Summarised below are the main theories describing the motivation behind cluster formation. According to Maggioni (2002, p.2), reasons for industrial clustering found in the literature can be grouped into three main categories: •
To benefit from local sources of raw materials, intermediate inputs, or demands
•
To reduce search costs and to tackle location risk and uncertainty
•
To benefit from agglomeration economies
Agglomeration economies refer to economies which are external to a firm but internal to the industry such as a greater availability of specialised services, a
The Concept of Industrial Clusters
9
larger pool of trained workers, public infrastructure, financial markets familiar with the industry, or inter-firm information or technology transfer. Least Cost Weber (1929) is the founder of the ‘least cost approach’ and attributes the colocation of manufacturing firms to the interaction of three factors: transportation costs, labour costs, and agglomeration forces. In his theory, Weber explains that firms choose a location in order to minimise transport costs between required material inputs and outputs for the marketplace. Then, the influence of the two other factors, labour costs and agglomeration forces, will determine the final location. Agglomeration forces are defined as the reduction of production and marketing costs which result from an increasing number of firms at a site. Location Equilibrium Location Equilibrium theories assume that price interactions are the fundamental cause of spatial agglomeration. According to Kanemoto (1990, p.47), market transactions of intermediate inputs can create clustering if accompanied by indivisibility in production: “Combining the market exchange of intermediate inputs with indivisibility, [..] creates externalities in location decisions. For example, suppose that two firms interact with each other and they equally share the interaction costs. If one firm moves closer to the other firm, the interaction costs for both firms decrease.” Krugman (1991, p.1) theorises that industry location depends on the interaction of the expenditure in manufactured goods, transportation costs, and the extent of scale economies. To realise economies of scale while minimising transportation costs, manufacturing firms tend to locate in regions with larger demand. Industrial Geography The above theories are based on the premise that industry chooses a location based on external factors (Maggioni, 2002). In contrast, Industrial Geography Theory states that industries create their own conditions for growth based on the dynamic economy of production, both internal and external to the firm, leading to the agglomeration of firms at a certain location. For example, once a company chooses a location, this leads to a labour and investment influx (Storper, 1989).
The Concept of Industrial Clusters
10
Porter’s Competitive Advantages Porter (1990) bases his theory on the argument that there are four determining factors in an industry’s success: 1. Factor conditions (natural resources, labour, infrastructure, etc.) 2. Demand conditions (customers) 3. Related and supporting industries (suppliers or competitors) 4. Firm strategy (encouraging investment and upgrading) Porter extrapolates this to explain that “regional clusters grow because of several factors: concentration of highly specialized knowledge, inputs and institutions; the motivational benefits of local competition; and often the presence of sophisticated local demand for a product or a service” (Porter, 1996, p.87). Below, Maggioni (2002, p.26) summarises the location theories introduced here and how they explain cluster formation. Table 2.1 Summary of Location Theories for Clusters Theory Least Cost
Location Equilibrium Industrial Geography Porter’s Competitive Advantages
Advantages Supply-side orientation, distance related variables, multiple equilibria Non-price interactions; monopolistic competition Existence of windows of locational opportunity; industries produce regions Use of case-studies; heuristic and pragmatic approach
Disadvantages Overlooks demandside, perfect competition Lack of a unifying framework
Clustering explained by Resources location; labour force pool; agglomeration economies Demand-supply interactions among firms
No explicit formal modelling
Dynamic economies of production; horizontal integration
Must be reduced in order to be empirically tested
Localisation economies; beneficial effects of local competition; local concentration of demand
2.2.2 Types of Clusters Different types of clusters proposed in the literature are reviewed below. Meso- vs. Micro-cluster Hoen (2001) describes two groups of clusters: micro-clusters, composed of firms which cooperate and diffuse knowledge, and meso-clusters, composed of firms which have buyer-supplier relationships. Normally the work on micro-clusters is
The Concept of Industrial Clusters
11
theoretical or interview-based and focuses on the innovative nature of the cluster, whereas studies on meso-clusters tend to be empirical. Below, further subcategories of meso-clusters are introduced. Value Chain Cluster A term which is aligned with the concept of the meso-cluster is the value chain cluster, which Roeland and den Hertog (1999) define as a cluster with an extended input-output or buyer-supplier chain. It is comprised of final market producers and first, second, and third tier suppliers which directly and indirectly engage in trade. This is consistent with Enright’s vision of a cluster in which members are bound together by "buyer-supplier relationships, or common technologies, common buyers or distribution channels, or common labour pools “ (Enright, 1996, p.191). Markusen (1996) further defines four types of clusters according to the types of firms they are composed of and their interactions, described as follows. Marshallian Clusters Marshallian clusters are composed of locally owned, small and medium sized firms concentrated in craft-based, high technology, or manufacturing industries. Substantial trade is transacted between firms and specialised services, labour markets, and institutions develop to serve these firms. Firms network to solve problems (Markusen, 1996). Industrial District Brusco (1986) defines the industrial district as a territorial agglomeration of small to medium sized independent firms which are engaged in a similar activity and represent a type of Marshallian cluster. The members benefit from the collaboration and competition of the relationships which bind them. Examples in the United States are Silicon valley and the electronics, multimedia, and cultural products clusters in California (Scott, 1996). Further examples are the textile, ceramic tile, and machine tools clusters in northern and central Italy (Paniccia, 1998). A German example is given by the technology-intensive industrial regions in Baden-Württemberg (Sabel et al., 1989; Herrigel, 1993).
The Concept of Industrial Clusters
12
Hub and Spoke District Here, one or few large firms act as an anchor, attracting other companies to it. The smaller firms which gather around the anchor firm may supply raw materials or utilise products produced by the anchor firm. The small companies cooperate with the anchor company, however, the small companies may compete with one another and do not cooperate as in the Marshallian cluster. Examples are the clusters around GM in Detroit, Boeing in Seattle, or Toyota city in Japan (Markusen, 1996). Satellite Platform The satellite platform is a congregation of firms which are branch facilities of externally based firms. The members operate independently and there is little cooperation between them. Satellite platforms normally develop through the recruitment of members to share land specifically allocated for industrial use (Markusen, 1996). 2.2.3 Identification of Clusters Input-output tables may be used to identify clusters in that they describe the relations between firms in a cluster. Analysis of input-output patterns to identify clusters began in the 1960’s, became of less interest in the 1970’s, and had a resurgence in the 1990’s. Hoen (2001) used input-output tables to identify clusters in Europe, North America, and Asia in the following sectors: agro-food, mining, energy, construction, metal, chemicals, electronics, and auto manufacturing. Lindqvist et al. (2003) identified clusters in 40 different industries, such as chemicals, textiles, pharma, and plastics. The clusters were identified according to an agglomeration coefficient determined as a function of the fraction of employees in a region in a particular industry relative to the total for that industry. 2.2.4 Advantages of Clusters According to Barkley and Henry (2001, pp.5-6), there are three main advantages of clusters: 1. Clustering strengthens localisation economies. There is a greater availability of specialised input suppliers and business services and a larger pool of trained workers and public infrastructure.
The Concept of Industrial Clusters
13
2. Clustering facilitates industrial reorganisation. Specialisation and adoption of new production technologies is facilitated. Proximity between more specialised firms and their input suppliers and product markets enhances the flow of goods through linked systems and enables firms to more quickly adapt to market changes. 3. Clustering encourages networking among firms. Links between firms are facilitated, activities are integrated, resources or knowledge in areas such as new product development and technological upgrading are shared. Isard (1956) highlights the following advantages of firm proximity: the increased market power through brokered buying and selling, the better availability and use of specialised repair facilities, shared infrastructure, and reduced risk and uncertainty for aspiring entrepreneurs. Rosenfeld (1995, p.20) cites ‘tailored infrastructure’ as an advantage of the cluster based on scale economy logic: "As industry concentration increases, individual businesses benefit from the development of sophisticated institutional and physical infrastructure tailored to the needs of specific industry." Doeringer and Terkla (1997) cite two examples of the benefits of clusters. First, the efficiency of just-in-time inventory and delivery systems for closely located firms, such as Japanese manufacturers and their suppliers. Second, the speed and frequency of interactions between firms. The more frequent and rapid the interaction, the more likely it is that niche markets and new specialised products can be identified. They characterise such dynamics as "collaboration economies or the ability to participate in, and respond rapidly to changing design and manufacturing practices among firms that buy and sell from one another “ (1997, p.182). In a study by Ribas et al. (2003), the performance of chemical companies inside and outside of clusters in Tarragona, Spain was analysed. The study investigated whether clustering leads to higher returns and performance. Two groups were identified: 34 companies clustered in the Tarragona chemical industrial estate and 175 non-clustered companies in the same state of Catalonia, all producers of basic chemicals. Higher returns (on investment, equity, and sales) and 35% higher productivity (firm earnings/personnel cost) were found for companies in a
The Concept of Industrial Clusters
14
cluster compared to non-clustered companies. These advantages are hypothesised to arise from the relationships and the sharing of resources among cluster members. Similarly, Signorini (1994) used business data to confirm that higher production levels and profits were achieved for firms in a cluster compared with firms outside of a cluster for the wool industry. Other authors have investigated the performance of firms inside and outside of clusters for the industrial districts of Italy and Spain with similar results (Hernandez-Sanchez and Soler-Marco, 2002). 2.2.5 Applicability of Cluster Literature to this Work The research on clusters has focussed on explaining how clusters develop, defining cluster types, identifying clusters, and determining the advantages of clusters. In this work, the clusters consist of individual production plants. This is considered a justified application of the concept of the cluster, as the plants in an ICPS function in a similar way to members of a cluster. The plants in an ICPS are considered cluster members which cooperate through shared resources and input/output relationships, but also compete with one another for resources, such as personnel, investment allocation, utilities, and material inputs. All publications on clusters reviewed consider the clusters as agglomerates of different firms and none investigate clusters belonging to a single company, which is possible in the ICPS. Theories describing localisation economies, in which agglomeration arises through the benefits of shared labour, input-output dependency, specialised services, infrastructure, information transfer, and knowledge spill-overs apply to an ICPS. However, these theories imply that a cluster develops over time due to these factors, whereas, a chemical site is normally consciously planned from the start with these advantages in mind. Weber’s least cost approach (1929) is particularly appropriate with regard to transport costs, as chemical production plants would optimally be located in close proximity to one another as a cluster to minimise transport costs. Kanemoto’s (1990) theory is equally relevant for chemical producers, as each interconnected member benefits from lowered interaction costs. Industrial Geography Theory, which states that a company creates its own favourable conditions is also applicable, since the large
The Concept of Industrial Clusters
15
investment of a chemical site will attract workers and perhaps further investment in the area. Porter’s (1990) four determining factors for success are also applicable to the ICPS: 1. Factor conditions: plants share resources, labour, and infrastructure 2. Demand conditions: interconnected plants are each other’s customers 3. Related and supporting industries: eg. utilities provision, waste management 4. Firm strategy: management support of integration efficiencies The type of cluster considered in this work may be considered to be a mesocluster or value chain cluster in which its members are connected through buyersupplier like relationships. According to the cluster types identified by Markusen (1996), the Marshallian cluster or the industrial district comes closest to describing an ICPS. These cluster types as well as the ICPS rely on strong connections, trust, and interdependencies between its members. The tools used for the identification of clusters aim to identify relationships between more dispersed cluster members. However, they can also be applied to the input/output relationships between chemical plants at one site. The advantages of clusters cited in the literature such as improved industrial organisation and increased market power also apply to the ICPS. However, often the advantages given in the literature focus primarily on the qualitative, cooperative, and social aspects of the cluster, which are not addressed in this work. The literature on clusters explains the motivation behind cluster formation and the advantages of clusters. However, the special characteristic of the ICPS in that its members are physically linked to one another, is not specifically addressed in the cluster literature. The literature reviewed next addresses this aspect. The following section introduces theory and accompanying tools which can be used to describe the material and energy linkages in an ICPS.
The Concept of Industrial Clusters 2.3
16
Industrial Ecology
Industrial Ecology is a young interdisciplinary field which aims to describe industrial settings with the tools of engineering and ecology. It is mainly concerned with tracking flows and stocks of materials or energy in industrial systems as a basis for reducing the impact of the production process on the environment. Mathematical tools are used to describe industrial systems and to analyse future scenarios (Duchin and Hertwich, 2003). The geographical scope of studies in Industrial Ecology varies. A study may be global (Socolow, 1994), regional (Rhine river basin: Stigliani, et al. 1993), or focus on individual industries (Frosch and Gallopoulos 1989) or companies (Greadel and Allenby, 1995; Van Berkel and Lafleur, 1997). Among the first to implement the term and philosophy were Japanese research groups aiming to reduce Japan’s dependence on resources (Watanabe, 1972). On the frontier of this field was a Belgian study on national energy and material flows (Billen et al., 1983) as well as a manual on cleaner production and material cycling by a German industrialist (Winter, 1988). Industrial Ecology was really popularised through Frosch and Gallopoulos’ groundbreaking article “Strategies for Manufacturing” (1989). This article proposed that new ways of thinking about industrial production are necessary due to increasing environmental constraints. “Throughout history, human economic activity has been characterized by an open and linear system of materials flows, where materials are taken in, transformed, used and thrown out” (Frosch, 1997, p.37). Frosch and Gallopoulos argued that the traditional model of industrial activities where individual manufacturing processes take in raw materials and generate sales products and waste should be transformed into a more integrated system, an industrial ecosystem, with the aim of reducing waste. “The industrial system ought to be modified to mimic the natural ecosystem in its overall operation” (Frosch and Gallopoulos, 1992, p.271). Industrial Ecology aims to make industrial systems more efficient and sustainable like natural systems. Traditional industrial processes in which fossil fuels are linearly transformed into sales products and wastes are modified into closed, cyclical processes where the waste from one sector is used as an input for another. The ultimate goal is to reduce the environmental impact of industrial
The Concept of Industrial Clusters
17
systems. The flow of industrial materials is compared to the flows of nutrients in biological ecosystems and the industrial network is seen as a system of mutually dependent transformation processes. In an industrial ecosystem “the consumption of energy and materials is optimised and effluents of one process [..] serve as the raw materials of another process“ (Frosch and Gallopoulos, 1989, p.94). The overall consumption of energy and materials is minimised and the effluents of one process serve as the raw materials for another process (Thomas, et al., 2003). Three levels of Industrial Ecology have been defined by Duchin and Hertwich (2003): the micro, meso, and macro levels. The micro and meso levels can also be described as the tools of Industrial Ecology; the micro level focuses on physical balances (such as Industrial Metabolism or Material Flow Analysis) and the meso level adopts a wider view, for example, the Life-Cycle Assessment, introduced below. The macro level represents the widest view and describes processes used to evaluate industrial options employed by key decision makers. 2.3.1 Tools of Industrial Ecology Below, the tools most commonly employed in Industrial Ecology are presented. Industrial Metabolism Industrial Metabolism (Ayres, 1989) is fundamental to Industrial Ecology and is defined as the study of flows of materials and energy in industrial systems and their transformations into products, by-products, and wastes (Garner and Keoleian, 1995). According to Ayres (1989), the optimal Industrial Metabolism would minimise the extraction of virgin natural resources, reduce the loss of materials as waste, and increase the reuse and recycling of resources. Ayres (1989) distinguishes Industrial Metabolism from its parent concept Industrial Ecology. He considers Industrial Metabolism as the study of mass flows and transformations, analogous to the metabolic processes of an organism and considers Industrial Ecology the industrial analogue of an ecosystem, consisting of a network of firms processing one another’s wastes. Material Flow Analysis An analytical tool used to describe Industrial Metabolism is Material Flow Analysis (MFA), also called Substance Flow Analysis. It is derived from the first
The Concept of Industrial Clusters
18
law of thermodynamics, the conservation of mass (Duchin and Hertwich, 2003). The quantities of a particular (normally environmentally relevant) substance are tracked through a particular system as the amount entering the boundary of a system, flowing through various parts of the production system, and ending up as waste. The flows within the system are determined according to process engineering principles and the conservation of mass. The materials balanced may be elements or composite materials (Duchin and Hertwich, 2003). MFA studies have been carried out for different substances. Metals considered to pose a human health threat such as lead or mercury have been focussed on as well as copper (Graedel, 2002). Also, MFA has been used to study flows in a particular geographic region, for example the Rhine Valley (Stigliani et al., 1993). MFA can be applied to production processes in order to identify inefficiencies which may be improved through process innovations, contributing to the goals of Cleaner Production and Pollution Prevention concepts. Use of Physical Input-Output Tables Input-output economics study the interdependence of different parts of an economic system. Similarly, input-output models have been used in Industrial Ecology to track the use of materials and energy and the generation and possible re-use of waste. In order to distinguish these from economics applications, they have also been called physical input-output tables or PIOT (Stahmer et al., 1998). Normally in Industrial Ecology, the PIOT is used to track flows between industries in mass units. The development of PIOTs has benefited from the experience of economic input-output tables regarding the careful accounting of flows to ensure that a particular flow is not counted more than once. The data used for PIOTs are average values which give a snapshot representation of a system. PIOTs have been used extensively in the literature. Several articles by Duchin use input-output tables to evaluate alternative technological assumptions (1990, 1992, 1994). The inventory modelling of some Life Cycle Assessment (LCA) software tools use input-output analysis (e.g. Frischknecht et al., 1996; Heijungs 1994). Studies with direct relevance for Industrial Ecology include the investigation of carbon emissions (Proops et al., 1993), the recycling of plastics (Duchin and Lange, 1998), waste management (Nakamura and Kondo, 2002), and water use (Duarte et al., 2002).
The Concept of Industrial Clusters
19
Life Cycle Assessment LCA is the most popular application of Industrial Ecology and is represented by a large body of literature. The objective of LCA is to quantify the environmental impact of a given industrial product or process. It involves measuring or estimating the material and energy inputs and outputs for a given process. LCA builds on MFA by attempting to quantify the environmental impact of a process. For example, if a product is investigated, all stages will be mapped: the extraction of inputs, the production process, the product’s use, and its disposal. LCA quantifies environmentally relevant factors such as emissions and resource use relative to a functional unit of the product. It is normally carried out using average process values. The resulting environmental profile of a product can be used for comparison against competing products or for suggesting ways to improve a process or product design. A fundamental challenge in an LCA is determining the system boundaries for the particular process or product and identifying all environmentally significant production steps. Often the boundaries are defined in administrative terms such as a country or region (den Hond, 2000). Macro-level: Decision Making One of the primary objectives of Industrial Ecology is to influence industrial decision making. Concepts such as Design for the Environment (DfE), Cleaner Production, and Pollution Prevention aim to incorporate Industrial Ecology principles during the planning stage. Today, environmental considerations are incorporated into many routine corporate decision-support tools and management information systems with the aim of closing production loops and decreasing environmental damage (Duchin and Hertwich, 2003). This helps identify problem areas, evaluate processing trade-offs, and design new production sites according to Industrial Ecology principles. According to Tibbs (1993), the incorporation of these principles is necessary to ensure a company’s future success. “The benefit offered by Industrial Ecology is that it provides a coherent framework for shaping and testing strategic thinking about the entire spectrum of environmental issues confronting industry. Executives and policymakers who take steps to absorb and appreciate this new mode of thinking now will find themselves and their organizations at a very real advantage in the world of the future” (Tibbs, 1993, p.26).
The Concept of Industrial Clusters
20
2.3.2 Restructuring the Industrial System According to Suren Erkman (2001), the strategy for implementing industrial ecology is referred to as ‘eco-restructuring’ and consists of four main elements: 1. Optimising the use of resources. This involves analysing individual processes in order to eliminate unnecessary losses and is also part of the concepts of Cleaner Production and Pollution Prevention. 2. Closing material loops and minimising emissions. This involves reviewing the complete lifecycle of a product to determine where wastes can be recycled. This may prove difficult, as wastes may be of no value or some by-products may be dispersed along with an end-product after its use, such as fertilisers and detergents. Closing material loops in industry may involve a new process and most probably energy consumption. 3. Dematerialisation activities. This involves minimising the total flow of matter and energy used to provide equivalent services. A distinction is made between relative dematerialisation – obtaining more services from a given quantity of matter, and absolute dematerialisation – reducing the resource requirements for the industrial system. 4. Reducing dependence on non-renewable sources of energy. This involves increasing the energy efficiency of processes through such things as cogeneration or energy cascading. Closing Material Loops The concept of closing material loops through the use of by-products is very relevant for this work. By determining the value of a given by-product stream and determining its possible further use, Industrial Ecology is put into practice. The closing of material loops is central to the philosophy of Industrial Ecology. This idea is not new. Talbot (1920, p.19) wrote: “The German, when he encounters a waste, does not throw it away or allow it to remain an incubus. Saturated with the principle that the residue from one process merely represents so much raw material for another line of endeavour, he at once sets to work to attempt to discover some use for refuse.” Clemen, an American economist, wrote about the packing industry (1927, p.vii): “from the viewpoint of individual business, this manufacture of by-products has turned waste into such a source of revenue that in many cases the by-products have proved more profitable per pound than the main product”. Further, the relation between reusing by-products and decreasing pollution was recognised: “the greatest proportion of environmental pollution is a
The Concept of Industrial Clusters
21
direct consequence of an underdeveloped materials economy” and therefore that the goal of a “closed material cycle” should be set (Maier and Roos, 1974, pp.3235). Reasons underlying the motivation for reusing by-products are given by Desrochers (2002, p.1042): 1. The value of some by-products could be close to nothing for the producer, but of much greater value to somebody else. 2. A lot of processing has already gone into the production of by-products, therefore lowering further processing costs. 3. By-products are often produced much closer to their potential buyers than virgin materials, therefore lowering transportation costs. Joint Production The concept of Joint Production is introduced here, as it explains why the production of by-products is inevitable. Simply put, more than one output must emerge from a single production process. The principles behind Joint Production are described as follows. “From a thermodynamic point of view one can describe the process of production as a transformation of a certain number of inputs into a certain number of outputs, each of which is characterised by its mass and its entropy. Typical industrial production processes [..] use a low entropy material fuel [..] to transform a high entropy raw material into a low entropy desired product. […] Since the by-products are characterised by high specific entropy they will generally be considered as useless waste” (Baumgärtner et al., 2002, p.4). This results due to the first and second laws of thermodynamics1 (Baumgärtner et al., 2002). However, the characterisation of a by-product as either something useful or as a waste is subjective and dependent on the potential uses for the material. Wastes generated as dispersed material in the form of air-borne emissions are not easily recovered and are best reduced through process improvements. On the other hand, by-products in waste water may be potentially recovered through the closing of material loops.
1
The first law states that energy and matter are conserved in an isolated system, thus raw materials and fuels are converted into products and by-products. The second law states that entropy is generated, thus the increase in entropy following a production process means that it is irreversible.
The Concept of Industrial Clusters
22
Joint Production can describe the following aspects of the production system: 1. Irreversibility: since the production process generates entropy 2. Limits to substitution: the conversion of high entropy raw materials to low entropy desired goods requires low entropy fuel for energy 3. The ubiquity of waste: the joint production of high entropy, often embodied as waste 4. Limits to growth, as a result of the combination of the above points (Baumgärtner et al., 2001) Joint production applies to chemical transformation processes and separation processes (Oenning, 1997). The input-output techniques from Industrial Ecology can be used to describe Joint Production through a set of linear or non-linear algebraic systems. Models from computer science, process engineering, and chemistry can be used to balance the material and energy flows in joint production processes (Spengler, 1999). 2.4
Industrial Symbiosis and Eco-Industrial Parks
Many terms are used to describe the implementation of the concepts of Industrial Ecology, such as: eco-industrial development, eco-industrial cluster, ecoindustrial network, industrial symbiosis, by-product synergy, by-product exchange, green twinning, environmentally balanced industrial complex, integrated resource recovery system, eco-industrial park, localised industrial ecosystems, industrial bio-system, zero-emission cluster, and eco-factory. 2.4.1 Industrial Symbiosis Research in Industrial Symbiosis tends to focus either on identifying possible synergies at existing industrial locations or on the greater scope of site planning. Various researchers have investigated potentials for improving energy or materials management through case studies. Suren Erkman conducted research in India to map material flows with the aim of better utilising existing resources, such as the incineration of textile and paper wastes rather than scarce firewood and the use of sugar mill waste as a raw material for paper-making (Erkman, 2000). Michael Frank (2003) investigated the economic and ecological effects of inter-company energy supply concepts by focussing on linked energy flows between six companies close to the Rhine harbour of Karlsruhe separated by a
The Concept of Industrial Clusters
23
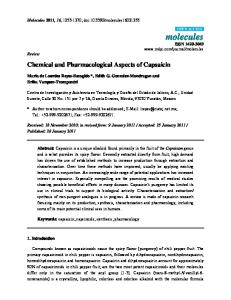
maximum of four kilometres. He identified technical solutions of inter-company energy supply concepts to identify the benefits of economies of scale and Cleaner Production through joint installations. Further studies carried out by the Institute for Industrial Production (IIP) of the University of Karlsruhe employ models to investigate the interconnection of energy and material flows to enable a quantitative assessment of questions related to energy systems on a company, national, or regional level (Rosen, 2007, p.97). In practice, governmental agencies may aid companies to match under-valued waste or by-product streams with potential users to help create new revenues or savings while simultaneously reducing environmental impact. This is termed ‘byproduct synergy’ and is a focus of the United States Business Council for Sustainable Development. Also, an initiative by Germany’s Fraunhofer Institute entitled CuRa (Cooperation für umweltschonenden Ressourcenaustausch) attempts to locate uses for waste residues, such as the use of organic waste from the food industry in a municipal fermentation plant (Schön et al., 2003). 2.4.2 The Eco-Industrial Park The concept of the eco-industrial park was developed in the early 1990’s. It is a setting in which businesses cooperate to efficiently share resources (materials, water, energy, infrastructure, etc.) leading to economic and environmental gains. Expressed another way, eco-industrial parks consist of members which are in industrial symbiosis. The objectives of Industrial Ecology are applied to minimise waste, close material loops, and maximise resource efficiency. Industrial symbiosis may involve transferring waste generated by one firm to another where it is used as a raw material. Energy usage may be optimised through cogeneration (using otherwise wasted heat from electrical generation) or heat recovery (where excess heat from one business is utilised elsewhere). Two prominent examples of eco-industrial parks are given below. Examples of Eco-Industrial Parks The best-known example of Industrial Ecology in practice is in the port city of Kalundborg, Denmark. Kalundborg’s network of materials and energy exchanges began to evolve in the 1970’s. The motivation behind most of the exchanges was financial, to find uses for wastes or unused energy. Later, the members realised that these exchanges also generate environmental benefits. This industrial
The Concept of Industrial Clusters
24
ecosystem consists of six main partners: a power station, an oil refinery, a biotechnology company, a producer of plasterboard, Kalundborg city, and a soil remediation company. Waste heat from the power plant provides residential heating to the city, sludge from various producers is used as fertiliser for nearby farms, farmers use excess yeast from the biotech firm for pig food, and excess refinery gas, fly ash, gypsum, and liquid sulphur are traded among the companies (The Kalundborg Centre for Industrial Symbiosis, 2007). The linkages between the partners are shown schematically below.
(Allenby and Graedel, 1994) Figure 2.1 Industrial Ecosystem at Kalundborg, Denmark As a result, surplus gas is no longer flared, some coal has been substituted with desulphurised gas and the city’s district heating system has replaced 3500 oil furnaces, formerly a significant source of air pollution. Each year, 30 kt of coal and 20 kt of oil are saved. Carbon dioxide emissions are reduced by 130 kt/a and water consumption is reduced by 25%. It was estimated that the 75 million USD investment in infrastructure to transport energy and materials corresponds to savings of approximately 15 million USD/a (Christensen, 2006, p.1). A second example is given by the Austrian province of Styria, where strict regulations and high waste disposal costs have motivated approximately 50
The Concept of Industrial Clusters
25
companies to sell or share their by-products. Industries involved in this network include agriculture, food processing, plastics, fabrics, paper, energy, metal processing, wood working, building materials, and a variety of waste processors and dealers. The Bruce Energy Centre is an example of an eco-industrial park which focuses on energy exchanges. Various firms are located around a nuclear power plant to take advantage of waste heat and steam generation. The site includes a greenhouse, a food processing company, a feed dehydration company, an alcohol company, and a polypropylene company. A further exchange network exists in Germany’s Ruhr area involving a steel company, a power plant, and various companies including cement and road construction companies. These and other examples of eco-industrial parks may be found in Cote and Cohen-Rosenthal (1998) and Fleig (2000). 2.4.3 Eco-Industrial Parks as Clusters Both eco-industrial parks and industrial clusters are based on the idea that manufacturers develop cooperative relationships in order to derive benefits. Ecoindustrial parks emphasise environmental benefits, while industrial clusters emphasise networking benefits such as knowledge transfer and financial benefits. Both require geographical proximity for their services or functions to be interrelated in some way. In a cluster, this interrelation is often based around a particular industrial sector to optimise buyer-supplier relationships, while ecoindustrial parks may consist of very diverse industries. Eco-industrial parks benefit from the same cooperation and proximity benefits which clusters do. Networking in eco-industrial parks may not only occur in material and energy flows, but also in transportation services, human resources, safety, and technical services. 2.4.4 Applicability of Industrial Ecology to this Work The ICPS is viewed as both a cluster and an eco-industrial park in this work. The ideas behind Industrial Ecology are useful in explaining the motivation and environmental benefits behind an ICPS. The work in Industrial Ecology has focussed more on the flow of specific elements than on categorised flows as this work does. Also, geographic administrative regions are often used as boundaries
The Concept of Industrial Clusters
26
rather than site boundaries. However, the ideological framework and tools are suitable for this study. Erkman’s (2001) eco-restructuring elements are relevant to the ICPS: 1) the linking of plants to optimise resources by exploiting by-products, 2) the closing of material loops to minimise waste, 3) the aim to reduce overall matter and energy requirements, and 4) the aim to reduce dependence on non-renewable energy sources. The use of physical input-output tables in Material Flow Analysis to describe the flows of mass and energy in a given system is appropriate to describe the flows in an ICPS. The flow of materials and energy which link production plants in an ICPS can be described as industrial symbiosis. Hence, the concept of the eco-industrial park and the tools of Industrial Ecology are thought to be the most suitable for investigating the various types of integration which exist in such sites. Thus, the analogy of the ICPS and the eco-industrial park is drawn.
The Integrated Chemical Production Site
27
3 The Integrated Chemical Production Site This chapter begins with an overview of process types in the chemical industry, followed by the focus of chemical companies and supply of olefin feedstocks. This is followed by a description of the ICPS, locations of major sites, and examples of sites. Finally, the different types of integration that exist in such sites are explained. 3.1 Process Types in the Chemical Industry The chemical industry is recognised as a complex industrial sector with an incredible number and diversity of products. “Some 70,000 chemical compounds are produced world-wide, and each has a distinct chemical nature, production route(s) and end use” (European Commission, 2003, pxli). Typically in an ICPS, few raw materials are the source for successive levels of chemical refinement. Few natural sources of carbon (crude oil, natural gas, and coal) are used to produce a limited number of high volume raw materials for the chemical industry, such as naphtha. Oil and gas are the main sources of organic chemicals produced in the world today. Few originate from the declining carbon source of coal or the emerging source of renewable biomass. These carbon sources together with water, air, and elements and minerals such as sulphur, phosphate, rock salt, and ores are the building blocks for the chemical industry. ICPS are generally based on large-scale organic chemical synthesis processes. The term ‘Large Volume Organic Chemicals’ has been used in literature (European Commission, 2003, pxli) to describe production plants characterised by: •
Basic chemicals used in large quantities as raw materials in the synthesis of other chemicals and rarely consumer products in their own right
•
Production in continuously operated plants
•
Products not produced in a range of products or formulations, compositions, or grades
•
Products which have a relatively low added value
•
Products which have a less stringent purity tolerance than fine chemicals
The Integrated Chemical Production Site
28
The term ‘large’ does not have a threshold value, but it has been suggested that capacities of 100 kt/a may characterise a plant as large; in Europe, a threshold of 100 kt/a would classify approximately 90 chemical products as ‘large’ (European Commission, 2003, pxli). The figure below shows products corresponding to levels of refinement in the chemical industry and examples of these product categories.
Examples and approximate number of substances
Raw materials
Basic chemicals
Intermediates & Industrial chemicals
Specialties & Fine products
Raw materials (~10): natural gas, naphtha, water, air, sulphur, phosphate, salt, ores Basic chemicals (~12): cracker products (ethylene, propylene), benzene, acetylene, syngas, ammonia Intermediates & Industrial chemicals (hundreds): aniline, butanediol, formeldahyde, solvents Specialties (thousands): polymers, surfactants, agro chemicals, pharma, colourants, coatings
Figure 3.1 Pyramid of Levels of Refinement in Chemical Production Basic chemicals are most commonly produced from steam cracking and refinement processes. Processing of these basic chemicals, such as introducing functional groups allows many more intermediates to be formed, such as alcohols, aldehydes, ketones, acids, nitriles, amines, and chlorides. Additionally, industrial chemicals such as formaldehyde are produced, which are used in various processes. Further processing of intermediates leads to the synthesis of specialties with a high level of functionalism and high commercial value, such as: •
Agricultural products, cosmetics, aroma chemicals, nutritional products, or pharmaceuticals
•
Polymer dispersions for adhesives, construction, paper chemicals, etc.
•
Specialty chemicals for detergents, textiles, leather, coatings, etc.
•
Plastics for automotive, electrical, household, mechanical / industrial parts
The Integrated Chemical Production Site 3.2
29
Focus of Large Chemical Companies
The focus of large chemical companies in the 1990’s can be categorised as petrochemicals, specialities / life-sciences, or diversified, exemplified by: •
Petrochemical: BP, Shell, ExxonMobil
•
Specialties / life-science: Ciba / Novartis, Clariant, Degussa, Rohm & Haas
•
Diversified: BASF, Bayer, Dow, DuPont
However, in 2000, many of the large chemical companies underwent restructuring driven by analyst and investor pressure for higher returns and demands for more transparency in the valuing of companies. Restructuring in the chemicals industry saw life-sciences split into agricultural and pharmaceutical sectors. Bayer and Dupont announced compartmentalisation (or de-integrating), creating spin-offs of either pure specialities or pure basics. Hence, fewer companies, such as BASF and Dow, were committed to a diversified strategy.
(BASFa, 2001) Figure 3.2 Focus of Large Chemical Companies The bars in the above figure represent increasing levels of refinement in the chemical industry, from oil and gas to pharma. These levels contain production plants which pass products to subsequent downstream processes. 3.3
Importance of Location and Feedstock Availability
The feedstocks of a refinery and cracker provide the building blocks for the value chains in a chemical production site. A refinery breaks down crude oil through
The Integrated Chemical Production Site
30
distillation and catalytic cracking to benzene, toluene, xylene, kerosene, fuel oil, gasoline, and propylene. Steam crackers break down either ethane or naphtha into different fractions: primary products ethylene (C2), propylene (C3), and butadiene (C4), secondary aromatics products benzene and toluene, as well as by-products such as hydrogen and fuels. The relative generation of products depends on how the cracker is operated (pressure, temperature, and residence time). An integrated refinery and cracker break down both crude oil and naphtha to make a full, combined range of feedstocks, as shown below.
(BASFb, 2001) Figure 3.3 Feedstock Preparation via Refinery and Steam Cracker In Western Europe, liquid naphtha from crude oil refining is the most important starting material in the chemical industry and accounts for 73% of ethylene production (European Commission, 2003, p.144). In Asia, naphtha is the main feedstock, whereas, ethane, due to its availability, is used in Saudi Arabia. In the United States, both ethane and naphtha are common feedstocks. A naphtha cracker has a higher feedstock flexibility and provides a greater variety of products, hence is a better basis for integration, as is shown in the following table.
The Integrated Chemical Production Site
31
Table 3.1 Cracker Products based on Different Feedstocks Product Ethane 4.3 4.2 0.4 56 30 0.1 1 0.2 1.6 0.2 0.2 1.8
Propane 1.3 25.2 0.5 40.9 3.6 0.5 11.5 5 4.5 1 0.1 5.9
Hydrogen Methane Acetylene Ethylene Ethane Propadiene Propylene Propane Butadiene Butylenes Butane C5/C6 C7+ non-aromatics Aromatics < 430°C > 430°C Total 100 100 (European Commission, 2003, p.154)
Feedstock Butane Naphtha 1.2 0.8 20.1 13.5 0.8 0.7 40.4 28.4 3.5 3.9 1.2 0.4 14.4 16.5 0.1 0.5 4.3 4.9 1.3 5.2 2 1 10.7 3.9 1.2 10.5 5.2 3.4 100 100
Gas-oil 0.5 10.9 0.2 20.6 4.8 0.5 14 0.8 4.9 3.9 0.1 1.9 2.1 12.5 2.6 19.7 100
Various separation processes following the cracker provide different fractions used to produce a variety of chemical products, as shown below.
Products Uses
(BASFb, 2001) Figure 3.4 Fractions from Naphtha Cracker and their use in an ICPS
The Integrated Chemical Production Site
32
Steam crackers have increased in size over the years, from around 200 kt/a in the 1960’s (Exxon Baton Rouge, Louisiana), to around 700 kt/a in the 1980’s and 1990’s (Freeport, Texas), and expanding to over 1000 kt/a in 2000 (Port Arthur, Texas and Iran). Production capacities per region are given below. Table 3.2 Steam Cracker Production per Region in 2005 Capacity (mil t/a)
Asia
W. Europe
N. America
S. America
Ethylene 15.8 21.6 28.7 3.9 Propylene 11.3 15.4 16.6 1.9 Benzene 8.7 8.4 7.6 1.1 (Association of Petrochemicals Producers in Europe, 2007) New steam crackers are being built in China to accommodate its rapidly expanding chemicals market. For example, China’s ethylene demand is growing by 10% annually, twice the world’s average, and is expected to reach 37 million tons in 2015 (Dow Jones Energy Service, 2006). 3.3.1 Distribution of Olefins An onsite cracker is warranted for large-scale sites requiring a wide range of cracker products. However, as liquid feeds predominate in Europe due to their relative abundance and ability to be easily transported, it may not be essential to co-locate a cracker (European Commission, 2005, p.144). Olefins are transported globally, as shown by the trade flow schematic below.
(BASFa, 2001) Figure 3.5 Trade Flow of Light Olefin Equivalents
The Integrated Chemical Production Site
33
On the other hand, ethane, extracted from natural gas, is difficult to transport, requiring special refrigerated ships. Pipelines are commonly used to distribute olefins from refineries and crackers to chemical companies which use them as feedstocks. One example is the West European pipeline network. The ethylene pipeline from Antwerp, shown below, is tapped by Exxon, Dow, and DSM on its way to Cologne, then diverges in Germany to the Ruhr in the North (Bayer, Wacker, Solvay, Ruhr-chemie, Veba Oel, Huels) and the Rhine in the South (ROW, RWE, Frankfurt, BASF Ludwigshafen). Another example is the olefin pipeline which starts at the integrated refinery and cracker in Port Arthur, Texas. This serves the sites west of it along the Texan shore and east of it in Louisiana along the Mississippi river.
(British Petroleum, 2005) Figure 3.6 West European Ethylene and Propylene Pipelines 3.4
Location of Major Integrated Chemical Production Sites
The strategic location of integrated chemical production sites is optimally chosen with respect to two main aspects: 1) the availability of feedstocks, and 2) the ability to transport sales products. An ICPS should have easy access to raw materials, such as ethylene (via an onsite cracker or pipeline) and natural gas, as well as utility provisions, such as water and electricity (for backup provision). Also, an ICPS benefits from being located close to a sea port for easy access to
The Integrated Chemical Production Site
34
sea freight, as shipping is an important mode of transport in the chemicals industry. The availability of surrounding land is important in case further expansion is required. Lastly, proximity to customers, generally producers of finished goods, is an important consideration. Finally, the site should be able to rely on outside infrastructure, such as communications systems and be able to provide for personnel. The locations of the most important integrated sites worldwide are shown in the map below. North America’s largest integrated chemical production area is along the Gulf Coast. The Port Arthur steam cracker supplies 830 kt/a of ethylene and 860 kt/a of propylene to numerous large-scale chemicals producers located in the region (BASFb, 2001). South America’s largest chemical sites are located in Brazil, in Sao Paulo and Rio de Janeiro, as well as in Venezuela.
Alberta Region
US Gulfcoast
Rhine area Antwerpen/ Rotterdam
Mizushima/ Yokkaichi Shanghai/ Nanjing
Persian gulf Camacari
Kerteh/ Kuantan Merak/Serang
Region Sao Paulo
(BASF, 2000) Figure 3.7 Location of Important ICPS Europe’s major chemical sites, shown in the following map, are located in: Belgium (Antwerp), Holland (Rotterdam, Moerdijk), Germany (Ruhr and Rhine in the west, other sites in the east), United Kingdom (Wilton/Teeside in the northeast, Baglan Bay in the northwest), Spain (Tarrangona in the south), and France (Le Havre and Dunkerque in the north and Marseille in the south).
The Integrated Chemical Production Site
35
(Czytko, 1999) Figure 3.8 Location of ICPS in Western Europe Antwerp is “probably the most diversified and integrated chemical production site of its kind" with 10 of the world's top 20 chemical producers and four steam crackers (Short, 2001, p.18). Atofina’s cracker provides feedstocks (ethylene, propylene, benzene, and toluene) to the value chains of various companies. Antwerp is the hub from which about 100 pipelines carry natural gas, ammonia, butadiene, isobutylene, chlorine, ethylene, propylene, nitrogen, fluid hydrocarbons, oxygen, and hydrogen (Short, 2001). Exxon Mobil uses ethylene to produce low density polyethylene, Borealis uses ethylene to produce high and low density polyethylene, and propylene to produce polypropylene. BP Amoco has value chains based on xylene, ethylene, and acetic acid, to produce olefins and acetates, among other products. Major chemical companies located here are Bayer, Dow, BASF, and Solvay. Antwerp and Rotterdam are Europe’s two largest ports in terms of tonnage and the chemical industries here are closely linked. “In the roughly 60-mile stretch between Antwerp and Rotterdam, enough chemical operations have been established that it is easy to accept Antwerp's claim to be the world's second largest chemical industry cluster after Houston“ (Short, 2001, p.18). Hauthal (2003) reviewed 25 of Germany’s major chemical sites, listing their size, the number of firms on site, the infrastructure supplier, and the type of production. Germany’s major sites are located around the west European
The Integrated Chemical Production Site
36
ethylene pipeline: Chemsite in North Rhine Westfalia (Marl, Gelsenkirchen), Bayer in Leverkusen, Hoechst by Frankfurt, and BASF on the Rhein in Ludwigshafen. Also, three large sites are located in the east: Bitterfeld, Leuna and Schkopau. In the Middle East, Saudi Arabia, with its rich oil reserves, is the location of two major integrated sites, the Yanbu site on the west coast and the Al-Jubail site on the east coast, which receive their feeds from Aramco. The Al-Julail site is the largest and most diversified site and consists of strong integration between various daughter companies of SABIC. Here polyethylene, polyvinylchloride, polypropylene, methyl tertiary-butyl ether, among other basic chemicals are produced. Yanbu, a second integrated site, has two major value chains which produce polyethylene, ethylene glycol, poly-ethylene-terephthalate, and polyether-sulfone, among others. A second middle-eastern country in which integrated petrochemical sites can be found is Iran. South East Asia’s major chemical sites are located in Malaysia and Singapore. Malaysia’s Kerteh site is centred around the national oil company Petronas, with BP as a major partner. Kuantan, a second Malaysian site just south of Kerteh, is home to an integrated site consisting of Petronas, BP, and BASF. Singapore’s Jurong Island site is the location of companies such as ExxonMobil, Shell, Sumitomo, Celanese, Ellba, Eastman, Dupont, and Chevron Phillips. As China is increasingly becoming more industrially developed, chemical clusters are developing along the Chinese coastal region, shown in the following map provided by BASF AG in 2005. These consist of various joint ventures involving international players such as: Dupont, BASF, BP, Huntsman, Bayer, Akzo Nobel, Dow, DSM, Atofina, and others. The largest sites are in Nanjing and Shanghai, as well as south in Ningbo and Daya Bay, and north in Beijing and Tianjin. Other chemical production sites can be found along the Pacific Rim, such as in South Korea (Yeosu, Ulsan).
The Integrated Chemical Production Site
37
Figure 3.9 Location of Chemical Clusters in China 3.5 Examples of Integrated Sites Examples of integrated chemical production sites are given below. First, BASF’s integration philosophy and its Ludwigshafen site are introduced, followed by examples of multi-company integrated sites. Aerial photos of these sites can be found in Appendix A. BASF BASF is one of the world’s largest chemical companies and was founded in 1865. It refers to its integrated production philosophy as ‘Verbund’ or ‘network’ in German. Integration is one of BASF's most important strengths and a cornerstone of the company’s strategy. BASF believes that the most efficient way to manage chemical production is through large, fully integrated sites that spread production costs over a large asset base. Its aim in physically integrating production chains is to ensure the lowest cost of production for bulk chemicals, thereby leading to subsequent advantages in downstream products. BASF believes that such integration reduces cyclicity (or financial vulnerability) and enables more controlled capacity expansions and better environmental control. BASF has remained committed to its integrated philosophy, which allows for the production of a diversified spectrum of chemical products. Also, BASF remains one of the top players in virtually all chemicals sectors (Isaac and Comer, 2000).
The Integrated Chemical Production Site
38
The BASF Ludwigshafen site, where the company was founded, produces approximately 8500 sales products and consists of over 7 km² of site area and 2000 buildings. This is the largest single-company integrated chemical production site in the world. The enormity of the Ludwigshafen site, which grew historically starting in the late 1800’s, is an exception today due to the huge investment required. According to Isaac and Comer (2000, p.35), “we have no doubt that there are genuine benefits to integration, particularly at Ludwigshafen; however, a difficulty arises when expansion of the concept is required. The unparalleled infrastructure already in place and high levels of asset depreciation mean new projects have difficulty competing with the earnings currently achievable at Ludwigshafen”. BASF has concentrated on expanding its integration strategy on a global level. In addition to Ludwigshafen, BASF has integrated sites in Antwerp Belgium, Tarragona Spain, Freeport Texas, Geismar Louisiana, Kuantan Malaysia, and Nanjing China (BASF, 2007). The Jurong Island Site in Singapore Jurong Island, located on the south tip of Singapore, is a chemical site consisting of more than 70 companies, including chemical and petrochemical companies such as BP, Celanese, ExxonMobil, Dupont, Mitsui Chemicals, Ellba, Chevron Oronite, Shell, and Sumitomo Chemical. The main members of the site are refineries, upstream and downstream petrochemical and chemical plants, and logistics companies. The site has infrastructure including a fire department and third party providers of utilities, tanks and terminal facilities, warehouses, and maintenance and repair centres (Jurong Town Corporation, 2006). ChemSite’s Marl Chemical Park in Germany ChemSite is the umbrella company which manages six large ICPS in Germany along the Rhine river and was founded in 1997. The Marl site is ChemSite’s largest site having an area of 6.5 km². It is comprised of various companies: Degussa, Air Liquide, Bayer Buna, BP, Sasol, ISP, Linde, and others and benefits from an extensive materials flow network. A range of basic chemicals and specialties are produced based on benzene, ethylene, propylene, butadiene, acetylene, syngas, phenol, fatty alcohols, and chlorine (ChemSite Initiative, 2006).
The Integrated Chemical Production Site 3.6
39
Description of the ICPS
Integrated Chemical Production Sites consist of several chemical production plants linked in terms of: materials, energy, logistics, infrastructure, and organisation. These types of integration will be explained in the next sections. A general schematic showing the material and energy flows is shown below. Raw materials and energy enter the site to be transformed into sales products, byproducts, or wastes and emissions. By-products may potentially be used as raw materials in further processes, wastes may be incinerated or disposed of, and energy may be recovered from processes producing excess heat or from waste incineration. Emissions
Consumer
Products
Useful by-product return
Disposal
Incineration
Wastes (solid, liquid, waste water)
Energy from excess production heat or waste incineration
Chemicals Production (incl. emissions and waste reduction)
Raw materials
Energy
Figure 3.10 Schematic of Materials and Energy Flows in an ICPS The core of the ICPS is its network of production plants and utilities providers, linked through materials and energy streams, shown in the following schematic. In addition, the ICPS relies on a management system to ensure the receipt and storage of raw materials and handling, storage, and transport of products.
The Integrated Chemical Production Site
Wastes: waste water, solid wastes, emissions
Heat recovery Steam Plant network Incinerator
Wastes Plant
Captive use products
WWT
Sales products (storage, packaging, transport)
40
Outputs
Plant By-products as feedstocks Core Infrastructure: utilities, power plant, etc.
Cracker products, raw materials, fossil fuels
Inputs
Figure 3.11 Schematic of Input, Core and Output Systems of an ICPS Inputs to the site include raw materials provided by external suppliers, such as fossil fuels, water, and potentially cracker products. Outputs are waste streams, which can be either emitted to the atmosphere, remain in treated waste water or are transported to an offsite disposal site, and external sales products and their associated logistical processes. 3.7
Types of Integration
Integration in this work refers to the shared use of facilities or the transfer of energy or materials streams for further use in physical and chemical processes. Integration may exist on different levels in the chemical industry. For example, energy or materials streams may be transferred within a unit operation, a plant, or a site in order to improve production efficiency. This is shown through various examples in the following table.
The Integrated Chemical Production Site
41
Table 3.3 Integration on Different Levels in the Chemical Industry Level Unit operation
Type of integration Energy Material
Process
Energy Material
Several processes
Energy
Material and Energy Material
Example Dryer with return of heated off-gas stream. Reactor with separation and return of product-containing waste stream. Reactor with heat exchanger to produce steam for use in other process section (eg. distillation). Separation of components (eg. VOCs by selective adsorption) and return. Re-use of cooling water from one process for another process. Transfer of a heated reactant stream to a downstream process. Incineration of waste from one process to produce steam for use in another process. Use of by-product from one process as a reactant in another process.
Thus, optimisation can be carried out in terms of energy and materials integration on different levels. This work focuses on integration on the site level resulting from the co-location of several processes. In the sections which follow, the types of integration found in an ICPS are introduced. Integration is manifested in the material and energy flows between site members, referred to as ‘materials integration’ and ‘energy integration’. Also, integration exists on account of the physical proximity of the members of the site allowing for onsite transfer of materials, referred to as ‘logistics integration’. 3.7.1 Materials Integration In this section, materials integration is described and two types of materials integration are defined. This is followed by examples of materials integration at companies and examples of specific cases of materials integration. Materials integration occurs if a product from one plant provides a feedstock for another plant. These connections may be part of a value chain. A value chain in the chemical industry represents the transformation of a basic feedstock into a consumer-near product through successively higher levels of refinement.
The Integrated Chemical Production Site For example, selected value chains for the polymer industry are shown below.
(European Commission, 2003, p.3) Figure 3.12 Selected Value Chains for Polymer Production
42
The Integrated Chemical Production Site
43
Each process step, normally represented by one production plant, is one link in the value chain. As such, these linkages are deliberate and based on the strategic design and construction of a value chain within an ICPS. Other material flows may be less intentional, linking two plants within an ICPS from different value chains. These two kinds of materials integration are defined here as: •
Vertical materials integration: the transfer of main products between plants in a value chain. Main products from one plant (eg. ethylene, methanol) may by be part of different value chains. Thus, one plant may be part of more than one value chain.
•
Horizontal materials integration: the transfer of secondary products (normally by-products or intermediates) from one value chain for use as raw materials in another value chain.
Materials integration may benefit a site in several ways. First, the chemical use of by-products or intermediates which would otherwise be considered as wastes means that these streams are not incinerated or disposed of. Second, the transfer of products between onsite plants, most often by pipeline, means these streams do not need to be transported to offsite customers. This type of integration is described in more detail under ‘logistics integration’ in the next section. Furthermore, the linkages may not be limited to chemical product streams, but may also consist of utilities such as water, which is covered under ‘shared infrastructure’. Examples of Materials Integration at Companies The main value chains at two integrated sites are shown on the following pages. Materials Integration at BASF At BASF, approximately 200 types of basic products and intermediates are produced, from which approximately 8500 commercial products are produced (BASF, 2007). The key BASF value chains are shown below.
The Integrated Chemical Production Site
(BASF, 2007) Figure 3.13 Examples of Materials Integration at BASF
44
The Integrated Chemical Production Site
45
Materials Integration at Marl The Marl site consists of many firms and integrated materials flows. The raw materials available by pipeline are: ethylene, propylene, hydrogen, and methanol (ChemSite Inititative, 2006). The following graphic provided by ChemSite shows some of the materials flows at the site.
Figure 3.14. Examples of Materials Integration at Marl Examples of Different Types of Materials Integration Vertical Materials Integration In the polystyrene value chain, the cracker products ethylene and benzene are converted to ethylbenzene. From this, styrene is formed and polymerised into polystyrene. Polystyrene is then processed as a thermal insulation material. Vertical and Horizontal Materials Integration Natural gas is used to produce acetylene, which is reacted with formaldehyde to produce butadiene. During acetylene production, synthesis gas is produced which is used for methanol production. Methanol is used to produce formaldehyde. Hence, the production circle is closed, as formaldehyde is
The Integrated Chemical Production Site
46
required to produce butadiene. Horizontal Materials Integration In the two examples below, co- or by-products are produced which are used as chemical feedstocks for further processes. For example, hydrogen chloride is produced as a by-product in methylene diphenylene isocyanate (MDI) production, which is used as a raw material in the production of vinyl chloride and polyvinyl chloride (PVC). A second example is the production of styrene as a co-product in the production of propylene oxide by the ethylbenzene process (Ullmann, 2000). In this route, 2.2–2.5 kg styrene/kg of propylene oxide are produced. Styrene can then be further used at the ICPS in a multitude of chemical processes (see Table 6.1). By-product as a Utility In the above examples, by-products are used chemically. Also, by-products may be used at an ICPS as a fuel or a utility, shown by the following example. Carbon dioxide is produced as a by-product in the steam cracker at Lonza Chemicals in Visp, Switzerland. It is produced during the absorption step of gas stripping. Of the 70 kt/a of technical grade carbon dioxide produced, 20 kt/a is accounted for by losses, heating gas, and preheating, 15 kt/a is used in various plants for inertisation or cooling, and the remaining 35 kt/a undergoes a further process step, purification to food grade carbon dioxide (Gerritzen, 2005). This example shows how a by-product stream can be used internally as a utility, as well as further processed to be sold offsite. 3.7.2 Logistics Integration One unique aspect of the ICPS is that materials exiting one plant may enter another onsite plant as a feedstock. Logistics integration describes this transport of integrated products, generally through pipeline linkages between plants. Pipes in an ICPS may transport not only raw materials between plants, but also utilities, wastes, and products in the form of gases, liquids, or solids. As a result, materials only need to travel short distances. Also, logistics integration describes the shared logistics facilities between plants in an ICPS, such as for storage. The onsite use of materials which exit one plant to be used as a feedstock in another plant is an economical advantage for the ICPS, as these materials do not
The Integrated Chemical Production Site
47
need to be transported to offsite customers. Whereas in a stand-alone site, these would need to be transported by sea, rail, or truck, incurring various logisticsrelated costs. Also, the environmental and safety aspects related to transporting dangerous raw materials are avoided for materials transferred within an ICPS. Examples of Logistics Integration at Companies Logistics Integration at the Lonza Site At the Lonza site in Visp Switzerland, 500 kt/a of raw materials and intermediates are transported via pipeline within the integrated site (Gerritzen, 2005). Logistics Integration at the BASF Ludwigshafen Site According to BASF, over 2000 km of aboveground piping provide short transport distances for products, energy, and utilities. Additionally, 211 km of rail track and 115 km of roads link the production plants. The below graphic shows the amount of goods transported in and out of the Ludwigshafen site in 2003. For outbound goods, the distribution was 44% by road, 33% by ship, and 22% by rail. Overall, for in and outbound transport, the distribution was: 47% ship, 33% road, and 20% rail. For Germany as a whole, the distribution was 65% road, 19% rail, and 16% by ship in ton⋅km (Verkehr in Zahlen, 2003). Thus, road transport is still a common mode of transport, as it provides the greatest flexibility in terms of transport route. On the other hand, ship or barge may be favoured if the site has a port, such as the BASF site, as it is the most economical for longer distances.
(Prengel, 2004) Figure 3.15 Inbound/Outbound Transport at BASF Ludwigshafen
The Integrated Chemical Production Site
48
An integrated site may also participate in transport provision. For example, at BASF Ludwigshafen, the operative handling of trains is by Rail4Chem and the integrated logistic control is by BASF. The operating benefits for BASF are: daily whole-train transports, optimisation of rolling stock by rapid rail car turnover, and transport guarantee for BASF rail cars. Commercial benefits are realised through the purchase of whole trains at production costs, the maximisation of train utilisation by third-party freight, and ultimately freight cost savings. 3.7.3 Energy Integration Energy is of fundamental importance in the chemicals industry, as it is needed inter alia to control the pressure and temperature of chemical processes. It is through the control of these two variables that the breaking down and formation of molecules from the elements occurs. Steam is a commonly used heat carrier in the chemical industry and is distributed via a pipeline network in an ICPS in order to provide the energy requirements of individual plants. Energy Provision As an integrated site has several plants to provide steam and electricity for, the energy requirements are much greater compared with a smaller stand-alone site. Due to these greater requirements, integrated sites may generate steam and electricity through a combined heat and power principle via cogeneration power plants, currently the most cost-effective and eco-efficient way to generate energy. This technology becomes more economically advantageous as a site’s energy requirements increase; thus economies of scale lead to reduced energy costs for larger sites. Small stand-alone plants may only require a steam boiler and source their electricity from the public grid. Hence, a comparison of energy provision costs for integrated and stand-alone sites must take economies of scale as well as technology type into consideration, as a site’s requirements will determine whether the use of cogeneration technology is warranted. Heat Recovery and Incineration The goal of energy integration is to minimise the overall energy requirements of the site. This may be done by balancing energy requirements and surpluses among plants within a site. For example, the energy released by processes involving exothermic reactions may be used to convert water to steam, which may be fed to the steam network. The steam network acts as a carrier for this
The Integrated Chemical Production Site
49
energy and allows it to be applied as a heat source in processes requiring heat. Thus, optimal energy integration is a balance between energy inputs and outputs. The potential benefits of energy integration arise, for example, from two sources in an ICPS: excess heat recovery and energy generation by waste incineration. Due to these energy sources, the use of fossil fuels like oil and natural gas is reduced. Pinch Analysis has been applied routinely to individual processes since the 1980’s (Linnhoff, 1982). Here, heating and cooling demands are reviewed to identify the most appropriate types and temperatures for heating and cooling utilities in a particular process. The company Linnhoff March developed a Total SiteTM analysis in the 1990’s to extend the technique and software from the single plant to an entire site. The software enables the optimal site utility structure to be identified for several individual processes. Minimum energy demands for the whole site can be determined and the user can choose between individual process optimisation and site infrastructure improvements. Using this method, inter-process or inter-plant integration opportunities may be identified. Excess Heat Recovery Excess heat recovery is the recovery of heat from one process to be applied in another process. For example, an exothermic reaction conducted in a reaction vessel containing an internal heat exchanger may be used to convert water into steam, which is then fed into the site’s steam network. Another example is the transfer of heated streams between processes. In an ICPS, chemical streams are passed from one process to another as feedstocks. The transfer of a warm rather than cooled down product from one plant to another plant can yield a few benefits, as shown in the schematic below: reduction of cooling water required in plant A, reduction of steam required in plant B, and reduction of one heat exchanger in plant B.
The Integrated Chemical Production Site
Standard Plant A
50
Utilisation of a Heated Stream Plant B
CW
Plant A
CW
CW
CW
Steam
Steam
Steam
Steam
Plant B
CW = cooling water
(based on BASF, 1995, p.19) Figure 3.16 Energy Integration: Example of Utilising a Heated Stream Waste Incineration and Substitute Fuels Another source of energy savings in an ICPS is the incineration of certain wastes from chemical processes. The heat provided by waste incineration is converted into steam via a waste heat boiler and fed into the steam network. A stand-alone production site may also have an incinerator. However, as for heat recovery, the steam generated by an individual plant’s incinerator may not be in balance with the plant’s steam requirements. An ICPS is expected to benefit more from onsite waste incineration compared to a stand-alone site, as a larger amount of waste is generated by several plants. This provides economies of scale warranting an onsite incinerator. Also, a steam network allows the steam to be transferred to other processes. Therefore, a better balance of energy requirements can be achieved. Offsite incineration facilities, due to their location, may not produce steam from the heat generated, but rather provide district heating for residential areas. This is the case for the sludge incinerator at BASF Ludwigshafen, which provides district heating for the Pfingstweide residential area (BASF, 2002, p.13). Also, by substituting fuels with certain chemical wastes, costs are reduced. For example, certain wastes may replace natural gas as a fuel in a power plant. Further, substitute fuels may be used as a fuel in production plants. These concepts are illustrated through examples from industry, as follows.
The Integrated Chemical Production Site
51
Examples of Energy Integration at Companies Energy Integration at Marl Three cogeneration plants at the Marl site provide 300 MWel and over 1 kt/h of steam. Gas pipeline systems are provided for waste gas used as heating gas. Also, residues from the site’s chemical plants are incinerated to provide energy for the site (ChemSite Initiative, 2006). Heat Recovery at Lonza At the Lonza site in Visp, Switzerland, excess heat is produced in the production of acetaldehyde from ethylene during various process steps. This benefits the site in an amount of 20 GWh (Gerritzen, 2005). Acetaldehyde
offgas
Distillation
Residue incineration incl. flue gas scrubber
Absorption
26 bar steam
Other liquid / gaseous wastes, water
Condensation III Warm water (district heat, steam production)
Condensation II water 120 ºC Condensation I water
130 ºC Reaction
110 ºC Compressor 140 ºC 3.5 bar steam 1.6 bar
Ethylene, Oxygen
(based on Gerritzen, 2005) Figure 3.17 Excess Heat Recovery in the Acetaldehyde Process at Lonza
The Integrated Chemical Production Site
52
Energy Integration at BASF and Lonza The BASF Ludwigshafen site requires approximately 18 million tons of steam annually. Therefore, efficiencies provided through process integration may have significant effects. Steam production via exothermic processes and waste byproduct incineration provide over half of BASF’s steam requirements. Also, the use of fossil fuels for electrical power and steam generation has been reduced by about 52% since 1976 while the production output has increased by 50%. BASF attributes these reductions to continuous improvements in energy integration. For the BASF Ludwigshafen production site, the steam demand of 2160 t/h (in 2003) was provided as follows: 43% by two power plants (one using 33% substitute fuels) and 57% by production sources, where 52% was supplied by excess heat from production and 5% by waste incineration (BASF, 2002). In Visp, Switzerland, 80% of the energy required for steam production comes from incineration or waste heat, which translates to a savings of 65 kt/a of heating oil. The graphic below shows the use of various sources for the generation of steam at the Lonza Visp site and two BASF sites.
Source of Steam Production for Site (%)
120
Waste incineration
Substitute fuels
Excess heat from production
Fossil fuels
100 *
80
60
**
40 *breakdown of nonfossil fuel energy sources not given **includes waste incineration
20
0 BASF Ludwigshafen
BASF Antwerp
Lonza
(based on BASF 2002, 2007, and Gerritzen, 2005) Figure 3.18 Steam Production Sources for BASF and Lonza Sites
The Integrated Chemical Production Site
53
Examples of Waste Incineration and Substitute Fuels at BASF In 2006, the BASF Ludwigshafen polystyrene plant was the first plant onsite to successfully switch to substitute fuels (BASF, 2006, p.71). Other examples of the use of chemical wastes as fuels are given below. In the production of isophytol, by-product streams are separated into a high-value and a lower-value product stream. The high-value portion is much larger and allows residue-free incineration as a high calorific substitute fuel. Another example is in the Citral plant, which is the production platform for Vitamins A and E, carotinoids, and aroma chemicals. Here vinylionol is produced, which requires highly concentrated sulphuric acid from the sulphuric acid plant. Contaminated sulphuric acid remains after the reaction. This acid is cleaved to sulphur dioxide in the splitting unit of the sulphuric acid plant. The organic residues are incinerated during this process, creating a source of energy. In the production of tanning agents, aqueous solutions are dried to fine powders in a heated air stream. The required energy is usually supplied by natural gas. During manufacture of another product in a neighbouring plant, a liquid, nonrecyclable hydrocarbon mixture is created. This waste is used in place of natural gas to heat the drying air. Therefore, the hydrocarbon mixture is used as fuel and waste disposal is not necessary. In the spray drying of dispersants and tanning agents, the plant saves more than 200 km3/a of natural gas (BASF, 2006). 3.7.4 Shared Infrastructure The extent of infrastructure required at a chemical site may vary depending on the specific site requirements. However, there are certain facilities required by all chemical sites. According to Hauthal (2003, p.37), the mandatory and optional services an infrastructure provider of a chemical site should offer are as follows: •
Mandatory services: − Availability of industrially zoned land − Energy (electrical, steam, natural gas) − Utilities − Waste water treatment and disposal − Infrastructure (roads and pipe bridge network) − Site planning
The Integrated Chemical Production Site
54
− Permission and clearance management − Safety and environmental protection (fire brigade, site environmental protection, coordination of safety management) •
security,
Optional services: − Logistics (rail service, vehicle services, freight forwarding) − Analytical laboratory services − Engineering services − Maintenance services − IT and communication services − On-site medical and occupational services, accident prevention − Material testing − Human resources, training, and education
Examples of Shared Infrastructure at Companies Shared Infrastructure at Synia Chemical The below schematic shows the layout of the Synia chemical production site, located outside of Shanghai. Networks for the distribution or collection of electricity, waste water, raw water, steam (not shown), and nitrogen (not shown) ensure that each production plant benefits from site-wide utilities provision (Synia Fine Chemical, 2005).
Wastewater Electricity Raw Water
(Synia Fine Chemical, 2005) Figure 3.19 Site wide Distribution Network for Electricity and Water
The Integrated Chemical Production Site
55
Shared Infrastructure at Marl There are 140 km of rail and roads, highway access, a cogeneration power plant, gases, waste water treatment and various plant-related services at the Marl site. There is a port (connected to the Rhine River and the North Sea ports) with an inland waterway and a railway station connected to the European railway network. Tank farms, laboratories, warehouses, and a container terminal are provided. Various utilities are provided: nitrogen, oxygen, hydrogen, pressurised air, and various types of water including a hot water grid. The Marl site offers waste disposal, including hazardous waste incineration and sludge incineration plants, and waste water treatment consisting of two biological treatment plants with sludge incineration. Further, facility management, purchasing, telecommunication, safety and environment, emergency response, security, fire brigade, maintenance, workshops, project and plant engineering, plant construction, communications, and human resources are provided (ChemSite Initiative, 2006). 3.7.5 Environmental Aspect of Integration Sustainable chemical production requires both economical and ecological efficiency. An ICPS allows economic and environmental requirements to be reconciled by minimising the use of resources and energy. This is done through reutilising by-products which would otherwise be disposed of and avoiding the transport of sales products through onsite use. Through the efficient large-scale provision of electricity and steam, fossil fuel usage and costs are reduced. Additionally, through heat recovery, overall energy requirements are reduced. Chemical wastes may arise from: incomplete chemical conversion, off-spec products, impurities in raw materials, by-product formation, catalyst waste, the reaction medium, or emissions from energy provision. Some wastes or residues can be reduced through process alteration, such as a new synthesis route or improved selectivity. Other wastes, which cannot be avoided even under optimum operation conditions, may potentially be reused within a process or as a raw material in a separate process, possibly requiring further physical or chemical processing. Reutilising residues by linking processes through horizontal material integration in an ICPS allows resources to be used more effectively. This decreases the use of solutions such as waste treatment, disposal, or incineration, which result in further costs, emissions, and resource use.
The Integrated Chemical Production Site
56
The table below shows how economic and ecological aspects are reconciled in an ICPS. Table 3.4 Economic and Ecological Efficiency through Integration Economic efficiency
Ecological efficiency
Goal
Turnover
Sustainability
Factors
Costs (eg. materials, Environmental impact utilities, waste treatment) Use of resources
Economic & Ecological efficiency via reductions in:
Resources Æ utilise chemical residues Energy Æ efficient utilities provision, heat recovery Emissions Æ onsite transport, etc.
For example, the BASF and Bayer integrated sites utilise significant amounts of residues. At Bayer Leverkusen in 1989, 1,200 kt/a of production residues were utilised: 80% directly, 15% recycled to production after chemical conversion, and 5% incinerated for steam production. This is more than the amount of waste produced in the same year of 875 kt. For BASF in 1987, 750 kt/a of residues were utilised in chemical production: 380 kt/a in product manufacture and 110 kt/a by outside companies. These quantities are very large with respect to the quantity of products sold at 8,300 kt/a and the amount of waste at 897 kt/a in the same year (Ullmann, 2000). 3.7.6 Organisational Integration Lastly, there is integration of an organisational nature, which can be described as intangible or conceptual, such as the sharing of information or knowledge. Examples are given below: •
Product innovation: finding new uses or value in waste products
•
Purchasing: centrally coordinated purchasing of goods and services
•
Corporate functions: human resources, strategy, administration
•
Safety and environment: safety concepts, transport safety, wastes, emissions
•
Knowledge management: databases, patents, coordinated research, IT systems, interdisciplinary cooperation (research, engineering, logistics systems, sales and marketing)
The Integrated Chemical Production Site
57
The communication and knowledge sharing which arises from organisational integration is certain to benefit a site. Various information flows or organisational systems which support production, marketing, and sales and distribution may help to standardise and increase transparency in the information flow regarding production planning, stocks, market situations, price developments, customer service, and invoicing and result in cost savings. Easier communication between R&D and production and marketing may shorten the time required for innovations to be realised. These more streamlined processes may lead to higher economic efficiencies. Additionally, it may be that these types of integration are even stronger if the site consists of only one or a few companies, as there are no additional barriers created by cross-company communication. This type of integration is not easily quantified and is of a more qualitative nature. Organisational integration is mentioned here for completeness, however, will not be addressed in this work.
Methodology for Quantifying Integration Aspects
58
4 Methodology for Quantifying Integration Aspects This work proposes a methodology as an approach for determining the economic and environmental benefits of integrated sites relative to less integrated sites based on different types of integration. First, site types are defined for the methodology. This is followed by an introduction of the nomenclature employed for tracking flows. Then the components of the methodology according to integration types are given. Finally, how the methodology is applied on the plant level is proposed. 4.1
Definition of Site Types
As discussed earlier, chemical production sites range from stand-alone sites consisting of a single production plant and basic facilities to large-scale integrated sites. An ICPS was defined as having several production plants, value chains, and facilities linked through various types of integration. In order to make the results of this work more plausible, an intermediate form of integrated site is introduced, the semi-integrated chemical production site or semi-ICPS. The difference between the ICPS and semi-ICPS is that the semi-ICPS has much fewer plants and less materials integration. The minimum number of plants in an ICPS is difficult to define, however, an approximation based on sites reviewed is 5-10 plants. As a result of the few plants in a semi-ICPS, vertical materials integration through value chains (or forward/backward integration) is either absent or limited to one or few linkages. Also, the semi-ICPS is defined as having no horizontal materials integration or chemical utilisation of by-products, again due to the small number of plants. Key infrastructure facilities (security, utilities, emergency response, fire fighting capabilities) are present in all three site types to varying extents. The ICPS and semi-ICPS have additional infrastructure, such as an incinerator, power plant, biological waste water treatment, etc. Whereas, stand-alone sites rely on external providers, such as the public power grid or external waste treatment. The site types are summarised as well as shown schematically on the following pages.
Methodology for Quantifying Integration Aspects
59
Table 4.1 Facilities and Integration at Site Types for Methodology Difference # of Plants Value Chains
Provision of power and steam Energy integration Materials integration
Logistics integration
ICPS Several (> 5-10) Value chains consisting of several plants (backward/forward integration) Onsite power plant for electricity and steam production, steam network Steam production via onsite incineration and heat recovery, transfer of heated streams Vertical integration (captive-use products), horizontal integration (use of by-products as feedstocks) Onsite transport of captive-use products and useable by-products
Semi-ICPS Few (< 5-10) Incomplete value chains
Stand-alone One No value chains
Same as ICPS
Steam boiler, electricity from public grid n/a
Same as ICPS (plus incineration of some by-product wastes) Limited vertical integration, no horizontal integration due to few plants
n/a
Less transfer of captive-use products
n/a
Sales products, Wastes
Steam Network Steam
Heat recovery
Plant
Electricity Plant
Byproducts
Plant
Captive-use
Power plant
Plant
Incinerator
Waste
Plant
Plant
Raw materials, Fossil fuels
Figure 4.1 Site Types for Methodology: ICPS
Methodology for Quantifying Integration Aspects Semi-ICPS
Stand-alone
Sales products, Wastes
Steam
Electricity
Power plant By-products to sales or waste Incinerator Waste
Plant
Sales products By-products Wastes
Plant
Plant
Steam
Captive-use
Steam Network
Heat recovery
60
Boiler
Plant
Raw materials Fossil fuels Electricity
Raw materials, Fossil fuels
Figure 4.2 Site Types for Methodology: Semi-ICPS and Stand-alone Sites 4.2
Mapping the Site
The methodology has its conceptual foundation in Industrial Ecology and Material Flow Analysis. The term mapping is used to describe the process of identifying value chains, material flows, and energy flows at a site. First, the main value chains at the site are identified. Second, the main production plants are identified and categorised according to the value chain they belong to. Third, the product and energy streams connecting various parts of the site are accounted for. 4.2.1 Nomenclature Material flows are designated by an ‘M’ and energy flows by an ‘E’. The letter following the M or E designates the group to which the stream belongs to. For example, Mv is a material belonging to a value chain (see Abbreviations List, p.vii). Furthermore, subscripts denote where the streams arise from and enter. The exiting and entering locations are designated by value chain and plant. For example, plant B in value chain 2 is designated as 2B. If the location is the incinerator or power plant, this is denoted by in or pp. As there may be more than one flow connecting two locations, a flow number is assigned. Thus, the streams are denoted as follows: M
group, exiting location, entering location, flow number.
below exemplify the use of this nomenclature.
The figures
Methodology for Quantifying Integration Aspects
61
ICPS Mwe
Msp
Mwd
Ms1C,1
EelPP Mwi1C,PP,1
Powerplant EiPP,SN Steam Network
WWT
Ms2C,1
Plant 1 C
Mc1B,1C,1
Mw2C,ww
Plant 2 C
Ms1B,1
Ms2B,1
Mc2B,2C,1
Mv1B,1
Ehr1B,SN,1
EiCI,SN
Mww
Mv2B,1 Plant 2 B
Plant 1 B
Incineration
Mu1A,2B,1
Mi1A, IN,1
Mc2A,2B,1
Mc1A, 1B, 1 Plant 2 A
Plant 1 A
Mrm, MH2O, Mf
Semi-ICPS
MwA,1
EhrB,SN,1
Steam Network
EiIN,SN,1
Stand-alone MsA,1
Plant A
MwiB,IN,1
EB,A
Plant B
Incinerator
Boiler
McA,B,1
MsA,1 MvA,B,1
Mw
Plant A
Legend: Site boundary Mv, Products in a Value Chain Mc, Captive use Value Chain Products Ms, Msp Sales Products Mu, Useful By-products Mrm, Mf, Raw materials, Fossil fuels Mwi, Waste for incineration Mwe, Mwd, Mww, Wastes Ei, Ehr, Eel, Energy various sources
Figure 4.3 Site Schematics exemplifying Nomenclature for Methodology
Methodology for Quantifying Integration Aspects 4.3
62
Assumptions
The assumptions and exclusions of the methodology are summarised below. •
Integration advantages in terms of procurement costs are not addressed.
•
The raw material and fossil fuel supplies are ample.
•
Products transferred between plants in an integrated site sell the products according to transfer prices which reflect market prices.
•
Selling cost, royalties, freight insurance, and the cost of inventory are not considered.
•
Costs for additional process steps to separate or refine a by-product for onsite use or sales are neglected and part of the plant from which it arises.
•
Streams categorised as waste in the ICPS are also wastes in a semi-ICPS or a stand-alone site. Only wastes exiting a plant are considered, not wastes such as fuel used directly in a plant.
•
The types of processes are similar at all sites.
•
The cost of waste heat boilers for processes with heat recovery and steam export is neglected and assumed to be part of the production plant.
•
Lowered emissions due to economies of scale within the chemical production plant are not considered.
•
Heat recovery is only considered for streams exiting a plant and not used within a plant.
•
Heat recovery is only used for steam production or the heating of materials streams and not for electricity production or district heating.
•
The costs of pipelines between integrated plants, between plants and utilities, between the power plant and plants (eg. steam network), and for tie-ins to olefins pipelines are not considered.
•
Storage, handling, packaging, transport, and materials management costs for waste streams disposed of or incinerated are neglected.
•
Country specific issues, such as incentives, taxes, or legal implications are not within the scope of this work. Import tariffs are included.
•
Benefits from organisational integration are not addressed, as these are outside of the scope of the work.
Methodology for Quantifying Integration Aspects 4.4
63
Materials Integration
4.4.1 Material Types in the ICPS Materials in an ICPS are mapped according to the following eight categories: •
Materials in Input System: − External raw materials for the entire site, including water − Fossil fuels for the site
•
Materials in the Core System: − Value chain products for captive use as onsite feedstocks − Internally used by-products not sold offsite − Materials incinerated to provide energy for the site
•
Materials in the Output System: − Sales products − Emissions to the atmosphere or waste remaining in treated waste water − Wastes transported offsite for land-filling
Conservation of Mass The sum of all mass flows entering the core system should equal the sum of all mass flows leaving the core system according to the first law of thermodynamics.
M f + M rm + M H 2O
= M sp
+ M we + M wd + M ww
Materials in the Value Chain First, value chains at a particular site are mapped. A material stream in a value chain, Mv, can be partly sold to offsite customers in an amount Ms. The sum of sales materials from all value chains at a particular site is referred to as Msp. A material in a value chain which is used internally for captive use as a feedstock to another plant in the same value chain is designated Mc. Therefore, the following holds true: Mv
= Ms + Mc
M sp
=
I ,J
∑M
i , j =1
s
(i, j )
for a particular value chain for I sales streams in J value chains
Wastes All materials exiting a plant in an ICPS which are not fed to another plant on the site as a chemical feedstock or sold are considered as wastes. If they can be
Methodology for Quantifying Integration Aspects
64
used as fuel either in an incinerator or power plant, they are termed ‘incineration wastes’, Mwi. If they cannot be used for fuel, they must be disposed of offsite and are designated Mwd. Other types of waste may be emitted either as emissions, Mwe, or in treated waste water, Mww. The following schematic shows how materials exiting a plant in an ICPS can be either: a captive use product, sales product, internally used by-product, or waste. ICPS Mww, Mwe, Mwd
Msp
Plant
Plant
Incinerator
WWT
Mi
Mu
Plant
Mc
Ms
potential reprocessing neglected
Mw
Mv
Plant
Mrm, Mf, MH2O
Semi-ICPS Msp
Mww, Mwi, Mwd
potential reprocessing neglected
Mu,s
Stand-alone site
Incinerator
Mu,i
Ms
WWT
Mu,wS-ICPS By-product
Msp
Mww, Mwi, Mwd
potential reprocessing neglected
Mu,s
WWT
Mu,wSA
Ms
By-product Plant
Plant
Mrm, Mf, MH2O
Mrm, Mf, MH2O
Figure 4.4 Materials Mapping for the Different Site Types
Methodology for Quantifying Integration Aspects
65
Sales Products and Captive use Products Sales product streams are not considered in the methodology on the site level, as for both an ICPS and a stand-alone site, they must be transported offsite to customers. Captive use products only travel a short distance by pipeline in an ICPS (or potentially in a semi-ICPS) compared to a stand-alone site. Therefore, they represent an economic benefit for the ICPS, as they do not need to be transported offsite. This benefit is covered later under the logistics section. Useable By-products Once all materials for the value chains are mapped out as either Mv, Mc, or Ms, the remaining chemical feedstocks used within the ICPS can be identified. These are by-products or intermediates which arise in one plant to be used as feedstocks in another plant of a different value chain (horizontal integration). These materials are referred to as ‘useable by-products’ and designated as Mu. If these streams arise in a stand-alone site, they may be either sold offsite, used as fuel, or disposed of. Therefore, it must be determined for each by-product stream, which of the three options is most appropriate. The decision chart below shows the process in determining the fate of a byproduct. It is assumed that the product is sold as a first choice. Thus, first it is determined if the product is sellable. A by-product may not be sellable if there is no customer nearby requiring the product, such as if the by-product has little value or a low volume. Or else it may be sellable once further processed, in which case, the useable by-product is considered a sales product. Then, if there is a recipient of the material within an ICPS, logistics costs are reduced for the ICPS compared to a semi-ICPS or stand-alone site from which the material would be transported offsite, incurring further logistics costs. If the by-product cannot be sold or it is uneconomical to further process the material, it is categorised as a waste and incineration or disposal costs are incurred. If the material can be incinerated in a residue incinerator in a semiICPS, steam can be produced for onsite use. The final choice is to dispose of the waste via waste water treatment, incineration (without steam production), or landfilling at an expense.
Methodology for Quantifying Integration Aspects
66
Thus, horizontal materials integration in an ICPS may result in either logistics integration or energy integration through waste incineration, depending on how the particular stream is categorised.
Production Plant Sales product
By-product
Yes
Waste
Can the by-product be sold without further processing?
No
Yes
further processing
Is part of the stream used captively onsite? Yes
No
Is it economical to further process the by-product
No
ICPS, Semi-ICPS, Stand-alone: • transport offsite
ICPS or Semi-ICPS: • onsite incineration cost (-) • steam production (+) Stand-alone: • offsite disposal cost (-) • no steam production
Yes
Can the waste be incinerated for steam production?
No ICPS/Semi-ICPS: • pipeline transport to other plant as raw material Stand-alone: • offsite transport Æ logistics cost (-)
Figure 4.5 Decision Flow Chart for By-products
ICPS, Semi-ICPS, Stand-alone: • disposal cost (-)
Methodology for Quantifying Integration Aspects
67
4.4.2 Economic Benefit of Materials Integration As the whole site is considered, material streams passing between two plants within the ICPS are only accounted for once; only product and not raw material streams are accounted for. The boundary is set around the production plants, from the first plant in the vertical chain (normally the first plant following the cracker) to the last. Economic Benefit of Useable By-Products In the methodology, a useable by-product in an ICPS, Mu, becomes either a sales product, Mu,s,SA, or a waste to be disposed of, Mu.d,SA, in a stand-alone site. In a semi-ICPS, this stream becomes either a sales product, Mu,s,S-ICPS, a waste to be incinerated, Mu,i,S-ICPS, or a waste to be disposed of, Mu.d,S-ICPS. Therefore, the following holds:
M u , ICPS
= M u , s , SA + M u ,d , SA
for a stand-alone site
M u , ICPS
= M u , s , S − ICPS + M u ,i , S − ICPS + M u ,d , S − ICPS
for a semi-ICPS
Thus, if Mu,i,S-ICPS > 0, then Mu.d,S-ICPS < Mu,d,SA and Mu,s,SA = Mu.s,S-ICPS The different options for the categorisation of an integrated by-product stream in an ICPS versus in a semi-ICPS or stand-alone site are shown below.
Incinerate Æ Sell Æ + Logistics costs + Incineration cost - Fuel Benefit ICPS
Waste Æ + Disposal cost
Semi-ICPS By-product
Plant B
Plant A
By-product Sell Æ + Logistics costs
Plant A
Stand-alone
Waste Æ + Disposal cost By-product Plant A
Figure 4.6 Fates of Useable By-products in Semi-ICPS or Stand-alone Site
Methodology for Quantifying Integration Aspects
68
If the useable by-product can be sold in a semi-ICPS or stand-alone site, then logistics costs are saved in the ICPS (covered under logistics integration). If it is possible to incinerate it for steam production in the semi-ICPS, then the semiICPS gains the value of steam (covered under energy integration), however, similar to the stand-alone site, incurrs costs for incineration (covered under materials integration). Otherwise, it is a waste stream and the ICPS saves the disposal cost (under materials integration). Additionally, the loss of the chemical value of the material must be considered in the semi-ICPS or stand-alone plant. For this, the chemical value of the stream must be determined. This may be difficult if the stream is a mixture of components, which is often the case. The chemical value of the stream represents a savings in the ICPS relative to both a semi-ICPS and a stand-alone site. If the material can be used as a fuel or as a utility (as shown by the Lonza example for carbon dioxide in Section 3.7.1), then this is a benefit in the semiICPS, where the fuel or utility value of the stream is determined and deducted from the chemical value of the material. Hence, the material-related cost savings of the ICPS relative to the stand-alone site and semi-ICPS are determined as follows:
S M , ICSPS , SA S M , ICPS , S − ICPS 4.5
= M u , wd , SA ⋅ c wd + M u , SA ⋅ vu
= M u ,i , S − ICPS ⋅ ci + M u , wd , S − ICPS ⋅ c wd + M u , S − ICPS ⋅ (vu − v f ,ut )
Energy Integration
Below, the energy provision for the different site types is briefly described. Benefits derived from shared energy provision are described more fully under ‘shared infrastructure’ in the next section. This is followed by a schematic showing how excess heat is recovered in integrated sites. 4.5.1 Energy Provision Power and Steam Electricity and steam are provided for the ICPS and semi-ICPS by an onsite power plant, whereas, electricity for the stand-alone site is provided by the public grid. An ICPS and a semi-ICPS have a steam network which provides high pressure steam in a centralised form by pipeline to the individual plants. From the
Methodology for Quantifying Integration Aspects
69
power plant, a steam network runs through the site to distribute steam to various plants and facilities. A stand-alone site does not have a steam network and steam is provided through individual boilers. Thus, an ICPS has the following:
•
Power plant which produces steam and electricity for the site
•
Steam network pipeline
•
Plants which take steam from the network
•
Plants which donate steam to the network
Incineration Waste materials may be incinerated in lieu of fossil fuels to generate energy. An ICPS and a semi-ICPS have one or more central incinerators in which wastes are incinerated to provide steam to the site via a steam network. Also, wastes may be incinerated in a power plant for both steam and electricity production. Whereas, a stand-alone site provides steam through a boiler and sends wastes offsite for disposal. 4.5.2 Excess Heat Recovery An integrated site can implement the concept of excess heat recovery better than a stand-alone plant because of the following two main reasons. First, the transfer of heated liquid streams or steam requires production plants to be in close proximity. Second, the presence of several processes may allow a better balance of heating requirements and surpluses for the overall site to be achieved. Heat recovery in an ICPS is assumed to only be used for the heating of chemical streams or steam production and not for electricity or district heating. Heat recovery is an advantage to the ICPS and semi-ICPS, as less steam needs to be produced for the site via the power plant. However, the extent to which a particular integrated site can benefit from this concept depends on the number of suitable processes providing heat to neighbouring plants via either heated streams or steam export to the network. Thus, the advantages of excess heat recovery depend on the balance of energy requirements, which is more likely to improve as the number of different processes at a site increases. The following schematics compare the energy flows in an ICPS or semi-ICPS to a stand-alone site.
Methodology for Quantifying Integration Aspects ICPS and Semi-ICPS
Stand-alone
Waste heat
Waste heat
Steam Network Steam, electricity
Plant
Heat recovery
Steam
Plant
Plant
Heated stream Waste as fuel
Power plant
70
Steam Boiler Fossil fuels, electricity
Incinerator Fossil fuels
Figure 4.7 Energy Mapping for the Different Site Types 4.5.3 Economic Benefit of Energy Integration Energy integration provides economic benefits to the ICPS relative to a standalone site through the following processes, which also reduce fossil fuel consumption:
•
Incineration and heat recovery Æ steam production
• Transfer of heated streams Æ reduction of cooling water, steam, or equipment In the determination of cost savings, the site-specific cost of steam and cooling water are used, including costs for water, fuel, capital, and operation. The cost savings for additional equipment, such as a heat exchanger, required to cool a heated stream if it is not integrated, is taken as the annual operating cost including the cost of capital.
S E , ICPS , SA
=
(c ⋅ (M St
St ,i
+ M St ,hr + M St ,hs ) + (M cw,hs ⋅ ccw ) + C eq ,hs )
In a semi-ICPS, as in an ICPS, waste incineration and heat recovery are practiced. The savings associated with the transfer of heated streams may also apply, as a semi-ICPS has more than one plant. Additionally, the semi-ICPS incinerates by-products which are used chemically in an ICPS, but cannot be sold in a semi-ICPS. This represents an energy benefit for the semi-ICPS and is
Methodology for Quantifying Integration Aspects
71
deducted from the ICPS savings. The additional cost for incinerating this stream is covered under materials integration.
S E , ICPS , S − ICPS 4.6
= − c St ⋅ (M St ,ui )
Logistics Integration
Pipes transport raw materials, utilities, and products among plants and utilities providers within an ICPS. In the methodology, the logistics cost savings for an ICPS relative to a stand-alone site arise from the onsite transport of: captive use materials, Mc, and useable by-products which are sellable, Mu,s, as both of these streams would otherwise require transport to offsite customers. Compared with a semi-ICPS, the logistics cost savings in an ICPS result from the onsite transport of useable by-products. Although the semi-ICPS may also benefit from the onsite transport of captive-use products, the volume is expected to be greater in the ICPS due to the presence of value chains. Logistics integration is shown schematically below. Through the onsite use of raw materials and products, transport and different logistics steps are reduced.
Raw materials available onsite
Products used onsite: • captive-use products • sellable by-products
Production Plant & Logistics Management
Consumer
Figure 4.8 Logistics-related Costs in a Stand-alone Site and Semi- ICPS 4.6.1 Logistics Management The steps in the logistics chain for chemical products are shown in the following schematic provided by BASF AG. Administrative processes which support the physical processes are described as logistics management. Costs are associated
Methodology for Quantifying Integration Aspects
72
with these processes, as they require personnel, information systems, office space, etc. Order
Product Allocation
Receipt of Order
Transport
Order M’gmt
Arrangmt
Billing
Invoice
Material Management
Customer Raw Materials Delivery
Handling Internal Transport
Production
Packing
Storage
Filling
Customer Dispatch
Finished Goods
RM order
Raw Material
Requirements planning
Supplier
Figure 4.9 Logistics Chain for Chemical Production The main cost blocks associated with logistics processes for chemical production sites are:
•
Filling and packaging
•
Storing/warehousing: packed goods in warehouses, bulk goods in tank terminals, eg. at a port before containers are loaded onto ships
•
Dispatch: commissioning, site transportation, labelling for shipping
•
Freight: outbound freight, transportation to distribution centres, inbound freights for returned goods, rental cost for cars and containers
•
Order-/material-management: management management of all transportation modes
of
orders
and
materials,
The costs for logistics-related management processes and warehousing used in this work are based on results from an internal company study2. The costs varied little among the regions of America, Europe, and Asia and were on average in 2004 per ton of product:
•
Dispatch costs = 1 €/t
•
Order and materials management = 4.6 €/t
•
Filling of liquid bulk materials = 4 €/t
2
The company is not named in order to maintain confidentiality.
Methodology for Quantifying Integration Aspects
•
73
Offsite warehousing = 10 €/t
For materials transferred between plants within a site, management-related activities are required, such as monitoring inventory and communication between the two plants, at a cost of 1 €/t. 4.6.2 Transport Chemical products may be transported by truck, rail, inland waterway, sea, or air. The transport mode or combination of modes selected depends on the location of producer and consumer, cost considerations, and other constraints such as availability and urgency. A study by Börjesson and Gustavson (1996) found the most cost effective mode of transport to depend on distance: below 100 km, road transport is the most economical, after which rail becomes most economical up to 110 km, followed by ship. In general, costs are highest for air, followed by road, rail, barge/inland waterway, and sea freight. However, as costs cited by different authors vary (see below), transport costs are determined by inquiry for this work. Table 4.2 Transport Costs per Mode of Travel from Different Studies Author , Transport cost (€/ton⋅km) Air Knell 3 0.102 4 SCI Verkehr GmbH Prognos AG 5
Road 0.036
Rail 0.025 0.035 0.086
Barge 0.015 0.016 0.012
Sea 0.001
The specific cost for road transport was found to decrease with distance, as shown in Figure 4.10, based on data from the BASF AG logistics department in 2005. However other factors (supply/demand, transport supplier, etc.) also influence the cost, which is shown by the specific cost for transport to Montpellier and Rome, which deviate slightly from the trend.
3
Knell, 2003, p.96 Alles et al., 2000, p.74 5 Hobohm et al., 2006, p.40-41 4
Methodology for Quantifying Integration Aspects
74
0.15
Truck transport cost (€/t/km)
D-Hagen
0.1
D-Hamburg I-Rome E-Alicante
F-Montpellier
P-Lisbon
0.05
0 300
800
1300 Distance (km)
1800
2300
Figure 4.10 Specific Road Transport Cost versus Distance travelled External Costs for Transport It may be noted that transport of products or raw materials between production sites carries not only the costs associated with the actual transport (vehicle, personnel, fuel), but also has external effects. In a study by Schreyer et al. (2004, p.14), the external costs for the transport of goods were determined within Europe. These consist of the costs related to: accidents, air pollution, noise, nature, urban effects, climate change, up- and downstream processes and are given as follows (in €/t/km): 0.0878 for road, 0.0179 for rail, and 0.0225 for waterway. These external costs which society pays for transport are in some cases higher than those of the actual transport. Also, it should be noted that transport by rail poses the lowest cost to society compared to road to waterway transport. Additionally, the safety aspect of the transport of dangerous goods has an even higher risk or potential cost associated with it. 4.6.3 Storage The storage requirements are reduced for integrated plants. If a material is transferred between plants at different locations, each location will need a storage tank at its site. However, if a material links two plants in an integrated site, only one storage tank may be required to buffer any supply/demand differences between the two plants. Thus, the storage requirements are expected
Methodology for Quantifying Integration Aspects
75
to be at least twice as high if the plants are separated due to storage at each location. In fact, if the plants are connected by pipeline within the ICPS, then storage requirements may even be less, as handling is not required. Additionally, storage requirements for common raw materials are reduced at an ICPS as these can be centrally stored. Storage requirements are determined according to a balance of the frequency with which the tank must be refilled, tank investment costs, raw material/product inventory costs, and strategic factors, such as the necessity to hold inventory. For the methodology, the storage requirements for all materials requiring transport in non-integrated sites (captive use products and useable by-products) are determined on a case by case basis, as these depend on the product and process considered. Economic Benefit of Logistics Integration In applying the methodology, first the materials available onsite in the ICPS are determined. Then the relative amounts transported by road, rail, and ship are determined. Next specific costs for transport and other costs such as port charges are determined. As the semi-ICPS may have some captive use streams, the amount of captive use materials in the ICPS needs to be determined.
S L , ICPS , SA =
(∑ Mu, s + ∑ Mc
S L , ICPS , S − ICPS =
ICPS , SA
(∑ Mu, s + ∑ Mc
) ⋅ c
lm
ICPS , S − ICPS
n + ∑ Ft , x ⋅ D x + CWarehouse + C Storage + C other x =1 n ⋅ clm + ∑ Ft , x ⋅ D x + CWarehouse + C Storage + C other x =1
)
for n transport modes 4.7
Shared Infrastructure
This section investigates potential benefits in integrated sites for shared infrastructure. First, infrastructure is defined and what is involved in planning an integrated site is covered. Next, the costs for energy provision are reviewed, as this is normally one of the most costly aspects of infrastructure. This is followed by a review of the costs for utilities provision. Some facilities are not investigated, as they tend to only exist in larger sites and not in stand-alone sites due to the high capital investment required. A standalone site will utilise these services offsite; examples are waste incineration and
Methodology for Quantifying Integration Aspects
76
biological waste water treatment. The external operating costs for such services may be comparable with those in the ICPS, as both may achieve similar economies of scale. However, costs may differ due to transport to the service provider or lower performance in the ICPS, as the service is not a core competence of the site. Also, it should be noted that such services, even if they are located within the ICPS, may be operated independently, such as a canteen or site security. Thus, infrastructure not included here are: a canteen, port or train station, fire-fighting facility, safety/environment, security, roads, and piping. Facilities included in the methodology are those which exist at both a stand-alone site and an ICPS, such as utilities and buildings. Facilities which normally exist for each plant, but may be partly centralised in an ICPS, such as laboratories, a maintenance workshop, or storage facilities are considered if applicable to the case study. Costs for waste incineration and waste water treatment are also investigated if deemed appropriate for the case study. 4.7.1 Definition of Infrastructure When a chemical production site is conceived, its facilities and areas are assigned to one of three categories: inside boundary limits (ISBL), outside boundary limits (OSBL), or infrastructure, defined below: Table 4.3 Definitions of ISBL, OSBL and Infrastructure Definition
Examples
ISBL Installations required to operate the plant regardless of site location - Process equipment - Production building/control room - Motor control centres - Instrumentation/ controls - Process tanks - Laboratory - Process safety
OSBL Site-dependent installations, mainly to connect the plant to the infrastructure - Tank farms for raw materials/products - Production-related power supply, switch gear, transformers - Connection of production unit to site (roads, channels, railroads, pipe racks, product/utility pipelines)
Infrastructure General installations for the whole site - Site preparation - Central tank farms/ warehouses - General pipe racks - Roads/access ways - Utilities and power - Central waste disposal - Fire-fighting facilities - Telecommunications - Weigh bridge
Methodology for Quantifying Integration Aspects
77
4.7.2 Investment Cost The costs involved in site development can vary greatly depending on the scope of the project and the surrounding conditions. To determine how infrastructure costs relate to the total project costs, eight chemical production sites constructed for a chemical company were reviewed. The investment amount allocated to infrastructure relative to the total project cost was approximately 30% based on projects of varying size and production process type, as shown below. Although economies of scale exist for many aspects of infrastructure (as will be shown in the following sections), the investment cost increases with increasing site size. A review of the projects showed that as the site size increases, the scope and type of onsite facilities changes, such as onsite biological waste water treatment or incineration facilities in a large site.
Infrastructure Investment Cost (mil €)
80 70 60 50 40 30
y = 0.3011x 2 R = 0.9858
20 10 0 0
50
100
150
200
250
300
Total Project Cost incl. Infrastructure (mil €)
Figure 4.11 Infrastructure Investment Costs versus Project Costs 4.7.3 Operating Costs In this section, the costs of utilities are reviewed in more detail. Utilities are an essential component of process plants. They include electricity, water, steam, inert gas, refrigeration, high temperature heating oil, and compressed air. They are generally part of the infrastructure of the site, however, may be integrated within the process plant in some cases. For example, the steam and refrigeration systems in an ethylene plant are thoroughly integrated into the ethylene production process (PEP report 136A, 1995, p.2-1). First, energy facilities are investigated, as this generally represents the greatest cost of all the utilities.
Methodology for Quantifying Integration Aspects
78
4.7.4 Steam and Power Provision The requirements for steam and power are provided for differently according to site type. This research compares the costs for energy provision based on the most commonly found technologies in the chemical industry. The overview of boilers and electricity costs is based on PEP report 136A (1995, updated for inflation). Electricity from the Public Grid The price of electricity obtained from a public grid varies greatly depending on location and sales conditions. For example, within the United States, the average electricity sales price varied by approximately 50% depending on location (3.9 cents/KWh in south central U.S. versus 8.5 cents/KWh in New England, compared with the U.S. average of 4.7 cents/KWh in 1994, PEP report 136A 1995). Additionally, many factors affect the cost, such as hours of use, transmission voltage, distribution voltage, and load factor. Also, other charges come into play: demand charge, energy charge, fuel cost adjustment factor, etc. Thus, the exact electricity cost for a particular plant built either within an integrated site or as a stand-alone plant will depend very much on the location of the plant. However, there is a general trend that the greater the electrical consumption, the lower the price. Also, if the customer can accept an interruptible power service, significant cost advantages can be achieved. The below table is indicative of the trends in electricity prices. Table 4.4 U.S. Electricity Prices for Different Conditions Electricity service
Operating cost including capital charges (US cent/kWh) 4.33 4.19 2.73
2,000 KVA 20,000 KVA standard rate 20,000 KVA 30 minute interruptible rate (PEP report 136A, 1995, pp.5-5, 5-8) Since the case of electricity is so specific to location, the table is only given as an indication of price differences according to demand and conditions. In this work, electricity prices are determined for specific locations and conditions.
Methodology for Quantifying Integration Aspects
79
Steam Preparation Steam is prepared in industrial facilities using either a boiler or a cogeneration system. Industrial steam boilers exist in either fire-tube or water-tube configurations. For fire-tube boilers, combustion gas passes through tubes surrounded by boiling water and for water-tube boilers, water is inside the tubes which are surrounded by hot gas. Fire-tube boilers are uneconomical beyond approximately 13 t/h of steam. Water-tuber boilers can be built much larger, up to about 450 t/h and 125 bar for chemical applications. The main types of boilers and costs relative to capacity are given below:
•
Package boilers: shop-assembled units that require field erection, offering compactness, short delivery times and low costs. Their physical size is limited, so they have a limited practical capacity of approximately 160 t/h of steam and 100 bar.
•
Field-erected oil/gas-fired boilers: offer higher steam and pressure capacity (450 t/h steam at 125 bar) than package boilers, but are more expensive.
•
Coal-fired boilers: come in a few variations. Stoker boilers have a coalfeeding device in the firing zone and are generally sized below 135 t/h steam due to economics and coal handling. Pulverised coal-fired burners have larger capacities, above 100 t/h steam. 350 Pulverised coal Stoker coal Field erected Package
Operating cost (€/kgst)
300 250
10 bar 10 bar 10 bar 10 bar
40 bar 40 bar 40 bar 40 bar
100 bar 100 bar 100 bar 100 bar
200 150 100 50 0 0
100
200 300 Boiler capacity (tst/h)
400
500
(based on PEP report 136A, 1995, pp. 6-23,29,35,41) Figure 4.12 Operating Cost including Capital Costs for Steam Boilers
Methodology for Quantifying Integration Aspects
80
Cogeneration The following section is based on PEP report 181A (2001). Cogeneration refers to systems which sequentially produce both steam and electricity from the same energy source. Compared to the production of steam and electricity in separate facilities, cogeneration can reduce fuel consumption by 25 to 35%. Gas Turbine Combined Cycle (GTCC) cogeneration is the most popular and efficient cogeneration system in commercial use today, as it offers high thermal efficiency, short installation time, quick start-up and low installed costs. Natural gas or liquid fuel is burned with compressed air in a turbine combustor. The hot combustion gas (up to 1288ºC) drives a gas turbine to generate electricity. The exhaust gas from the gas turbine (up to 566ºC and containing 10-12 volume% oxygen) passes through an unfired heat recovery steam generator to produce steam. The steam may be produced at two pressures, lower pressure steam is passed directly to the processes, whereas the higher pressure steam can move on to an extraction steam turbine to generate additional electricity and extract lower pressure steam. These systems are also available in various configurations. Power can be cogenerated from steam via either a topping cycle (where electricity is generated from the high temperature source and the lower temperature level is used to produce low pressure steam) or a bottoming cycle (where power is recovered from a low temperature energy source, which would normally be rejected to a heat sink). Bottoming cycles are generally process-oriented and site-specific and are small in number. Topping cycles are the predominant form of cogeneration and may use a gas turbine to generate electricity followed by heat recovery from the hot exhaust gas to produce steam (either for processes or the generation of additional electricity). Another form is using non-condensing steam turbines in which high pressure steam passes through a turbine to produce electricity, the low pressure steam which exits is used for processes. Cost Comparison of Different Energy Provision Configurations In this section, the costs for different configurations for energy provision are calculated. The following three cases are shown schematically below: Case 1: Steam Boiler, using power from the public grid Case 2: CHP (combined heat and power) Boiler Case 3: CHP Boiler + Gas Turbine
Methodology for Quantifying Integration Aspects
81
In case 2, a combined cycle system is used to produce both steam and power in one operation. In case 3, natural gas is burned in a gas turbine to generate power. The residual thermal energy from the gas turbine exhaust gases at 542ºC is recovered in a heat recovery steam generator. Case 1
Case 2 STEAM BOILER
FUEL
STEAM BOILER
FUEL
EXHAUST
EXHAUST FEED WATER
FEED WATER
ELECTRICITY FROM PUBLIC GRID
ELECTRICITY
STEAM TURBINE
STEAM
GENERATOR
STEAM
Case 3 AIR INLET
FUEL COMBUSTION GAS TURBINE
GENERATOR
ELECTRICITY
GAS TURBINE WASTE HEAT
COMPRESSOR
HEAT RECOVERY STEAM GENERATOR
EXHAUST
FEED WATER STEAM TURBINE
GENERATOR
ELECTRICITY
STEAM
Figure 4.13 Comparison of Steam and Power Provision Configurations The variables used in the calculation and steam demand profile are given in Appendix B. The following parameters were selected for the base case:
•
Steam pressure: varied from 4 to 125 bar, base case 16 bar
•
Steam demand: varied from 10 to 650 t/h, base case 250 t/h
Methodology for Quantifying Integration Aspects
•
82
Electricity demand: varied from 10 to 400 MW, base case 200 MW
The range for steam demand and electricity demand are representative of the lower and upper ranges for chemical production sites: a small stand-alone site at the bottom range and an ICPS at the top range. In each case the boiler efficiency is set at 90%. Case 1. Boiler with Electricity from Grid In this case, the site has 3 boilers. Boiler 3 is the reserve and the demand is split between boilers 1 and 2 (boiler 1 at 50% of maximum demand and boiler 2 at current demand – steam production of boiler 1). The number of personnel is 6. Case 2. CHP Boiler In this case, the steam demand is higher than for case 1 (280 t/h): steam demand for the site (250 t/h as in case 1) plus the steam demand for the power plant (34 t/h for base case) minus the steam generated by injection water (4 t/h). Again, there are 3 boilers, where boiler 3 is the reserve and the demand is split between boilers 1 and 2 (boiler 1 at 50% of the maximum demand and boiler 2 at current demand – steam production of boiler 1). Live steam at 120 bar and 520°C is used for the auxiliary steam demand in an amount of 14% of the total steam demand. Also, injection water in an amount of 3% of the steam demand for the site and power plant is required for cooling the turbine. For the base case, the steam turbine generates 34 MW of the 200 MW required. Also, the auxiliary steam demand required by the power plant is 1 MW. Thus, 167 MW must be taken from the outside grid. Again the number of personnel is 6. Case 3. CHP Boiler with Gas Turbine In this case, one boiler is equipped with a gas turbine, the other two are CHP boilers. Boiler 1 is sized to meet the average steam demand. Boiler 2 fulfils excess steam requirements over the average demand and boiler 3 is again the reserve boiler. The boilers are sized at 75% of the total demand, compared to 50% in cases 1 and 2 to safeguard against failures, more common in gas turbines. The number of personnel is set at 12. For the base case, the gas turbine/steam turbine configuration generates 161 MW of the 200 MW required. The auxiliary electrical demand was set at 2% (3 MW). Thus, the electricity required from the grid is 42 MW.
Methodology for Quantifying Integration Aspects
83
The overall operating costs are a function of:
•
Fixed costs: capital costs (boilers and turbines), maintenance, capacity charge, back up electricity, personnel
•
Variable costs: fuel, demineralised water, variable charge for electricity, (minus credit for electricity)
The specific capital costs for the steam boilers (€/tst) and turbines (€/kW) are based on the following functions, generated from fitting actual cost data:
c Boiler
a = 2.2 ⋅ 10 ⋅ M St ⋅ 7500h
0.3
5
cTurbine = − 101.7 ⋅ ln ( El ST +GT ) + 1211.7 Electricity generation for both the steam and gas turbines (MW) was determined as: a h 1000kg MWel E = (hST ,in − hH 2O ) ⋅ M St ⋅ ⋅ ⋅ ⋅ 7500h 3600 s t MWth where the electricity to steam ratio is based on the following function: MWel MWth
a = 0.0732 ln M St ⋅ + 0.454 7500h
The fuel demand is determined based on the following efficiency function: MW f MWel
= 0.0348 ln (MWel
) + 0.2142
Below, the total efficiency of the system is shown relative to capacity: 100% 90% 80% Total Efficiency
70% 60% 50%
ε Total
40% 30% 20%
MWel MWel MW f + = MW MW f el MWth
10% 0% 0
50
100
150
200
250
300
350
Capacity (MWel)
Figure 4.14 Efficiency of CHP Plant versus Capacity
400
Methodology for Quantifying Integration Aspects
84
Below a summary of the costs for the three cases is given. Table 4.5 Cost for Steam and Power Generation Item Electricity demand Steam demand Generation: Steam GT+ST Steam Boiler Electricity Fuel Demand Investment Fixed Costs Fuel Costs Electricity Costs Total Costs
unit MW t/h t/h t/h MW MW mil € mil €/a mil €/a mil €/a mil €/a
Case 1 200 250
Case 2 200 250
Case 3 200 250
0 250 0 209 18.632 3.887 27.469 74.097 105.453
0 282 33 252 48.648 9.807 33.089 62.061 104.957
222 28 141 367 128.093 27.286 51.281 21.159 99.726
Sensitivity Analysis A sensitivity analysis for the base case was carried out in order to see how the variance of certain cost assumptions affects the overall costs. The costs for fuel, electricity, steam demand, and electricity demand are varied. The sensitivity analysis shows that case 3 is more dependent on changing fuel prices due to its higher fuel consumption compared to cases 1 and 2. However, cases 1 and 2 are more dependent on changing electricity prices. The overall operating cost in all cases depends highly on the electricity demand and less strongly on the steam demand. The results of the sensitivity analysis are given in Appendix B. Variation without Electricity Export If a site has high steam requirements, which when produced via a GTCC, provides electricity in excess of its own requirements, then this excess electricity can be exported (case 3). Below, the calculation was made for a steam requirement of 400 t/h in order to meet the criterion that excess electricity is produced. However, it may be more desirable to meet the excess steam requirement using a boiler without a gas turbine (boiler 2) and build a smaller boiler with gas turbine (boiler 1) if electricity export is not economically attractive versus the higher investment costs for a larger gas turbine. This is represented by case 4, where the steam production in boiler 1 is limited. A summary of the results of this calculation are given below. Which case is most economically attractive depends on the particular conditions, such as the cost of electricity.
Methodology for Quantifying Integration Aspects
85
Table 4.6 Cost for Steam and Power Generation without Electricity Export Item Electricity demand Steam demand Generation: Steam GT+ST Steam Boiler Electricity Fuel Demand Investment Fixed Costs Fuel Costs Electricity Costs Total Costs
unit MW t/h
Case 1 200 400
Case 2 200 400
Case 3 200 400
Case 4 200 400
t/h t/h MW MW mil € mil €/a mil €/a mil €/a mil €/a
0 400 0 335 24.791 5.099 43.950 74.096 123.145
0 452 53 403 72.378 14.474 52.943 54.850 122.267
356 44 234 585 193.776 41.276 81.665 -11.118 111.823
290 110 187 477 156.898 33.359 74.842 4.797 112.998
Investment Cost Compared with Other Sources The results of the calculation are compared with the calculation based on Boeddicker as given in Frank (2003, pp.41-43), the PEP report 181A (2001, pp.69 to 6-17), and existing cogeneration plants, summarised below. Table 4.7 Examples of Cogeneration Plants and Investment Costs Location
MW
BASF Ludwigshafen6 BASF Antwerp6 Muenster7 Duisburg, Germany7 Electrabel / Solvay, Italy8
440 400 170 240 400
Start-up year 2005 2005 2006 2006 2006
Investment Cost (mil €) 240 230 75 110 200
€/KW 545 575 441 458 500
The cost estimate used in this work lies between those in PEP report 181A (2001) and Frank (2003) and shows a lesser dependence on capacity than the other functions. The actual cases were found to have lower costs than the estimates and were independent of capacity.
6
BASF corporate communications, 2006 Reuters, 09.12.2002 8 Electrabel press release, 18.10.2004 7
Methodology for Quantifying Integration Aspects
86
Specific investment costs (€/KWel)
2500 Specific cases Michael Frank, 2003
2000
PEP Report 181A this (Series2) work Log.
1500
1000
500
0 0
100
200 300 Capacity (MWel)
400
Figure 4.15 Comparison of Costs for Cogeneration Below, the operating costs for different levels of steam generation are determined with increasing CHP capacity. 400 350
20 t/h 50 t/h 100 t/h 150 t/h 200 t/h
Operating cost (€/MWel)
300 250 200 150 100 50 0 0
50
100 Capacity (MWel)
150
200
Figure 4.16 Operating Cost of CHP Plant relative to Capacity 4.7.5 Utilities Provision Primary utilities such as water, steam, and electricity are distributed through an ICPS to enable each production plant easy access. Here, the costs for water and nitrogen are reviewed based on PEP report 136A (1995) and adjusted according
Methodology for Quantifying Integration Aspects
87
to currency and inflation. For details regarding the cost determination or the processes, please refer to the PEP report. Water Provision Based on the PEP report, the costs for cooling and process water exemplify economies of scale, shown in the graphs below. 0.16 Cooling water: operating cost incl. capital charges
Operating cost, € cent / 1000L
0.14
Cooling water: operating cost
0.12 0.1 0.08 0.06 0.04 0.02 0 1000
10000
Capacity, L/min
100000
1000000
(based on PEP report 136A, 1995, p.4-34) Figure 4.17 Operating Cost of Cooling Water Preparation versus Capacity 0.3
Operating cost, € cent / 1000L
0.25
Process water: operating cost incl. capital charges Process water: operating cost
0.2
0.15
0.1
0.05
0 1000
10000 Capacity, L/min
100000
(based on PEP report 136A, 1995, p.4-23) Figure 4.18 Operating Cost of Process Water Preparation versus Capacity
Methodology for Quantifying Integration Aspects
88
Potential Savings of Cooling Water in an ICPS The transfer of cooling water between plants is another benefit of integration. For example, if one plant has a small increase in cooling water temperature, a neighbouring plant may be able to further use this water for cooling, as shown below. Plants not linked through cooling water
Cooling water, 1000 m3/h, 23 ºC
Plant A
Exiting water, 26 ºC
Cooling water, 700 m3/h, 23 ºC
Plant B
Exiting water, 33 ºC
Increase in cooling water temperature 3ºC and 10 ºC
Plants linked through cooling water
Cooling water, 1000 m3/h, 23 ºC
Plant A
Exiting water, 26 ºC
Plant B
Exiting water, 33 ºC
Increase in cooling water temperature 10 ºC
(based on BASF, 1995, p.7) Figure 4.19 Example of Energy Integration through Cooling Water Through the secondary use of cooling water from plant A, plant B is able to reduce its cooling water requirement. Higher process temperatures in the coolers in plant B allow the use of warmer cooling water from plant A. This concept is applied in various plants at the BASF Ludwigshafen site: butanediol, hydrosulfide, styrene, and ethylbenzene plants (BASF, 1995, p.7). Nitrogen Provision Nitrogen preparation costs for pressure swing adsorption and membrane separation methods also show economies of scale, as shown in the following figure.
Methodology for Quantifying Integration Aspects
89
Nitrogen product value, €/1000Nm3
100 90 Pressure Swing Adsorption Membrane
80 70 60 50 40 30 0.0
0.2
0.4
0.6
0.8
1.0
1.2
1.4
1.6
Capacity, 1000 Nm3/h Nitrogen gas
(based on PEP report 136A, 1995, p.8-6) Figure 4.20 Nitrogen Product Value relative to Capacity Waste Water Treatment The costs for waste water treatment within a group of companies were investigated. As the capacity of the treatment facility increased, the specific cost decreased exponentially. The same trend was found for the costs related to sludge treatment. Waste Water Reduction through Integration The amount of waste water production may be reduced through integration. For example, waste water from a process containing product A is sent to an offsite waste water treatment plant in a stand-alone plant. However, in an ICPS, a nearby process may be able to use the waste water as process water. Then plant A saves costs for waste water treatment and plant B saves costs for demineralised water. Furthermore, the product yield may be increased in plant B. This concept is shown schematically in the following figure and is used at the BASF Ludwigshafen site in the formaldehyde, formol, and propylene oxide plants (BASF, 1995, p.18).
Methodology for Quantifying Integration Aspects Plants not linked through waste water
Raw materials, Demin. water
Plant A Process X
Waste water Process A
Raw materials, Demin. water
Plant B Process Y
Waste water Process B
90
Plants linked through waste water
Raw materials, Demin. water
Plant A Process X
Raw materials, Demin. water
Plant B Process Y
Waste water Process A
Waste water Processes A and B
Recycle waste water
(based on BASF, 1995, p.18) Figure 4.21 Reduction of Waste Water use through Integration Incinerator Wastes formed through chemical production may be disposed of via an incineration plant. Incineration plants may be specifically designed to handle certain kinds of waste, such as chemical residues, household waste, waste water, hazardous waste, or sewage sludge. Types of chemical waste which may be incinerated are:
•
By-product gases and vapours
•
Organic liquid streams
•
Aqueous wastes containing dissolved organics and salts
•
Distillation bottom tars
•
Organic sludge and semi-solids
•
Slurries and sludge with high moisture
•
Granular solids or filter cakes
The following chemical residue incinerators within integrated chemical production sites use rotary kiln incinerators and waste heat boilers:
•
BASF Ludwigshafen (BASF, 2002): of the total amount of waste produced (621 kt/a), 538 kt/a are incinerated, but only 139 kt/a were used to produce 104 t/h of steam (5.6 tst/twi).
•
Bayer operates two residue incinerators (Bayer Industry Services, 2004).
− Bayer Dormagen: 50 kt/a residue incinerator with a thermal output of 32.8 MW or 4.9 MWh per ton of residue to produce 36.8 t/h of 39 bar steam (5.5 tst/twi).
Methodology for Quantifying Integration Aspects
91
− Bayer Krefeld-Ürdingen: 25 kt/a residue incinerator with a thermal output of 13.8 MW or 4.14 MWh per ton of residue to produce 13.5 t/h of 16 bar steam (4 tst/twi). The specific costs per ton of waste for a residue incinerator with a capacity of 100 kt/a is approximately 135 €/t including operating costs for personnel, maintenance, electricity, ash disposal, and capital (Stubenvoll et al., 2002, p.144). Of this, the firing system and boiler are estimated at 36 €/t and the watersteam cycle to generate steam at 8 €/t. Stubenvoll et al. (2002, p.144) determine economies of scale as: 135 €/t for 100 kt/a, 111 €/t for 200 kt/a, and 100 €/t for 300 kt/a. The economics of an onsite incinerator relative to sending waste offsite needs to be addressed for an individual integrated site. It is interesting to note that some integrated sites which operate incinerators (BASF, Bayer) accept waste from outside companies in order to better utilise their own onsite waste incinerators (BASF, 2002; Bayer Industry Services, 2004). There are more aspects of plant utilities which may be investigated, such as refrigeration systems and hot oil heating systems, however, these are often integrated into the process and are not reviewed here. 4.7.6 Economic Benefit of Shared Infrastructure and Utilities Infrastructure costs are difficult to compare between small stand-alone sites and large integrated sites, as the types of infrastructure change with increasing size. Economies of scale have been shown for power and steam provision as well as for other utilities. To determine the cost savings for infrastructure in an ICPS, the difference between the costs for facilities in an ICPS and those in a semi-ICPS or stand-alone site are determined on a case by case basis. These generally consist of power, steam, cooling water, production water, nitrogen, waste water treatment, and incineration. Additionally, savings achieved in the ICPS in terms of waste water reduction, cooling water reduction, and demineralised water reduction are included.
S Infras , ICPS , SA
=
S Infras , ICPS , S − ICPS for n facilities
n
∑ (C x =1
=
Fac , x , ICPS
− C Fac , x , SA ) + S cw, ICPS + S ww, ICPS + S dw, ICPS
n
∑ (C x =1
Fac , x , ICPS
− C Facx, S − ICPS ) + S cw, ICPS + S ww, ICPS + S dw, ICPS
Methodology for Quantifying Integration Aspects 4.8
92
Environmental Aspects
Energy and logistics integration in an ICPS lead to environmental benefits relative to less integrated sites. Lower fuel requirements for site steam production, the avoidance of offsite transport of integrated products, and efficient production of power and steam lessen the depletion rate of non-renewable resources and reduce emissions created by the combustion of fossil fuels. 4.8.1 Fossil Fuels Fossil fuel savings in an ICPS result from heat recovery and incineration as well as the onsite transport of sellable by-products and captive use products, determined as follows:
M F , ICPS , SA
=
[ (∑ Mu, s + ∑ Mc ) ⋅ F
f
⋅ D + (Mst i + Mst hr ) ⋅ hst
]
1 ⋅ εb
1 ⋅ ef
In a semi-ICPS, the additional transport of sellable by-products and potentially some additional captive-use materials in the ICPS result in additional fossil fuel requirements. Additionally, greater efficiencies for larger scale facilities such as a power plant may result in further fossil fuels reductions. M F , ICPS , S − ICPS
=
(∑ Mu, s + ∑ Mc
ICPS , S − ICPS
)⋅ F
f
⋅D
The reduction in natural gas consumption due to steam production through heat recovery and incineration is based on a heating value of 44 MJ/kg and boiler efficiency of 90%. The reduction in diesel fuel consumption for transport is based on the following factors (in MJ diesel fuel / ton product⋅km): 1.8 for truck (28 ton loading), 0.47 for train, 0.46 for inland waterway, and 0.088 for sea freight (Frischknecht and Jungbluth, 2004, p.13). These data correspond well with data from other sources (Knörr and Reuter, 2005, p.35). The combustion energy for diesel fuel is taken as 43 MJ/kg. It should be noted that fuel consumption depends on transporter size and loading. Gilbert (2002, p.8) shows this by giving a range of factors for the different transport modes. In this work, the factors are assumed to be the same for different geographical regions. 4.8.2 Emissions Since the combustion of fossil fuels for an ICPS is lower due to heat recovery and reduced transport, the amount of related emissions caused by these fossil
Methodology for Quantifying Integration Aspects
93
fuels, Mes, is avoided. As waste incineration also creates emissions (the type and amount depend on the material incinerated and are not considered here), it does not provide a benefit for the ICPS. Emissions from Transport The emissions generated through transport have been calculated by various institutes9 and found to vary significantly (Schmidt et al., 1998, p.284). Emissions factors used for this study were provided by the following sources: for truck transport by Schmidt et al. (1998, p.284), for train, sea, inland waterway and air transport (not including SO2) by Borken et al. (1999) as cited by the Umweltbundesamt Berlin (1999, p.24), and for SO2 emissions for train, sea, and inland waterway by Hobohm et al. (2006, pp.50-52). Table 4.8 Emissions Factors for Different Transport Modes Emission Factors g/ton⋅km CO2 SO2 CO NOx NMVOC Dust
Truck 83 0.024 0.140 0.890 0.072 0.036
Train 32 0.013 0.040 0.120 0.010 0.005
Sea 17.5 0.0929 0.046 0.42 0.02 0.03
Inland waterway 35.4 0.0214 0.11 0.61 0.05 0.017
Air 903 n/a 0.97 4.24 0.5 0.13
Emissions from Steam Generation Less emissions are generated in an ICPS compared with a non-integrated site through the lowering of steam requirements through heat recovery and the reduction of fuel requirements through greater efficiencies via economies of scale for larger power plants. In this work, the reduction in emissions related to these benefits from integration are determined based on emissions levels measured for natural gas powered CHP power plants cited by the Fraunhofer Institute (2005), given in Table 4.9.
9
GEMIS or Gesamt-Emissions-Model Integrierter Systeme by Hessisches Ministerium, Ecoinvent by ETH Zürich, Umberto by Institut für Umweltinformatik Hamburg.
Methodology for Quantifying Integration Aspects
94
Table 4.9 Emissions Factors for CHP Power Plants Emission type CO2 SO2 CO NOx NMVOC Dust CH4 N2O
Emissions (kg/MWh) 380 0.01 0.27 0.23 0.004 0.004 0.004 0.012
Thus, the emissions reduction through integration is determined as follows:
=
M em , ICPS , SA
∑ [(∑ Mu, s + ∑ Mc n
x =1
M em , ICPS , S − ICPS
=
ICPS , SA
∑ [(∑ Mu, s + ∑ Mc
)
n
x =1
]
⋅ D x ⋅ Fem ,t , x + M f ⋅ e f ⋅ Fem , pp
ICPS , S − ICPS
)
⋅ D x ⋅ Fem ,t , x
]
for n transport modes 4.9
Economic and Environmental Benefits of Integration
A summary of the functions for determining the economic and environmental benefits of an ICPS relative to a semi-ICPS or stand-alone site are given below. Total
S ICSPS , SA
= S M , ICSPS ,SA
+ S E , ICSPS , SA
= S M , ICSPS , S − ICPS
S ICSPS , S − ICPS
+ S L , SA
+ S E , ICSPS , S − ICPS
+ S Infras + S L , ICSPS , S − ICPS
+ S Infras
Materials
= M u , wd , SA ⋅ c wd + M u , SA ⋅ vu
S M , ICSPS , SA S M , ICPS , S − ICPS Energy
S E , ICPS , SA
=
S E , ICPS , S − ICPS
= M u ,i , S − ICPS ⋅ ci + M u , wd , S − ICPS ⋅ c wd + M u , S − ICPS ⋅ (vu − v f ,ut )
(c ⋅ (M St
St ,i
+ M St ,hr + M St ,hs ) + (M cw,hs ⋅ ccw ) + C eq ,hs )
= − c St ⋅ (M St ,ui
)
Methodology for Quantifying Integration Aspects
95
Logistics
S L , ICPS , SA =
(∑ Mu, s + ∑ Mc
n
ICPS , SA
(∑ Mu, s + ∑ Mc
S L , ICPS , S − ICPS =
) ⋅ c + ∑ F ⋅ D + C +C ) ⋅ c + ∑ F ⋅ D + C lm
x =1
t,x
x
Warehouse
Storage
n
ICPS , S − ICPS
lm
x =1
t,x
x
Warehouse
+ C other
+ C Storage + C other
for n transport modes Infrastructure n
∑ (C
=
S Infras , ICPS , SA
x =1
=
S Infras , ICPS , S − ICPS
Fac , x , ICPS
− C Fac , x , SA ) + S cw, ICPS + S ww, ICPS + S dw, ICPS
n
∑ (C x =1
Fac , x , ICPS
− C Facx, S − ICPS ) + S cw, ICPS + S ww, ICPS + S dw, ICPS
for n facilities Fossil Fuels
M F , ICPS , SA
=
M F , ICPS , S − ICPS
[ (∑ Mu, s + ∑ Mc ) ⋅ F (∑ Mu, s + ∑ Mc
=
f
⋅ D + (Mst i + Mst hr ) ⋅ hst
]
ICPS , S − ICPS
)⋅ F
f
1 ⋅ εb
1 ⋅ ef
⋅D
Emissions
M em, ICPS , SA
=
M em, ICPS , S − ICPS
∑ [(∑ Mu, s + ∑ Mc n
x =1
=
ICPS , SA
∑ [(∑ Mu, s + ∑ Mc
)
n
x =1
]
⋅ D x ⋅ Fem,t , x + M f ⋅ e f ⋅ Fem, pp
ICPS , S − ICPS
)
⋅ D x ⋅ Fem,t , x
]
for n transport modes 4.10 Application of the Methodology on the Plant Level In applying the methodology on the plant level, scenarios are defined and compared in which the plant exists as a stand-alone plant and in an integrated site. Applying the methodology on the plant level allows the effects of integration on a specific process to be investigated. Different from applying the methodology on the site level, in the application on the plant level, both entering and exiting streams need to be considered. The boundaries are given in the figure below.
Methodology for Quantifying Integration Aspects
96
Consumer or Customer Hub Transport (on- vs. offsite)
Sell or use
Dispose
Incinerate
Storage, packaging, handling
By-products
Sales, Captive use Products
Wastes
Steam
Heat Recovery
Incinerate
Dispose
Treat
Waste water, solid waste, emissions
Plant
Utilities, Steam, Electricity External raw materials, Fossil fuels
Transport (on- vs. offsite) Storage, packaging, handling Raw materials available onsite
Figure 4.22 Boundaries for Application of Methodology on Plant Level 4.10.1 Integration Types for Methodology on the Plant Level Materials Integration A plant in an ICPS may be part of a value chain and linked to either upstream or downstream processes. Therefore, raw materials entering the process as well as products leaving the process must be taken into consideration. Raw materials are classified as either externally sourced or available onsite for each particular scenario. A raw material is considered ‘available onsite’ if it is provided by another process within the ICPS and does not require transport from another site. As in the application of the methodology on the site level, products leaving the process are categorised as either sales products, captive use products, or wastes for disposal or incineration. Again, the fate of by-products is determined based on their use in a non-integrated site.
Methodology for Quantifying Integration Aspects
97
Energy Integration The benefits derived from heat recovery and waste incineration for the particular plant inside an integrated site are determined. Shared Infrastructure Infrastructure and utilities requirements are determined for the individual plant and the costs are determined for the plant as a stand-alone plant versus in an integrated site. Logistics Integration For each scenario, it is determined which logistics measures are necessary for both raw materials available onsite and products sent offsite. For example, for a scenario in which the process is in an ICPS, the logistics requirements for raw materials onsite may consist of simply an intermediate tank and piping connecting the two linked processes. Whereas, for the same process in a standalone plant, the same raw material is stored, packaged, and transported offsite. Product transport costs are considered up to the location of the consumer, customer hub, or port. This is done in order to address the effects of having an onsite downstream consumer versus an external consumer. 4.10.2 Production and Logistics Costs As application of the methodology on the plant level investigates specific scenarios which may influence production cost, both the production and logistics costs related to integration are determined per scenario. Production costs include the costs related to materials and energy integration as well as shared infrastructure. Logistics costs refer only to costs related to logistics integration.
•
Production costs include:
− Fixed costs: personnel, fixed utilities, depreciation (infrastructure and economies of scale reflected), laboratory, maintenance − Variable costs: variable utilities, raw materials, packaging, energy − Overhead: administration, safety and environment, etc. − Deducting any credits for energy provision through integration •
Logistics costs include:
− Raw materials storage, packaging, and transport to production site − Product transport from production site to consumer, customer hub, or port
Methodology for Quantifying Integration Aspects
98
Aspects which are equivalent in both scenarios are not included in the system boundary. For example, raw materials externally purchased are not considered, as they are neutral in the model. Also, if the plant size and design are equivalent for both scenarios, the investment costs and thus depreciation are considered to be equivalent. 4.10.3 Allocation The topic of allocation is introduced here, as an integrated flow benefits more than just the plant from which the flow arises. According to Ullmann (2000), when processes generate more than one product or receive more than one input, there is more than one process reference. The allocation of material and energy streams up to this process is split among all products through allocation. Process products in addition to the main product may be useable by-products, wastes for incineration, or steam generated by the process. Allocation can be carried out by mass, volume, energy content, or another physical quantity (Feuerherd, 1993). Examples are as follows:
•
By-products: if a useable by-product is produced by process A and transferred for use as a raw material in process B within the same site, then both processes A and B are allocated a credit. For example, the sales price of the by-product is allocated equally between the two plants. For example, styrene is produced as a co-product with propylene oxide in the ethylbenzene process. As the process produces both styrene and propylene oxide, the production costs, environmental burdens, or integration benefits may be allocated to each product according to their mass flow.
•
Steam export from heat recovery: an exothermic process A produces a main chemical product as well as steam which is exported to the site’s steam network. This benefit is credited to process A and the steam network. This may be a monetary credit or based on energy input, which is discussed in more detail below.
•
Incineration of waste to produce steam: a process produces waste which is incinerated in an onsite incinerator to produce steam for the site. The benefit is credited to the process and to the incinerator, as the waste represents a raw material input for the incinerator.
Methodology for Quantifying Integration Aspects
99
Example Steam Export A process produces 1 kg of product A with an energy input of 100 MJ/kg. At the same time, 15 kg steam are produced from the process’ heat of reaction and exported to the site steam network. This exported steam has an energy content of 3 MJ/kg. The steam network carries an additional 100 kg of steam which is produced by boilers with an efficiency of 90%. The amount of energy supplied by the exported steam, ESt, is calculated as:
E St = M St ⋅ e St ⋅
1
η
where: MSt = 15 kg, eSt = 3 MJ/kg, η = 90% Æ ESt = 50 MJ This benefit is allocated equally to the plant producing A and the steam supply system (aA = aSt = 50%). Allocation to Production Plant The energy input normally required to produce product A, eA, 100 MJ/kgA, is now reduced to 75 MJ/kgA due to the allocation of the steam benefit:
e A,allocation =
M A ⋅ e A − E St ⋅ a A MA
where: MA = 1 kg, aA = 50%
Allocation to Steam Provider The amount of energy required for the steam network, eSt, is now reduced from 3.3 to 3.1 MJ/kg steam:
M St ⋅ e St ⋅ e St ,allocation =
1
η
M St
− E St ⋅ a St where: MSt = 115 kg, aSt = 50%
Case Study on the Site Level
100
5 Case Study on the Site Level The methodology is applied to an actual integrated site. The site selected is suitable, as several types of integration are present yet manageable in its scope as a case study. It is located on approximately 22 km2 of land with road, rail, and water access and consists of the following plants: Table 5.1 Capacities of Plants for Site Level Case Study Plant Steam cracker: ethylene, propylene EO/EG (Ethylene Oxide, Ethylene Glycol) LDPE (Low Density Polyethylene) Oxo-alcohols AA/AE (Acrylic Acid / Acrylic Esters): Crude AA, butylacrylate, methyl-/ethylacrylate, 2-ethylhexylacrylate C1 complex: formic acid, methylamines, propionic acid, dimethylformamide
Capacity (kt/a) 600 / 300 600 / 300 400 250 160 / 100 / 60 / 60 50 / 30 / 30 / 30
Additionally, a synthesis gas (syngas) plant and an Air Separation Unit (ASU) are part of the site. Below, the feedstocks, raw materials, fuels, products, and waste streams are described. A schematic of the site including these flows follows. 5.1
Material and Energy Mapping of the Site
Feedstocks
•
Naphtha: feedstock for cracker, received by ship
•
Ethylene (gas): from cracker is used by the EO/EG, Oxo-C3 and LDPE plants (liquid ethylene stored at cracker)
•
Propylene (liquid): used in the AA/AE and Oxo-C4 plants
•
Methane: from cracker is used in the EO/EG plant
•
Oxogas, CO, and hydrogen: from syngas unit to C1 and Oxo-C3/C4
•
Oxygen: from ASU used in EO/EG and WWT
•
Propane (gas): from Oxo-C4 is transferred back as feedstock to cracker
Other Raw Materials
•
Methanol and caustic soda for several plants, ethanol for AE plant stored centrally
Case Study on the Site Level
•
101
Ammonia (for methylamine plant), sulphuric acid (for AE plant) stored locally
Products
•
Aromatic extraction products: benzene, xylene (centrally stored), toluene (stored at cracker)
•
EO/EG products: stored locally prior to transport by truck and train
•
Oxo and AA/AE products: stored in central tank farm prior to transport by ship
•
Cracker co-products: C9 stream and Pyrolysis Fuel Oil (PFO) are stored at cracker and PFO is pumped to the jetties
Fuels and Alternate Fuels
•
Natural gas: supplied by pipeline with a heating value of 34 (min) to 37 MJ/Nm3 (max) is used in cracker, power plant, AA/AE, Oxo-C3/C4
•
Light fuel oil: from C9 stream of cracker used as backup fuel for power plant
•
Combustible off-gases: collected from several plants in a fuel gas header, heating value of 25 (min) to 35 MJ/Nm3 (max)
Wastes
•
Waste treatment: all wastes are treated onsite via WWT or incineration. Solid wastes, mainly sludge from WWT, and organic liquid chemical wastes are incinerated.
•
Waste discharge: a waste water stream is discharged to the river after WWT, some wastes sent to landfill, and emissions
•
Waste gas system: gases not fed to the fuel gas header or burned in the incinerator are flared or used as combustion air
5.2
Infrastructure for the Site
Steam and Power A gas turbine combined cycle (GTCC) power plant designed at 160 MWel and steam output of 200 t/h serves the site. It is designed to operate on a continuous basis to provide electricity at 110 kV and steam at 48, 40, 16, and 4 bar. It consists of three 40 MWel gas turbines, supplementally fired heat recovery steam generators, an extraction condensing steam turbine rated at 40-60 MWel, associated electrical generators, an air-cooled condensing system, switchgear,
Case Study on the Site Level
102
and other associated equipment. A diesel generator is available in case start-up power from the grid is not available and as a back-up for safe shut down of the power plant in case of a sudden power failure. In addition to steam provided by the power plant, steam is provided through heat recovery from the following processes:
•
Steam cracker: 40 tst/h at 16 bar
•
AA/AE: 40 tst/h at 16 bar
•
LDPE: 50 tst/h at 40 bar
Water, Gases, WWT, Incineration
•
Water systems: production water, cooling water, demineralised water, and potable water. Low silica water is supplied to the site which is then used to produce demineralised and potable water. Production water is used for fire water. There is a condensate recovery and supply system and boiler feed water treatment.
•
Utility gases: nitrogen and compressed air (for instrument and plant air)
•
WWT: waste water is collected and treated in the WWT plant and consists of domestic, production, and clean waste water and rain water
•
Incinerator: with chemical waste containment facilities has a throughput of approximately 600 kg/h
Other Infrastructure
•
Tank farms: one per plant plus one central tank farm
•
Safety: fire fighting, gas fighting, rescue services
•
Common facilities: telecom, lab, first aid, canteen, administration, training, management information systems, security, car garage, forklift garage, warehouses, substations
•
Passages: rail/truck tanker loading/unloading stations, pipelines, roads
•
Other: environmental monitoring station, maintenance shop, cleaning station, weigh bridge
Case Study on the Site Level 5.3
103
Methodology Application
Step 1. Division of ICPS into Production Blocks Rather than completely separating each production plant, such as EO and EG, a grouping was carried out to separate the site into realistic plant blocks, as they actually occur within an ICPS. For example, EO/EG and AA/AE exist as production blocks within an ICPS and therefore are not separated. Also, the plants associated with the C1 complex are grouped together along with a syngas plant to provide their feedstocks. As the Oxo C3-C4 complex relies on both an air separation unit and syngas unit, these are also grouped with this production block. A nearby cracker provides feedstocks to the separated sites. Thus, the site was divided into five production areas: 1. AA/AE 2. EO/EG 3. LDPE 4. Oxo C3-C4 + ASU + syngas 5. C1 Complex + syngas Step 2. Allocation of Utilities Requirements to Production Blocks The requirements for electricity, steam, water, gases, etc. are allocated to each production block. The electricity and steam requirements include those for both the production processes and their utilities. Step 3. Material Streams Relevant to Integration The material and energy streams relevant to integration are investigated: useable by-products, captively used products, and incineration wastes. Step 4: Energy Streams Relevant to Integration Here, the processes are reviewed for their production of excess heat as either steam production for the steam network or heated streams which can be used in neighbouring plants. The separation of production blocks is shown in the following schematic. Sales products, raw materials, and infrastructure are excluded from the schematic showing the separated production blocks for presentation purposes.
Case Study on the Site Level
104
Sales Products, emissions
Packaging / Storage CO offgas Formic Dimethyl acid Formamide Dimethylamine
Steam to network
Steam to network EO / EG
AA / AE
Methanol recycle
LDPE
Propylene recycle, n-Butanol, 2-Ethylhexanol
Methylamine
Oxo C3-C4 Propionic acid
O2 ASU
Oxogas CO Oxo off-gas
H2
Propane recycle
Propylene
Syngas Steam, electricity Power plant
Methane
Ethylene
Cracker C9 Fraction
Benzene, Xylene
Steam
Naptha (ship)
Incinerator
Natural gas (pipeline)
Wastes, aux. fuel
Raw materials
Figure 5.1 Schematic of Flows in Site Case Study
PFO (to jetty)
Infrastructure: WWT, Utilities, Buildings, Firefighting, Jetty, Tank farms, etc.
Case Study on the Site Level waste, emissions
Steam to network
Steam to network
Utilities
Ethylene Methane
ASU
Packaging / Storage
Packaging / Storage
Utilities
LDPE O2
waste, emissions
waste, emissions
Packaging / Storage
EO / EG
105
AA / AE Propylene
Ethylene Cracker
Cracker
Cracker waste, emissions
waste, emissions Packaging / Storage Propylene recycle n-Butanol 2-Ethylhexanol
Packaging / Storage
Utilities Formic acid
CO offgas
O2 ASU
Oxo off-gas
Propionic acid
Oxogas, H2
Ethylene
Syngas
Cracker
Figure 5.2 Separated Production Blocks for Site Case Study
Oxogas Syngas
Cracker
Dimethyl Formamide Dimethylamine
Oxo C3-C4 Propylene, Ethylene Propane recycle
Utilities
CO
Methanol recycle Methylamine Utilities
Case Study on the Site Level 5.4
106
Analysis
5.4.1 Materials / Logistics integration: Horizontal Materials Integration / Useable By-products Products from the Oxo alcohols plant are transferred to the AA/AE process as feedstocks, shown below. The linkage of these plants is considered to be horizontal materials integration, as the plants are not part of a vertical value chain. If the processes are separated, these raw materials would require transport.
MA/EA
CAA
BA
Propylene recycle
2-EHA
n-Butanol 2-Ethylhexanol
Oxo C4
Propylene
Oxo C3
Ethylene Cracker
Figure 5.3 Materials Integration between AA/AE and Oxo Plants in ICPS Also, light fuel oil, a useable by-product from the steam cracker, is used in the power plant as backup fuel (9 kt/a, assumed at 1% of cracker output, based on European Commission 2003, p.154). The logistics benefit of having these raw materials available onsite is determined as follows. A transport distance of 100 km by truck is taken (cost of 25 €/t based on inquiry). The specific costs for filling, dispatch, and order- and materials management are based on those given in the methodology. Storage costs are for four 1,000 m3 tanks based on actual cost data. The logistics-related savings due to the product transfer between the Oxo and AA/AE production blocks as well as the light fuel oil used in the power plant are estimated at 4.1 million €/a. The transport distance selected has an effect on the overall costs. Increasing the distance to 200 km increases the transport cost to 33 €/t, resulting in overall costs of 5.1 million €/a; thus doubling the distance increases the costs by 24%. The cost breakdown is given in the following table.
Case Study on the Site Level
107
Table 5.2 Cost Benefit of Useable By-products for Site Case Study Materials available at ICPS (t/a): Propylene recycle n-Butanol 2-Ethylhexanol Light fuel oil from cracker Total Materials available at ICPS (t/a) Distance (km) Transport cost (€/a) Storage (€/a) Filling (€/a) Dispatch (€/a) Materials management (€/a) Logistics Costs for By-products available at ICPS (mil €/a)
24,000 62,400 22,640 9,000 118,040 100 2,951,000 56,354 472,160 118,040 542,984 4.14
Captive-use Raw Materials The only captive-use products at the site are the cracker products: ethylene (600 kt/a), propylene (300 kt/a), and methane (