European Scientific Journal February 2013 edition vol.9, No.4 ISSN: 1857 – 7881 (Print) e - ISSN 1857- 7431
DYNAMIC AND STATIC LIQUIDITY MEASURES IN WORKING CAPITAL STRATEGIES
Monika Bolek, PhD Department of Industry and Capital Market, Faculty of Economics and Sociology, University of Lodz, Poland
Abstract Liquidity management in a company may be analyzed in terms of the dynamic approach represented by the cash conversion cycle or the static approach represented by the current ratio. The mutual relationships between these measures change depending on the working capital level. The author considers the CR to be a dependent ratio, assuming that the CCC reflects the operational decisions affecting the level of current assets and liabilities. In the study, 61 regression models were used to assess liquidity ratios in non-financial companies listed on the Warsaw Stock Exchange in the period 1997–2010. In the aggressive and moderate strategies, the current ratio grew with the number of cash conversion cycles per year, while the relaxed policy resulted in the CR increasing with a decrease in the number of cash conversion cycles.
Keywords : Liquidity, cash conversion cycle, working capital
Introduction The cash conversion cycle, current ratio, quick ratio and acid test) should be taken into consideration in managerial decision making. Unfortunately, the relationship between the cash conversion cycle and the current ratio is not direct as it depends not only on the level of current assets and liabilities, but also on sales and costs of goods sold, which determine the turnover ratios. Moreover, short-term management is a difficult problem since usually companies do not employ working capital managers, and the levels of current assets and liabilities result from operational performance: negotiations determining the level of receivables and inventory strategies connected to production or sales combined with purchases and short-term debt. The debt level to an ever greater degree results from the 1
European Scientific Journal February 2013 edition vol.9, No.4 ISSN: 1857 – 7881 (Print) e - ISSN 1857- 7431
banking strategy, offering credit to entities with the ability to pay it back. Such a strategy may be very aggressive and managers may decide to incur more short-term debt than necessary from the company’s point of view. The cash conversion cycle (CCC) should be related to the current ratio (CR), since both measures deal with current assets and liabilities. The author has chosen them to examine how the relationship between these measures changes over time under different working capital strategies. The study is conducted on the developing Polish market, where such changes can be observed. If a company follows a negative working capital strategy, this means that it represents a strong position in the market and can decrease its liquidity, as the managers expect that invoices will be paid on time and can make the subcontractors wait for their payments, which results in a negative cash conversion cycle. The cash conversion cycle may be measured in days or in the number of cycles per year. The latter approach is better comparable with the liquidity ratios. The aggressive strategy is characterized by a low current ratio, but the number of cycles per year is high. If a company delays its payments, the cash conversion cycle may be negative. If a company has a low CR ( 2 represents relaxed working capital management. According to the theory and predictions connected to the results of working capital management, we can expect that: ‒ for the CR in the range (0;0.99), 365/CCC will grow; ‒ for the CR in the range (1;1.99), 365/CCC will grow; ‒ for the CR > 2, 365/CCC will fall. The model is expressed by the following formula: CR = α + βCCC + e
(4)
indicating the relationship between these two liquidity measures. First of all, regression will be done for the entire range and the whole period. In the second step, the data will be divided according to strategy and regression will be done for the period 1997–2010. In the third step, the data will be also divided into years to see how liquidity management changes over time. Results The author used 61 regression models to verify the assumptions. The ratios were calculated based on data from the Notoria database for non-financial companies listed on the Warsaw Stock Exchange in the years 1997–2010. First, the ratios were selected and regression was performed for the entire period. After that, the series was divided based on the working capital strategy represented by the CR value. The CR in the range 0–0.99 was regarded as an aggressive policy (A), the CR in the range 1–1.99 as a moderate policy (M), and the CR > 2 as a relaxed policy (R). Subsequently, 10
European Scientific Journal February 2013 edition vol.9, No.4 ISSN: 1857 – 7881 (Print) e - ISSN 1857- 7431
regression for every year and every strategy was performed. Unfortunately, the small number of observations could affect the significance of the results. The results taken together were compared according to strategy. The constant was statistically significant in all of the models, and thus this value should be considered important, influencing the level of the current ratio. The constant refers to the mean value of the current ratio. Analyzing the 1997–2010 period in Model 1, one can see that the determination is very low, with an R-squared of 0.005 and a constant of 1.8635 at a significance level of 1%. If the data are divided into subcategories according to the working capital strategy, then for the aggressive strategy presented in Model 2 R-squared is higher than 0.013 and the constant is lower than 0.661, indicating a stronger correlation of dynamic and static liquidity management, with the average value of current assets lower than that for the entire range of data. The significance of the constant is at a level of 1%, while that for the CCC is 5%. For the moderate strategy presented in Model 3, Rsquared is less than 0.004 and the constant is over 1.414, indicating a lower correlation of liquidity management and a higher value of the mean CR. The significance of the constant is at a level of 1%, while that of the CCC is 5%. In the case of the relaxed policy analyzed in Model 4, R-squared equals 0, the constant is 3.333, and only this parameter is significant (at 1%), while the CCC is not. This result indicates a lack of relationship between static and dynamic liquidity measures. Over the 1997–2010 period, Poland, as every market, functioned under better and worse conditions and, moreover, it underwent a transition which affect the results based on aggregate data. Analysis of every year separately may elucidate the relationship between the current ratio and the cash conversion cycle in a short-term perspective. The year 1997 is represented by Model 5 with the following results: R-squared equals 0.0219 and the constant is 2.229. Unfortunately, only the constant is statistically significant (at 1%). In this step, the author analyzed the various strategies of working capital management. The results for the aggressive policy are given in Model 6, with R-squared equal to 0.0169 and the constant (at 0.819) lower than that for aggregated 1997 data, and only the latter result is significant (at 1%). For the moderate strategy analyzed in Model 7, Rsquared equals 0.003 with a constant of 1.475, being the only significant value. The relaxed policy is presented in Model 8 and is characterized by an R-squared equal to 0.006, and a much higher constant (3.42), being the only significant value. The CCC coefficient is negative, showing its negative correlation with the CR. The year 1997 is characterized by a very low correlation between the CR and the CCC, but it is much higher for the aggressive strategy than for the moderate and relaxed policies. 11
European Scientific Journal February 2013 edition vol.9, No.4 ISSN: 1857 – 7881 (Print) e - ISSN 1857- 7431
The year 1998 saw changes in the economy and more companies joined the Warsaw Stock Exchange. In Model 9, for the entire year, R-squared is equal to 0.0118 and the constant is 2.095, being the only statistically significant value. The next model (no. 10) represents the aggressive strategy with the following results: R-squared equals 0.002 and the constant is 0.751, being the only significant value. The CCC coefficient is negative, which shows a negative correlation between the CR and the CCC in the 0–0.99 CR range. Model 11 represents the moderate strategy with R-squared (0.025) higher than that for the entire year and the constant at a level of 1.393, also being the only significant value. Model 12 represents the relaxed policy: R-squared is 0.017 and the constant equals 3.050, with the CCC not being statistically significant and the constant being significant at 1%. Model 13 presents results for 1999. R-squared for this year is very low (0.002) with the constant (1.959) being again the only significant value. Model 14 describes the aggressive policy, characterized by an R-squared of 0.023 and a constant of 0.802. The CCC coefficient is here negative, indicating a negative correlation between the CR and the CCC. Model 15 represents the moderate strategy with R-squared at a level of 0.028 and the constant equal to 1.487, the latter being the only significant value. In Model 16, reflecting the relaxed policy, R-squared is 0 and the constant is equal to 3.131 (a statistically significant value). The year 2000 is characterized by results presented in Model 17, where R-squared is 0 and the constant equals 1.802, being a significant value. Model 18 represents the aggressive strategy with R-squared equal to 0.004 and a statistically significant constant of 0.746. Here, the CCC coefficient is not negative, and the change in the direction of the relationship may indicate a change in the liquidity management approach to developing business. Model 19, representing the moderate strategy for this year, brings surprising results. First of all, the results are statistically significant, R-squared (0.072579) is much higher than that in the other models, with the constant being 1.3936 and the CCC coefficient being 0.0294493. Model 20, describing the relaxed policy, yields an R-squared of 0.004181 with a statistically significant constant of 3.30681 and a negative CCC coefficient of -0.0555471. The results for the year 2001 are as follows: R-squared for the entire year, given in Model 21, is equal to 0.003546 with a statistically significant constant of 1.67391 and a CCC coefficient of 0.01692 (not significant). Model 22 presents results for the aggressive strategy, with R-squared equal to 0.009731, a statistically significant constant of 0.724467 and a not significant CCC coefficient of 0.01692. The moderate strategy is shown in Model 23 with an R-squared of 0.003745, a constant of 1.42363 and a CCC coefficient -0.00875203. The
12
European Scientific Journal February 2013 edition vol.9, No.4 ISSN: 1857 – 7881 (Print) e - ISSN 1857- 7431
relaxed policy is described in Model 24, with an R-squared of 0.056525, a statistically significant constant of 3.27021 and a CCC coefficient of 0.126976 (not significant). The results for 2002 are as follows: Model 25 represents the entire year, with R-squared equal to 0.005869, a statistically significant constant of 1.68576 and a CCC coefficient of 0.0129249 (not significant). Particular strategies are presented in the following models: the aggressive one in Model 26, with R-squared equal to 0.000105, a statistically significant constant of 0.693089 and a CCC coefficient of -0.000170723 (not significant); the moderate one in Model 27, with R-squared equal to 0.002428, a constant of 1.37478 and a negative CCC coefficient (-0.00592728); and the relaxed one in Model 28, with R-squared equal to 0.027353, a statistically significant constant of 3.21308 and a CCC coefficient of 0.121653 (not significant). The results for the year 2003 are given below. Model 29 presents the results for the whole year: R-squared is 0.027899, the constant is 1.6865 and the CCC coefficient is 0.0836279 (both the constant and the CCC being significant). Model 30 concerns the aggressive policy, with an R-squared of 0.040005, a statistically significant constant of 0.672568 and a CCC coefficient of 0.0163832 (not significant). Model 31 shows the results for the moderate strategy, with R-squared equal to 0.024667, a statistically significant constant of 1.36529 and a CCC coefficient of 0.0242455 (not significant). The relaxed policy is presented in Model 32, with an R-squared of 0.004140, a statistically significant constant of 3.13984 and a CCC coefficient of 0.031923 (not significant). The year 2004 is presented in Model 33, with R-squared equal to 0.001936, a statistically significant constant of 1.80565 and a CCC coefficient of 0.016959 (not significant). The aggressive approach is given in Model 34, with an R-squared of 0.011786, a statistically significant constant of 0.592073 and a negative CCC coefficient of -0.00687564 (not significant). The moderate strategy is shown in Model 35, with an R-squared equal to 0.007952, a statistically significant constant of 1.40715 and a negative CCC coefficient of 0.0077625 (not significant). The relaxed policy is shown in Model 36, with the following results: R squared is 0.012135 and the constant is significant, while the negative CCC coefficient ( 0.082246) is not. The year 2005 is described in Model 37, where R-squared equals 0.018054, the constant is 1.86508 and the CCC coefficient is 0.0519381, both the constant and the CCC being significant. The aggressive approach is given in Model 38, with an R-squared of 0.152872, a constant of 0.633277 and a CCC coefficient of 0.0201545, both the constant and the CCC being significant. The moderate strategy is presented in Model 39, with R-squared equal to 13
European Scientific Journal February 2013 edition vol.9, No.4 ISSN: 1857 – 7881 (Print) e - ISSN 1857- 7431
0.009309, a statistically significant constant of 1.47191 and a CCC coefficient of 0.0154167 (not significant). Model 40 presents the relaxed policy with the following values: R-squared equals 0.001277, the constant is statistically significant and equals 3.31015, and the CCC coefficient is 0.0158377 (not significant). The year 2006 is given in Model 41, with an R-squared of 0.008161, a statistically significant constant of 2.10023 and a CCC coefficient of 0.0479419 (not significant). In the aggressive policy presented in Model 42, R-squared is equal to 0.031821, the constant is 0.701269 (statistically significant) and the CCC coefficient is 0.0194036 (not significant). In the moderate strategy given in Model 43, R-squared is equal to 0.000764, the constant is 1.44045 (statistically significant) and the CCC coefficient is negative -0.00235914 (not significant). The relaxed policy is presented in Model 44, with an R-squared of 0.018080, a statistically significant constant of 3.97288 and a negative CCC coefficient of -0.0811596 (not significant). The year 2007 is presented in Model 45, where R-squared is 0.008653, the constant is 2.13353 (statistically significant) and the CCC coefficient is 0.0521561, but not significant. The aggressive policy is given in Model 46, with an R-squared of 0.035464, a statistically significant constant of 0.648936 and a negative CCC coefficient of -0.0104838 (not significant). Model 47 presents the moderate approach, with R-squared equal to 0.012494, a statistically significant constant of 1.42836 and a negative CCC coefficient of -0.00906143 (not significant). The relaxed policy is shown in Model 48, with an R-squared of 0.000057, a statistically significant constant of 3.72578 and a CCC coefficient of -0.0108293 (not significant). The results for the year 2008 are characterized by an R-squared of 0.000061, a statistically significant constant of 2.01529 and a CCC coefficient of 0.00455039 (not significant). The aggressive strategy is presented in Model 50, where R-squared is 0.008032, the constant is 0.566358 (statistically significant) and the CCC coefficient is 0.00552546 (not significant). The moderate approach is presented in Model 52, with an R-squared of 0.070385, a constant of 1.36786, and a CCC coefficient of 0.0292661, both the constant and CCC being significant. The relaxed policy is given in Model 52, with R-squared equal to 0.001176, a statistically significant constant of 0.001176 and a CCC coefficient of 0.0267579 (not significant). The year 2009 is described in Model 53, where R-squared equals 0.002608, the constant is statistically significant and equals 2.33345, and the CCC coefficient is 0.0550797, but not significant. Model 54 represents the aggressive approach, with an R-squared of 0.003667, a 14
European Scientific Journal February 2013 edition vol.9, No.4 ISSN: 1857 – 7881 (Print) e - ISSN 1857- 7431
statistically significant constant of 0.497314 and a CCC coefficient of 0.00736189 (not significant). The moderate strategy is presented in Model 55, with R-squared equal to 0.022547, a statistically significant constant of 1.37349 and a CCC coefficient of 0.0135751 (not significant). The relaxed policy is shown in Model 56 with the following results: Rsquared equals 0.012561, the constant is statistically significant and equals 4.50672 and the CCC coefficient is negative at -0.201181 (not significant). The year 2010 is given in Model 57, with R-squared equal to 0.040413, a constant of 1.55688 and a CCC coefficient of 0.0757548, both the constant and the CCC being significant. The aggressive strategy is presented in Model 58, with an R-squared of 0.051951, a statistically significant constant of 0.609467 and a CCC coefficient of 0.0218151 (not significant). Model 59 represents the moderate strategy, with an R-squared of 0.110994, a constant of 1.3549 and a CCC coefficient of 0.038213, both the constant and the CCC being statistically significant. The relaxed approach is presented in Model 60, where R-squared is 0.147994, the constant equals 2.70126 and the CCC coefficient is 0.117526, both the constant and the CCC being statistically significant. Model 61 presents the regression results for a negative CCC only when the CR is considered a dependent variable in the aggressive strategy. R-squared for this model is equal to 0.056359 with a constant of 0.790808 and a CCC coefficient of -0.0492748, both statistically significant. This means that if the CR grows, then the CCC also grows. As negative values of the CCC were adopted here, the absolute values should be considered in order to correctly interpret this relationship. Based on the regression results, it is easy to see that in the linear regression model the constant plays an important role and is very close to the mean CR. The summary results for the regressions are presented in Table 1 and are as follows. The mean R-squared value for the period is 0.01096, and the trend line shown in Figure 1 reveals an increasing correlation between the CCC and the CR, suggesting a corporate policy of measuring both static and dynamic liquidity in Poland. Furthermore, the mean value of the constant is 1.92458 and its trend line (given in Figure 2) also shows increasing values, indicating a growth of the CR in the analyzed period. This value is statistically significant at a level of 1% for this period of time. The CCC coefficient is statistically significant for the entire period, but if one analyzes individual years, the results are not always significant. The trend line is given in Figure 3, and it rises after an initial decline. Every function describing the trend is a polynomial.
15
European Scientific Journal February 2013 edition vol.9, No.4 ISSN: 1857 – 7881 (Print) e - ISSN 1857- 7431
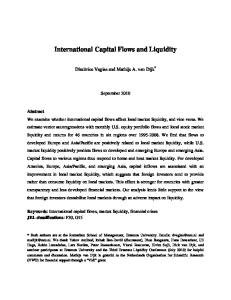
To obtain more useful results, yearly observations are divided according to working capital strategy, with the results presented in Table 2. In the aggressive strategy, the mean Rsquared value is 0.02927 and the trend line given in Figure 4 is upward and linear, indicating the tightening of liquidity management in companies pursuing the aggressive approach. The mean constant equals 0.67565, with a declining linear trend (given in Figure 5), while the CCC coefficient increases in a linear trend (with a mean of 0.0061), as shown in Figure 6, which indicates that the correlation becomes stronger. The aggressive approach is connected to negative CCC values and Model 61 shows the statistically significant results of this regression with R-squared at a very high level (0.152868), a constant of 0.390418 and a negative CCC coefficient of -0,0250477. These results reveal that the aggressive approach is pursued by strong companies. The CR increases in the range 0–0.99, with a declining CCC, but since only negative values of the CCC were adopted here, the absolute values (numbers of cycles per year) should be considered in interpreting this relationship, as it was already mentioned above. In such a case the CCC value will be increasing. The results for the moderate policy are presented in Table 3, with the mean R-squared value equal to 0.02823 and an upward trend line shown in Figure 7, which corroborates the hypothesis of market development. The mean constant is 1.41134 and its value decreases in a linear trend, given in Figure 8. The mean CCC coefficient is equal to 0.01862 and grows following a drop in the polynomial trend line (shown in Figure 9). The relaxed policy results are given in Table 4. The mean R-squared value for this strategy is equal to 0.02216 and Figure 10 shows its upward trend line, which proves the tightening of working capital management. The mean constant equals 3.44159 and rises, as it is shown in Figure 11, while the CCC coefficient declines (see Figure 12). A comparison of different working capital strategies shows that mean R-squared for the aggressive strategy is the largest, followed by that for the moderate and relaxed policies, but the difference is small and all of the values are rising. The growth of the constant depends on the strategy and is the lowest for the aggressive strategy and the highest for the relaxed strategy. For the aggressive and moderate strategies, its value declines, while for the relaxed one it rises. If these results are combined with those for the CCC coefficient, one can notice that the mean coefficient value is the highest for the moderate strategy and the smallest for the relaxed one. The CCC trend moves upward in the aggressive and moderate strategies (with a falling constant) while in the relaxed one the CCC trend declines with an increasing constant.
16
European Scientific Journal February 2013 edition vol.9, No.4 ISSN: 1857 – 7881 (Print) e - ISSN 1857- 7431
Since the correlation between the CR and the CCC becomes stronger, the aggressive and moderate strategies are characterized by an increased number of cash conversion cycles, while the conservative strategy reveals a decreased number of these cycles. These results are consistent with the theoretical assumptions and improve with market development. Conclusion The discussion concerning liquidity management in companies is not intense enough, even if managers spend most of their time making decisions in this field. The business model is changing as corporations are increasingly confident about their sales and operate in the global market using supply chain management to decrease costs. Small businesses are less competitive and affected by a lack of managerial skills, especially in the field of liquidity management. The present study was conducted based on the developing Polish market with a strong and expanding stock exchange (WSE). Using data from a developing economy, we obtained interesting results indicating an increasingly strong relationship between the various approaches to liquidity management. As a specific number of observations is required for the regression model, smaller developing markets could not be studied. Moreover, due to the fact that no huge corporations are listed on the WSE, the improvement in working capital management seems to be connected to the development of managerial skills. In building the model, the author used the number of cash conversion cycles per year assuming that the relationship between the CR and the CCC coefficient can be analyzed based on their standardized levels, since it is difficult to compare CR levels with days. The current ratio was assumed to be a dependent variable and the cash conversion cycle an independent one due to the nature of their relationship and the fact that the CCC represents the action and the CR the effect. As the working capital strategy significantly affects the current ratio, the sample was divided into 3 subgroups representing aggressive, moderate and relaxed policies. Within these three groups, regression was conducted for the entire 1997– 2010 period and for each year individually. The results for the entire period of analysis show very little correlation between dynamic and static liquidity measures, but it is important that the results are statistically significant. If the sample is divided according to strategy, one can see that the aggressive approach is characterized by a higher R-squared and a lower constant than the other strategies, which shows that the correlation is stronger because the CR increases with the CCC, as expected. On the other hand, in the 1997–2010 period the relaxed policy is characterized by a high value of the constant and a low R-squared with the CCC coefficient not being statistically significant, which indicates a lack of liquidity management in this approach. 17
European Scientific Journal February 2013 edition vol.9, No.4 ISSN: 1857 – 7881 (Print) e - ISSN 1857- 7431
The results of the 61 regression models involving each year and type of strategy reveal that the constant corresponds to the mean CR value and is statistically significant, while Rsquared is quite low, which indicates a weak influence of the CCC on CR levels. The analysis may be concluded with the following statements: •
The R-squared trend line shows an increasing correlation between the CCC and the
CR following a decline, indicating a growing unification of static and dynamic liquidity management. •
Over the period of study, the constant increases following a fall, indicating a growing
average CR level in recent years. •
The CCC coefficient rises following a drop, indicating a growing influence of the
CCC on CR levels, which is connected to liquidity management both in the static and dynamic context. When the results are considered according to strategy, the aggressive approach can be characterized by the following statements: •
Regression analysis was conducted with negative values of the CCC, and so the
absolute values should be taken into account. Thus, the CCC grows with the CR. •
The R-squared trend line is linear and grows over time, indicating increasingly tighter
liquidity management in companies. •
The linear trend of the constant declines with an upward linear trend of the CCC
coefficient, as the correlation becomes stronger. The results show that the aggressive strategy is mostly pursued by large and strong companies, and an increase in the CR in the 0 - 0.99 range is connected to an increase in absolute CCC values (which represent the number of cycles per year). Given the results for the moderate policy, one can conclude that: •
The upward R-squared trend line proves the hypothesis of market development.
•
The constant decreases in a linear trend.
•
The CCC coefficient rises following a drop in the polynomial trend line.
It can be seen that the moderate strategy is connected to tighter liquidity management and the CR increases with the CCC. The analysis results for the relaxed policy lead to the following conclusions: •
There is an upward R-squared trend line, which proves that working capital
management became tighter over time. •
The constant shows an upward trend line.
•
The CCC coefficient declines. 18
European Scientific Journal February 2013 edition vol.9, No.4 ISSN: 1857 – 7881 (Print) e - ISSN 1857- 7431
According to the assumptions, a decrease in the number of cycles will affect the CR positively if working capital management will be implemented in line with the relaxed approach. From the specific moment when a company becomes over-liquid, the number of cycles decreases because the positive value of working capital is not connected with growing sales. This means that the company faces problems that may potentially lead to bankruptcy. Moreover, a comparison of different working capital strategies shows that mean Rsquared for the aggressive strategy is the highest of all, followed by the moderate and relaxed policies, but the difference is not large. As a matter of fact, R-squared values are rather small, but rise over time. References: Clancy, Tom, Carl Stiner, and Tony Koltz. Shadow Warriors: Inside the Special Forces. New York: Putnam, 2002. Bolek M., Wolski R., Profitability or Liquidity: Influencing the Market Value-The Case of Poland, International Journal of Economics and Finance, Vol 4, No 9, 2012, DOI: 10.5539/ijef.v4n9p182. Cote J.M., Latham C.K., The merchandising ratio: a comprehensive measure of working capital strategy, Issues in Accounting Education, Vol. 14, No. 2, 1999, DOI: 10.2308/iace.1999.14.2.255. Courtis J.K., Modelling a financial ratios categoric framework, - Journal of Business Finance & Accounting, Volume 5, Issue 4, 1978, DOI: 10.1111/j.1468-5957.1978.tb01059.x. Farris II M.T., Hutchison P.D., Cash-to-cash: the new supply chain management metric, International Journal of Physical Distribution & Logistics Management, Vol. 32 Iss. 4, 2002, DOI: 10.1108/09600030210430651. Gallinger G., Drop the Current Ratio – Pick Up the CCC. Business Credit. May 1997. Hausman W., Supply chain performance metrics, The practice of supply chain management, Volume 62, 2004. Kamath, R., 1989. How Useful are Common Liquidity Measures? Journal of Cash Management. January / February 1989. Lancaster C. , Stevens J.L., Corporate liquidity and the significance of earnings versus cash flow: an examination of industry effects, Journal of Applied Business Research,
Vol.
15,
No 3, 1999. Lyroudi K., The Liquidity – Profitability Trade-off for Polish Companies, Economies of Balkan and Eastern Europe Countries in the Changed World, Sofia, 2012. 19
European Scientific Journal February 2013 edition vol.9, No.4 ISSN: 1857 – 7881 (Print) e - ISSN 1857- 7431
Lyroudi K., Lazaridis Y., The cash conversion cycle and liquidity analysis of the food industry in Greece, SSRN, DOI :10.2139/ssrn.236175, 2000. Kim C.S., Mauer D.C.,. The determinants of corporate liquidity: Theory and evidence, Journal of Financial and Quantitative Analysis, Vol. 33, Issue 3, September, 1998, DOI: http://dx.doi.org/10.2307/2331099 Moss J.D., Stine B., Cash conversion cycle and firm size: a study of retail firms, Managerial Finance, Vol. 19 Iss: 8, 1993, DOI: 10.1108/eb013739 Ortín-Ángel P., Prior D.,. Accounting Turnover Ratios and Cash Conversion Cycle, Problems and Perspectives of Management, Vol. 1, 2004. Rappaport A. , The economics of short-term performance obsession, Financial Analysts Journal, Vol. 61, No. 3, May – June, 2005. Richards V.D., Laughlin E.J.,
A cash conversion cycle approach to liquidity analysis,
Financial Management, Vol. 9, No. 1, Spring, 1980. Schilling G., Working Capital's Role in Maintaining Corporate Liquidity. TMA Journal, September / October 1996.
Tables Table 1. Regression results for in period 1997 – 2010 Year 1997 1998 1999 2000 2001 2002 2003 2004 2005 2006 2007 2008 2009 2010 Mean St. Dev.
Model
R - squared
5 9 13 17 21 25 29 33 37 41 45 49 53 57
0,02196 0,01182 0,00231 0,00009 0,00355 0,00587 0,02790 0,00194 0,01805 0,00816 0,00865 0,00006 0,00261 0,04041 0,01096 0,01204
Constant coef. 2,22960 2,09584 1,95951 1,80291 1,67391 1,68576 1,68650 1,80565 1,86508 2,10023 2,13353 2,01529 2,33345 1,55688 1,92458 0,23497
CCC coef.
Significance
0,20590 0,09450 0,02591 0,00400 0,01692 0,01292 0,08363 0,01696 0,05194 0,04794 0,05216 0,00455 0,05508 0,07575 0,05344 0,05282
1%, 1%, 1%, 1%, 1%, 1%, 1%, 5% 1%, 1%, 10% 1%, 1%, 1%, 1%, 1%, 5%
20
European Scientific Journal February 2013 edition vol.9, No.4 ISSN: 1857 – 7881 (Print) e - ISSN 1857- 7431
Table 2. Regression results the aggressive strategy in the period 1997 – 2010 Year 1997 1998 1999 2000 2001 2002 2003 2004 2005 2006 2007 2008 2009 2010 Mean St. Dev.
Model
R - squared
6 10 14 18 22 26 30 34 38 42 46 50 54 58
0,03500 0,00205 0,02306 0,00429 0,00973 0,00011 0,04001 0,01179 0,15287 0,03182 0,03546 0,00803 0,00367 0,05195 0,02927 0,03926
Constant coef. 0,81954 0,75176 0,80239 0,74660 0,72447 0,69309 0,67257 0,59207 0,63328 0,70127 0,64894 0,56636 0,49731 0,60947 0,67565 0,09139
CCC coef. Significance 0,01683 -0,00330 -0,00719 0,00332 0,00263 -0,00017 0,01638 -0,00688 0,02015 0,01940 -0,01048 0,00553 0,00736 0,02182 0,00610 0,01113
1%, 1%, 1%, 1%, 1%, 1%, 1%, 1%, 1%, 5% 1%, 1%, 1%, 1%, 1%, -
Table 3. Regression results the moderate strategy in the period 1997 – 2010 Year
Model
R - squared
7 11 15 19 23 27 31 35 39 43 47 51 55 59
0,00370 0,02528 0,02843 0,07258 0,00375 0,00243 0,02467 0,00795 0,00931 0,00076 0,01249 0,07039 0,02255 0,11099 0,02823 0,03315
1997 1998 1999 2000 2001 2002 2003 2004 2005 2006 2007 2008 2009 2010 Mean St. Dev.
Constant coef. 1,47594 1,39367 1,48774 1,39360 1,42363 1,37478 1,36529 1,40715 1,47191 1,44045 1,42836 1,36786 1,37349 1,35490 1,41134 0,04436
CCC coef.
Significance
0,07751 0,04664 0,02019 0,02945 -0,00875 -0,00593 0,02425 -0,00776 0,01542 -0,00236 -0,00906 0,02927 0,01358 0,03821 0,01862 0,02510
1%, 1%, 1%, 1%, 5% 1%, 1%, 1%, 1%, 1%, 1%, 1%, 1%, 5% 1%, 1%, 5%
Table 4. Regression results the relaxed strategy in the period 1997 – 2010 Year 1997 1998 1999 2000 2001 2002 2003 2004 2005 2006 2007 2008 2009 2010 Mean St. Dev.
R - squared 0,00695 0,01703 0,00084 0,00418 0,05653 0,02735 0,00414 0,01214 0,00128 0,01808 0,00006 0,00118 0,01256 0,14799 0,02216 0,03920
Constant coef. 3,42022 3,05056 3,13182 3,30681 3,27021 3,21308 3,13984 3,34091 3,31015 3,97288 3,72578 4,09201 4,50672 2,70126 3,44159 0,47525
CCC coef. Significance -0,17595 0,18614 0,04018 -0,05555 0,12698 0,12165 0,03192 -0,08225 0,01584 -0,08116 -0,01083 -0,02676 -0,20118 0,11753 0,00047 0,11468
1%, 1%, 1%, 1%, 1%, 1%, 1%, 1%, 1%, 1%, 1%, 1%, 1%, 1%, 5%
21
European Scientific Journal February 2013 edition vol.9, No.4 ISSN: 1857 – 7881 (Print) e - ISSN 1857- 7431
Figure 1. Model R – squared trend in the period 1997 - 2010
0,04500 0,04000 0,03500 0,03000 0,02500 0,02000 0,01500 0,01000 0,00500 0,00000 1997 1998 1999 2000 2001 2002 2003 2004 2005 2006 2007 2008 2009 2010
Figure 2. Model constant trend in the period 1997 - 2010
2,50000 2,00000 1,50000 1,00000 0,50000 0,00000 1997 1998 1999 2000 2001 2002 2003 2004 2005 2006 2007 2008 2009 2010
Figure 3. Model CCC coefficient trend in the period 1997 - 2010
0,25000 0,20000 0,15000 0,10000 0,05000 0,00000 1997 1998 1999 2000 2001 2002 2003 2004 2005 2006 2007 2008 2009 2010
Figure 4. Model R – squared trend in the period 1997 – 2010 the aggressive strategy
0,18000 0,16000 0,14000 0,12000 0,10000 0,08000 0,06000 0,04000 0,02000 0,00000 1997 1998 1999 2000 2001 2002 2003 2004 2005 2006 2007 2008 2009 2010
22
European Scientific Journal February 2013 edition vol.9, No.4 ISSN: 1857 – 7881 (Print) e - ISSN 1857- 7431
Figure 5. Model constant trend in the period 1997 – 2010 the aggressive strategy
0,90000 0,80000 0,70000 0,60000 0,50000 0,40000 0,30000 0,20000 0,10000 0,00000 1997 1998 1999 2000 2001 2002 2003 2004 2005 2006 2007 2008 2009 2010
Figure 6. Model CCC coefficient trend in the period 1997 – 2010 the aggressive strategy
0,02500 0,02000 0,01500 0,01000 0,00500 0,00000 -0,005001997 1998 1999 2000 2001 2002 2003 2004 2005 2006 2007 2008 2009 2010 -0,01000 -0,01500
Figure 7. Model R – squared trend in the period 1997 – 2010 the moderate strategy
0,12000 0,10000 0,08000 0,06000 0,04000 0,02000 0,00000 1997 1998 1999 2000 2001 2002 2003 2004 2005 2006 2007 2008 2009 2010
Figure 8. Model constant trend in the period 1997 – 2010 the moderate strategy
1,50000 1,48000 1,46000 1,44000 1,42000 1,40000 1,38000 1,36000 1,34000 1997 1998 1999 2000 2001 2002 2003 2004 2005 2006 2007 2008 2009 2010
23
European Scientific Journal February 2013 edition vol.9, No.4 ISSN: 1857 – 7881 (Print) e - ISSN 1857- 7431
Figure 9. Model CCC coefficient trend in the period 1997 – 2010 the moderate strategy
0,10000 0,08000 0,06000 0,04000 0,02000 0,00000 1997 1998 1999 2000 2001 2002 2003 2004 2005 2006 2007 2008 2009 2010 -0,02000
Figure 10. Model R – squared trend in the period 1997 – 2010 the relaxed strategy 0,16000 0,14000 0,12000 0,10000 0,08000 0,06000 0,04000 0,02000 0,00000 1997 1998 1999 2000 2001 2002 2003 2004 2005 2006 2007 2008 2009 2010
Figure 11. Model constant trend in the period 1997 – 2010 the relaxed strategy
5,00000 4,00000 3,00000 2,00000 1,00000 0,00000 1997 1998 1999 2000 2001 2002 2003 2004 2005 2006 2007 2008 2009 2010
Figure 12. Model CCC coefficient trend in the period 1997 – 2010 the relaxed strategy 0,25000 0,20000 0,15000 0,10000 0,05000 0,00000 -0,050001997 1998 1999 2000 2001 2002 2003 2004 2005 2006 2007 2008 2009 2010 -0,10000 -0,15000 -0,20000 -0,25000
24