An experiment was designed to assess variations in perception of communication style by persons with differing Communication Style Measure (CSM) scores. Twenty-four dyads participated in an interpersonal encounter. Postinteraction data analysis indicates that subjects with low CSM scores do not report perceiving any appreciable difference between their communication style and that of subjects with high CSM scores. In contrast, subjects with high CSM scores report perceiving a significant difference. Clues about perceptual differences were investigated via
step wise regression.
DYADIC PERCEPTION OF COMMUNICATION STYLE ROBERT W. NORTON and LARRY D. MILLER University of Michigan
This
study addresses a problem that evolved out of a concern to develop-in the spirit of Bales (1950, 1956, 1970), Mann (1959, 1967), and Slater (1955)-a theory centered around interpersonal communication styles. A person’s communication style was determined by a paperand-pencil test’ which tapped characteristic predispositions toward
style
an
on
interactive situation. The effect of communication one’s perception of the self and the other was
studied in dyadic encounters. Our effort represents a belief that a variety of communication predispositions sufficiently correlate with one another to the point that we can speak of them as a construct which we labeled &dquo;communication style.&dquo; Although a paper-andpencil test cannot provide a strong base for a theory, it initially moves us closer to a theory by establishing a AUTHORS’ NOTE: Portions of this article were presented Speech Communication Association Convention in New York. COMMUNICATION RESEARCH, Vol. 2 No. 1, January 1975
[50]
at the
1973
[51]
functional relationship between a construct of communication style and other variables, by representing a specified universe of communication concerns, and by measuring communication traits. Ultimately, this research will take us in many directions including use of the Communication Style Measure (CSM) to predict behaviors dealing with attractiveness, effectiveness, conflict resolution, self-image, ambiguity tolerance, and perception. In this study, we focus upon dyadic perceptions. Not many researchers have examined perceptions as a function of communication style. Bushard (1959) observed that enlisted men in small military units (eight to ten man squads) after brief exposures and limited interactions could be differentiated by communication patterns. The most dominant persons were quite talkative, outgoing, and aggressive. Further, these individuals were markedly critical of those they perceived as verbally and socially inept. They were not the most intelligent members of the group, but they did have the greatest social skill. As a result, they maintained prominent positions but were not often among the true group leaders. The second kind of interpersonal style was displayed by the leaders who were usually intelligent, tended to be verbally reserved until others had spoken, and frequently revealed greater perceptivity in their judgments of others. The third kind of interpersonal style was reflected by persons of little verbal intelligence. Such persons tended to remain silent, but usually became increasingly ill at ease until they were ultimately moved to make a contribution. In essence, Bushard found a relationship between a type of communication style and one’s leadership ability. Bales (1970) touches upon some aspects of the communication style effect upon perception with his analysis of types of group roles. For example, the UNF Type (a person in the upward, negative, and forward space of Bales’ model) is characterized (1970: 221) as likely to misperceive: &dquo;In actuality he distorts his perception of his own personality so
[52] to put the bad and feared impulses into others and then often infuses his own aggression, fear, and even contempt for others into his actions toward them.&dquo; The UNF Type is seen as dominating and unfriendly; he takes the initiative in the value- or task-oriented direction. In terms of the way he communicates, Bales (1970: 221) writes: as
The person in the UNF role has a prominent place in the group. His total interaction initiated is high, though not necessarily the highest in the group. He tends, even so, to &dquo;overtalk.&dquo; His tendency to talk to the group as a whole, rather than particular members, is high, but his total interaction received from others is only average. Either he tends to prevent replies, by overtalking, or others tend to withhold replies, or both.
Bales points out that dominance is associated with talking a lot. But, dominance as a personality trait may not necessarily cause talking. Bales (1970: 168) explains that &dquo;it is just as important to note that both the personality trait (as perceived by the others) and the behavior are alike in that they affect others in the group in such a way as to make them feel that their power is reduced. In other words, dominance may be simultaneously a power determinant and a power effect.&dquo; Although Hayes and Meltzer (1972) do not look at style of communication in the same sense that Bales looks at type of group roles, they examine a behavior closely related to and entailed by the Communication Style Measure-namely, talkativeness. They demonstrate that sheer amount of talk can accurately predict judgments of activity, dominance, prominence, and assertiveness. They argue that talkativeness is curvilinearly related to evaluative dimensions: &dquo;Persons who talk a great deal or very little are rated unfavorably and they are described as having predominantly unpleasant attributes. The most favorable evaluations are given to persons who contribute somewhat more than their share to the conversation&dquo; (1972: 554). This means that there
[53]
probably is an optimal level of talkativeness in which the person is perceived by the others in the most favorable light. reasonable to conclude that if the person’s own perception of that level coincides with that of the group’s perception, then that person is closely aligned with the expectations of that context. The emergent hypothesis is: &dquo;Iss the person who is most sensitive to these kinds of expectations the person who is valued the most?&dquo; Communication research simply has not found out precisely what features of talk, dominance, paraverbal, silence, and the like influence interactive perceptions. Finally, although the following studies by Goslin (1962) and Lieberman, Yalom and Miles (1973) do not directly phrase their research in terms of communication style as a covariant of misperception, they suggest relevant hypotheses Goslin investigated accuracy of for our research. as a function of social acceptance. He self-perception and senior school students to be in each high required junior others company five hours a day for a minimum of eight months: &dquo;The children not only knew each other fairly well, but were operating as effective group units&dquo; (1962: 284). He found that the rejected students perceived themselves differently from the way they were perceived by the group. Also, the rejected students were unaware that they were being perceived differently. An amplification of this research would be to see whether certain enduring communication styles affected the accuracy of perception among the students. Lieberman, Yalom and Miles in an elaborate project studied 18 different encounter groups (251 Ss) to determine whether the way the leaders conducted themselves made a substantive difference in the relative benefit or harm group members experienced. Four dimensions operationally defined a leader style: (1) stimulation: revealing feelings, challenging, and confronting, (2) caring: protecting, offering friendship, and loving; (3) meaning-attribution: providing concepts for It
seems
[54]
how to understand; (4) executive function:
limit-setting, suggesting rules, limits, norms. Leader style can be used to discriminate in three areas of perception. First, some leaders misperceived their impact: &dquo;Often leaders saw themselves as more charismatic than they were seen to be by participants or observers&dquo; (1973: 260). Second, certain leader types could not assess accurately who in the group benefited from the therapy. Third, the style of the leader affected the degree of discrepancy between the participants’ view of self and ideal self-image: &dquo;Some leader styles significantly decreased the discrepancy between the person’s ideal self and his described self, while other leader styles had the opposite effect of making the discrepancy between self and ideal greater&dquo; (1973: 257). While leader style is an interesting stratification, the analysis of communication style of every participant could provide information to deal with more encompassing questions. What kind of communicator benefits the most from specific therapies? What kind of communicator is most vulnerable in therapeutic situations? What kind of communicator perceives most accurately the dynamics of therapy? As indicated
above, there is not very much research examining directly perceptual accuracy as a function of how one communicates. Piecemeal evidence indicated that (1) enduring leaders were more intelligent, verbally reserved, and more perceptive (Bushard, 1959), (2) dominance as a
personality trait can be used as a power strategy (Bales, (1970), (3) too much or too little talkativeness is disliked by others (Hayes and Meltzer, 1972), (4) students accepted by the group more accurately perceive social interactions (Goslin, 1962), and (5) leader style influenced self-perception and other-perception (Lieberman, Yalom and Miles, 1973). At this step in developing a theory of communication style, there is not enough information in the literature to provide a basis for an obvious hypothesis. To gain a clearer set of expectations about this construct, the present study attempts to assess the variations of perception of communication
[55]
styles by persons with different CSM interpersonal encounter.
scores
in
a
mutual
METHOD COMMUNICATION STYLE MEASURE
A crucial step in this research was to define types of communication style. For the purpose of this study, the Communication Style Measure (CSM) was used to operationalize the construct. The CSM is a 25-item, paper-and-pencil test using a seven-point response scale initially developed and refined by Mortensen, Norton, and Arntson (University of Wisconsin, 1972). The test is internally consistent in measuring a single construct. The respective Hoyt coefficients across five revisions of the test (1,127 Ss) were .73, .79, .88, .88, and .89 (Mortensen, 1972). The stabilization of the Hoyt coefficient in the last three revisions indicates that a high degree of confidence can be placed in the internal reliability of this test. The measure also has good criteria-related validity. It correlates adequately with self-esteem, self-acceptance, communication confidence, and dominance (Mortena
sen,
1972).
Because the CSM contains variables that are experimentally dependent caused by overlapping items (Nunnally, 1967), the infrastructure of the construct was identified by
using McQuitty’s (1957, 1968, 1971) elementary linkage analysis to form clusters rather than using factor analysis. The three clusters which emerged represent the essence of the CSM. Dominance
In this cluster, which accounts for about 25% of the test, . the items reflected a person’s need to be in control:
(17) I would describe myself as dominant in social situations. (15) I try to take charge of things when I am with people. (18) When I am with others I am inclined to talk forcefully.
[56]
(10) I n (4) I n
most social situations I tend to come
on
strong.
social situations I tend to direct the conversation. most
(2) 1 have other
For
a
a tendency people.
course
of
to dominate informal conversations with
person to obtain
a
high CSM
score, he must be
to describe himself as dominant and forceful; he himself as coming on strong, directing the course of conversation, and trying to take charge.
predisposed
seems
Frequency of Speech This cluster accounts for about 23% of the test. A person who receives a high CSM score sees himself as talking for long periods of time, offering long comments, and preferring not to listen. The cluster is closely aligned with the dominance cluster except the items are phrased in terms of the amount of talking. In fact, some researchers (Mann, 1959, Knott and Drost, 1965) define dominance in terms of frequency of speech. Representative items included: (3) When I (21) In
am
with other
people I generally talk often.
most social situations I tend to
speak
for
long periods of
time.
(24) 1 probably [do not] speak for shorter periods of time than the average person.
(22) I am [not] inclined
to let other
people talk for long periods of
time.
(7) In
most
social situations I
generally speak quite frequently.
In some situations, the dominance cluster and the frequency of speech cluster could be orthogonal. That is, a very dominant person by the nature of his status, prestige, or power could control the conversation without speaking very often. Conversely, a chatterbox could fill a conversational
[57]
without dominating (in the sense of influencing the ultimate outcome). I n this study &dquo;dominance&dquo; is anchored to the items in the test. It is treated as a predisposition which may manifest itself not only through frequency of speech, but also as a function of perceived power.
period
Momentum
This cluster accounts for 32% of the test. The items reflected a person’s predisposition to be involved with the ongoing movement of a conversation. Typical items included: (5) When I
am
awhile to
with others it
generally [does
up
enough
18) I [do not] tend
to
hesitate when I speak.
(14)
I
(1)
I
to feel inhibited when
find that I
generally am [not] inclined
[do not]
to let other
generally [do not] rely going.
(6) I
take]
me
quite
to say very much.
warm
113) I [do not] tend
not
on
I talk with others.
express
myself quite freely.
people
start
conversations.
others to keep conversations
The brackets indicate which items were reversed in scoring. By definition, then, a person with a high CSM score is predisposed to see himself as dominant, a frequent talker, and a relatively sustained conversationalist. These scores provided the basis to design an experiment to examine one kind of perceptual accuracy in dyads. The independent variable of communication style was determined by stratifying the sample of those who took the CSM pretest into three categories-high, middle, and low. Any person scoring greater than one standard deviation from the mean of all items on the CSM was classified as &dquo;high.&dquo; This meant that the person saw himself as very dominant, a frequent talker, and high in momentum. Any person scoring less than one standard deviation from the mean was classified
[58]
as
&dquo;low.&dquo;
mean was
Any
person within
classified
as
a
standard deviation of the
&dquo;middle.&dquo;
DEPENDENT VARIABLE
The dependent variable in this study was a 15-item version of the CSM administered after the subjects mutually completed a task. The questionnaire consisted of the most representative items from the cluster analysis-that is, those items which had the highest and most intercorrelations with other items in the cluster. A seven-point response scale for each item was used again. The post hoc CSM provided information concerning (1) how the subjects viewed themselves in the interpersonal encounter, and (2) how the subjects viewed the other person in the same encounter. The CSM pretest and the CSM posttest were used to pinpoint the apparent discrepancies in perceptions by each subject. SUBJECTS
One hundred undergraduate speech communication students at the University of Michigan voluntarily completed the questionnaire assessing communication style. The scores were normally distributed. From this pool of subjects, 24 dyads were constructed. DESIGN
.
design employed 48 subjects in 24 dyads. Twelve dyads composed the first condition in which a subject with a high CSM score was paired with a subject with a low CSM score. Since the mean for the sample was 4.41 and the standardard deviation was .50, any subject with a score of 4.91 or greater was defined as a high. Any subject with a The
of 3.91 or less was defined as a low. To control for sex effects, combinations of sex-mixed and sex-same dyads were score
[59]
considered. In the second condition, composed of 12 dyads, subjects with a middle CSM score were paired. Again, sex effects were controlled. Any subject scoring between 4.91 and 3.91 was defined as a middle. _
PROCEDURE _
A three- to six-week period passed between the CSM pretest and the dyadic encounter. The stimulus was a case study concerning American values. In it, the person was asked to determine five objects which best symbolized 1973 American values. In pretests, this case study always produced
lively discussions. First, the subjects were given five minutes to individually complete the task. This procedure gave each subject time to understand the task and to commit himself to some solution. Second, the subjects were given ten minutes to interact and mutually complete the same task. The subjects were left alone during this phase. After the ten-minute period, the subjects were asked to respond to two 15-item communication style measures. Both measures employed the same questions. The first questionnaire measured the self-perceptions of the subject’s communication style in the interaction; the second questionnaire measured the subject’s perception of the other’s communication style in the interaction. In short, four postmeasures were obtained for each dyad. The difference between the self-rating-self measure and the self-rating-other measure provided an indication of how discrepant the communication styles were from each other.
RESULTS
Table 1 reports the means for each condition. The multivariate analysis of variance showed one significant main effect and one significant interaction. On the average a
[60]
TABLE 1
MEANS FOR POSTMEASURES
person tends to see himself as having a significantly higher CSM score than the other. The mean for self-rating-self was 67.7 and the mean for the self-rating-other was 59.7 [ F(1,84)
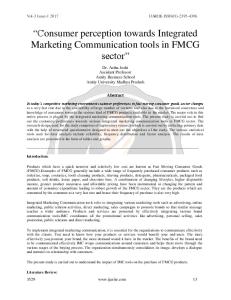
= 13.0, p < .01 ] . Table 2 shows the means for the interaction. Figure 1 shows the graph of the interaction [ F(2,84) 11.1, p < .01 ] . No other effect was significant. A stepwise regression (Draper and Smith, 1966; Cooley and Lohnes, 1971) was done for the self-rating-self and the =
self-rating-other postmeasures to obtain clues about perceptual differences. With .05 for the F-ratio criterion out of the 15 possible variables, 11 steps of regression were completed for the self-rating-self postmeasure with an R2 of .54 and 12 steps of regression were completed for the self-rating-other TABLE 2
MEANS FOR INTERACTION
[61]
Figure 1: MEAN SCORES ON POSTCOMMUNICATION STYLE MEASURE FOR THE SELF RATING SELF AND FOR THE SELF RATING OTHER. NOTE USE OF HATCH MARK ON ORDINATE
postmeasure with an R2 of .49. Table 3 reports the magnitude of the squared betas which indicates the relative contribution of each variable to the prediction of the criterion. Only the strongest coefficients were reported. It appears that the subject had little difficulty assessing the question &dquo;Did you seem able to express yourself quite freely?&dquo; for both himself and the other person. For the remaining questions, however, it appears that the subject had an easier time rating the other person than himself. Where the question &dquo;Did you tend to hesitate when speaking?&dquo; explained 36% of the variance by itself when the subject rated the other, it explained nothing when the subject rated himself. The question concerning the amount of speaking time explained 17% of the variance by itself when the subject rated the other; it explained only 2% of the variance by itself when the subject rated himself. Finally, concerning the
.
[62] TABLE 3
BETA COEFFICIENTS FOR STEPWISE REGRESSION
a.
For the self-rating-other postmeasure, the questions were phrased in terms of
the other person. b. For the self-rating-other of .05 for the F ratio.
regression analysis, this variable did
variable of warm-up time by itself, it variance when the other was rated, but was rated.
not meet criterion
explained 13% of the only 1% when the self
DISCUSSION
As expected, the persons in the second condition saw themselves and the others as falling into the middle range of CSM scores. It was thought that the persons in the first condition (high versus low) would perceive themselves and each other accordingly. However, the person with the low CSM pretest score saw no difference between himself and the other. In fact, he rated himself and the other as falling into the middle range of communicator styles. The person with a high CSM pretest score perceived a clear difference between himself and the other. In short, persons reporting, high and low CSM pretest scores perceived one another’s communication style differently in a mutual interpersonal encounter.
[63]
There
viable explanations for the findings: (1) a social-desirability factor confounded the postmeasure, or (2) the person with the low CSM score did not perceive accurately. If, after the dyadic encounter, the person with the low
are two
score
reasoned that it
was
undesirable to be labeled
such, then he might systematically inflate his self score and deflate the other score. To further test the first explanation, the researcher should address the following components (Nunnally, 1967): (1) actual adjustment of the individual, (2) knowledge the individual has about his own traits, and (3) frankness of the individual in stating what he knows. It is possible that a persons with a low CSM pretest score may make ongoing, complex, and interrelated adjustments so as
that by the end of the encounter he may be behaving in all respects like a person with a high or moderate CSM score. I ndeed, a person with a high CSM score might motivate the change. However, the likelihood of this occurrence is considerably decreased. Hayes and Meltzer (1972) suggest that such an effect is unlikely because the encounter was rather brief. Also, in the first condition, the person with the high CSM score testifies that the other person does have a low CSM score. Other types of adjustments include selective forgetting, denial, and possibly repression. If the individual does not have adequate knowledge about himself concerning verbal dynamics, he might not be able to articulate or report the relationships. The researcher might have to teach the subject to be more sensitive to the processes. For example, if the dyadic encounter were video taped, the subject could dispassionately analyze his verbal interactions. Finally, more precise evidence could be marshalled if the researcher could be assured of frankness of the individual. Hayes and Meltzer (1972) point out that socially inept people, i.e., people who experience difficulty in speaking, learn to be qu iet. I n turn, their lack of activity then becomes a cue indicating social and personal ineptitudes. The validity of this viewpoint has not been empirically demonstrated, but
[64]
it does suggest that social desirability rather than perceptual differences, may account for the failure of the subjects with a low CSM score to respond as expected. The second explanation has more radical and far-reaching implications. A major implication is that the person with the low CSM score is deficient in his interpretation of the communicative interaction. He may not be completely tuned in; he may be ignoring substantive feedback. If this analysis is correct, then the communication-style variable touches many behaviors and attitudes-such as problem-solving and therapeutic problems-which affect and effect many other behaviors and attitudes. One might be tempted to suggest, contrary to the second explanation, that high CSM scorers did not act as their pretest suggests and their self-report attests. Consequently, the low CSM scorers reported accurately. If this is correct, then not only are high-scoring persons perceptually deficient, but those with low CSM scores are functioning as moderately-scoring persons in the experimental situation. While this explanation cannot be wholly discounted, it is not the most parsimonious interpretation of the data. To obtain more evidence concerning what is perceived, a more precise methodology is required. The regression analysis points to some directions. For example, it cannot be assumed that the subject is fully aware of what constitutes &dquo;hesitancy&dquo; in the verbal interactions. The regression analysis indicated that hesitancy was the single greatest factor in explaining variance when the subject rated the other person, but it was not a factor when the subject rated himself. It cou Id be that whenever there is a period of si lence, the subject attributes that silence to the other person rather than himself. Obviously, a tight, operational definition is needed. In a like manner, the question &dquo;Did you seem able to express yourself freely?&dquo; requires more precision. The answer to this item is tainted by ambiguity either way the subject responds. One connotation implies that the other person was relatively fluent. A second connotation, however, suggests that the
[65]
may have hindered the other person during the interaction. It is socially desirable to allow another person to express himself freely. In short, each of the CSM posttest items requires further analysis and amplification. Moreover, a more precise methodology will not rely solely upon self-report data. If the present study had been supplemented by unobtrusive observation, raters, testimony from friends, and the like, more precise conclusions could be drawn. For example, trained raters observing the subjects through one-way mirrors would provide evidence to support or reject the above alternative explanations. A video tape of the encounter would provide a means for the subjects themselves to objectively review the interpersonal process. Lastly, interviewing friends of the subjects would provide additionally helpful data. This exploratory study detected an effect in which the person with a low CSM score either (1) feels compelled to compensate by manipulating his CSM posttest score and/or that of the other person, or (2) fails to perceive enough cues to allow accurate assessment of communication style(s) in a dyadic encounter. More research is needed if the effect of communication style on perception is to be solidly demonstrated.
subject
SUMMARY
Three basic steps were taken to help establish the communication style construct. First, a functional relationship between the CSM and a variable focusing upon how people with different styles (high, middle, low) perceive each other’s style was demonstrated. Second, the exploratory study provided further evidence that the specified universe of the CSM is viable enough to detect effects across styles of communication. In other words, the dominance, frequency of speech, and momentum clusters indicate construct validity for the CSM. Third, the study suggested at least one communication trait. Subjects with low CSM scores tended
[66]
to distort
systematically the rating of themselves and those high CSM scores. finding holds up, its impact upon therapeutic situations, teacher-pupil relationships, conflict-resolution contexts, and other human transactions may be important. Because the literature revealed no obvious hypothesis for this research, we simply performed an empirical study. The results now invite some directional hypotheses. who have If this
(1) A
person with a low CSM score tends to misperceive the communication styles of others. This theme, along the lines of research by Lieberman, Yalom and Miles (1973), could be expanded to test power differences, self-esteem problems, and
ability
to
empathize.
(2) A
person with a low CSM score is not attractive to group members. This type of research would be similar to Goslin’s
( 1962) study. person with a low CSM score is not effective. Effectiveness could be covaried in terms of leadership (Bushard, 1959), getting things done, or making maximum contribution.
(3) A
In summary, the communication style construct promises substantive directions in human communication research.
NOTE 1. Mortensen and Norton worked on the development of this test-originally labeled an "intensity test"-which covered the first three revisions. Mortensen and Arntson continued the refinement of the test with revisions four and five. Since then Norton and Miller have independently analyzed the test and have made further modest revisions.
REFERENCES R. F. (1970) Personality and Interpersonal Behavior. New York: Holt, Rinehart & Winston.
BALES,
[67] (1956) "Talk status and likeability as a function of talking and listening in decision-making groups," in L. D. White (ed.) The State of the Social Sciences. Chicago: Univ. of Chicago Press. (1950) Interaction Process Analysis, A Method for the Study of Small Groups. Reading, Mass.: Addison-Wesley. BUSHARD, B. L. (1959) "Methodology of the study," in K. L. Artis (ed.) The Symptom as Communication in Schizophrenia. New York: Grune & Stratton. COOLEY, W. W. and P. R. LOHNES (1971) Multivariate Data Analysis. New York: John Wiley. DRAPER, N. R. and H. SMITH (1966) Applied Regression Analysis. New York: John Wiley. GOSLIN, D. A. (1962) "Accuracy of self perception and social acceptance." Sociometry 25: 283-290. HAYES, D. and L. MELTZER (1972) "Interpersonal judgments based on talkativeness: fact or artifact." Sociometry 35: 338-561. KNOTT, P. D. and B. A. DROST (1965) "A measure of interpersonal ---
---
dominance." Behavioral Research Methods and Instruments 1: 139-140.
LIEBERMAN, M. A., I. D. YALOM, and M. B. MILES (1973) Encounter Groups: First Facts. New York: Basic Books.
McQUITTY, L. L. (1957) "Elementary linkage analysis for isolating orthogonal and oblique types and typal relevancies." Educ. and Psych. Measurement 17: 207-229. --- and J. A. CLARK (1968) "Clusters from interative, intercolumar correlational analysis."Educ. and Psych. Measurement 28: 211-238. McQUITTY, L. L. and J. M. FRARY (1971) "Reliable and valid hierarchical classifications." Educ. and Psych. Measurement 31 : 321-346. MANN, R. D. (1959) "A review of the relationships between personality and performance in small groups." Psych. Bull. 56: 241-270. --- G. S. GIBBARD, and J. J. HARTMAN (1967) Interpersonal Styles and Group Development. New York: John Wiley. MORTENSEN, D. (1972) "A report on the construct of speech intensity." Presented at the Speech Communication Association Convention, Chicago, December. NUNNALLY, J. C. (1967) Psychometric Theory. New York: McGraw-Hill. SLATER, P. E. (1955) "Role differentiation in small groups." Amer. Soc. Rev. 20: 300-310.
Robert W. Norton (Ph.D., University of Wisconsin, 1973) is an Assistant Professor of Speech Communication at the University of Michigan. Larry D. Miller is a doctoral candidate in speech communication at the University of Michigan.