DEVELOPMENT STRATEGY
Isabell Adenauer* and Laurence Vagassky**
Aid and the Real Exchange Rate: Dutch Disease Effects in African Countries There is little evidence to show that official development assistance to sub-Saharan African countries has led to significant improvements of macroeconomic indicators such as export performance. Using four CFA zone countries (Burkina Faso, Cote d'lvoire, Senegal and Togo) as case studies, this article analyses the relationship between aid inflows and the real exchange rate with a view to identifying symptoms of "Dutch disease" in these economies.
D
uring the 1970s, the economies of the Communaute Financiere Africaine (CFA) zone member countries were regarded as performing well, as these countries' high growth rates and low inflation (relative to the rest of region) differentiated them from most African countries. The fixed exchange rate with the French franc, coupled with the monetary restrictions to which the members of the CFA zone were committed, appeared to ensure a degree of macroeconomic stability that greatly contrasted with the "stop and go" cycles observed in many other developing countries. Yet by the middle of the 1980s, CFA member countries were registering declines in both output and economic activity. At the same time, aid levels to these sub-Saharan economies on average increased. While adverse international conditions (such as the decrease in the price of these countries' main export commodities and the deterioration of their terms of trade) and domestic economic management (such as continued high levels of government expenditure and imprudent credit policies) are among the main reasons for the decline in output and economic activity, these poor results also put in question the effectiveness of foreign aid, referred to as official development assistance (ODA), to these countries. In this respect, recent research has argued that, from an economic growth perspective, no significant correlation between permanent aid and growth can be found; instead, all aid goes into consumption and does not lead to economic development.' These findings contradict the idea of earlier "gap" models, which suggested that capital shortages in developing countries should be overcome by aid inflows in order to enhance growth.
Theory has also focused on the impact that aid has had on the relative prices of non-traded and traded goods within the recipient country. Entering the economy as foreign exchange, aid can cause the price of non-traded goods to rise relative to that of traded goods, bringing about a change in the real exchange rate (RER). Known as the "Dutch disease," this theory identifies the paradox impact of aid on the recipient country, which causes a decline in competitiveness through an appreciation of the real exchange rate and a decrease in exports.2 While a large body of literature exists on the subject, little empirical work has been done on the aid-RER relationship. However, a paper by van Wijnbergen empirically shows how an increase in aid inflows can cause the real exchange rate to appreciate in the context of the Salter-Swan dependent economy model.3 In this framework, this paper focuses on the "Dutch disease" effects that aid has had in four West African CFA member countries: Burkina Faso, Cote d'lvoire, Senegal and Togo. Using regression analysis and data for 1980-1992, the nexus between permanent aid and the real exchange rate is tested for these countries. While our equation is based on fundamentals and does not take into consideration monetary factors (the four countries under consideration are all members of the West African Monetary Union (Union Monetaire
1 See Peter B o o n e : The Impact of Foreign Aid on Savings and Growth, London 1994. 2
The term "Dutch disease" refers to the discovery and export of natural gas during the 1960s in the Netherlands, which was followed by a decline in competitiveness because of increased costs of production. While the government sector flourished, the profitability of the secondary sector declined, leading to a shift of resources to the service sector and hence "deindustrialisation."
3
* Cologne, Germany. " Philadelphia, USA. INTERECONOMICS, July/August 1998
Sebastian v a n W i ] n b e r g e n : Aid, Export Promotion and the Real Exchange Rate: An African Dilemma, London 1986.
177
DEVELOPMENT STRATEGY
Ouest Africaine: UMOA), meaning that their monetary policies are similar to, and dependent on, that of France), the regression results nevertheless give a general indication of the relationship between aid and the real exchange rate. Having looked at the impact of aid in an aggregated set-up, the paper then examines each country's particular economic evolution and tracks the different channels through which aid has flowed from 1980 to the 1994 devaluation period. Government policies, consumption levels and investment are crucial factors in determining the extent of Dutch disease effects in each country. Theoretical Foundation Van Wijnbergen presents a Salter-Swan, dependent economy model in which the economy is split into a traded goods and a non-traded goods sector.4 Traded goods comprise exportables and importables, so that their price is determined on the world market. Nontraded goods do not enter the world market, hence their price is domestically determined.5 Each type of good is assumed to be non-substitutable for the other. The model does not capture technical progress in the recipient country, and implicitly excludes the hypothetical case of a country in recession with substantially under-employed resources. In this set-up, aid, which takes the form of foreign exchange, enters the economy and acts like a "windfall gain" by increasing domestic income. This extra income leads to added expenditure on both tradable and non-tradable goods. How much of the extra income is spent on each category of goods depends on the marginal propensities to consume non-traded and traded goods respectively. As the country in the model is assumed to be a price taker on the world market, the augmented demand does not cause the price of tradable goods to rise. It does, however, cause the price of nontraded goods, which is determined domestically, to increase. Consequently, the price of non-traded goods rises relative to that of traded goods. As the ratio of non-traded to traded goods is understood as the real exchange rate, an increase in the price of the former with respect to the latter means a real exchange rate appreciation.6 Moreover, this aid-induced spending effect is accompanied by a resource movement effect. Since the price of non-traded goods relative to that of traded goods has risen, production of the former 178
becomes more attractive than that of the latter. Hence, the real wage in terms of traded goods will rise, whereas the real wage in terms of non-traded goods will fall. Consequently, labour is drawn to the non-traded goods sector. This means that there is a shift from agricultural production, particularly in less developed economies, to service employment, usually concentrated in urban areas. Both effects, the spending and the resource movement, result in a decline in competitiveness. The real exchange rate itself, as the rate at which one country's goods are traded for that of another, expresses the competitiveness of a country. Its appreciation depresses exports, as does the increased labour cost in the external sector. Empirical Estimation of the Impact of Aid Few studies have empirically estimated the aidRER relationship.7 Using Van Wijnbergen's framework, we empirically estimate the aid-RER relationship for Burkina Faso, Cote d'lvoire, Senegal, and Togo. Data sources for the regression were the World Bank Database (World Tables and World Development Indicators), the International Monetary Fund's International Financial Statistics, and the Banque des Etats de I'Afrique de I'Ouest's Notes d'information et Statistiques - Statistiques Economiques for the 19801992 period. The real effective exchange rate (REER), which is a trade-weighted rate, was used instead of the real exchange rate.8 The data used in the regression were annual figures and spanned a period of thirteen years. Consequently, 4
For the following, see Sebastian v a n W i j n b e r g e n , op. cit.
5
See W. E. G. S a l t e r : Internal and External Balance: The Role of Price and Expenditure Effects, in: Economic Record, 35, August 1959, pp 226-238.
6
Even the World Bank and the IMF define the real exchange rate inversely. In the above context, the real exchange rate is understood as the relative price of non-traded goods in terms of traded goods, i.e. an increase in this figure means an appreciation. 7 See Howard W h i t e : The Macroeconomic Impact of Development Aid: A Critical Survey, in: The Journal of Development Studies, Vol. 28, No 1, pp. 163-240. White refers to only two studies that have centred on empirically testing the aid-RER relationship, namely v a n W i j n b e r g e n , op. cit., and Howard W h i t e , Ganeshan W i g n a r a j a : Nominal and Real Devaluation During Trade Liberalisation Aid-Induced Dutch Disease in Sri Lanka, Development Studies Working Papers, Centra Studi Luca d'Agluano, International Development Centre, University of Oxford, Torino 1991.
* The World Bank defines the REER as the nominal effective exchange rate (a measure of the value of the ratio of domestic to international prices) divided by a price deflator or index. The REER data used in the equation came from Lawrence B o u t o n, Christine J o n e s , Miguel K i g u e l : Macroeconomic Reforms and Growth in Africa: Adjustment in Africa Revisited, Macroeconomics and Growth Division, Policy Research Department, The World Bank, Washington D.C. 1994. An increase in the number indicates a depreciation. INTERECONOMICS, July/August 1998
DEVELOPMENT STRATEGY
a time series regression could not be used because of the low degrees of freedom which could provoke biased estimations. Applying the Generalised Least Squares (GLS) method which takes cross-sectional heteroscedasticity and time series autocorrelation into account, the regression consisted in pooling cross-sectional and time series data for the four countries under consideration. The equation used in the regression analysis was as follows: In REER = C + B In(RGDP) + X GDIF + Z ln(TOT(-1)) + Y In(RODA) + W ln(R0DA(-1)) where REER is the real effective exchange rate; RGDP is real GDP (which considers total factor supplies); GDIF is the average of the current and once lagged growth rate difference between the country under consideration and industrial countries (which takes into account the Balassa-Samuelson effect of differences in technological levels - we calculated it by taking the OECD growth rates); TOT represents the terms of trade; and RODA is the amount of real official development assistance, defined as the total Table 1 Regression Results GLS (Cross Section Weights) / Dependent Variable is LNREER Sample: 1981-1992 Included observations: 12 Total panel observations: 48 Convergence achieved after 9 iterations Variable
Coefficient
Std. Error t-Statistic
c
7.454754 0.026163 0.005389 -0.298306 -0.071049 -0.063890
0.881641 8.455548 0.021096 1.240213 0.003339 1.614048 0.115164 -2.590271 0.023771 -2.988827 0.020991 -3.043660
0.0000 0.2218 0.1140 0.0131 0.0047 0.0040
0.996089 0.995624 0.088648 98.12913
Mean dependent var S.D. dependent var Sum squared resid F-statistic
5.252482 1.340060 0.330057 2139.612
LNRGDP GDIF LNTOT(-1) LNRODA LNRODAM)
Prob.
Weighted Statistics R-squared Adjusted R-squared S.E. of regression Log likelihood
Table 2 Leading Macroeconomic Indicators, 1996 [3urkina
Faso Real GDP growth (%) 5.7 Consumer price inflation (%) 6.1 Current-account balance ($ m) 15 Foreign debt ($ bn) n.a. Average exchange rate 511.6 (CFAfr/$) Population (m) 10.3
Cote d'lvoire
Senegal
Togo
6.8 2.5 -203.5 19.42 511.6
4.8 2.8 -82 3.92 511.6
6 4.6 -49 0.144 511.6
14.3
8.4
4.25
S o u r c e : The Economist Intelligence Unit (EIU). INTERECONOMICS, July/August 1998
disbursement of grants and concessional loans, deflated by the dollar import price index. The coefficient C is the estimated intercept of the equation. The elasticity coefficients B, X, Y, Z and W measure the percentage change in REER in response to a percentage change in RGDP, GDIF, TOT, and RODA. Lags were used for RODA and the TOT, as it takes time for markets and prices to incorporate the new information and adjust to it. The hypothesis tested whether an increase in aid may have led to an appreciation of the REER (demonstrated by a decrease in the REER number) in Burkina Faso, Cote d'lvoire, Senegal and Togo during the 1980-1992 period. Regression Results The regression results (see Table 1), support the link between aid and the REER. The coefficient of RODA is negative, thus demonstrating that an increase in aid leads to a decrease in the REER (i.e. an appreciation). As expected, the regression shows a positive coefficient for RGDP (showing that an increase in output leads to a depreciation, ceteris paribus). However, this variable and the growth rate differentials (GDIF) were not significant in the equation. This could be due to the variation in the different countries' income and growth rate patterns. In his critical survey of Dutch disease literature,9 White points to some of the empirical failings of van Wijnbergen's estimates. He attributes the failings of van Wijnbergen's model to the fact that the equation only includes the fundamental factors determining the RER, thereby excluding short-run nominal exchange rate movements. In the countries under consideration, the pegged nature of the CFA franc vis-a-vis the French franc exchange rate for the tested countries lessens the importance of these nominal movements. However, to capture the separate changes in domestic policy of the economies under consideration, case study analyses of Burkina Faso, Cote d'lvoire, Senegal and Togo are now presented. Little work on the Dutch disease has been conducted on the French-speaking countries of subSaharan West Africa. The choice of Burkina Faso, Cote d'lvoire, Senegal, and Togo as the countries to be analysed in this paper was determined by the similarities and differences in the size of their economies (see Table 2), the level of their aid inflows and their consumption and investment patterns. This variation brings out the different factors which affect the aid-RER relationship. See Howard W h i t e, op. cit.
179
DEVELOPMENT STRATEGY
Burkina Faso In Burkina Faso, aid inflows were substantial throughout the 1980-1995 period; with a first peak in terms of real aid in 1986 and a steady increase from 1990 onwards. It is not straightforward to track the macroeconomic channels of this aid. Different shocks and influences complicate the picture. As the primary sector is the main source of income for 90% of the population and accounts for around one third of GDP,10 the economy is strongly dependent on weather conditions and world commodity prices." Like most sub-Saharan countries, Burkina Faso was negatively affected by the decline in commodity prices on the world market during the 1980s and, as a member of the CFA-zone, its trade was hampered by the CFA franc's high value in relation to other currencies.1? However, there seems to be a link between the dramatic increase in real aid in 1986 (from US$ 2,174,833 in 1985 to US$ 3,023,429.2 in 1986)13 and the government's wage bill, which increased by 72% over the 1986-1990 period.14 There is no such correlation between the salaire minimum interprofessionnel garanti (SMIG) (see Table 3) arid the aid inflow, but it is important to note that the SMIG only captures the minimum and not the actual wage rates. Concluding from the former figure, however, the augmented aid inflow may have stimulated excessive government wage expenditure. Wages in the public sector can be used as a proxy for the price of non-traded goods. Consequently, the substantial increase in government wages, coinciding with rising aid inflows, supports the predictions of the Dutch disease model. Moreover, the REER shows a strong appreciation between 1985 and 1987 (from 123.3 to 99.9),15 which is consistent with a poor trade balance in 1986 and 1987 (despite a record output in cotton for 1986).16
10
See IMF Staff Country Report - Burkina Faso, No. 96/5, International Monetary Fund, Washington D.C. 1996, p. 1. " The main cash crops are cotton, karite (sheanut), groundnuts and sesame. 12
See e.g. the Economist Intelligence Unit Country Profile 1992-93 Burkina Faso, The Economist Group, London 1992, p. 35.
13
World Bank data.
14
See IMF Staff Country Report, loc. cit., chart 1, which is based on data provided by the Burkinese authorities and Fund estimates. 15 World Bank figures, in this case a decrease in the figure means an appreciation of the REER. 16
See EIU, op. cit., p. 50.
17 Imports in goods and services increased by 40.3 per cent in dollar terms between 1985 and 1987 (World Development Indicators, World Bank). 18
EIU Country Report, 3rd quarter 1997, London 1997.
180
The negative trade balance also supports the Dutch disease theory. The sharp increase in government wage expenditure in the middle of the 1980s, following an increased aid inflow, also coincides with a sharp increase in imports. This supports the theory's prediction of an increased demand for traded goods, which in turn boosts imports.17 Monetary policy during the period was conducted within the framework of the Union Monetaire Ouest Africaine (UMOA), implying that independent monetary expansion was not possible. Concurrently, devaluing the currency (which was understood to be overvalued from 1986 onwards) in order to promote exports was not a policy option. As was argued before, this appreciation of the currency can be perceived as a symptom of the Dutch disease. Accordingly, Burkina Faso has had a significant trade gap since 1984, which increased by 22% over the 1984-1988 period. •The devaluation of the CFA franc in January 1994, counteracting the Dutch disease in the short run by depreciating the real exchange rate, led to the expected boom of the export sector. The volume of exports increased by 50.5% between 1994 and 1996.18 Apart from the devaluation, the boost in exports was also the result of the trade liberalisation initiated by Burkina's authorities in the early 1990s. Under this policy, tariffs have been simplified and rationalised, import restrictions and export authoriTable 3 Evolution of the SMIG (Minimum Wage Rates),1 1980-1993 (CFA francs) Year
Burkina Faso
1980 1981 1982 1983 1984 1985 1986 1987 1988 1989 1990 1991 1992 1993
90 90 114. 114 114 114 114 114 130.69 130.69 130.69 130.69 130.69 130.69
Cote d'lvoire 174 174 191.4 191.4 191.4 191.4 191.4 191.4 191.4 191.4 191.4 191.4 191.4 191.4
Senegal
Togo
133.81 140.5 140.5 152.04" 175 183.75 183.75 183.75 183.75 183.75" 201.6 201.6 201.6 201.6
64.45 64.45 72 72 72 72 72 75.6 75.6 75.6 79.36 79.36 79.36 79.36
' The official guaranteed minimum wage rate based on the forty-hour working week (actual wages significantly exceed the minimum rate). • The rate changed to 175 on April 1, 1983. " The rate changed to 201.6 on July 1, 1989. Source: (BCEAO).
Banque Centrale des Etats de I'Afrique de I'Quest
INTERECONOMICS, July/August 1998
DEVELOPMENT STRATEGY
sations have been reduced and some monopolies have been eliminated. Consequently, exports have become more diversified, and trade with new partners as well as within the CFA zone has increased sharply. The particular case of Burkina Faso thus shows some evidence of Dutch disease symptoms in the middle of the 1980s, when a sharp increase in government wages occurred, imports rose and the real exchange rate appreciated. Today, however, most of these effects have been offset by a number of measures to control the government wage bill after the devaluation in 1994> which created the danger of a massive demand-pull inflation. The devaluation also boosted exports as intended by bringing down both the nominal and the real exchange rate. Cote d'lvoire As one of the largest members of the CFA zone and benefiting from its close diplomatic ties with France,19 Cote d'lvoire received substantial aid inflows during the 1980-1995 period. Similarly to its neighbouring countries, the country was adversely hit by the decrease in the price of its main exports and the appreciation of the French franc (and therefore the CFA franc) against the dollar during the latter part of the 1980s. With agriculture accounting for approximately one third of its GDP and employing 80 per cent of the labour force,20 Cote d'lvoire, like Burkina Faso, is highly dependent on its export revenues. Decreases in world prices in the mid-1980s for its major export crops, coffee and cocoa, plunged the country into a recession.21 The decrease in export revenues, however, was not matched by decreases in government consumption and expenditure. Government consumption as a " Cote d'lvoire's former President Houphouet-Boigny, who governed the country from 1960 to 1993, was a member of the French National Assembly prior to independence. The contacts which he made there and his excellent relationships with successive French presidents contributed to the considerable aid which Cote d'lvoire received from France and the Bretton Woods organisations. 20
See EIU Country Report, 3rd quarter 1997, London 1997, p. 23.
21 Ibid, p. 14. The Caistab is the Caisse de stabilisation des prix des produits agricoles. 22
Calculations based on World Bank data.
23
IMF Staff Country Report No. 96/6, p.13.
" Ibid, p. 19. 25
See Lawrence B o u t o n et al., op. cit., Table 5.
26
See EIU Country Profile 97/98, p. 14.
27
EIU Country Profile 97/98, p. 4. Under the leadership of Leopold Senghor, President from 1960 to 1980, the country also enjoyed close diplomatic ties with France. INTERECONOMICS, July/August 1998
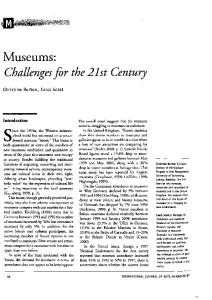
percentage of GDP averaged 16.6% over the 19801993 period (see Figure 1).22 At the same time, expenditure on wages did not change substantially throughout the 1980s and continued to absorb more than 60 per cent of the non-interest recurrent budget in 1993.23 The upward trend of the SMIG (see Table 3), while only an indication of the minimum wage rate, points to wages as a channel through which aid flowed. Aid was . also channelled into the inefficient parapublic sector, which received subsidies from the government. In 1990, the parapublic sector accounted (both directly and indirectly) for approximately 4 per cent of GDP.24 The large-scale infrastructural projects in which Cote d'lvoire engaged, such as the building of the world's second largest basilica, also provided a source of aid absorption. Both the investment that was made in the parapublic sector and large-scale projects contributed to Cote d'lvoire's large fiscal imbalances during the second half of the 1980s. Between 1981 and 1986, government fiscal revenues averaged 30.6 per cent of GDP, while expenditures were at a level of 36.9 per cent; the figures for the 1987-92 period show a deterioration, with fiscal revenue averaging 23.6 per cent of GDP and expenditures increasing to 37.1 per cent of GDP.25 In the framework of the Enhanced Structural Adjustment Facility (ESAF) which it signed with the IMF in March 1994, Cote d'lvoire has been reforming its economy by controlling expenditures, reducing the size of the state sector, and eliminating legal constraints in the labour market and on foreign investment. However, the January 1994 devaluation led to a boom in exports. Congruent with theory (a devaluation, ceteris paribus, leads to increased exports), this outcome was reinforced by an increase in the prices of coffee and cocoa.26 Thus, Dutch disease effects can be observed in Cote d'lvoire, particularly during the 1980s. Senegal Senegal is one of the largest members of the CFA zone, with a GDP per capita of US$ 600 in 1995. The former administrative centre of French West Africa, at independence Senegal was endowed with a relatively good infrastructure, an industrial base and an educated work force.27 However, its comparative advantages have eroded substantially over the past two decades. Despite receiving aid inflows per capita significantly above the sub-Saharan average during the 1980s, Senegal dropped one level in the World Bank's classification from a "lower-middle income 181
DEVELOPMENT STRATEGY
country" to a "low-income country" following the January 1994 CFA franc devaluation.28 While it is difficult to trace the channels of aid within a country, the scope and size of Senegal's civil service and the generally high level of wages in the formal sector undoubtedly absorbed part of this inflow during the 1980-1995 period. In the early 1980s, wages and salaries were the dominant item of the government's budgetary expenditures, claiming approximately 50 per cent of total current expenditures between 1980 and 1984. In tandem with this trend, official development assistance levels increased during 1983-1986, with a 96.3% rise occurring between 1985 and 1986. The parallel increase in wages and aid could have entailed a shift in relative price between tradables and non-tradables, thereby demonstrating the Dutch disease effect. In accordance with this theory, the REER appreciated by 17.8 index points (from 105.4 to 87.6).
productivity and operating performance declined. Paradoxically, employment and wages in these enterprises followed an upward trend. In 1982, for example, output per worker in the parapublic sector accounted for 70 per cent of that of workers in the modern sector; wages, however, were at least 20 per cent higher than those in the private sector.32 Moreover, these enterprises consumed an increasing proportion of investment, reaching 40 per cent of gross fixed capital formation in 1981.33 As the IMF itself points out, investment in these parapublic enterprises was financed in great part by external aid channelled through the government's development budget.34 This fungibility of aid clearly points to Dutch disease effects.
The general involvement of the state in the economy is seen in the percentage of GDP taken up by government consumption. During the early 1980s, this figure remained at around 20% of GDP (see Like Burkina Faso and Cote d'lvoire, Senegal is Figure 1). With consumption and investment exceedhighly dependent on agriculture.29 The rural sector, ing GDP, Senegal's internal balances were which accounts for one fifth of GDP, employs accompanied by heavy trade deficits in goods and approximately 75 per cent of the active labour force.30 services throughout the 1980s. As was stated before, The harsh climatic conditions of the Sahelian region Senegal's high wages and the high prices of its (dramatic rain shortages) and changing world prices exports, due to the overvalued nature of the CFA have caused the country's GDP growth to fluctuate franc, were in part symptoms of the Dutch disease. significantly over the past twenty years. While GDP Between 1986 and 1993, the trade gap averaged growth reached a high of 15.1 per cent in 1982, more than $290 million on a balance-of-payments Senegal registered an average growth of 3 per cent basis.35 This made the country even more dependent during the 1985-90 period when agricultural prices on foreign inflows, which paid for approximately $250 were falling.31 million of grant-purchased goods. During the 1980s, Senegal's poor export performance, due to limited agricultural growth, combined with the inefficient parapublic sector to drain government revenues. The country's adherence to African socialism and its state-led development strategies in the post-independence period had led to the creation of several parapublic industries which absorbed a large share of the government's resources. Starting in the late 1970s, these enterprises' 28
EIU Country Profile 1995-96, p. 10.
While aid flows decreased during the 1991-93 period (in part due to donor frustration at the lack of reform),36 the January 1994 devaluation was accompanied by substantial aid packages from the IMF and Figure 1 Government Consumption (% of GDP) 25 20 " • - . • > . ^ . _ . .
29
Ibid. In 1988, fish products replaced groundnuts as the major export, accounting for over 20% of revenue, a proportion which had risen to an estimated 26% in 1993. 30
Ibid.
31
World Bank data.
32
See World Bank: Senegal - Country Memorandum, op. cit., p. 53.
33
Ibid, p. 54.
31
Ibid.
35
EIU Country Profile 1995/96, p. 33.
36
Ibid, p. 35.
182
5
-
Burkina Faso Cote d'lvoire Senegal Togo
1980 1981 1982 1983 1984 1985 1986 1987 1988 1989 1990 1991 1992 1993 Year S o u r c e : World Bank data. INTERECONOMICS, July/August 1998
DEVELOPMENT STRATEGY
France and a debt buy-back scheme. In the framework of the Enhanced Structural Adjustment Facility (ESAF) agreed to in March 1994, Senegal has been liberalising its labour market and restructuring the public sector in order to stimulate market mechanisms and attract foreign investment. Decreases in the ratio of government consumption, public wage restraint and privatisation are all measures which have been emphasised in the numerous economic programmes backed by multilateral institutions which the country has carried out since the beginning of the 1980s. The question as to why actual implementation was not carried out and sustained for over a decade draws attention to the nature of aid, which at this time was not as strictly tied as in the 1990s. The increasingly conditional nature of aid to the country has meant that Dutch disease effects became less evident. Togo Sub-Saharan Togo belongs to the low income countries, with a GNP per capita of US$ 310 in 1995. Its agricultural sector accounts for roughly one third of GDP and was the source of income of approximately 80% of the population in 1995.37 Compared to other West-African economies, its service sector is well developed, with a relatively advanced banking system. However, the country's turbulent political and social situation during the 1980-95 period caused its economy to suffer greatly.38 The high point of this instability occurred in November 1992, when the formal sector came to a complete standstill and was only reactivated in the middle of 1993. Moreover, development aid of the three major donors (France, Figure 2 Real Effective Exchange Rate 160
Germany and the USA) was frozen between 1992 and 1995. There is no immediate evidence of Dutch disease effects in Togo. As can be seen from Figure 2, no striking upward or downward trend in the real effective exchange rate can be found over the period of 1980-82. The only appreciation which occurred was between 1985 and 1987 (from 123.3 in 1985 to 99.9 in 1987).39 This matches an increase in real official development assistance in 1986, but did not match the following decrease in 1987. Also, a comparatively sharp increase in aid in 1984 (from US$ 121670.8 in 1983 to US$ 1158119.6 in 1984)40 did not cause the exchange rate to appreciate. There is no clear nexus between the real exchange rate and aid over the whole period. However, the "problem" case Togo might not strictly contradict the above theory, if its special features are taken into account. First, the volume of Togo's aid inflow is evidently much lower than that of the other countries in total figures as well as in terms of aid per capita. Togo's aid per capita amounted to US$ 32 versus US$ 43 in Burkina Faso, US$ 78 in Senegal and US$ 117 in Cote d'lvoire in 1994.41 Whereas aid increased substantially for the three other countries in the early 1990s, the volume of aid for Togo remained roughly constant from 1980 to 1992 (see Figure 3). Second, the' official guaranteed minimum wage (see Table 3) did not rise considerably during the period of 1980-1993 compared to the other countries. Public sector wages were frozen by the government from 1982-87, and there was almost no rise in the salaries of civil servants between 1987 and 1994.42 Provided that the evolution of public sector wages reflected price movements in the non-traded goods sector and that the price of tradables also remained
140 37
See IMF Staff Country Report No. 97/13, 1997, Table 1 in Appendix I.
120 100
38
80 60 40 20
—— Burkina Faso Cote d'lvoire Senegal Togo
In 1967, Colonel Eyadema was elected president of Togo. In the following decades, his regime progressively turned into an autocracy, and attempts at enforcing economic reform culminated in the turbulent period of 1991 to 1994. At this time, pressure to establish a multiparty political system initiated civil unrest and led to a general strike in 1992. Tensions eased in 1994, when legislative elections were held and the Union togolaise pour la democratie, along with the Comite d'action pour le renouveau, won a majority in the parliament. 39
1980 1981 1982 1983 1984 1985 1986 1987 1988 1989 1990 1991 1992 Year N o t e : A decline in the REER is tantamount to an appreciation of the currency. S o u r c e : Lawrence B o u t o n , Christine J o n e s , Miguel K i g u e I: Macroeconomic Reforms and Growth in Africa: Adjustment in Africa Revisited, World Bank, Washington 1994. INTERECONOMICS, July/August 1998
World Bank Data 1994.
40
Ibid.
41
World Development Indicators 1997.
" A fonctionnaire of category A earned a minimum of 103 CFA francs per month in 1987 and 108.2 CFA francs per month in 1994. For a more detailed report, see Table 19 in the IMF Staff Country Report No. 96/12, 1996, Statistical Annex.
183
DEVELOPMENT STRATEGY
relatively stable over this period, this could explain the constancy in the real exchange rate over the sample period. Regarding trade, the appreciation of the real exchange rate between 1985 and 1987 is matched by a decline in the terms of trade during the same Figure 3 Real Official Development Assistance (US$) 8000000 Burkina Faso Cote d'lvoire Senegal Togo
7000000 6000000 5000000 4000000 3000000 2000000
-—
1000000 0 1980 1981
1982 1983 1984 1985 1986 1987 1988 1989 1990 1991 Year
S o u r c e : World Bank data and authors' calculations.
Figure 4 Gross Investment (% of GDP) 35 30 25
—.^x
20 15
1992 1993
period.43 Apart from a slight recovery in the terms of trade in 1987 and 1988, the trend for the overall sample period is a decrease for Togo. Real GDP growth also was modest, averaging 2.4 per cent during the 1980s and declining to 0.14 per cent in the early 1990s.44 The country's troubled political circumstances explain the negative growth figure of -14.7 per cent in 1993,45 when gross domestic savings and investment reached an absolute low point,46 and official development assistance fell from US$ 223.4 million in the previous year to US$ 97.6 million.47 Both investment and savings, which had been comparatively-high, followed a downward trend during 198094 (see Figures 4 and 5). The 1994 devaluation boosted Togo's exports, which at the same time benefited from strong commodity prices.48 Yet increased exports were not sufficient to make an impact on the high level of foreign debt which the country had accumulated. Foreign debt put a considerable strain on government finances throughout the 1980s, and at the end of 1994 the debt/GNP ratio stood at 156.6 per cent.49 To conclude, Togo is not an obvious example of Dutch disease effects. For this country, however, special conditions are to be taken into consideration. A much lower aid inflow, coupled with political unrest which led to a freeze in government wages, distinguish this country from the other three sample countries and may explain the relatively stable real exchange rate from 1980 to 1992. Lessons from the Case Studies
10 Burkina Faso Cole d'lvoire
The country-level analyses showed that all four countries experienced an appreciation of the real 0 1980 1981 1982 1983 1984 1985 1986 1987 1988 1989 1990 1991 1992 1993 exchange rate in the mid-1980s, when concomitantly Year their trade balances were negatively affected. This S o u r c e : World Bank data. can be linked to the sharp increase in aid inflows during the same period and hence be understood as Figure 5 a Dutch disease symptom. Nevertheless, other Gross Domestic Savings (% of GDP) factors, such as declining commodity prices and an 5
Togo
13
From 139.2 in 1985 to 100 in 1987. Compare World Bank 1997.
44
Calculations based on World Bank Data 1997.
45
Ibid.
46
Gross domestic investment as a percentage of GDP equalled 4.00 in 1993 compared to an average of 25.3 throughout the 1980s. Gross domestic savings were -3.5 percent of GDP in 1993, compared to an average of 17.7 percent during the 1980s (Calculations based on World Bank data 1997).
" World Bank 1997. " Phosphate, cotton, coffee and cocoa.
-10 Year S o u r c e : World Bank data.
184
" For a breakdown of the debt see EIU Country Profile 1996-97, p. 21. INTERECONOMICS, July/August 1998
DEVELOPMENT STRATEGY
appreciation of the CFA franc against the dollar, also played an important part. During most of the 1980s, all four countries channelled a considerable proportion of their budgets into public sector wages and sizeable parapublic sectors, which supports the theory's prediction of an expansion in the non-traded goods sector. This applies particularly to Cote d'lvoire and Senegal, whereas Burkina Faso's civil service was smaller. Togo, due to political unrest which resulted in a freeze in government wage expenditure, was a special case. Togo also received much less aid than the three other countries, which may be a factor in explaining Togo's relatively stable REER. Burkina Faso, Cote d'lvoire and Senegal, on the other hand, became increasingly dependent on development assistance. All four countries showed high levels of government consumption. Greater conditionality of aid, coupled with increased monitoring on the part of donors, may explain why Dutch disease phenomena are not as observable in the 1990s as they were in the 1980s. These programmes focused on controlling high public sector wages, deregulating the labour market, cutting excessively high tariffs and stimulating private sector economic activity. However, criticism has been directed at the principle of conditionality, pointing out that donors pursue different and often conflicting objectives.50 Attention has also focused on the mismatch in the incentives which donors and recipient governments have in implementing policies.51 Aid which is targeted at specific objectives that may be politically costly to the recipient government go against the government's incentives. Consequently, if the recipient government perceives that it will continue to receive aid regardless of whether it has implemented reforms, it may implement donor recommendations and subsequently reverse them, or ignore them altogether. It has been correctly stressed that conditionality in Africa is often of a "bribery type,"52 and the problem of fungibility53 makes it very difficult to ensure aid effectiveness, even if there is substantial monitoring. This problem could be solved if aid were more performanceoriented rather than focused on trying to push through certain governmental actions.54 Aid as such would be given ex post, on the condition that the targets had been met, and not ex ante, regardless of whether the policy recommendations were followed. In the case of Burkina Faso, Cote d'lvoire, Senegal and Togo, the structural adjustment programmes so INTERECONOMICS, July/August 1998
far seem to have effectively cut down the preponderance of the state. Furthermore, the devaluation of the CFA franc in 1994 has succeeded in reestablishing competitiveness and boosting exports for these countries, thereby curing any Dutch disease symptoms. Conclusion This paper has analysed the relationship between aid inflows and the real exchange rate in four CFA zone countries. In the framework of the Salter-Swan two-sector model, the potential negative effects of aid on a country's competitiveness via an appreciation of the real exchange rate were presented. Using data from 1980 to 1992, the link between aid flows and the real exchange rate was tested empirically for Burkina Faso, Cote d'lvoire, Senegal and Togo. The results of the regression, although providing only a general idea of the relationship between the two, demonstrated the link. This analysis reinforces the theoretical relevance of the aid-RER nexus. It does not take into account any monetary factors, and hence should be seen as a rough approximation of the relationship between aid and the real exchange rate, showing that there is a nexus as such. Tracing the channels of aid on a country-by-country basis, the paper then focused on the policies and economic trends of the four states. Increasing wages throughout the early 1980s and government deficits show the possible Dutch disease effects that aid has had in these four CFA zone member countries. While high government consumption and low investment levels indicate that little aid has been channelled into investment, it is important to note that consumption can be an investment in human capital (education, nutrition and other factors). Concluding from the facts in the four respective countries, aid should be better targeted, as has increasingly been the case throughout the last five years. Moreover, it should be performance-based to avoid the negative effects of fungibility and excessive spending on consumption. 50 See Jan Willem G u n n i n g : The Donor's Role in Africa: Reform of Aid and Trade Relationships, paper presented at the Third Annual Workshop of the Network EU-LDC Trade and Capital Relations, Rotterdam, May 14-16, 1996. 51
See Paul M o s l e y : The Failure of Aid and Adjustment Policies in Sub-Saharan Africa: Counter-examples and Policy Proposals, in: Journal of African Economies, Vol. 5, No. 3, 1996, pp. 406-443. 52
Jan Willem G u n n i n g , op. cit., p. 4.
53
Fungibility in this context implies that the local government will decide whether to allocate aid to investment or consumption. 54
F o r a more detailed discussion, see Jan Willem G u n n i n g , op. cit.
185