DRAFT COPY ONLY. DO NOT QUOTE.
The effects of emotion on vocal physiology and acoustics.
Tom Johnstone, Tanja Banziger and Klaus Scherer
Abstract A computer task was designed to elicit emotional responses to manipulated task dimensions corresponding to appraisal dimensions of conduciveness and coping potential. Physiological measurements and electroglottal measurements were synchronised with vocal recordings, thus allowing a precise characterisation of the opening and closing of the vocal folds. The electroglottal measurements were compared both with F0 measures and spectral measures in an effort to understand the basic mechanisms responsible for F0 and harmonic modulation in emotional speech.
Introduction In this experiment, physiological measurements of ANS function were combined with EGG measures of vocal fold activity and acoustic analysis of speech in an effort to better explain the mechanisms by which experimental manipulations of conduciveness and coping potential cause changes to the acoustic properties of speech. While the physiological measurements made in previous studies (e.g. Johnstone and Scherer, 1999) have provided some insights into the mechanisms behind such changes, EGG was expected to provide a clearer understanding of the involvement of vocal fold vibration in producing both F0 and spectral changes to speech. In previous research in our laboratory (Johnstone, van Reekum and Scherer, in prep.; Johnstone and Scherer, 1999), significant changes to measures of fundamental frequency occurred in response to manipulated appraisal dimensions. In contrast with many previous studies of emotional speech, F0 floor and measures of F0 range were found to be differently affected by the manipulations. In both these studies, the level of physiological arousal, which varies with manipulations of conduciveness and coping potential, seemed to play some role in both F0 floor and F0 range variation. In the study of Johnstone, van Reekum and Scherer (in prep.), F0 floor and speech energy varied in the same way as a function of goal conduciveness, which was explained in terms of a corresponding variation in sympathetic arousal. In the study of Johnstone and Scherer (1999), the behaviour of the F0 measures was less clear, with F0 range measures varying as a function of the interaction between appraisal dimensions, F0 floor varying as a function of control, and speech energy varying as a function of obstructiveness. Although there was some evidence from ANS measures that F0 range variation might have corresponded to the level of sympathetic arousal, this result was far from certain. It was hoped that the use of EGG recording together with physiological and acoustic analysis in this experiment, would make the mechanisms underlying changes to
F0 more clear. Of particular interest is the way changes to F0 as a result of experimental manipulations would be reflected in the different parts of the glottal period. As seen in Johnstone, Banziger and Scherer (in prep.), it is possible that changes to F0 range reflect changes to intonation that are not primarily mediated by changes to the vocal folds, but rather reflect vertical movement of the larynx. If this is the case, then we would expect F0 range variations across manipulations to correspond more highly with low frequency EGG energy (an indicator of larynx movement) than with glottal phase measures, such as open or closed times. Similarly, if sympathetic arousal is primarily responsible for F0 floor changes through changes to laryngeal tension, we would expect F0 floor variation across manipulations to correspond to similar variations in glottal phase measures as well as variation in ANS indicators such as skin conductance, finger temperature, and interbeat interval. The studies of Johnstone, van Reekum and Scherer (in prep.) and Johnstone and Scherer (1999) also directly tested a number of the predictions of Scherer (1986) of changes to spectral energy distribution due to different appraisals. Scherer predicted that constriction or opening of the vocal tract in response to appraisals of goal obstructiveness or conduciveness respectively would cause such spectral changes, by selectively increasing or decreasing amplification of high frequency harmonics. In both these studies, the proportion of energy below 1000 Hertz in voiced parts of speech was found to vary with the experimental manipulations in agreement with Scherer’s predictions. Thus the proportion of energy below 1000 Hertz was lower for obstructive than for conducive situations. In a previous test of Scherer’s predictions using acted speech, Banse and Scherer (1996) also found that the distribution of acoustic energy across a number of specific frequency bands varied across expressed emotions. A more global spectral measure of the proportion of energy below 1000 Hertz was found to vary significantly with expressed emotion. However, while expressions of anger and panic
were characterised by a low proportion of low frequency energy, consistent with Scherer’s predictions, expressions of the emotions sadness and shame had a high proportion of low frequency energy. Indeed, the proportion of low frequency energy seemed at least partly determined by whether the expressed emotion was high arousal (e.g. anger, panic), or low arousal (e.g. sadness, shame). It is certainly possible that the manner in which the distribution of energy in the spectrum varies with emotion depends not only on the configuration of the vocal tract, but also on vocal fold function that might be linked to arousal. Research that has shown a link between vocal fold function and spectral slope (Fant, 1993, Sundberg, 1994), suggests that increased tension in the intrinsic laryngeal musculature causes vocal folds to remain closed over a longer portion of the glottal period, only briefly opening and then very rapidly closing again. The result is proportionally more energy in upper harmonics, which might well result in speech with more high frequency energy. Thus one might expect emotions in which laryngeal muscles are more tense, to be characterised by relatively greater energy in higher harmonics, and a higher proportion of high frequency energy. The possibility that spectral changes in emotional speech might depend on phonation mechanisms rather than vocal tract mechanisms, is consistent with the results of Banse and Scherer (1996). Unfortunately, based on those data, it is impossible to determine whether these spectral energy results were mediated by changes to resonance in the vocal tract as suggested by Scherer, or whether they might have been at least partly determined by changes to the way the vocal folds vibrated. It was hoped that using EGG in this experiment would help determine which mechanisms are responsible for emotion-induced spectral changes to speech. If such spectral changes are mediated by changes to phonation, the effects of experimental manipulations on the shape of the glottal waveform should parallel the effects on
spectral energy distribution. In addition, correlations between EGG glottal waveform parameters and spectral energy parameters should be apparent. The lack of such associations between EGG measures and spectral measures would cast doubt on a phonatory explanation, and provide further evidence that such changes are primarily related to vocal tract resonance. Experimental design This experiment was intended to replicate the basic experimental design of Johnstone and Scherer (1999), with some modifications made to solve some of the problems with experimental control evident in that study. Only one coping potential manipulation was included in this experiment, which was designed to represent a combination of both control and power as described in Scherer’s appraisal theory. Thus the manipulation was deigned to manipulate the general ability of the subject to cope with the experimental situation given both the general nature of the task and the specific given circumstances. The decision to change to a general manipulation of coping was also made based on previous findings that showed that the power manipulation had an effect on sympathetic arousal consistent with those predicted by Scherer for appraisals of control. Thus the distinction between appraisals of control and appraisals of power seems fuzzy, at least in terms of their effects on speech. It is also worth mentioning that most appraisal theorists do not make a distinction between control and power, but rather suggest a more general appraisal of coping ability (e.g. problem-focussed coping of Smith and Lazarus, 1990). The manipulation of coping potential for this experiment was also extensively piloted and the difficulty adjusted so as to avoid players disengaging from the task if it became too difficult, as might have been the case in experiment two for obstructive, low power conditions. It was also decided in this experiment to change from adapting an existing computer game (XQuest) to using a computer task programmed from scratch. This
approach had not been used in the earlier experiments of this research for practical reasons, mainly the time and effort spent programming and pretesting such a task. It was thought that using a ready made game would still allow the necessary degree of control and flexibility in manipulating events. The results in the second experiment however point to the need for increased experimental control. In addition, although a computer game was seen as a promising tool for induction of emotions, the very fact that a computer game is entertaining means that it is intrinsically emotional even before particular game manipulations are made to induce emotions. Different players play such games for different reasons and have different goals and motives, posing additional problems of experimental control (see Johnstone, van Reekum and Scherer, 2001, p. 281 for further discussion of this problem). In contrast, a computer task that is built from scratch can include manipulations that are not constrained or compromised by the structure of the game. Speech data collection can also be more easily and seamlessly integrated by constructing tasks that have natural pauses and vocal interaction. The task programmed for this experiment was a motor tracking task, in which speakers had to manipulate the position of a box on the screen in the presence of other items that would add or subtract from the participant’s score. The task was thus similar in many aspects to the XQuest game, but without the extra features in XQuest included simply to add to XQuest’s entertainment value. A more thorough description of the task used in this experiment is given in the method section. Hypotheses Goal conduciveness. The principal hypothesis concerning the manipulation of goal conduciveness in this experiment is the same as in experiment two. Conducive situations were expected to produce raised low frequency spectral energy relative to obstructive situations. As an independent measure of conduciveness, skin temperature
was predicted to fall during obstructive situations and rise in response to conducive situations. Coping potential. For coping potential, it was predicted that low coping situations would produce an increase in sympathetic arousal, as indicated by elevated skin conductance activity and increased heart rate. Such arousal would also be manifest in greater laryngeal muscle tension, and a corresponding increase in F0, and F0 variability. This prediction, although seemingly running counter to Scherer’s predictions for low coping, is based on the idea that in this experiment, coping potential is never low enough to invoke task disengagement. Thus, given that the player is expected to remain engaged in the game, their level of sympathetic arousal should increase with perceived difficulty, and therefore be higher for the low coping condition that for the high coping condition. Such an effect was found in experiment two, and was considered even more likely in this experiment since the task had been specifically designed and pretested so as not to be so difficult as to make players give up. Furthermore, because coping potential appraisals were predicted to cause changes to laryngeal tension, the manner in which vocal folds open and close was predicted to change as a consequence. Thus measures of the different phases of the glottal period, as measured with EGG were expected to vary with the coping potential manipulation. More specifically, low coping situations, in which laryngeal muscles were more tense, were expected to lead to relatively shorter open and opening phases and longer closed phase. Although it is possible that closing phase would also shorten during low coping situations, due to greater vocal fold compression leading to stronger elastic closing forces, no firm prediction was made for closing phase. The reason for this is that closing phase was expected to be very short for all experimental conditions, and thus a floor effect in closing phase was likely.
A consequence of the predicted changes to glottal phases in response to the coping manipulation would be corresponding changes to spectral energy distribution. The principal such change would be a shallower spectral slope, and a relatively lower proportion of energy at low frequencies, in low coping situations than in high coping situations. The follows as a consequence of the prediction of short, rapid opening and closing of vocal folds in low coping situations, which would lead to more energy in higher speech harmonics. Interaction effects of conduciveness and coping potential. As in experiment two, the two appraisal dimensions were predicted to interact in their effect on physiology and the voice. Specifically, the predicted coping potential effects were expected to be greater in obstructive situations than in conducive situations, since appraisals of ability to cope with a situation are more pertinent when faced with obstruction. Method This experiment was conducted as part of an ongoing, larger research project on the effects of emotion and stress on automatic speaker verification technologies, and made up part of a larger battery of emotion induction tasks. The total duration of the experimental session was 11/2 hours, of which instructions, preparing the speaker for physiological and EGG measurements, and this experiment took approximately 45 minutes. A general introduction to the purpose of the experiment, as well as specific instructions for the task, were presented automatically by the computer program. Speakers advanced at their own pace through the program. The task The task used in this experiment was a tracking task, in which the speaker had to use the mouse to control the movement of a small box on the screen. The task was presented in successive stages. In each stage, in addition to the player’s box, one of two symbols, representing either reward or punishment respectively, moved about the
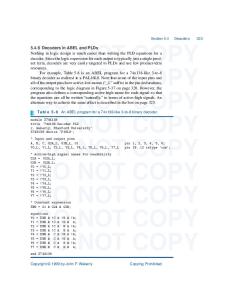
screen. The punishment symbol approached the player’s box and the rewarding symbol avoided the player’s box. The player’s task was to avoid the punishment symbol from touching the box, and to touch the rewarding symbol with the box. In addition to punishment and reward, each type of symbol moved either quickly or slowly, thus making the task of avoiding the punishment or achieving the reward more or less difficult, corresponding to low and high coping respectively. Thus the two appraisal dimensions, goal conduciveness and coping potential were manipulated in a factorial design, as shown in table 6.1. Table 6.1. Design of tracking task manipulations. Goal Coduciveness
Low Coping Potential
High
Conducive fast reward symbol slow reward symbol
Obstructive fast punishment symbol slow punishment symbol
Reward and punishment were implemented using the addition and subtraction of points respectively. The player’s points were displayed in both a digital and graphical form to the left of the playing space. Points were awarded or subtracted from the player’s score on the basis of the distance of the player’s box from the reward or punishment symbol. The closer the player’s box to the reward symbol, the more points they were awarded. The closer their box to the punishment symbol, the more points they lost. All players started with 5000 points, an amount chosen such that players could not lose all their points or gain more than 10000 points during any task stage. The experiment consisted of four stages, one of each condition, presented in an order counterbalanced across subjects. Speech material. At four equally spaced intervals during each task stage, a small message at the bottom of the screen appeared, prompting the player to either pronounce a standard
phrase (two times), or to pronounce an extended [a] vowel (two times). The order of standard phrase prompts and [a] prompts was randomised. The standard phrase was “Ceci est la tâche 4 2 5 1 0” (“This is task 4 2 5 1 0”), with a different 5-digit combination of digits used in the phrase for each task stage. The digit combinations were counterbalanced across task stages and subjects. The correct way to respond to the two prompts, including instructions on how to pronounce the extended [a] vowel, were shown with a demonstration prior to a practice stage. The four task stages then followed the practice stage. Subjective emotion reports Following every task stage, speakers were asked to report how they felt, using mouse-operated emotional state and intensity scales. With the scales, participants could choose any number of emotions from a given list of seven provided emotions, and indicate an intensity ranging from not felt at all to felt extremely, for each chosen emotion. The emotions were satisfied, irritated, tired, stressed, disappointed, content, bored and anxious. Alternatively, speakers could click a box indicating no felt emotion. Measurements Vocal measures. The acoustic speech signal and the EGG signal corresponding to the standard phrases and extended vowels were recorded to both channels of a Casio DAT recorder using a Sennheiser clip-on condenser microphone. These recordings were then transferred digitally to a PC and stored as 22kHz sampling rate stereo wave files. Psychophysiological measures. All physiological measures were recorded continuously throughout the experimental part of the session with a Biopac MP100 physiology measurement system, at a sample rate of 250 Hz. Skin conductance was measured using 8 mm Ag-Ag/Cl electrodes placed on the tops of the index and middle finger of the non-dominant hand. The electrodes were filled with a NaCl paste (49.295 grams of unibase and 50.705 grams of isot. NaCl 0.9%). ECG was measured using pre-
gelled, disposable ECG electrodes placed on the chest according to the Einthoven's triangle. Finger temperature was measured using a Biopac finger temperature probe attached to the small finger on the non-dominant hand. A respiration strain gauge was placed around the abdomen, just below the thoracic cage, to provide an approximate measurement of respiration rate and depth. The respiration signal was highpass filtered at 0.03 Hz. A one-byte digital measurement channel channel, synchronised with the physiological data, recorded a numerical code corresponding to the different game events of interest, which was output from the parallel port of the experimental presentation PC. This channel thus marked the physiological data with the precise onset and offset of each game event, as well as the onset and offset of vocal recordings.
Speakers Speakers were 30 male first-language French adults recruited via written notices and local radio announcements. Speakers were told that the purpose of the experiment was to collect a variety of speech recordings under different situations that were designed to simulate those that might occur during everyday use of computers. Speakers were told that they would be asked to complete a series of tasks and puzzles that would be presented on a PC. All speakers were paid SFr. 40 for their participation. Speakers were also told before the start of the session that if they performed well enough in the series of tasks, they could win an extra SFr. 10. This incentive served to increase motivation and involvement in the task, and thus render the manipulations more powerful. All speakers were in fact paid the extra SFr. 10 at the conclusion of the experimental session. Procedure On arrival, speakers were told that the purpose of the experiment was to collect a variety of speech recordings under different situations that were designed to simulate
those that might occur during everyday use of computers. Speakers were informed that they would be asked to complete a series of tasks and puzzles that would be presented on a computer, and that the program would prompt them at specified times to provide spoken input, including extended vowels, isolated digits, standard phrases and spontaneous speech, which would be recorded. The physiological sensors and EGG electrodes were then attached and regulated. Regulation consisted of checking that the signals were suitably amplified and free of noise. For all participants, the microphone was then fitted and the recording level adjusted appropriately. Participants were then asked if they were comfortable and ready to start before the experimenter left the experimental room and started the program. The duration of the session was approximately 11/2 hours, including time to set up the EGG, acoustic and physiological apparatus. At the end of the session, speakers were debriefed and their agreement for further use of their data was obtained. Results Note. Although respiration was recorded with a respiration strain gauge in this experiment, technical problems with the respiration amplifier precluded the data from being analysed. Acoustic measures The set of acoustic measures was largely the same as that examined in experiments two and three, with some changes. Mean F0 was not analysed, since median F0 had consistently shown the same results in previous experiments and was judged to be less susceptible to the effects of outliers than the mean. F0 3rd moment, which had been included in the second experiment as an exploratory measure of the skewness of the F0 distribution, but had shown no effects of experimental manipulations, was also excluded. Only voiced spectral measures were included, since unvoiced spectral measures had not consistently shown changes with manipulations in
previous experiments. Since spectral energy under 500 Hertz had been found to be less reliable and less related to manipulations in previous experiments than energy under 1000 Hertz, it was also not analysed in this experiment. A number of new measures were added to the analysis: F0 standard deviation. The standard deviation of F0 values was calculated for each utterance, as a measure of overall F0 variability. F0 standard deviation across single phrases or utterances has been measured in other studies (see, e.g. Banse and Scherer, 1996; Scherer, 1986) and shown to increase with highly aroused emotions and decrease with emotions such as boredom. Because each F0 value has been calculated on the basis of windows of the acoustic speech signal of varying lengths (always more than two fundamental periods), it is difficult to know whether the standard deviation represents global, suprasegmental variation in F0 or period to period variation. The former corresponds to the changes in F0 associated with intonation, whether emotional or non-emotional, and is related to the F0 range (difference between F0 floor and ceiling). The latter type of variation is called jitter, and has been independently measured as an indicator of emotional stress in previous research (e.g. Smith, 1977). In this experiment, since the EGG signal made possible the accurate period to period measurement of F0, jitter, F0 standard deviation and F0 range could all be measured and compared. Spectral slope. The power spectrum of voiced speech has a spectral slope of approximately –6 decibels (dB) per octave. The source of this spectral slope is the spectrum of the glottal excitation, which has a slope of approximately –12 dB, which is then modified by the filtering of the vocal tract and lips. Although the glottal source spectrum is not directly available for measurement, it is possible that the spectral slope of the acoustic speech signal will vary with emotion-induced changes to the glottal source spectrum (Scherer, 1986; Klasmeyer, 1998; Klasmeyer and Sendlmeier, 1997).
In particular, it is predicted that greater tension in the vocal folds coupled with greater expiratory force will cause a less negative spectral slope (i.e. relatively more high frequency energy/less low frequency energy). For this reason, a regression line was fit to the voiced power spectrum and the slope of the line in dB/octave was calculated and analysed in this experiment. Mel power spectrum. To provide further information on the change of the power spectrum with the experimental manipulations, a mean Mel power spectrum was calculated for each utterance. The Mel spectrum is a power spectrum in which the frequency axis has been warped to reflect the perceptual properties of sound. It allows for the fact that certain ranges of frequencies are perceived with greater resolution than others. A transformation is applied to the frequency axis that effectively groups together those frequencies that cannot be distinguished perceptually, while keeping separate those frequencies that can be perceptually resolved. The formula for transforming frequency in Hertz to frequency in Mel is m=2595 log10(1+f/700) Although widely used in the domain of speech science, the Mel spectrum of emotional speech has not previously been examined. The Mel spectrum was used in this experiment because it represents a more theoretically principled way in which to reduce the 512 frequency values in a typical power spectrum than the purely statistical data reduction techniques such as factor analysis used in previous studies (e.g. Banse and Scherer, 1996). EGG measures The same set of EGG measures as analysed in experiment three was included in this experiment. In addition to the measurement of glottal quotients, which indicate the proportion of each glottal period occupied by the opening, open, closing and closed phases, the absolute opening, open, closing and closed times were also measured. The
reason for this was to allow a better interpretation of how changes to the F0 corresponded to changes to the lengths of the four glottal phases. Quotients, in contrast, measure the shape of the glottal waveform after normalisation to the length of the glottal period, and are thus independent of the absolute F0 level. For each utterance, an average glottal waveform was also calculated, by normalising each glottal waveform by its length and amplitude range and then calculating the mean. This waveform was intended to provide additional information on emotion-induced changes to the shape (but not the amplitude or duration) of the glottal cycle. Statistical analysis Acoustic, EGG and physiological measures were analysed in conduciveness by difficulty by subject mixed model ANOVA, with conduciveness and difficulty as fixed factors and subject as a random factor. Two separate analyses were performed for the EGG and acoustic data corresponding to the standard phrase and the extended vowel respectively. The acoustic measures analysed were the same for both analyses, except that duration and proportion voiced were not analysed for the extended [a] vowel, since both these fluency-related measures are only relevant for spoken phrases. Acoustic measures for the extended [a] vowel An interaction of conduciveness with difficulty for median and ceiling F0 was due to higher median F0 (F(1,27)=5.8, p=0.023) and F0 ceiling (F(1,28)=8.7, p=0.006) for difficult obstructive situations than for difficult conducive situations. The variation of median and ceiling F0 across conditions corresponded to that of EGG open time, for which there was an effect of conduciveness (F(1,28)=7.9, p=0.009), indicating that the vocal folds were open shorter during each vocal cycle in difficult obstructive than in difficult conducive situations, as shown in figure 6.1.
An interaction of conduciveness with difficulty was measured for EGG closed quotient (F(1,28)=6.3, p=0.018) and open quotient (F(1,28)=6.9, p=0.014), due to greater EGG closed quotient and lower EGG open quotient for difficult obstructive than difficult conducive situations. These effects, shown in figure 6.2, imply longer vocal fold contact, as a proportion of vocal period, during difficult, obstructive situations than during difficult, conducive situations.
Median F0 (Hz.)
117
115
113
111 conducive easy
obstruct easy
conducive difficult
obstruct difficult
Ceiling F0 (Hz.)
Condition
121 120 119 118 117 116 115 114 113 conducive easy
obstruct easy
conducive difficult
obstruct difficult
Condition
Open time (samples)
100 98 96 94 92 90 88 conducive easy
obstruct easy
conducive difficult
obstruct difficult
Condition
Figure 6.1. Median F0 (top), ceiling F0 (bottom) and EGG open time for extended [a] vowel as a function of conduciveness and difficulty. Bars represent 95% within-subject confidence intervals.
Figure 6.3 shows the mean normalised EGG glottal cycles for difficult conducive and difficult obstructive situations. In this figure, the longer closed quotient for difficult obstructive situations is apparent in the longer time for the EGG signal to fall from its maximum amplitude (although because figure 6.3 represents an average across all speakers, the effect appears small).
Closed Quotient
0.29 0.285 0.28 0.275 0.27 0.265 conducive easy
obstruct easy
conducive difficult
obstruct difficult
Condition
0.495 Open Quotient
0.49 0.485 0.48 0.475 0.47 0.465 0.46 conducive easy
obstruct easy
conducive difficult
obstruct difficult
Condition
Figure 6.2. EGG closed quotient (top),and open quotient (bottom) for extended [a] vowel as a function of conduciveness and difficulty. Bars represent 95% within-subject confidence intervals.
1
normalised amplitude
0.8 0.6 0.4 0.2 0 -0.2 -0.4 -0.6 -0.8 time
Figure 6.3. Mean EGG glottal cycles for extended [a] vowel for the difficult conducive (broken line) and difficult obstructive (solid line) conditions. There was a nonsignificant trend for the proportion of energy under 1000 Hertz to be greater for conducive than for obstructive situations (F(,28)=3.0, p=0.093, which was mostly due to a lower proportion of low frequency energy for difficult obstructive situations than the other conditions (see figure 6.4). This effect is not immediately apparent when looking at the Mel spectrum (figure 6.5), which shows some low (under 1000 Hertz) frequencies for which there is greater energy for difficult obstructive situations than for the other conditions. This discrepancy might be explained by the fact that over the larger range of high frequencies, obstructive situations show greater energy than conducive situations. Therefore, as a proportion of total energy, averaged over the whole spectrum, the low frequency energy is lower for obstructive situations than conducive situations. However, close examination of the Mel spectrum reveals that only considering such global measures as proportion of energy under 1000 Hertz might not give a clear picture of what is actually happening in the acoustic signal. In this case, there is clearly an interesting effect of conduciveness and difficulty on a specific range of frequencies from 300 to 700 Hertz. Furthermore, in the case of an [a] vowel this
range of frequencies corresponds to a part of the spectrum between two formants, implying that a standard formant analysis could not have identified the effect either.
proportion of energy
0.88 0.875 0.87 0.865 0.86 0.855 0.85 conducive easy
obstruct easy
conducive difficult
obstruct difficult
Condition
Figure 6.4. Proportion of energy below 1000 Hertz for extended [a] vowel as a function of conduciveness and difficulty. Bars represent 95% within-subject confidence intervals.
60 easy conducive easy obstructive difficult conducive difficult obstructive
50
Power (dB)
40 30 20 10 0 Frequency (Mel)
Figure 6.5. Mel power spectrum for extended [a] vowel. Acoustic measures for standard phrase A main effect of difficulty on median F0 (F(1,28)=4.2, p=0.049) was due to higher median F0 in difficult than in easy situations (see figure 6.6). An interaction of
difficulty and conduciveness on F0 floor (F(1,27)=4.9, p=0.035) was due to higher F0 floor for easy conducive than easy obstructive situations, but higher F0 floor for difficult obstructive than difficult conducive situations. A similar difficulty by conduciveness interaction effect was found for F0 ceiling (F(1,27)=9.3, p=0.005). An interaction effect of difficulty by conduciveness on open time (F(Figure 1,27)=4.3, p=0.047) was due to shorter opening time for the difficult obstructive condition that the other conditions. Figure 6.7 shows F0 ceiling, F0 floor and glottal open time for the standard phrases as a function of experimental condition. An interaction of difficulty and conduciveness on low frequency EGG energy (F(1,27)=4.4, p=0.046) was due to greater low frequency EGG energy for easy conducive situations than for easy difficult situations, but greater low frequency EGG energy for difficult obstructive situations than for difficult conducive situations (see
Median F0 (Hz.)
figure 6.8).
130 129 128 127 126 125 124 123 122 conducive easy
obstruct easy
conducive difficult
obstruct difficult
Condition
Figure 6.6. Median F0 for standard phrase as a function of conduciveness and difficulty. Bars represent 95% within-subject confidence intervals.
Ceiling F0 (Hz.
153 152 151 150 149 148 147 146 145 144 143 conducive easy
obstruct easy
conducive difficult
obstruct difficult
Condition
109
Floor F0 (Hz.
108 107 106 105 104 103 conducive easy
obstruct easy
conducive difficult
obstruct difficult
Condition
Open time (samples)
88 87 86 85 84 83 82 81 conducive easy
obstruct easy
conducive difficult
obstruct difficult
Condition
Figure 6.7. Ceiling F0 (top), F0 floor (centre) and glottal open time (bottom) for standard phrase as a function of conduciveness and difficulty. Bars represent 95% within-subject confidence intervals.
low frequency EGG energy
2200 2100 2000 1900 1800 1700 1600 1500 1400 conducive easy
obstruct easy
conducive difficult
obstruct difficult
Condition
Figure 6.8. Low frequency EGG energy for standard phrase as a function of conduciveness and difficulty. Bars represent 95% within-subject confidence intervals. An interaction of difficulty and conduciveness on spectral slope (F(1,27)=11.7, p=0.002) was measured, with flatter spectral slope for easy conducive situations than for easy difficult situations, but flatter spectral slope for difficult obstructive situations than for difficult conducive situations (see figure 6.9). Figure 6.10 shows the Mel power spectrum for easy and difficult conditions. For the easy condition, the flatter spectral slope for conducive than for obstructive situations is due to greater energy in the lower half of the spectrum for obstructive than for conducive situations, but little or no difference in the upper part of the spectrum. For the difficult condition, the flatter spectral slope for obstructive than for conducive situations is due to greater energy in the upper part of the spectrum for obstructive situations than for conducive situations, but little or no difference in the lower part of the spectrum. It is worth noting that the proportion of energy below 1000 Hertz showed no significant effects for the experimental manipulations. Thus spectral slope seems to capture separate, possibly more global, aspects of spectral change than the proportion of energy below 1000 Hertz measure, which is more likely influenced by changes to local parts of the spectrum.
spectral slope (dB/octave)
-6 -6.1 -6.2 -6.3 -6.4 -6.5 -6.6 -6.7 conducive eas y
obs truct eas y
conducive difficult
obs truct difficult
Condition
Figure 6.9. Spectral slope for standard phrase as a function of conduciveness and difficulty. Bars represent 95% within-subject confidence intervals. 60 50
Power (dB)
40 30 20 10 0 F r e q u e n c y (M e l)
60 50
Power (dB)
40 30 20 10 0 Frequenc y (M e l)
Figure 6.10. Mel power spectrum for easy situations (top) and difficult situations (bottom) for the standard phrase. Solid lines represent conducive condition, broken lines represent the obstructive condition.
Physiological measures Skin conductance level was higher for obstructive than conducive situations (F(1,25)=6.3, p=0.019), as were skin conductance response amplitudes (F(1,24)=4.8, p=0.038; see figure 6.11). However, whereas skin conductance response amplitudes varied equally with conduciveness in both easy and difficult conditions, the effect of conduciveness on skin conductance level was larger in difficult than in easy situations, as shown in figure 6.11. 13.3 SC level (uS)
13.1 12.9 12.7 12.5 12.3 12.1 conducive easy
obstruct easy
conducive difficult
obstruct difficult
Mean SC amplitude (uS)
Condition
0.54 0.49 0.44 0.39 0.34 0.29 0.24 conducive easy
obstruct easy
conducive difficult
obstruct difficult
Condition
Figure 6.11. Tonic skin conductance level (top) and mean skin conductance response amplitude (bottom) as a function of difficulty and conduciveness. Bars represent 95% within-subject confidence intervals.
An interaction trend of difficulty by conduciveness on the number of skin conductance responses (F(1,23)=4.0, p=0.056) was due to more skin conductance
number of responses
responses in difficult obstructive situations than the other conditions (see figure 6.12).
4.2 4 3.8 3.6 3.4 3.2 3 2.8 2.6 2.4 conducive easy
obstruct easy
conducive difficult
obstruct difficult
Condition
Figure 6.12. Number of skin conductance responses as a function of difficulty and conducivess. Bars represent 95% within-subject confidence intervals. There was a trend for heart rate variability to be lower for difficult (mean = 40.7) than for easy conditions (mean = 45.5; F(1,25)=3.4, p=0.078). An interaction of difficulty and conduciveness on finger temperature (F(1,24)=6.6, p=0.017) was due to higher finger temperature in difficult conducive than in difficult obstructive conditions, but no such conduciveness effect in easy conditions (see figure 6.13). Although finger temperature slope showed the same pattern of means as finger temperature, the effect was not significant.
temperature (F)
91.9 91.8 91.7 91.6 91.5 91.4 91.3 conducive easy
obstruct easy
conducive difficult
obstruct difficult
Condition
Figure 6.13. Finger temperature as a function of conduciveness and difficulty. Bars represent 95% within-subject confidence intervals.
150.00
60.00
9 9
100.00
9
9 disappointed
content
9
50.00
40.00
9
0.00 easy conducive difficult conducive easy obstructive difficult obstructive
condition
condition
100.00
9
200.00
9
9
75.00
9
150.00
9
9
9
25.00
satisfied
stressed
9
20.00
0.00 easy conducive difficult conducive easy obstructive difficult obstructive
50.00
9
9 100.00
50.00
0.00 easy conducive difficult conducive easy obstructive difficult obstructive
condition
0.00 easy conducive difficult conducive easy obstructive difficult obstructive
condition
Figure 6.14. Subjective ratings of felt contentment, disappointment, stress and satisfaction for the four experimental conditions.
Emotion reports Figure 6.14 shows the mean reported intensity of contentment, disapointment, stress and satisfaction for each condition. The other emotions are not discussed here, since they were reported by fewer than five subjects. The four rated emotions were analysed with conduciveness by difficulty mixed model ANOVA. Only rated intensity of stress and satisfaction differed as a function of difficulty and conduciveness. Stress was higher for difficult than for easy conditions (F(1,28)=4.7, p=0.038). Satisfaction was higher for easy than for difficult conditions (F(1,28)=10.9, p=0.003). Emotion reports, vocal and physiological measures To examine how vocal and physiological measures varied with reported emotion, emotion rating data from the four emotions presented in the preceding section was collapsed into a categorical emotion variable representing the emotion that was predominantly felt at that time. For each emotion report, the value of the emotion variable was set to the emotion that had the highest rated emotion instensity. The last category was “none” which was the case when subjects reported no felt emotion. The means and 95% confidence intervals were then plotted for each vocal measure and physiological measure across the categories of the emotion variable. Those measures that differed across emotion (using the 95% confidence interval as a criterion) are reported below.i Vocal measures for the [a] vowel and the standard phrase have been collapsed together, since the vocal variables showed the same pattern across reported emotions for the two types of speech content for all variables discussed below.
120.0
F0 floor (Hz.)
110.0
100.0
90.0 nothing
content
disappointed
satisfied
stressed
satisfied
stressed
emotion 150
F0 ceiling (Hz.)
140
130
120
110 nothing
content
disappointed
emotion 140.0
Median F0 (Hz.)
130.0
120.0
110.0
100.0 nothing
content
disappointed
satisfied
stressed
emotion
Figure 6.15. F0 floor, F0 ceiling and median F0 corresponding to different reported emotions. Bars indicate 95% within-subjects confidence intervals.
F0 floor, F0 ceiling and median F0 all varied with reported emotion, as shown in figure 6.15. Fundamental frequency level and range was relatively high when subjects reported stress or contentment and relatively low when subjects reported disappointment, satisfaction or no emotion. Values for glottal open time (figure 6.16) corresponded to this pattern in F0, with low values when stress and contentment were reported and high values when disappointment and satisfaction were reported. Figure 6.17 shows that spectral slope was relatively flatter when subjects reported disappointment than when they reported contentment or stress. Speech corresponding to reported satisfaction or no emotion had the steepest spectral slope.
Open time
100.0
90.0
80.0 nothing
content
disappointed
satisfied
stressed
emotion
Figure 6.16. Glottal open time corresponding to different reported emotions. Bars indicate 95% within-subjects confidence intervals.
-5.5
Spectral slope (dB/octave)
-6.0
-6.5
-7.0
-7.5
-8.0
-8.5
-9.0 nothing
content
disappointed
satisfied
stressed
emotion
Figure 6.17. Spectral slope corresponding to different reported emotions. Bars indicate 95% within-subjects confidence intervals. Correlations between dependent measures Table 6.2 shows the correlations between those physiological and vocal (i.e. acoustic and EGG) measures which showed differences across experimental conditions. As can be seen, similar to experiment two there are very few significant correlations. Mean skin conductance response amplitude correlated positively with low frequency spectral energy. Apart from this correlation, however, the only significant correlations are found between physiological measures and EGG measures. This result confirms that EGG measurement allows one to look more directly than acoustic measures at the physiological mechanisms that are assumed to underlie emotional changes to speech. The correlations are nevertheless small in magnitude. Negative correlations between the measures of skin conductance activity and vocal fold open time and open quotient indicate that as sympathetic arousal increased, glottal open phase decreased, both in absolute terms, and as a proportion of glottal period. Corresponding to the lower open quotient, glottal closed quotient correlated positively with skin conductance activity, hinting that with increased sympathetic arousal, the vocal folds might have been held
together more firmly and thus stayed closed longer, possibly due to increased vocal fold tension. These correlations were only present for the standard phrase and not for the extended [a] vowel, which is puzzling given the significant differences measured in glottal measures across experimental manipulations. For the extended [a] vowel, finger temperature did correlate positively with glottal open time and open period, and negatively (although not significantly) with closed quotient. Since finger temperature is an indicator of parasympathetically-mediated peripheral vasodilation, these correlations indicate that the vocal folds were held closed longer when parasympathetic activity was low than when parasympathetic activity was high. A similar pattern of correlations was observed between finger temperature and closed phase, open phase and open time for the standard phrase, although the magnitude of the correlations was smaller and they were not significant. Low frequency EGG energy showed a small correlation with skin conductance level, although there were no corresponding correlations of low frequency EGG energy with the other skin conductance measures. Table 6.3. shows the correlations between vocal measures for both the extended [a] vowel (top) and the standard phrase (bottom). It can be seen that the overall pattern of observations is very similar for the standard phrase and the [a] vowel, except that a number of correlations are weaker or non-existent for the standard phrase. Median F0, F0 floor and F0 ceiling were all highly correlated. For the extended vowel these correlations approached unity, reflecting the limited intonation of such vowel pronunciation. For the standard phrase, F0 floor was only weakly correlated with F0 ceiling, confirming that for utterances, the two parameters describe separate aspects (level and range) of the F0 contour. Moderate positive correlations of the F0 measures with energy show that as overall speech energy increases, so does F0.
Moderate negative correlations of the F0 measures with the proportion of energy under 1000 Hertz indicate that high F0 corresponded to a reduced proportion of low frequency energy. Weak positive correlations of spectral slope with F0 measures for the extended vowel were also consistent with a decrease in low frequency energy with high F0, though the correlations were not evident for the standard phrase. In addition, a negative correlation of overall energy with low frequency energy indicates that as overall energy increased, the proportion of energy at low frequencies decreased. For the [a] vowel, but not for the standard phrase, a positive correlation of overall energy with spectral slope was measured. Glottal closed quotient was highly negatively correlated with glottal open time and open quotient, indicating that as the vocal folds remained closed for a longer proportion of the glottal period, the vocal open period shortened, both in absolute terms and as a proportion of total vocal period. F0 median, ceiling and floor all correlated negatively with open time, indicating that the main change to F0 was brought about by a change to the length of the glottal open period. The F0 measures also correlated negatively with open quotient, and positively with closed quotient, for the extended [a] vowel, but not for the standard phrase. Overall speech energy correlated positively with closed quotient and negatively with open time. Of particular relevance to the aims of this experiment was the lack of correlation between low frequency spectral energy and spectral slope, and the EGG parameters. Table 6.4. Correlations between physiological measures. Figures in bold represent correlations significant at p < 0.05.
IBI variability FT SCL # SCRs mean SCR amp.
IBI variability 1.00 -0.13 0.06 0.07 -0.03
FT
SC level
-0.13 1.00 -0.35 0.04 -0.14
0.06 -0.35 1.00 0.32 0.51
# SC responses 0.07 0.04 0.32 1.00 -0.03
mean SCR amplitude -0.03 -0.14 0.51 -0.03 1.00
Table 6.4. gives the correlations between the physiological measures that were found to vary significantly with the experimental manipulations. As can be seen, apart from correlations between skin conductance measures, the only significant correlation was a negative correlation between finger temperature and skin conductance level. This indicates that tonic sympathetic arousal as indicated by skin conductance level is associated with peripheral vasoconstriction. Notably, heart rate variability was not correlated with skin conductance measures. Insofar as heart rate variability might indicate parasympathetic activity, no reciprocal sympathetic-parasympathetic activity is evident here. It is also of note that no correlation was measured between the number of skin conductance responses and the mean response amplitude, suggesting that both parameters measure a different aspect of skin conductance activity.
Discussion Efficacy of the manipulations Based on the results of previous experiments, in which players disengaged from obstructive, low power conditions, an effort was made in this experiment to ensure that players did not disengage from the difficult obstructive condition, while still effectively manipulting goal conducivness and coping dimensions. Confirmation of the efficacy of the experimental manipulations comes from both subjective reports and physiological data. Players reported feeling more stressed in difficult than in easy conditions, and more satisfaction in easy than in difficult conditions. Coupled with these subjective reports were the skin conductance data, which suggest that players were more sympathetically aroused in difficult (particularly difficult obstructive) conditions that in easy conditions. Measurements of finger temperature indicated a greater degree of vasoconstriction for difficult obstructive situations than for difficult conducive
situations, further confirming that experimental manipulations were effective in eliciting a variety of subjective and physiological emotional responses. Effects of the manipulations on the extended [a] vowel For the extended [a] vowel, F0 median and ceiling showed little or no difference between easy conducive and easy obstructive conditions, but were higher for difficult obstructive conditions than for difficult conducive conditions. This interaction effect was matched by a similar interaction effect of difficulty and conduciveness on glottal open time. The implication is that under difficult conditions, obstructive events cause a decrease in glottal open time and hence an increase in F0 compared to conducive events. A corresponding interaction effect was also found for open and closed quotients, indicating that under difficult obstructive conditions, the vocal folds remain closed for a greater proportion of the glottal cycle, at the “expense” of the period during which the folds are open. This pattern of results corresponds to the description of the effects of increased laryngeal muscle tension given by Sundberg (1994) according to which the vocal folds are held in a closed position with greater force. A higher subglottal pressure is therefore required to build up so as to force open the vocal folds. When the vocal folds do eventually open, the rush of air through the glottis causes a sudden drop in pressure due to the Bernoulli effect. The vocal folds are thus rapidly drawn back together again, both under the influence of elastic forces of the increased muscle tension, and the pressure drop between them. The result, termed “tense voice”, is a more skewed glottal pulse, with longer closed phase and shorter open phase. Such was the case with the [a] vowel under difficult obstructive situations compared to difficult conducive situations in this experiment, as shown in figure 6.2. The pattern of correlations between glottal open phase, glottal closed phase and F0 (shown in table 6.3) further supports such an explanation.
Physiological evidence consistent with the F0 and glottal data comes from the skin conductance data, which show the same difficulty by conduciveness interaction. The higher skin conductance level and number of responses for the difficult obstructive condition than for the difficult conducive situation indicates that in difficult situations, sympathetic arousal was higher in obstructive than in conducive conditions. Finger temperature indicated a greater degree of peripheral vasoconstriction, consistent with an increase in sympathetic arousal, in difficult obstructive than in difficult conducive events. Such high sympathetic arousal is possibly accompanied by increased muscular tension, including the laryngeal muscles. The range of changes to F0, glottal phase measures and sympethetic arousal indicators is in partial agreement with the hypotheses of this experiment. An increase in sympathetic arousal and laryngeal tension, leading to higher F0, shorter glottal open phase and longer glottal closed phase, was predicted for difficult condition compared to the easy condition. It is apparent, however, that as in experiment two, such effects were depended primarily on an interaction of difficulty with the conduciveness manipulation. An interaction effect was predicted, although the prediction was that the effects of the difficulty manipulation would depend upon the obstructiveness manipulation, with difficulty effects being amplified in obstructive events compared to conducive events. The results of this experiment, however, indicate that the effects of the conduciveness manipulation often depended upon the difficulty manipulation. Unfortunately, the theory of Scherer (1986), while not excluding such interaction effects, does not discuss them either. More will be said about the interaction of appraisal dimensions and the need to address how such interactions affect the voice in the concluding chapter. The proportion of energy under 1000 Hertz was also lower for obstructive than for conducive conditions, particularly in the difficult condition. Such a result could be the result of a more skewed glottal cycle, as described above, which produces sound with
more energy in higher harmonics. The positive correlation between energy under 1000 Hz and open time and the weak negative correlation between energy under 1000 Hertz and closed quotient are consistent with such a relation between glottal cycle and spectral energy. Similar correlations were found in experiment 3a. The correlations measured in this experiment were very small, however, making it unlikely that manipulationdependent changes to the form of the glottal cycle were the sole cause of spectral energy distribution changes. Examination of the mean Mel power spectrum also reveals that the most prominent differences between obstructive and conducive conditions correspond to fairly limited frequency regions. Such differences, localised in frequency, are more likely a result of differences to the resonance characteristics of the vocal tract than changes to glottal function, which would lead to a more global spectral slope change. Indeed, no significant effects of conduciveness or difficulty on spectral slope were measured for the extended vowel, implying that the changes in the proportion of low frequency energy were more localised in frequency, and at last partly due to resonance changes. Such an interpretation is consistent with the results from experiment two and the predictions of Scherer (1986), based on changes to resonance caused by a more constricted vocal tract in obstructive or negative conditions. Effects of the manipulations on the standard phrase. For the standard phrase, results were similar to those for the extended vowel, although median F0 showed a main effect of difficulty, with median F0 higher for difficult than for conducive conditions. For F0 ceiling and F0 floor, an interaction between difficulty and conduciveness was measured, with higher F0 ceiling and F0 floor in difficult obstructive conditions than in difficult conducive situations, but an opposite or no difference between easy obstructive and easy conducive situations.
Glottal open time varied in the same manner, suggesting that changes to the F0 floor, median and ceiling were due to changes in the length of the glottal open phase. In contrast with the results for the extended vowel, no significant effects were found for glottal closed quotient nor glottal open quotient. It is probable that such parameters are of limited use in describing glottal function when averaged across multiple different vowels, and across sentences where intonation causes large shifts to F0. The lower correlations between the glottal and acoustic parameters for the standard phrase compared to the extended vowel indicate that this is the case. It is also probable that the mechanisms responsible for changing F0 in a fluent sentence differ from those at play during steady-state vowel production. A large influence on F0 in sentences is intonation, which is non-existent in extended vowel production. Although emotional changes to laryngeal tension might still have an effect on the opening and closing function of the vocal folds, it is possible that such an effect is swamped by the influence of emotion on large intonational F0 changes. Relative to this point, an interesting correspondence between the effects of difficulty and conduciveness manipulations on F0 ceiling and EGG low frequency energy was measured. EGG low frequency energy had been measured in an exploratory manner as a possible indicator of larynx movement that could be associated with sentence intonation. The similarity in results between EGG low frequency energy and F0 ceiling indicates that larynx movement might well be a significant contributor to emotional changes to F0 range. An interaction effect of difficulty and conduciveness on spectral slope was also measured. Spectral slope was flatter for difficult obstructive than for difficult conducive conditions, but flatter for easy conducive than for easy obstructive conditions. This result raises the question of whether the changes observed to spectral slope were due to changes in vocal fold function. The lack of correlation between spectral slope and any
of the F0 or EGG parameters would seem to suggest that no direct link exists. However, the Mel spectra in figure 6.10 indicate that the differences between obstructive and conducive conditions, for both easy and difficult cases, are quite global, stretching over an extended range of frequencies. One might expect that changes to spectral characteristics due to vocal tract resonance changes would be concentrated around parts of the spectrum that correspond to formants, or perhaps anti-formants. This does not seem to be the case here. Unfortunately it is also the case that the spectra measured here were averaged over multiple phonemes, and thus it is impossible to make inferences about individual formant changes. A more detailed phoneme-by-phoneme formant analysis might be required to understand the nature of emotion-induced spectral changes to fluent speech. Apart from being very time consuming however, current techniques of formant analysis are fraught with inaccuracies. The precise measurement of formant locations, amplitudes and bandwidths requires very high quality, linear, recordings of speech without phase distortions (as recorded in an anechoic chamber for example). Conclusion The results of this experiment indicate that faced with an obstructive situation with limited coping potential, the body mobilises its resources to actively cope. This it does by elevating activity in the sympathetic branch of the autonomic nervous system, as indicated by skin conductance level and skin conductance responses. This elevated sympathetic activity corresponds to a probable increase in laryngeal tension, which leads to a corresponding change in the opening and closing of the vocal folds. In addition to a general speeding up of the vocal cycle, the folds close with more force and remain closed for a longer proportion of each vocal cycle. The result is a higher fundamental frequency, as well as a possible increase in the strength of high harmonics and thus in the proportion of acoustic speech energy at higher frequencies.
For pronunciation of a phrase, as opposed to an extended vowel, some F0 variation is due to the larynx movement involved in intonation, as indexed by the low frequency EGG signal. Further investigation of larynx movement, possibly using more accurate measurement techniques such as dual EGG recording from two vertically separated locations on the neck, is needed to understand how such a mechanism is affected by different types of emotional response. Obstructive, challenging conditions also produce more local changes to spectral distribution, possibly as a result of constriction of the walls of the vocal tract, as predicted by Scherer (1986). The use of EGG measurements in this experiment has provided valuable insights into the changes that occur in vocal fold function due to emotional physiological responses, but has not provided clear results with respect to spectral changes. An understanding of the causes of emotional spectral changes to speech will require further use of such EGG techniques in combination with accurate formant analysis.
i
Multivariate techniques of analysis, such as ANOVA, were not used in this instance
since they make implicit assumptions about the dependent and independent variables, which we do not wish to make here (subjective ratings are as much a dependent variable as vocal and physiological measures). In addition, given the unbalanced nature of the repeated measures design, with eight unequally represented categories of emotion, violations of the sphericity assumption in a repeated measures ANOVA would be severe.