World Economic Situation and Prospects
2012
United Nations publication Sales No. E.12.II.C.2 Copyright © United Nations, 2012 All rights reserved Printed at the United Nations, New York ISBN 978-92-1-109164-9 eISBN 978-92-1-055103-8
Acknowledgements
iii
The present report is a joint product of the United Nations Department of Economic and Social Affairs (UN/DESA), the United Nations Conference on Trade and Development (UNCTAD) and the five United Nations regional commissions (Economic Commission for Africa (ECA), Economic Commission for Europe (ECE), Economic Commission for Latin America and the Caribbean (ECLAC), Economic and Social Commission for Asia and the Pacific (ESCAP) and Economic and Social Commission for Western Asia (ESCWA)). For the preparation of the global outlook, inputs were received from the national centres of Project LINK and from the participants at the annual LINK meeting held in New York from 24 to 26 October 2011. The cooperation and support received through Project LINK are gratefully acknowledged. tourism.
The United Nations World Tourism Organization (UNWTO) contributed to the section on international
The report was prepared by a team coordinated by Rob Vos and comprising staff from all collaborating agencies, including Grigor Agabekian, Abdallah Al Dardari, Clive Altshuler, Lauren Anderson, Nassirou Ba, Shuvojit Banerjee, Sudip Ranjan Basu, Hassiba Benamara, Alfredo Calcagno, Jeronim Capaldo, Jaromir Cekota, June Chesney, Junior Roy Davis, Ann D’Lima, Dony El Costa, Adam Elhiraika, Bilge Erten, Pilar Fajarnes, Heiner Flassbeck, Marco Fugazza, Samuel Gayi, Sergei Gorbunov, Cordelia Gow, Aynul Hasan, Jan Hoffmann, Pingfan Hong, Michel Julian, Alex Izurieta, Cornelia Kaldewei, Jane Karonga, Matthias Kempf, Leah C. Kennedy, John Kester, Pierre Kohler, Mary Lee Kortes, Nagesh Kumar, Michael Kunz, Alexandra Laurent, Hung-Yi Li, Muhammad Hussain Malik, Sandra Manuelito, Joerg Mayer, Nicolas Maystre, Valerian Monteiro, Alessandro Nicita, Victor Ognivtsev, Oliver Paddison, José Palacin, Joanna Panepinto, Ingo Pitterle, Daniel Platz, Li Qiang, Benu Schneider, Krishnan Sharma, Robert Shelburne, Shari Spiegel, Alexander Trepelkov and John Winkel. guidance.
Jomo Kwame Sundaram, Assistant Secretary-General for Economic Development, provided comments and
For further information, see http://www.un.org/en/development/desa/policy/index.shtml or contact:
DESA: Mr. Sha Zukang, Under-Secretary-General, Department of Economic and Social Affairs, Room DC2-2320, United Nations, New York, NY 10017, USA; telephone: +1-212-9635958; email:
[email protected] UNCTAD: Mr. Supachai Panitchpakdi, Secretary-General, United Nations Conference on Trade and Development, Room E-9042, Palais de Nations, CH-1211, Geneva 10, Switzerland; telephone +41-22-9175806; email:
[email protected] ECA: Mr. Abdoulie Janneh, Executive Secretary, United Nations Economic Commission for Africa, P.O. Box 3005, Addis Ababa, Ethiopia; telephone: +251-11-544 3336; email:
[email protected] ECE: Mr. Ján Kubiš, Executive Secretary, United Nations Economic Commission for Europe, Information Service, Palais des Nations, CH-1211, Geneva 10, Switzerland; telephone: +41-22-9174444; email:
[email protected] ECLAC: Ms. Alicia Bárcena, Executive Secretary, Economic Commission for Latin America and the Caribbean, Av. Dag Hammarskjold 3477, Vitacura, Santiago, Chile; telephone: +56-2-2102000; email:
[email protected] ESCAP: Ms. Noeleen Heyzer, Executive Secretary, Economic and Social Commission for Asia and the Pacific, United Nations Building, Rajadamnern Nok Avenue, Bangkok 10200, Thailand; telephone: +66-2-2881234; email:
[email protected] ESCWA: Ms. Rima Khalaf, Executive Secretary, Economic and Social Commission for Western Asia, P.O. Box 11-8575, Riad el-Solh Square, Beirut, Lebanon; telephone: +961-1-978800; website: http://www.escwa.un.org/about/staff.asp
v
Executive Summary Global economic prospects for 2012 and 2013 The world economy is on the brink of another major downturn The world economy is teetering on the brink of another major downturn. Output growth has already slowed considerably during 2011 and anaemic growth is expected during 2012 and 2013. The problems stalking the global economy are multiple and interconnected. The most pressing challenges lie in addressing the continued jobs crisis and declining prospects for economic growth, especially in the developed countries. As unemployment remains high, at nearly 9 per cent, and incomes stagnate, the recovery is stalling in the short run owing to the lack of aggregate demand. But, as more and more workers are out of a job for a long period, especially young workers, medium-term growth prospects will also suffer because of the detrimental effect on workers’ skills and experience. The rapidly cooling economy has been both a cause and an effect of the sovereign debt crisis in the euro area, and of fiscal problems elsewhere. The sovereign debt crises in a number of European countries worsened further in 2011 and aggravated weaknesses in the banking sector. Even bold steps by the Governments of the euro area countries to reach an orderly sovereign debt workout for Greece have been met with continued financial market turbulence and heightened concerns of debt default in some of the larger economies in the euro zone, Italy in particular. The fiscal austerity measures taken in response are further weakening growth and employment prospects, making fiscal adjustment and the repair of financial sector balance sheets all the more challenging. The United States economy is also facing persistent high unemployment, shaken consumer and business confidence, and financial sector fragility. The European Union (EU) and the United States of America form the two largest economies in the world, and they are deeply intertwined. Their problems could easily feed into each other and lead to another global recession. Developing countries, which had rebounded strongly from the global recession of 2009, would be hit through trade and financial channels.
Faltering growth with heightened risk for a double-dip recession Premised on a set of relatively optimistic conditions, including the assumptions that the sovereign debt crisis in Europe will in effect be contained within one or just a few small economies and that those debt problems can be worked out in more or less orderly fashion, growth of world gross product (WGP) is forecast to reach 2.6 per cent in the baseline outlook for 2012 and 3.2 per cent for 2013. However, failure of policymakers, especially those in Europe and the United States, to address the jobs crisis and prevent sovereign debt distress and financial sector fragility from escalating would send the global economy into another recession. In an alternative downside scenario, growth of WGP would decelerate to 0.5 per cent in 2012, implying a decline in average per capita income for the world. More benign outcomes for employment and sustainable growth worldwide would require much more forceful and internationally concerted action than that embodied in current policy stances. Global output growth could be pushed back up to about 4.0 per cent in 2012 and 2013, but with present policy approaches and stances, such an optimistic scenario will remain a distant reality.
vi
World Economic Situation and Prospects 2012
Weakening, but uncertain, outlook for the global economy 5
World gross product (percentage) 4.1
4
4.0
4.0
Optimistic scenario
4.0 3.2 ario
3.9 2.8
3
2.6
Pe
scen
2.2
m ssi
2
line
Base
n ce cs
isti
1.5
1
o ari
0.5
0 Sources: UN/DESA and Project LINK. Note: See box I.1 for assumptions underlying the baseline forecasts and section on “Risks and uncertainties” for assumptions for the pessimistic scenario. a Estimates. b United Nations forecasts.
-1 -2 -2.4
-3 2006
2007
2008
2009
2010
2011a
2012b
2013b
The economic woes in many developed economies are a major drag on the global economy The economic woes in many developed economies are a major factor in the global slowdown. Most developed economies are suffering from predicaments remnant of the global financial crisis. Growth in the United States slowed notably in 2011. Gross domestic product (GDP) growth is expected to weaken further in 2012 and, even under the baseline assumptions, a mild contraction is possible during part of the year. The country was on the verge of defaulting on its debt obligations in August of 2011 because of political deadlock. The uncertain prospects are exacerbating the fragility of the financial sector, causing lending to businesses and consumers to remain anaemic. Growth in the euro area has slowed considerably since the beginning of 2011, and the collapse in confidence evidenced by a wide variety of leading indicators and measures of economic sentiment suggests a further slowing ahead, perhaps to stagnation by the end of 2011 and into early 2012. Japan fell into another recession in the first half of 2011, resulting largely, but not exclusively, from the disasters caused by the March earthquake. While post-quake reconstruction is expected to lift GDP growth in Japan to above potential, to about 2 per cent per year, in the coming two years, risks remain on the downside.
Developing countries remain vulnerable to downturns in the developed economies Developing countries and economies in transition are expected to continue to stoke the engine of the world economy, but their growth in 2012-2013 will be well below the pace achieved in 2010 and 2011. Even though economic ties among developing countries have
Executive Summary
vii
Developing economies continue to stoke the engine of the global economy 10.0
GDP growth rates (percentage)
8.0 6.0 4.0 2.0 0.0 -2.0 -4.0
Developed economies Economies in transition
-6.0
Developing economies Least developed countries
-8.0 2006
2007
2008
2009
2010
2011a
2012b
2013b
strengthened, these countries remain vulnerable to economic conditions in the developed economies. From the second quarter of 2011, economic growth in most developing countries and economies in transition started to slow notably. Among the major developing countries, growth in China and India is expected to remain robust: growth in China is projected to slow to below 9 per cent in 2012-2013, while India is expected to grow by between 7.7 and 7.9 per cent. Brazil and Mexico are expected to suffer a more visible economic slowdown. Low-income countries have also seen a slowdown, albeit a mild one. In per capita terms, income growth slowed from 3.8 per cent in 2010 to 3.5 per cent in 2011, but despite the global slowdown, the poorer countries may see average income growth at or slightly above this rate in 2012 and 2013. The same holds for average growth among the United Nations category of the least developed countries (LDCs). Even so, growth is expected to remain below potential in most of these economies.
The global jobs crisis High unemployment is a major stumbling block on the path to recovery Persistent high unemployment remains the Achilles heel of economic recovery in most developed countries. The unemployment rate averaged 8.6 per cent in developed countries in 2011, still well above the pre-crisis level of 5.8 per cent registered in 2007. In many developed economies, the actual situation is worse than reflected in official unemployment rates. In the United States, for instance, labour participation rates have been on a steady decline since the start of the crisis. Increasing numbers of workers without a job for a prolonged period have stopped looking for one and are no longer counted as part of the labour force. About 29 per cent of the unemployed in the United States have been
Sources: UN/DESA and Project LINK. a Estimates. b United Nations forecasts.
viii
World Economic Situation and Prospects 2012
66.5
30
66.0
25
Participation rate
Participation rate 65.5
20
65.0
15
64.5
10 Median number of weeks of unemployment
64.0
5
0 Jul-2011
Jan-2011
Jul-2010
Jan-2010
Jul-2009
Jan-2009
Jul-2008
Jan-2008
Jul-2007
Jan-2007
Jul-2006
Jan-2006
63.5
Source: UN/DESA, based on data from the United States Bureau of Labor Statistics.
Median number of weeks of unemployment
Long-term unemployment disencourages job searching in the United States
without a job for more than one year, up from 10 per cent in 2007. Such a prolonged duration of unemployment tends to have significant long-lasting, detrimental impacts on both the individuals who have lost their jobs and on the economy in general. The skills of unemployed workers deteriorate commensurate with the duration of their unemployment, most likely leading to lower earnings for those individuals who are able to find new jobs in the future. At the aggregate level, the higher the proportion of workers entrapped in protracted unemployment, the greater the adverse impact on the productivity of the economy in the medium to long run.
Employment recovery in developing countries has been much stronger In developing countries, the employment recovery has been much stronger than in developed economies. For instance, unemployment rates are back to or below pre-crisis levels in most Asian developing countries, while employment has recovered in most countries in Latin America also. However, developing countries continue to face major challenges owing to the high shares of workers that are underemployed, poorly paid, have vulnerable job conditions and lack access to any form of social security. At the same time, open unemployment rates remain high, at well over 10 per cent in urban areas, with the situation being particularly acute in a number of African and Western Asian countries. Long-term unemployment has also increased in developing countries.
High youth unemployment is a concern worldwide Unemployment rates among youth (persons 15-24 years of age) tend to be higher than other cohorts of the labour force in normal times in most economies, but the global financial crisis and its subsequent global recession have increased this gap disproportionally. Barring data limitations, the jobless rate among young workers increased from an estimated 13 per cent in 2007 to about 18 per cent by the first quarter of 2011. The situation remains
Executive Summary
particularly acute in some developed economies. In Spain, an astonishing 40 per cent of young workers are without a job. A quarter or more of the youth in Western Asia and North Africa and one fifth of those in the economies in transition are unemployed. In other developing regions, too, youth unemployment has increased more than that of other age groups. Latin America and the Caribbean, in particular, have experienced significant increases in youth unemployment since 2008, although the situation started to improve in the first half of 2011. In South and East Asia and Africa, young workers have a high probability of facing vulnerable employment conditions.
A global employment deficit of 64 million jobs needs to be eliminated In order to restore pre-crisis employment and absorb the new labour entrants, an employment deficit, estimated at 64 million jobs in 2011, would need to be eliminated. With the global economic slowdown projected in the baseline and growth of the workforce worldwide, however, this deficit would increase further, leaving a job shortage of about 71 million, about 17 million of which would be in developed countries. If economic growth stays as anaemic in developed countries as projected in the baseline forecast, employment rates will not return to pre-crisis levels until well beyond 2015. Persistent high unemployment is holding back wage growth and consumer demand globally and pushing up delinquency on mortgage payments in the United States. Combined with continued financial fragility in the developed economies, it is also depressing investment demand and business confidence and holding back economic recovery further.
Inflation outlook Inflation has increased worldwide during 2011, driven by a number of factors, particularly the adverse supply-side shocks that have pushed up food and oil prices and strong demand in large developing economies as a result of rising incomes. Reflationary monetary policies in major developed economies have also contributed to upward pressure.
Inflation should not be a major policy concern in developed economies… Among developed economies, inflation rates in the United States and Europe edged up during 2011, moving from the lower to the upper bound of the inflation target bands set by central banks. This increase was in line with the policy objective in these economies to mitigate the risk of deflation in the aftermath of the financial crisis as their central banks continued to inject more liquidity into the economy through various unconventional policy measures. Nonetheless, inflation should not be a major policy concern for most developed economies. Inflation is expected to be moderate in the outlook for 2012-2013 with the weakening of aggregate demand, subdued wage pressures in the face of continued high unemployment and—barring major supply shocks—the moderating of international commodity prices.
…but is a bigger concern in a number of developing countries Inflation rates surpassed policy targets by a wide margin in a good number of developing economies. The monetary authorities of these economies have responded with a variety of measures, including by tightening monetary policy, increasing subsidies on food and oil,
ix
x
World Economic Situation and Prospects 2012
and providing incentives to domestic production. In the outlook, along with an anticipated moderation in global commodity prices and lower global growth, inflation in most developing countries is also expected to decelerate in 2012-2013.
International trade and commodity prices The recovery of world trade is decelerating The recovery of world trade slowed down in 2011 as growth in merchandise trade declined to 6.6 per cent, from 12.6 per cent in 2010. In the baseline outlook, world trade growth will continue at a slower pace of 4.4 and 5.7 per cent in 2012 and 2013, respectively. Feeble global economic growth, especially among developed economies, is the major factor behind the deceleration. Developing countries were more resilient to the crisis and their importance in world trade continues to increase. Between 1995 and 2010, their share in world trade volume increased from 28.5 to 41.2 per cent. In 2011, they led the recovery of external demand by contributing to half of world import growth, compared with 43 per cent on average in the three years prior to the crisis. The shifting patterns of trade are associated with the rapid industrial growth in major developing countries. Between 1995 and 2011, South-South trade increased at an annual rate of 13.7 per cent—well above the world average of 8.7 per cent.
Commodity prices have increased, but remain highly volatile For many commodities, the rising trend in prices that started in June 2010 extended into 2011. After peaking during the first half of the year, prices declined slightly. However, in the case of oil, metals, agricultural raw materials and tropical beverages, average price levels for the year 2011 as a whole surpassed the record averages reached in 2008. In the outlook, commodity exporters that have benefited from improved terms of trade over the last two years remain exposed to downward price pressures, which may be significantly amplified by financial speculation in the event of a double-dip recession. Although financial speculation has been on the agenda of several international forums in 2011, including the Group of Twenty (G20), no decisions have thus far been taken at the international level to better regulate commodity futures markets.
Trade in services is mirroring developments in merchandise trade In 2010, services trade returned to positive growth in all regions and groups of countries, especially developing countries, particularly the least developed among them. As trade in services has shown less sensitivity to the financial crisis compared with trade in merchandise, its rebound was also less pronounced in 2010 and 2011. Developing countries remain net services importers, but their role as service exporters is continuously growing, especially in the transport and tourism sectors.
Trade policy prospects are uncertain In the context of stalled multilateral trade negotiations in the Doha Round, bilateral trade agreements among (sometimes unequal) partners are proliferating and the notion of a “variable geometry” approach in World Trade Organization (WTO) negotiations
xi
Executive Summary
is finding some support among member States. These developments also put at risk the unconditional most favoured nation (MFN) clause, which has been the cornerstone of the multilateral trading system since its inception at the end of the 1940s.
International financing for development Fragilities in the international financial markets are affecting financing for development Existing fragilities in the international financial system are affecting the financing available for development. The uneven global recovery, the risk of European sovereign debt crises and a growing liquidity squeeze in the European interbank market have heightened risk aversion and led to increased volatility in private capital flows. At the same time, official development assistance (ODA) and other forms of official flows have been affected by greater fiscal austerity and sovereign debt problems in developed countries. Not unlike private flows, aid delivery has been pro-cyclical and volatile. Managing the macroeconomic volatility induced by financial flows presents a challenge for emerging market and developing country policymakers. Waves of capital inflows that are in excess of an economy’s absorptive capacity, or highly speculative in nature, may lead to exchange-rate overshooting, inflation, credit booms and asset price bubbles. More importantly, volatile capital flows carry risks for financial and economic stability, with the threat of sudden stops and withdrawals of international capital owing to heightened risk aversion potentially contributing to the spreading financial crises. Policymakers in many countries have responded to these boom and bust cycles by building international reserves as a form of “self-insurance”. During 2011, developing countries added another estimated $1.1 trillion to their reserves, now totalling well over $7 trillion. However, the vast majority of Private financial flows to emerging and developing economies: volatile over the Great Recession 500
Billions of dollars Direct investment, net Other private financial flows, net
400
Private portfolio flows, net
300 200
100 0
-100 -200 2000
2001
2002
2003
2004
2005
2006
2007
2008
2009
2010
2011
Source: International Monetary Fund, World Economic Outlook, September 2011.
xii
World Economic Situation and Prospects 2012
Emerging and developing economies continue to increase reserves as self-insurance 1,400
Change in reserves (billions of dollars)
1,200
1,000
800 600
400
200 Source: International Monetary Fund, World Economic Outlook, September 2011.
0 2000
2001
2002
2003
2004
2005
2006
2007
2008
2009
2010
2011
reserves are invested in United States Treasuries and other low-yielding sovereign paper, thus contributing to increasing global imbalances. The building of reserves in developing countries has the effect of transferring financial resources from the developing to the developed world. Developing countries, as a group, are expected to provide a net transfer of financial resources of approximately $826.6 billion to developed countries in 2011. Furthermore, opportunity costs associated with building reserves exist in the form of forgone domestic investment in development.
Financial reforms are inadequate for containing systemic risks The international community has also taken steps to reduce global risks and strengthen the international financial system through the introduction of new financial regulations, including the internationally agreed framework known as Basel III. The Dodd-Frank Wall Street Reform and Consumer Protection Act was also signed into law in the United States, among measures taken at the national level. Discussions on regulations for systemically important institutions are still ongoing. However, since most of these measures are being phased in over a long period of time, they have not had an impact on the current economic and financial situation. Furthermore, whether many of these measures suffice to contain risk remains uncertain.
Aid flows fall short of commitments Important issues also remain regarding the sufficiency and composition of both aid and international liquidity support. Global aid delivery fell short of amounts pledged for 2010 at the Group of Eight (G8) 2005 Gleneagles Summit. On the positive side, grants and the grant element of concessional loans have increased over time, especially in aid directed towards LDCs.
Executive Summary
Uncertainties and risks Developed economies suffer from four weaknesses that mutually reinforce each other Failure of policymakers, especially in Europe and the United States, to address the jobs crisis and prevent sovereign debt distress and financial sector fragility from escalating poses the most acute risk for the global economy in the outlook for 2012-2013, with a renewed global recession being a distinct possibility. The developed economies are on the brink of a downward spiral driven by four weaknesses that mutually reinforce each other: sovereign debt distress, fragile banking sectors, weak aggregate demand (associated with high unemployment) and policy paralysis caused by political gridlock and institutional deficiencies. These weaknesses are already present, but a further worsening of one of them could set off a vicious circle leading to severe financial turmoil and an economic downturn. This would also seriously affect emerging markets and other developing countries through trade and financial channels.
Contagion of the sovereign debt crisis could trigger a worldwide credit crunch It is quite possible that the recent additional measures planned in Europe will not be effective enough to resolve the sovereign debt crisis in the region, thereby leading to a disorderly and contagious default in a number of countries which will wreak havoc in the economies in the region and beyond. The efforts to solve the sovereign debt crisis in Europe failed to quell the unease in financial markets during November 2011, and fresh warning signs of further problems emerged as Italy’s cost of borrowing jumped to its highest rate since the country adopted the euro. A large number of banks in the euro area already stand to suffer significant losses. Contagion of the sovereign debt crisis to large economies would no doubt trigger a worldwide credit crunch and financial market crash in a scenario reminiscent of the September 2008 collapse of Lehman Brothers Holdings Inc. Such a financial meltdown would no doubt lead to a deep recession, not only in those economies under sovereign debt distress, but also in all other major economies in the euro area, possibly with the intensity of the downturn witnessed in late 2008 and early 2009.
More severe fiscal austerity would push the United States economy into recession The political wrangling over the budget in the United States may also worsen and could harm economic growth if it leads to severe fiscal austerity with immediate effect. This would push up unemployment to new highs, further depress the already much-shaken confidence among households and businesses, and exacerbate the beleaguered housing sector, leading to more foreclosures, which, in turn, would put the United States banking sector at risk again. Consequently, the United States economy may well fall into another recession. The United States Federal Reserve (Fed) might respond by adopting more aggressive monetary measures, for example, through another round of quantitative easing; but in a depressed economy with highly risk-averse agents, this would likely be even less effective in terms of boosting economic growth than the measures taken in previous years.
xiii
xiv
World Economic Situation and Prospects 2012
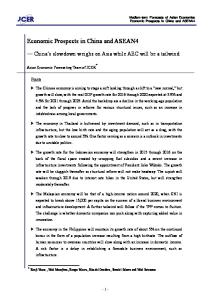
Developing economies would take a significant blow A recession in either Europe or the United States might not be enough to induce a global recession, but a collapse of both economies most likely would. In the pessimistic scenario of the United Nations forecast for 2012, the economy of the EU would decline by 1.5 per cent and that of the United States by 0.8 per cent. Developing economies and the economies in transition would likely take a significant blow. The impact would vary as their economic and financial linkages to major developed economies differ across countries. Asian developing countries, particularly those in East Asia, would suffer mainly through a drop in their exports to major developed economies, while those in Africa, Latin America and Western Asia, along with the major economies in transition, would be affected by declining primary commodity prices. In addition, all emerging economies would have to cope with large financial shocks, including a contagious sell-off in their equity markets, reversal of capital inflows and direct financial losses because of the declining values of the holdings of European and United States sovereign bonds, which would affect both official reserve holdings and private sector assets.
Global imbalances remain a policy concern The large and persistent external imbalances in the global economy that have developed over the past decade remain a point of concern to policymakers. Reducing these imbalances has been a major focus of consultations among G20 Finance Ministers under the Framework for Strong, Sustainable and Balanced Growth and the related Mutual Assessment Process (MAP) during 2011. In practice, after a substantial narrowing during the Great Recession, the external imbalances of the major economies stabilized at about half of their pre-crisis peak
Downside risks: a looming recession in developed economies GDP growth rates (percentage) Mexico
2012 Pessimistic scenario 2012 Baseline scenario
Brazil India China South Africa Nigeria Developing countries Russian Federation Economies in transition European Union Japan United States Developed economies Source: UN/DESA (see chap. I, tables I.1 and I.2, of the present report).
World -4
-2
0
2
4
6
8
10
Executive Summary
levels (relative to GDP) during the period 2010-2011. The United States remained the largest deficit economy, although its deficit has fallen substantially from the peak registered in 2006. The external surpluses in China, Germany, Japan and a group of fuel-exporting countries, which form the counterpart to the United States deficit, have narrowed, albeit to varying degrees. While Germany’s surplus remained at about 5 per cent of GDP in 2011, the current account for the euro area as a whole was virtually in balance. Large surpluses, relative to GDP, were still found in oil-exporting countries, reaching 20 per cent of GDP or more in some of the oil-exporting countries in Western Asia.
Global rebalancing is taking place at the expense of growth At issue is whether the adjustment of the imbalances in major economies has been mainly cyclical or structural. In the United States, some of the corresponding adjustment in the domestic saving-investment gap seems to be structural—for example, the increase in the household saving rate may be lasting; however, the decline in the business investment rate and surge in the Government deficit in the aftermath of the financial crisis are more likely to be cyclical. In the surplus countries, the decline in the external surplus of China has also been driven in part by structural change. China’s exchange-rate policy has become more flexible, with the renminbi appreciating gradually but steadily vis-à-vis the United States dollar over the past year. Meanwhile, the Government has scaled up measures to boost household consumption, aligning the goal of reducing China’s external surplus with that of rebalancing the structure of the economy towards greater reliance on domestic demand. The process of rebalancing can, however, be only gradual over the medium to long run so as to prevent it from being disruptive. In Japan, a continued appreciation of the yen has contained its external surplus. In Germany, room remains for policies to stimulate more domestic demand so as to further narrow its external surplus. Unsustainably large imbalances must be addressed, but at their present levels, the global imbalances should not be a primary reason for concern. However, the global rebalancing agenda should not develop at the expense of growth; rather, it should promote growth and employment generation. The commitments made at the G20 Cannes Summit promise to gently move policies in the same direction, but much of the narrowing in the short run will come from cyclical factors, including slower aggregate demand growth and moderating commodity prices. Hence, at projected baseline trends, the global imbalances are not expected to widen by any significant margin over the next two years. Should the global economy fall into another recession, the imbalances would narrow further in a deflationary manner.
The imbalances are a risk to global exchange-rate stability The continued build-up of vast net external liability positions of deficit countries are part of a larger topic related to enhanced exchange-rate instability. Mounting external liabilities by the United States, associated in part with increasing fiscal deficits, have in fact been a major factor in the downward pressure on the United States dollar against other major currencies since 2002, although there have been large fluctuations around the trend. Confidence in the dollar is subject to volatility, as perceptions of the sustainability of the United States liability position may easily shift with changes in equity prices in global markets and the credibility of fiscal policy. In the light of events and problems with policy credibility elsewhere, this did not lead to univocal dollar depreciation. In the euro area, the lack of policy direction and
xv
xvi
World Economic Situation and Prospects 2012
coherence in dealing with sovereign debt problems put downward pressure on the euro. On a slightly different tack, but essentially in the same vein, the United Kingdom suffered its own version of a credibility crisis with the continued failure of its central bank to achieve its inflation target. Japan’s earthquake, in turn, triggered a repatriation of private asset holdings for investment in reconstruction works, putting upward pressure on the yen. Global capital flow volatility induced further instability in currency markets. Currency appreciation poses a challenge for many developing countries and some European countries by reducing the competitiveness of their respective export sectors. While domestic demand has been taking on a more significant role as a driver of growth on the back of rising incomes in many of the emerging economies, a forced and premature shift away from an export-led growth model owing to pronounced and sustained currency appreciation might create significant dislocations, especially in labour markets in the form of a spike in unemployment. Stronger currencies help on the import side to reduce inflation, but this advantage could be more than offset by the social cost of higher unemployment rates.
Policy challenges Developed countries face difficult policy dilemmas Overcoming the risks outlined above and reinvigorating the global recovery in a balanced and sustainable manner pose enormous policy challenges. The United States and Europe face the risk of their problems feeding into each other. Recent economic stagnation may make voters and policymakers unwilling to opt for hard choices, and the political paralysis might, in turn, worsen the economy by creating new financial turmoil. In the short term, this so-called no growth or low growth trap takes the form of resistance to emergency measures—for instance, the opposition in some European countries perceived to be more fiscally prudent to bail out what are seen to be more profligate countries; this may force the latter towards more fiscal austerity and induce lower growth and social opposition. Over the longer term, the trap is created by resistance to the higher taxes and reduced benefits believed to be necessary to return countries to financial stability.
Developing countries find themselves in a different bind Developing countries face different dilemmas. On the one hand, they need to protect themselves against volatile commodity prices and external financing conditions, in some cases through more restrictive macroeconomic policies. On the other hand, they need to step up investment to sustain higher growth and reorient their economies towards faster poverty reduction and more sustainable production.
Current policy intentions of the G20 at best provide for a scenario of “muddling through” G20 leaders recognized these concerns to some extent in the Cannes Action Plan and announced a global strategy for growth and jobs. The plan is to address short-term vulnerabilities, while strengthening the medium-term foundations for growth. In essence, however, the Cannes Action Plan does not promise to do much more in the short run than that contained in Government plans enacted during 2011, when macroeconomic policies
Executive Summary
in most developed economies were already characterized by a combination of an extremely loose monetary policy stance and shifts towards fiscal austerity. As the baseline projections show, the Cannes Action Plan would fall short of reinvigorating the world economy and bringing down unemployment. Most hopes seem to be set on strengthening the mediumterm foundations for growth, but in this sense, too, the Cannes Action Plan may already have “fallen behind the curve”, as the downside risks have heightened, complicating the effectiveness of the proposed actions. In order to make the global economic recovery more robust, balanced and sustainable, much more pervasive and better coordinated policy action is needed, especially in terms of short-term stimulus, sovereign debt resolution and orientation towards jobs creation; medium-term plans should focus more strongly on sustainable growth and development and accelerated reforms of financial regulatory systems and the international monetary system.
More short-term fiscal stimulus is needed, not less First, developed countries, in particular, should be cautious not to embark prematurely on fiscal austerity policies given the still fragile state of the recovery and prevailing high levels of unemployment. While high public indebtedness is a concern and has continued to increase in most developed economies—in a number of cases (including the United States) to over 100 per cent of GDP—many developed country Governments still have plenty of fiscal space left for additional stimulus measures. With high unemployment and weak private demand, a premature fiscal tightening may derail the fragile recovery and lead to further worsening, rather than improvement, of fiscal balances. Instead, and contrary to political pressures, the Governments of economies with low financing costs in capital markets should allow automatic stabilizers to operate and sustain or enhance deficit-financed fiscal stimulus in the short run. Further strengthening of financial safety nets will also be needed to stem market uncertainty and the risk of further debt distress. The establishment of Europe’s temporary funding facilities (the European Financial Stability Facility (EFSF) and the European Financial Stabilisation Mechanism (EFSM)), the more permanent European Stability Mechanism (ESM) and related measures have brought some resolve to dealing with Europe’s sovereign debt crisis. However, the continued debt distress and spread of contagion to the larger European economies during the second half of 2011 suggest these measures have not been bold enough. The firepower of the financial safety nets is too limited to cope with the sovereign debt problems of countries like Italy and Spain. While finding ways to significantly enhance the firepower of the ESM will be as important as it is difficult to achieve, debt workout mechanisms should not be restricted to sovereign debts in Europe. Many developed countries, the United States in particular, may face a second round of mortgage crises, as so many mortgages are “under water” and problems are likely to increase with persistent high unemployment and the general weakness in housing markets. Meanwhile, the short-term policy concern for many developing countries will be to prevent rising and volatile food and commodity prices and exchange-rate instability from undermining growth and leading their economies into another boom-bust cycle. These countries would need to ensure that macroeconomic policies are part of a transparent counter-cyclical framework that would include the use of fiscal stabilization funds and strengthened macroprudential financial and capital-account regulation to mitigate the impact of volatile commodity prices and capital inflows.
xvii
xviii
World Economic Situation and Prospects 2012
The stimulus needs to be adequately coordinated internationally The second (and related) challenge is to ensure that additional short-term stimulus by economies with adequate fiscal space is coordinated and consistent with benign global rebalancing. In Europe, instead of the present asymmetric adjustment through recessionary deflation—where most of the pain is concentrated on the countries in debt distress—it would entail a more symmetrical approach of austerity and structural reforms in the countries in distress combined with euro area-wide reflation. The United States would equally need to consider such a sequenced approach. The first priority should be to boost demand in order to reduce unemployment, especially through public investment and more direct job creation. This would help households delever and boost consumption demand through income growth. Infrastructure investment and other structural measures would underpin strengthened export competitiveness over the medium run, giving time for China and other Asian economies to rebalance towards greater reliance on domestic demand growth. To achieve such benign global rebalancing with accelerated jobs recovery seems feasible. Simulations with the United Nations Global Policy Model—reflecting the key policy directions suggested above and those below regarding coordinated short-term global stimulus, orderly sovereign debt workouts and structural policies aimed at stronger job creation and sustainable development—show that this would be a win-win scenario for all economies, as it would significantly enhance GDP and employment growth compared with the baseline, while reducing public debt-to-GDP ratios and requiring limited exchange-rate realignment. Global output growth would accelerate to over 4 per cent per year during the period 2012-2015, especially since developed economies would be lifted from their anaemic growth, while developing countries would also reach a higher growth path compared with the baseline situation, where policy coordination is absent. Most importantly, employment rates, especially among developed countries, would recover to near pre-crisis levels and, by and large, undo the deficit of 64 million jobs left by the global crisis of 2008-2009.
Redesigning macroeconomic policies for job growth and sustainable development The third challenge will be to redesign fiscal policy—and economic policies more broadly—in order to strengthen its impact on employment and aid in its transition from purely a demand stimulus to one that promotes structural change for more sustainable economic growth. Thus far, stimulus packages in developed countries have mostly focused on income support measures, with tax-related measures accounting for more than half of the stimulus provided. In many developing countries, such as Argentina, China and the Republic of Korea, in contrast, infrastructure investment tended to make up the larger share of the stimulus and strengthened supply-side conditions. The optimal mix of supporting demand directly through taxes or income subsidies or indirectly through strengthening supply-side conditions, including by investing in infrastructure and new technologies, may vary across countries, but in most contexts, direct Government spending tends to generate stronger employment effects.
Addressing international financial market, commodity price and exchange-rate volatility The fourth challenge is to find greater synergy between fiscal and monetary stimulus, while counteracting damaging international spillover effects in the form of increased exchangerate tensions and volatile short-term capital flows. This will require reaching agreement at
Executive Summary
the international level on the magnitude, speed and timing of quantitative easing policies within a broader framework of targets to redress the global imbalances. This, in turn, will require stronger bilateral and multilateral surveillance, including through more thorough assessment of spillover effects and systemic risks. In addition, such cooperative policy solutions should comprise deeper reforms of (international) financial regulation, including those for addressing risks outside the traditional banking system. These would need to be complemented by deeper reforms of the global reserve system that would reduce dependence on the dollar as the major reserve currency, including through better international pooling of reserves. The sovereign debt crisis in Europe has emphasized the need for much stronger internationally coordinated financial safety nets. This could be achieved through reinforcing International Monetary Fund (IMF) resources and closer cooperation between the IMF and regional mechanisms of financial cooperation (not just in Europe, but also those in Asia, Africa and Latin America), as well as through enhancing the role of Special Drawing Rights (SDRs) as international liquidity.
More development financing is needed to support the achievement of sustainable development goals The fifth challenge is to ensure that sufficient resources are made available to developing countries, especially those possessing limited fiscal space and facing large development needs. These resources will be needed to accelerate progress towards the achievement of the Millennium Development Goals (MDGs) and for investments in sustainable and resilient growth, especially for the LDCs. Apart from delivering on existing aid commitments, donor countries should consider mechanisms to delink aid flows from their business cycles so as to prevent delivery shortfalls in times of crisis, when the need for development aid is at its most urgent.
xix
xxi
Contents
I
II
Executive Summary......................................................................................................................................................................................
v
Contents...............................................................................................................................................................................................................
xxi
Explanatory Notes..........................................................................................................................................................................................
xxv
Global economic outlook................................................................................................................................
1
Prospects for the world economy in 2012-2013......................................................................................................................... Faltering growth......................................................................................................................................................................... Unemployment—a key policy concern..................................................................................................................... Benign inflation outlook....................................................................................................................................................... The international economic environment for developing countries and the economies in transition...................................................................................................... Increased volatility in private capital flows................................................................................................................ Continued volatility in commodity prices................................................................................................................. Moderating world trade growth...................................................................................................................................... Uncertainties and risks................................................................................................................................................................................ Risks of another global recession.................................................................................................................................... Uncertainties associated with the global imbalances and heightened exchange-rate volatility................................................................................................................ Policy challenges............................................................................................................................................................................................ Stronger macroeconomic stimulus… ........................................................................................................................ …that is adequately coordinated internationally................................................................................................. Redesigning macroeconomic policies for jobs growth and sustainable development............... Addressing international financial market, commodity price and exchange-rate volatility...... Adequate development financing................................................................................................................................. Appendix.............................................................................................................................................................................................................
1 2 9 11
International trade...........................................................................................................................................
41
Slowing merchandise trade..................................................................................................................................................................... Shifting patterns of merchandise trade........................................................................................................................................... Volatile terms of trade................................................................................................................................................................................. Unstable commodity markets................................................................................................................................................................ Food and agricultural commodities.............................................................................................................................. Minerals, ores and metals..................................................................................................................................................... The oil market.............................................................................................................................................................................. Growing trade in services.......................................................................................................................................................................... Growing trade in transport services.............................................................................................................................. Trade policy developments..................................................................................................................................................................... The Doha Round........................................................................................................................................................................ The continued threat of protectionism....................................................................................................................... Appendix.............................................................................................................................................................................................................
41 42 47 50 51 53 54 57 60 62 62 63 65
13 13 15 16 17 17 19 25 27 32 36 37 38 39
xxii
World Economic Situation and Prospects 2012
III
IV
International finance for development.........................................................................................................
67
Private capital flows and macroeconomic imbalances.......................................................................................................... Trends in private capital flows........................................................................................................................................... International reserves and the problem of the global imbalances................................................................................. Net financial transfers.................................................................................................................................................................................. Capital-account management............................................................................................................................................................... International financial reform................................................................................................................................................................. Progress in reforming international financial regulation.................................................................................. Global liquidity mechanisms: current debates and the need for further reform................................................... International development cooperation and official flows................................................................................................. Official development assistance...................................................................................................................................... South-South cooperation.................................................................................................................................................... Innovative sources of finance............................................................................................................................................ Developing country debt relief........................................................................................................................................
67 68 73 74 76 80 81 84 86 86 89 90 91
Regional developments and outlook............................................................................................................
95
Developed market economies: recovery weakens with ominous overtones.......................................................... North America.................................................................................................................................................................................................. United States of America: growth decelerating and dangers from fiscal impasse.......................... Canada: facing increasing headwinds.......................................................................................................................... Developed Asia and the Pacific............................................................................................................................................................. Japan: earthquake recovery, but one threatened by slowing global demand.................................. Australia: recovering from record flooding............................................................................................................... New Zealand: earthquake reconstruction boosts growth.............................................................................. Europe................................................................................................................................................................................................................... Western Europe: sharply slowing growth as the debt crisis grips the region..................................... The new EU members: dangers from a weakening in the rest of the EU.............................................. Economies in transition.............................................................................................................................................................................. South-Eastern Europe: an already slow recovery threatened by euro area troubles...................... The Commonwealth of Independent States: recovery continues, but risks increase.................... Developing economies.............................................................................................................................................................................. Africa: growth remains on a high, but uneven and uncertain path.......................................................... East Asia: growth drivers lose momentum................................................................................................................ South Asia: robust domestic demand drives growth......................................................................................... Western Asia: growth trajectories shaken by political unrest........................................................................ Latin America and the Caribbean: robust but uneven recovery.................................................................
95 95 95 98 99 99 100 100 101 101 104 107 107 109 112 113 117 120 122 125
Statistical annex Country classification................................................................................................................................................................................... Annex tables......................................................................................................................................................................................................
131 141
Contents
xxiii
Boxes I. 1 I. 2 I. 3 I. 4 II. 1 II. 2 II. 3 IV. 1 IV. 2
Key assumptions for the United Nations baseline forecast for 2012 and 2013....................................................... Prospects for the least developed countries................................................................................................................................. A “J-curved” fiscal adjustment?............................................................................................................................................................... A coordinated strategy for jobs and growth................................................................................................................................. Maritime transportation underpinning the growing role of the South in world trade..................................... Commodity market volatility and financialization reaches the international policy agenda......................... International tourism................................................................................................................................................................................... The impact of the appreciation of the Swiss franc on the economies of Eastern Europe............................... Drought in the Horn of Africa takes a heavy human and economic toll....................................................................
3 8 30 33 44 52 59 106 114
Figures I. I. I. I.
1 2 3 4
I. 5 I. 6 I. 7 I. 8 I. 9 I.10 I.11 I.12 I.13 II. II. II. II. II. II. II. II. II.
1 2 3 4 5 6 7 8 9
Growth of world gross product, 2006-2013.................................................................................................................................. Growth of GDP per capita, by level of development, 2000-2013..................................................................................... Long-term unemployment in developed and developing countries, 2009 and 2011...................................... Post-recession employment recovery in the United States, euro area and developed economies, 2007 (Q1)-2011 (Q2) and projections for 2011 (Q3)-2015 (Q4).................................. Net capital flows to developing countries, 2000-2012........................................................................................................... Daily yield spreads on emerging market bonds, January 2010-October 2011....................................................... International oil and food prices, January 2000-October 2011......................................................................................... World merchandise exports, by volume, January 2006-August 2011........................................................................... Global imbalances, 1996-2013............................................................................................................................................................... Exchange rates of major reserve currencies vis-à-vis the United States dollar, 2 January 2008-10 November 2011................................................................................................... Exchange rates of selected currencies vis-à-vis the United States dollar, 2 January 2008-10 November 2011..................................................................................................... Growing public debt burdens................................................................................................................................................................ Yields on two-year sovereign bonds in developed countries, January 2010-November 2011............................................................................................................................................................ Below-trend growth of world merchandise trade, 2002-2013.......................................................................................... Diverging trends in world import growth, 2002-2013............................................................................................................ Gains and losses in world market shares of merchandise trade....................................................................................... Developed (North) and developing (South) economies, bilateral shares in world exports, 1995 and 2010..................................................................................................................... Shifting total trade market shares in Asia, 2002-2010............................................................................................................. Barter terms of trade of selected groups of countries, by export structure, 2000-2013.................................... Trade shocks by region and export specialization, 2001-2013.......................................................................................... Total non-oil commodity price index, 2000-2011...................................................................................................................... Price indices of commodity groups, January 2000- September 2011..........................................................................
5 7 10 12 13 14 16 17 21 23 24 28 29 41 42 43 44 47 48 49 50 53
xxiv
World Economic Situation and Prospects 2012
II.10 Price indices of non-ferrous metals, January 2007-September 2011............................................................................. II.11 Oil prices.............................................................................................................................................................................................................. II.12 International trade in services................................................................................................................................................................ III. 1A Net transfers of financial resources to developing economies and economies in transition, 1999-2011....................................................................................................................................... III. 1B Net financial transfers, by income category, 2001-2011........................................................................................................ III. 2 European bank wholesale term funding, debt securities issued by bank sector borrowers, January-October 2011.................................................................................................. III. 3 ODA growth rate per annum, 2000-2013....................................................................................................................................... III. 4 EU-15 ODA growth rate per annum, 2009-2010......................................................................................................................... III. 5 External debt service-to-exports ratio, 2005-2010.................................................................................................................... IV. 1 Unemployment rate and hourly earnings in the United States, January 1990-October 2011...................... IV. 2 Index for Japanese export volume, January 2009-September 2011.............................................................................. IV. 3 GDP, industrial production and industrial confidence in the euro area, first quarter 2005-third quarter 2011......................................................................................................... IV. 4 Currency composition of outstanding loans in Croatia, 2002-2011............................................................................... IV. 5 The general slowdown in GDP growth rates in the Commonwealth of Independent States and Georgia.......................................................................................................... IV. 6 GDP growth rates in selected East Asian economies, 2011-2012.................................................................................... IV. 7 Central Government deficits in selected South Asian countries, fiscal years 2009-2011.................................. IV. 8 Diverging GDP growth trajectories in Western Asia, 2000-2013....................................................................................... IV. 9 Growth forecast for Latin America and the Caribbean, 2012..............................................................................................
54 56 58 75 75 80 87 88 91 96 99 102 109 110 117 122 123 126
Tables I. 1 I. 2 II. 1 II. 2 III. 1 III. 2 III. 3
Growth of world output, 2005-2013.................................................................................................................................................. A downside scenario for the world economy.............................................................................................................................. Rankings of top developing countries and economies in transition in trade in services, 2006-2010................................................................................................................................ Maritime sectors, comparison................................................................................................................................................................ Net financial flows to developing countries and economies in transition, 1998-2012...................................... Net transfers of financial resources to developing economies and economies in transition, 1999-2011....................................................................................................................................... Selected capital account regulations taken by developing countries (since 2009).............................................
4 20 61 62 69 76 77
Contents
xxv
Explanatory Notes The following symbols have been used in the tables throughout the report: ..
Two dots indicate that data are not available or are not separately reported.
–
A dash indicates that the amount is nil or negligible.
-
A hyphen indicates that the item is not applicable.
−
A minus sign indicates deficit or decrease, except as indicated.
.
A full stop is used to indicate decimals.
/
A slash between years indicates a crop year or financial year, for example, 2010/11.
-
Use of a hyphen between years, for example, 2010-2011, signifies the full period involved, including the beginning and end years.
Reference to “dollars” ($) indicates United States dollars, unless otherwise stated. Reference to “billions” indicates one thousand million. Reference to “tons” indicates metric tons, unless otherwise stated. Annual rates of growth or change, unless otherwise stated, refer to annual compound rates. Details and percentages in tables do not necessarily add to totals, because of rounding. Project LINK is an international collaborative research group for econometric modelling, jointly coordinated by the Development Policy and Analysis Division of the United Nations Secretariat and the University of Toronto. For country classifications, see statistical annex. Data presented in this publication incorporate information available as at 30 November 2011.
xxvi
World Economic Situation and Prospects 2012
The following abbreviations have been used: AfDB APT ADB ASEAN BIS BRICS CDB CIS CPB CPI DAC
DCF DSA EBRD ECA ECB ECE ECLAC EFSF EFSM ESM EU EURIBOR FAO FDI Fed FSB GATT G8 G20 GCC GDP GHG GNI G-SIFIs HICP HIPC IaDB
African Development Bank ASEAN plus Three Asian Development Bank Association of Southeast Asian Nations Bank for International Settlements Brazil, the Russian Federation, India, China and South Africa Caribbean Development Bank Commonwealth of Independent States Central Planning Bureau of the Netherlands consumer price index Development Assistance Committee (of the Organization for Economic Cooperation and Development) Development Cooperation Forum (of the United Nations) Debt sustainability analysis (of the International Monetary Fund) European Bank for Reconstruction and Development Economic Commission for Africa European Central Bank Economic Commission for Europe Economic Commission for Latin America European Financial Stability Facility European Financial Stabilisation Mechanism European Stability Mechanism European Union Euro Interbank Offered Rate Food and Agriculture Organization of the United Nations foreign direct investment United States Federal Reserve Financial Stability Board General Agreement on Tariffs and Trade Group of Eight Group of Twenty Gulf Cooperation Council gross domestic product greenhouse gas gross national income globally systemically important financial institutions Harmonised Index of Consumer Prices heavily indebted poor countries Inter-American Development Bank
IBRD
International Bank for Reconstruction and Development IDA International Development Association IEA International Energy Agency IFAD International Fund for Agricultural Development ILO International Labour Organization IMF International Monetary Fund LDCs least developed countries LLDCs landlocked developing countries MAP Mutual Assessment Process mbd millions of barrels per day MDGs Millennium Development Goals MDRI Multilateral Debt Relief Initiative MFN most favoured nation NTMs non-tariff measures ODA official development assistance OECD Organization for Economic Cooperation and Development OPEC Organization of the Petroleum Exporting Countries pb per barrel PLL Precautionary and Liquidity Line PPP purchasing power parity RTAs regional and bilateral trade agreements SDRs Special Drawing Rights SGP Stability and Growth Pact SIDS small island developing States SIFIs systemically important financial institutions TEUs twenty-foot equivalent units UN/DESA Department of Economic and Social Affairs of the United Nations Secretariat UN Comtrade United Nations Commodity Trade Statistics Database (of the United Nations) UNCTAD United Nations Conference on Trade and Development UNFCCC United Nations Framework Convention on Climate Change UNICEF United Nations Children’s Fund UNFPA United Nations Population Fund UNWTO World Tourism Organization WEFM World Economic Forecasting Model (of the United Nations) WEVUM World Economic Vulnerability Monitor (of the United Nations) WFP World Food Programme WGP world gross product WTO World Trade Organization
1
Chapter I
Global economic outlook Prospects for the world economy in 2012-2013 Following two years of anaemic and uneven recovery from the global financial crisis, the world economy is teetering on the brink of another major downturn. Output growth has already slowed considerably during 2011, especially in the developed countries. The baseline forecast foresees continued anaemic growth during 2012 and 2013. Such growth is far from sufficient to deal with the continued jobs crises in most developed economies and will drag down income growth in developing countries. Even this sombre outlook may be too optimistic. A serious, renewed global downturn is looming because of persistent weaknesses in the major developed economies related to problems left unresolved in the aftermath of the Great Recession of 2008-2009. The problems stalking the global economy are multiple and interconnected. The most pressing challenges are the continued jobs crisis and the declining prospects for economic growth, especially in the developed countries. As unemployment remains high, at nearly 9 per cent, and incomes stagnate, the recovery is stalling in the short run because of the lack of aggregate demand. But, as more and more workers remain out of a job for a long period, especially young workers, medium-term growth prospects also suffer because of the detrimental effect on workers’ skills and experience. The rapidly cooling economy is both a cause and an effect of the sovereign debt crises in the euro area, and of fiscal problems elsewhere. The sovereign debt crises in a number of European countries worsened in the second half of 2011 and aggravated the weaknesses in the balance sheets of banks sitting on related assets. Even bold steps by the Governments of the euro area countries to reach an orderly sovereign debt workout for Greece were met with continued financial market turbulence and heightened concerns of debt default in some of the larger economies in the euro zone, Italy in particular. The fiscal austerity measures taken in response are further weakening growth and employment prospects, making fiscal adjustment and the repair of financial sector balance sheets all the more challenging. The United States economy is also facing persistent high unemployment, shaken consumer and business confidence, and financial sector fragility. The European Union (EU) and the United States of America form the two largest economies in the world, and they are deeply intertwined. Their problems could easily feed into each other and spread to another global recession. Developing countries, which had rebounded strongly from the global recession of 2009, would be hit through trade and financial channels. The financial turmoil following the August 2011 political wrangling in the United States regarding the debt ceiling and the deepening of the euro zone debt crisis also caused a contagious sell-off in equity markets in several major developing countries, leading to sudden withdrawals of capital and pressure on their currencies. Political divides over how to tackle these problems are impeding needed, much stronger policy action, further eroding the already shattered confidence of business and consumers. Such divides have also complicated international policy coordination. Nonetheless, as the problems are deeply intertwined, the only way for policymakers to save the global economy from falling into a dangerous downward spiral is to take concerted action, giving greater priority to revitalizing the recovery in output and employment in the short run in order to pave more solid ground for enacting the structural reforms required for sustainable and balanced growth over the medium and long run.
The world economy is on the brink of another recession
The problems are multiple and interconnected
Policy paralysis has become a major stumbling block
2
World Economic Situation and Prospects 2012
Faltering growth
Global output growth is slowing and risks for a double-dip recession have heightened
Developing country growth remains strong, but is decelerating…
…because of the economic problems in developed countries
Surrounded by great uncertainties, the United Nations baseline forecast is premised on a set of relatively optimistic conditions, including the assumptions that the sovereign debt crisis in Europe will, in effect, be contained within one or just a few small economies, and that those debt problems can be worked out in more or less orderly fashion. As indicated in box I.1, it further assumes that monetary policies among major developed countries will remain accommodative, while the shift to fiscal austerity in most of them will continue as planned but not move to deeper cuts. The baseline also assumes that key commodity prices will fall somewhat from current levels, while exchange rates among major currencies will fluctuate around present levels without becoming disruptive. In this scenario, which could be deemed one of “muddling through”, growth of world gross product (WGP) is forecast to reach 2.6 per cent in the baseline outlook for 2012 and 3.2 per cent for 2013. This entails a significant downgrade (by one percentage point) from the United Nations baseline forecast of mid-20111 but is in line with the pessimistic scenario laid out at the end of 2010.2 The deceleration was already visible in 2011 when the global economy expanded by an estimated 2.8 per cent, down from 4.0 per cent in 2010 (table I.1 and figure I.1). The risks for a double-dip recession have heightened. As discussed in the section on the downside risks below, in accordance with a more pessimistic scenario—including a disorderly sovereign debt default in Europe and more fiscal austerity—developed countries would enter into a renewed recession and the global economy would come to a near standstill (see table I.2 below). More benign outcomes for employment and sustainable growth worldwide would require much more forceful and internationally concerted action than that embodied in current policy stances. The feasibility of such an optimistic scenario, which would push up global output growth to about 4.0 per cent, is discussed in box I.4 and in the section on policy challenges. Developing countries and economies in transition are expected to continue to stoke the engine of the world economy, growing on average by 5.6 per cent in 2012 and 5.9 per cent in 2013 in the baseline outlook. This is well below the pace of 7.5 per cent achieved in 2010, when output growth among the larger emerging economies in Asia and Latin America, such as Brazil, China and India, had been particularly robust. Even as economic ties among developing countries strengthen, they remain vulnerable to economic conditions in the developed economies. From the second quarter of 2011, economic growth in most developing countries and economies in transition started to slow notably to a pace of 5.9 per cent for the year. Initially, this was the result, in part, of macroeconomic policy tightening in attempts to curb emerging asset price bubbles and accelerating inflation, which in turn were fanned by high capital inflows and rising global commodity prices. From mid-2011 onwards, growth moderated further with weaker external demand from developed countries, declining primary commodity prices and some capital flow reversals. While the latter two conditions might seem to have eased some of the macroeconomic policy challenges earlier in the year, amidst increased uncertainty and volatility, they have in fact complicated matters and have been detrimental to investment and growth. The economic woes in many developed economies are a major factor behind the slowdown in developing countries. Economic growth in developed countries has already 1
See United Nations, World economic situation and prospects as of mid-2011 (E/2011/113), available from http://www.un.org/en/development/desa/policy/wesp/wesp_current/2011wespupdate.pdf. 2 See World Economic Situation and Prospects 2011 (United Nations publication, Sales No. E.11. II.C.2), pp. 34-35, available from http://www.un.org/en/development/desa/policy/wesp/wesp_ current/2011wesp.pdf.
3
Global economic outlook
Box I.1 Key assumptions for the United Nations baseline forecast for 2012 and 2013 The forecast presented in the text is based on estimates calculated using the United Nations World Economic Forecasting Model (WEFM) and is informed by country-specific economic outlooks provided by participants in Project LINK, a network of institutions and researchers supported by the Department of Economic and Social Affairs of the United Nations. The provisional individual country forecasts submitted by country experts are adjusted based on harmonized global assumptions and the imposition of global consistency rules (especially for trade flows, measured in both volume and value) set by the WEFM. The main global assumptions are discussed below and form the core of the baseline forecast—the scenario that is assigned the highest probability of occurrence. Alternative scenarios are presented in the sections on “risks and uncertainties” and “policy challenges”. Those scenarios are normally assigned lower probability than the baseline forecast, but in the present volatile and uncertain economic context, the pessimistic scenario presented in the “risks and uncertainties” section should be assigned a probability at least as high as that of the baseline. Background to the baseline assumptions It is assumed that within the span of the forecasting period, the sovereign debt crisis in Europe will be contained and that adequate measures will be taken to avert a liquidity crisis that could lead to major bank insolvencies and a renewed credit crunch. These measures include an orderly restructuring of Greek debt, some degree of bank recapitalization and a strengthening of the European Financial Stability Facility (EFSF) so that markets perceive that there is sufficient firepower to handle a possible default by one of the larger member countries. The recently announced package agreed on at the summit meeting of euro area leaders in October, if fully implemented, covers, albeit imperfectly, most of these issues. In addition, it is assumed that the plans announced for fiscal consolidation and restructuring will be implemented in the crisis-affected countries. In the United States, it is assumed that either the Joint Select Committee on Deficit Reduction would come to an agreement on a package to cut $1.2 trillion in Government spending over the next 10 years or, in case of no agreement, that the contingency plan for a similar sized annual budget reduction of $120 billion would come into effect (see also note 3). More broadly, the planned macroeconomic policies of major economies for the short run (2012-2013), as also reflected in the Cannes Action Plan for Growth and Jobs adopted on 4 November 2011 by the leaders of the Group of Twenty (G20), are all assumed to be followed through in the baseline scenario. Monetary and fiscal policy assumptions for major economies The Federal Reserve Bank of the United States (Fed) is assumed to keep the federal funds interest rate at its current low level of between 0.0 and 0.25 per cent until the end of 2013. The Fed will implement the planned swap of its holdings of $400 billion in short-term Treasury Bills for long-term Government bonds, and will also reinvest the receipts of maturing assets, so as to maintain the size of its current asset holdings. The European Central Bank (ECB) is assumed to make another 25 basis-point cut in its main policy rate by the end of the year, bringing the minimum bid rate back down to 1.0 per cent. The ECB is expected to continue to provide liquidity to banks through a number of facilities, such as refinancing operations of various term-lengths and purchasing sovereign bonds under the Securities Markets Programme (SMP). The Bank of Japan (BoJ) is assumed to keep its main policy interest rate at 0.05 per cent and to continue to use its balance sheet to manage liquidity—through the Asset Purchase Program (APP)—to buy risk assets, such as commercial paper and corporate bonds, in addition to Government bonds and bills. The BoJ is also assumed to continue to intervene in foreign exchange markets to stabilize the value of the yen. In major emerging economies, the People’s Bank of China (PBC) is expected to keep its monetary tightening on hold, based on a contingent assumption that inflation in the economy will start to moderate. In terms of fiscal policy, it is assumed that in the United States only the items for the payroll tax cut and emergency unemployment compensation of the proposed American Jobs Act will be enacted and that long-term deficit-reduction actions will come into effect from January 2013.
4
World Economic Situation and Prospects 2012
Box I.1 (cont’d) In the euro area, as well as in most economies in Western Europe, it is assumed that the plans announced for fiscal consolidation will be fully implemented. In Japan, the total size of the five-year post-earthquake reconstruction plan is estimated to cost ¥19 trillion, or 4 per cent of GDP, to be financed mostly by increases in taxes. In China, the fiscal stance is expected to remain “proactive”, with increased spending on education, health care and social programmes. Exchange rates among major currencies It is assumed that the euro will fluctuate around a yearly average of $1.36 in 2012 and 2013, implying a depreciation of 2.5 per cent from its 2011 level. The Japanese yen is assumed to average about ¥78 to the dollar for the rest of the forecast period, representing an appreciation of 2.4 per cent in 2012 compared with the average exchange rate in 2011; during 2011, the yen had already appreciated by 8.9 per cent. The Chinese renminbi is assumed to average CN¥ 6.20 per United States dollar in 2012 and CN¥ 6.02 in 2013, appreciating by 3.9 and 2.9 per cent, respectively. Oil prices Brent oil prices are assumed to average about $100 per barrel (pb) during both 2012 and 2013, down from $107 pb in 2011.
Table I.1 Growth of world output, 2005-2013 Annual percentage change
World Developed economies United States of America Japan European Union EU-15 New EU members Euro area Other European countries Other developed countries Economies in transition South-Eastern Europe Commonwealth of Independent States and Georgia Russian Federation Developing economies Africa North Africa Sub-Saharan Africa Nigeria South Africa Others East and South Asia East Asia China South Asia India
Change from June 2011 forecast d
20052008a
2009
2010b
2011c
2012c
2013c
2011
2012
3.3
-2.4
4.0
2.8
2.6
3.2
-0.5
-1.0
1.9 1.8 1.3 2.2 2.0 5.4 2.0 2.6 2.6 7.1 5.0
-4.0 -3.5 -6.3 -4.3 -4.3 -3.7 -4.3 -1.9 -1.0 -6.6 -3.7
2.7 3.0 4.0 2.0 1.9 2.3 1.9 1.5 2.9 4.1 0.6
1.3 1.7 -0.5 1.6 1.5 2.9 1.5 1.0 1.4 4.1 1.7
1.3 1.5 2.0 0.7 0.5 2.6 0.4 1.1 2.2 3.9 2.3
1.9 2.0 2.0 1.7 1.6 3.1 1.3 1.6 2.5 4.1 3.2
-0.7 -0.9 -1.2 -0.1 -0.2 -0.2 -0.1 -1.0 -1.4 -0.3 -0.5
-1.1 -1.3 -0.8 -1.2 -1.2 -1.4 -1.2 -0.9 -0.5 -0.7 -0.8
7.3 7.1 6.9 5.4 5.0 5.9 4.6 5.0 6.7 8.3 8.5 11.9 7.8 9.0
-6.9 -7.8 2.4 0.8 3.2 1.7 -8.3 -1.7 3.6 5.2 5.1 9.2 5.5 7.0
4.5 4.0 7.5 3.9 4.0 4.8 2.8 2.8 5.1 8.8 9.2 10.4 7.2 9.0
4.3 4.0 6.0 2.7 -0.5 4.4 6.3 3.1 4.8 7.1 7.2 9.3 6.5 7.6
4.0 3.9 5.6 5.0 4.7 5.3 6.8 3.7 5.8 6.8 6.9 8.7 6.7 7.7
4.2 4.0 5.9 5.1 5.5 5.0 7.0 3.5 5.3 6.9 6.9 8.5 6.9 7.9
-0.3 -0.4 -0.2 -0.9 -1.2 -0.5 0.6 -0.6 -1.1 -0.1 -0.1 0.2 -0.4 -0.5
-0.8 -0.7 -0.6 -0.4 -0.3 -0.2 0.5 -1.1 0.1 -0.4 -0.3 -0.2 -0.3 -0.5
5
Global economic outlook
Table I.1 (cont’d)
Western Asia Latin America and the Caribbean South America Brazil Mexico and Central America Mexico Caribbean By level of development High-income countries Upper middle income countries Lower middle income countries Low-income countries Least developed countries
Change from June 2011 forecastd
20052008a
2009
2010b
2011c
2012c
2013c
2011
2012
5.4 5.0 5.6 4.6 3.5 3.2 7.1
-0.9 -2.1 -0.4 -0.6 -5.7 -6.3 0.9
6.3 6.0 6.4 7.5 5.6 5.8 3.5
6.6 4.3 4.6 3.7 3.8 3.8 3.4
3.7 3.3 3.6 2.7 2.7 2.5 3.6
4.3 4.2 4.5 3.8 3.6 3.6 4.3
0.8 -0.2 -0.4 -1.4 0.0 0.1 -0.6
-0.5 -1.6 -1.6 -2.6 -1.6 -1.8 -1.1
2.1 7.5 7.0 6.2 7.8
-3.7 1.2 4.3 4.8 5.2
3.0 7.3 6.8 6.1 5.6
1.6 6.1 5.9 5.7 4.9
1.5 5.5 6.4 6.0 6.0
2.0 6.0 6.6 5.9 5.7
-0.7
0.2
6.8
-9.9
12.8
6.6
4.4
5.7
-0.5
-2.4
4.4
-0.9
4.9
3.7
3.6
4.1
-0.4
-0.8
Memorandum items World tradee World output growth with PPP-based weights
Source: UN/DESA. a Average percentage change. b Actual or most recent estimates. c Forecasts, based in part on Project LINK and baseline projections of the UN/DESA World Economic Forecasting Model. d See United Nations, World economic situation and prospects as of mid-2011 (E/2011/113). e Includes goods and services.
Figure I.1 Growth of world gross product, 2006-2013 5
Percentage 4.1
4
4.0
4.0
Optimistic scenario
4.0 3.2 rio ena
3.9 2.8
3
2.6
Pe
sc
2.2
m ssi
2
line
Base
ist
1.5
ic s ari
n ce
1
o
0.5
0 -1 -2 -2.4
-3 2006
2007
2008
2009
2010
2011a
2012b
2013b
Sources: UN/DESA and Project LINK. Note: See box I.1 for assumptions underlying the baseline forecasts, section on “Risks and uncertainties” for assumptions for the pessimistic scenario and box I.4 for the optimistic scenario. a Estimates. b United Nations forecasts.
6
World Economic Situation and Prospects 2012
Developed countries suffer from predicaments lingering from the global financial crisis
slowed to 1.3 per cent in 2011, down from 2.7 per cent in 2010, and is expected to remain anaemic in the baseline outlook, at 1.3 per cent in 2012 and 1.9 per cent in 2013. At this pace, output gaps are expected to remain significant and unemployment rates will stay high. Most developed economies are suffering from predicaments lingering from the global financial crisis. Banks and households are still in the process of a deleveraging which is holding back credit supplies. Budget deficits have widened and public debt has mounted, foremost because of the deep downturn and, to a much lesser extent, because of the fiscal stimulus. Monetary policies remain accommodative with the use of various unconventional measures, but have lost their effectiveness owing to continued financial sector fragility and persistent high unemployment which is holding back consumer and investment demand. Concerns over high levels of public debt have led Governments to shift to fiscal austerity, which is further depressing aggregate demand. Growth in the United States slowed notably in the first half of 2011. Despite a mild rebound in the third quarter of the year, gross domestic product (GDP) is expected to weaken further in 2012 and even a mild contraction is possible during part of the year under the baseline assumptions. While, if enacted in full, the American Jobs Act proposed by the Government could have provided some stimulus to job creation, it would not have been sufficient to prevent further economic slowdown, as fiscal stimulus has already faded overall with many job losses caused by cuts in state-level budgets. Even as the total public debt of the United States has risen to over 100 per cent of GDP, yields on long-term Government bonds remain at record lows. This would make stronger fiscal stimulus affordable, but politically difficult to enact in a context where fiscal prudence is favoured and where the country has already been on the verge of defaulting on its debt obligations in August of 2011 because of political deadlock over raising the ceiling on the level of federal public debt. Failure by the congressional Joint Select Committee on Deficit Reduction to reach agreement in November of 2011 on fiscal consolidation plans for the medium term has added further uncertainty.3 The uncertain prospects are exacerbating the fragility of the financial sector, causing lending to businesses and consumers to remain anaemic. Persistent high unemployment, at a rate of 8.6 per cent, and low wage growth are further holding back aggregate demand and, together with the prospect of prolonged depressed housing prices, have heightened risks of a new wave of home foreclosures. Growth in the euro area has slowed considerably since the beginning of 2011, and the collapse in confidence evidenced by a wide variety of leading indicators and measures of economic sentiment suggest a further slowing ahead, perhaps to stagnation by the end of 2011 and into early 2012. Even under the optimistic assumption that the debt crises can be contained within a few countries, growth is expected to be only marginally positive in the euro area in 2012, with the largest regional economies dangerously close to renewed downturns and the debt-ridden economies in the periphery either in or very close to a protracted recession. 3
When the debt ceiling was lifted in August 2011, it was agreed that a bipartisan “supercommittee” try to reach agreement, before the end of November, on reducing the Federal budget deficit by $1.2 trillion over the medium run. The committee failed to do so, triggering an agreed back-up plan according to which the United States Government would enact spending cuts to the tune of $110 billion in each fiscal year from 2013 to 2021. This failure to reach an agreement in Congress does not alter the baseline scenario for this report. However, it has heightened the downside risks, in particular with regard to what will happen with regard to two stimulus measures expiring on 1 January 2012, namely, the 2 per cent payroll tax cut and emergency unemployment insurance benefits. At the time of writing, it is still possible for Congress to extend these measures. Should that not occur, it would affect the 2012 baseline projection for GDP growth in the United States, lowering it by an estimated 0.6 percentage points. It would further erode consumer and investor confidence and increase the risk of the downside scenario’s materializing.
7
Global economic outlook
Japan was in another recession in the first half of 2011, resulting largely, but not exclusively, from the disasters caused by the March earthquake. While post-quake reconstruction is expected to lift GDP growth in Japan to about 2 per cent per year, which is above its long-term trend, in the coming two years, risks remain on the downside, emanating from the challenges of financing the reconstruction and coping with a possible, more pronounced and synchronized downturn along with other major developed economies. As indicated above, developing countries are expected to be further affected by the economic woes in developed countries through trade and financial channels. Among the major developing countries, China’s and India’s GDP growth is expected to remain robust, but to decelerate. In China, growth slowed from 10.4 per cent in 2010 to 9.3 per cent in 2011 and is projected to slow further to below 9 per cent in 2012-2013. India’s economy is expected to expand by between 7.7 and 7.9 per cent in 2012-2013, down from 9.0 per cent in 2010. Brazil and Mexico are expected to suffer more visible economic slowdowns. Output growth in Brazil was already halved, to 3.7 per cent, in 2011, after a strong recovery of 7.5 per cent in 2010, and is expected to cool further to a 2.7 per cent growth in 2012. Growth of the Mexican economy slowed to 3.8 per cent in 2011 (down from 5.8 per cent in 2010), and is anticipated to decelerate further, to 2.5 per cent, in the baseline scenario for 2012. Low-income countries have also seen a slowdown, albeit a mild one. In per capita terms, income growth slowed from 3.8 per cent in 2010 to 3.5 per cent in 2011, but despite the global slowdown, the poorer countries may see average income growth at or slightly above this rate in 2012 and 2013 (see figure I.2). The same holds for average growth among the United Nations category of the least developed countries (LDCs). Nonetheless, growth is expected to remain below potential in most of these economies. In 2011 and 2012, per capita income growth is expected to reach between 2.0 and 2.5 per cent, well below the annual average of 5.0 per cent reached in 2004-2007. Despite
Growth in LDCs is below potential, but strengthening mildly
Figure I.2 Growth of GDP per capita, by level of development, 2000-2013 10
Percentage High-income countries Upper middle income countries
8
Lower middle income countries
6
Low-income countries Least developed countries
4 2 0 -2 -4 -6 2000
2001
2002
2003
2004
2005
2006
2007
2008
2009
2010
2011a
2012b
2013b
Sources: UN/DESA and Project LINK. a Estimates. b United Nations forecasts.
8
World Economic Situation and Prospects 2012
the high vulnerability of most LDCs to commodity price shocks, they tend to be less exposed to financial shocks, and mild growth in official development assistance (ODA) has provided them with a cushion against the global slowdown. Conditions vary greatly across these economies, however; as discussed in box I.2, Bangladesh and several of the LDCs in East Africa are showing strong growth, while adverse weather conditions and/or fragile political and security situations continue to plague economies in the Horn of Africa and in parts of South and Western Asia.
Box I.2 Prospects for the least developed countries The least developed countries (LDCs) will continue to see a growth performance that stands apart from the global pattern. While world economic growth decelerated markedly in 2011, LDCs experienced only a mild slowdown from 5.6 per cent in 2010 to 4.9 per cent in 2011. In the outlook for 2012, LDCs are expected to escape the global trend, with gross domestic product (GDP) growth ticking up again to 5.9 per cent. Even so, growth is expected to remain below potential in most of these economies. In 2011 and 2012, per capita income growth is expected to reach between 2.0 and 2.5 per cent, well below the annual average of 5.0 per cent reached in 2004-2007. Despite the high vulnerability of most LDCs to commodity price shocks, they tend to be less exposed to financial shocks, and mild growth in official development assistance (ODA) has provided them with a cushion against the global slowdown. Conditions vary greatly across these economies, however (see figure). As a positive example, Bangladesh’s economy grew by 6.5 per cent in 2011, continuing the upward trend of the previous year. Growth was underpinned by a robust expansion in private consumption and investment and a recovery in exports. Export revenues were boosted by strong apparel sales as the European Union enhanced duty-free market access for LDCs and international retailers shifted production to Bangladesh because of the country’s low labour costs. Despite a slowdown in exports, growth is forecast to remain robust in 2012.
GDP growth in the least developed countries, 2010-2011 and 2012 Percentage
10.0
Angola Niger Ethiopia
8.0
Liberia United Republic of Tanzania Bangladesh Malawi
6.0 2012
Lesotho Madagascar
4.0
Zambia Chad
Myanmar
Nepal
Benin
Equatorial Guinea
Haiti
Source: UN/DESA. Note: Data for 2012 refer to the United Nations baseline forecast. Data for 2010-2011 refer to the two-year average growth rate, with that for 2011 being partly estimated.
Mali Uganda
Mozambique
2.0
0.0 0.0
2.0
4.0
6.0 2010-2011
8.0
10.0
9
Global economic outlook
Box I.2 (cont’d) Angola is also witnessing robust growth, which is forecast to accelerate from 4.1 per cent in 2011 to 9.2 per cent in 2012 on the back of rising production in the hydrocarbon sector. However, despite the positive headline growth figures, the country continues to suffer from a lack of economic diversification and higher value added activities in the private sector, as well as from institutional deficits. In Nepal, economic activity continued to be hindered by political uncertainty and a fragile security situation, in addition to other factors, such as power shortages. Real GDP growth declined from 4.6 per cent in 2010 to 3.9 per cent in 2011 as solid growth in private consumption was largely offset by a contraction in investment and exports. Tourism earnings and remittance inflows registered moderate gains, a trend that is likely to continue in 2012. The manufacturing, construction and banking sectors are expected to perform slightly better in 2012, lifting growth to a still meagre and below-potential 4.3 per cent. Similarly, in Uganda, solid growth due to strong investment in the natural resources sector and vibrant construction, transport and communication sectors has become subject to increasing downside risks in the light of lingering political unrest. By contrast, a number of other LDCs find themselves in outright dire situations. In the Horn of Africa, severe drought conditions have led to a famine that is taking a heavy humanitarian toll, especially among children, and forcing many people to flee their homes. Somalia has been hit especially hard, as drought has compounded an already disastrous situation stemming from poverty and military conflict. Across the group of LDCs, continued and growing (albeit slowly) ODA has provided a buffer to weather the crosscurrents of the unstable and volatile global economic environment. The overall positive economic outlook for LDCs remains subject to considerable risks. A pronounced fall in oil prices would hit oil exporters such as Angola especially hard, compounding a situation that is problematic even in a time of solid oil prices, in view of high income inequality and a shortfall in private sector business activity owing to the dominant role of the State. A further risk lies in the continued dependence of public budgets in many LDCs on ODA flows. If the pressure for fiscal consolidation in developed economies feeds through into pronounced cuts in ODA, policymakers in LDCs would see their room to manoeuvre limited further. Another risk lies in the weather pattern and, in this context, also in the possibility of more lasting changes in climate conditions. Compounding the negative fallout from adverse weather conditions is the fact that agriculture is the dominant economic sector in many LDCs.
Unemployment—a key policy concern Three years after the onset of the Great Recession, persistent high unemployment remains the Achilles heel of economic recovery in most developed countries. The unemployment rate averaged 8.6 per cent in developed countries in 2011, still well above the pre-crisis level of 5.8 per cent registered in 2007. At more than 20 per cent, the rate remains the highest in Spain, while Norway’s jobless rate is the lowest, at 3.5 per cent. Notably, the unemployment rate in the United States has remained at about 9 per cent since 2009, with virtually no improvement in the labour market during 2011 as layoffs in the public sector have partly offset job creation in the private sector and labour force growth has kept pace with overall employment growth. In many developed economies, the actual situation is worse than reflected in the official unemployment rates. In the United States, for instance, labour participation rates have been on a steady decline since the start of the crisis. Increasing numbers of workers without a job for a prolonged period have stopped looking for one and are no longer counted as part of the labour force. About 29 per cent of the unemployed in the United States have been without a job for more than one year, up from 10 per cent in 2007. Such a prolonged duration of unemployment tends to have significant long-lasting detrimental
The protracted jobs crisis in developed countries is harming long-term prospects
10
World Economic Situation and Prospects 2012
Despite employment recovery, long-term unemployment is also a concern in developing countries
Youth unemployment is a major concern worldwide
impacts on both the individuals who have lost their jobs and on the economy as a whole. The skills of unemployed workers deteriorate commensurate with the duration of their unemployment, most likely leading to lower earnings for those individuals who are eventually able to find new jobs. At the aggregate level, the higher the proportion of workers trapped in protracted unemployment, the greater the adverse impact on the productivity of the economy in the medium to long run. The International Labour Organization (ILO) estimated that by the first quarter of 2011, almost one third of the unemployed in developed countries had been without a job for more than one year, a situation affecting about 15 million workers (figure I.3).4 In developing countries, employment recovery has been much stronger than in developed economies. For instance, unemployment rates are back to or below precrisis levels in most Asian developing countries, while employment has recovered in most countries in Latin America also. However, developing countries continue to face major challenges owing to the high shares of workers that are underemployed, poorly paid, have vulnerable job conditions or lack access to any form of social security. At the same time, open unemployment rates remain high, at well over 10 per cent in urban areas, with the situation being particularly acute in a number of African and Western Asian countries. Long-term unemployment has also increased in developing countries (figure I.3). High youth unemployment is a concern worldwide. Unemployment rates among youth (persons 15-24 years of age) tend to be higher than other cohorts of the labour force in normal times in most economies, but the global financial crisis and its consequent global recession have increased this gap in most parts of the world. Barring Figure I.3 Long-term unemployment in developed and developing countries, 2009 and 2011 35
Ratio of total unemployment (percentage) 2009, first quarter 2011, first quarter
30
25
20
15
10
5
Source: International Labour Organization (ILO), World of Work Report 2011 (Geneva).
0 Developed 4
Developing
Estimate of total long-term unemployment in developed economies, based on International Labour Organization (ILO) labour statistics database (LABORSTA), accessed 22 November 2011.
11
Global economic outlook
data limitations, the jobless rate among young workers in developed countries increased from an estimated 13 per cent in 2008 to about 18 per cent by the beginning of 2011. In Spain, an astonishing 40 per cent of young workers are without a job. A quarter or more of the youth in Western Asia and North Africa and one fifth of those in the economies in transition are unemployed. Also, in other developing regions, youth unemployment has increased more than that of other age groups. Latin America and the Caribbean, in particular, experienced significant increases in youth unemployment since 2008, although the situation started to improve in the first half of 2011. In East Asia, South Asia and Africa, young workers have a high probability of facing vulnerable employment conditions. Skilled and unskilled young workers are affected by unemployment in different ways. Skilled youth that lose their jobs tend to have greater difficulty in getting a new job than more experienced workers and, hence, tend to face longer periods of unemployment than other workers; when they do find new jobs, they mostly have to settle for salaries lower than they earned before. Since entry salaries affect future salaries, youth who have lost jobs during the current financial crisis will face the risk of getting lower salaries for a prolonged period, even after the economy recovers. This group of unemployed, educated youth has recently received attention in the political debate as the “lost generation”. Unskilled young workers who have recently lost jobs have been found to be at greater risk of becoming “discouraged workers”, leading them to exit the labour force and end up dependent upon families and social programmes in the long term, especially in developed economies where such programmes exist. In developing economies, unskilled youth in unemployment face the additional risk of a permanent loss of access to decent work, causing them to stay outside the formal economy and have much lower lifetime earnings. Meanwhile, more young people continue to enter labour markets worldwide. In order to restore pre-crisis employment and absorb the new labour entrants, an employment deficit, estimated at 64 million jobs in 2011, would need to be eliminated. 5 With the global economic slowdown projected in the baseline and growth of the workforce worldwide, however, the deficit would increase further, leaving a job shortage of about 71 million, of which about 17 million would be in developed countries.6 If economic growth stays as anaemic in developed countries as is projected in the baseline forecast, employment rates will not return to pre-crisis levels until far beyond 2015 (figure I.4). Persistent high unemployment is holding back wage growth and consumer demand and, especially in the United States, pushing up delinquency on mortgage payments. Combined with continued financial fragility in the developed economies, it is also depressing investment demand and business confidence and further holding back economic recovery.
Benign inflation outlook Inflation has increased worldwide in 2011, driven by a number of factors, particularly the supply-side shocks that have pushed up food and oil prices and strong demand in large 5 6
Using ILO data, the employment deficit is estimated here as the difference between the global employment rate as observed in 2007 and 2011 multiplied by the working-age population. Estimate based on the UN/DESA Global Policy Model. See box I.4 and the appendix table to the present chapter for baseline trends in employment rates in major economies and an assessment of an alternative policy scenario to eliminate the deficit.
To make up for the employment deficit left by the crisis, 64 million jobs need to be created worldwide
12
World Economic Situation and Prospects 2012
Figure I.4 Post-recession employment recovery in the United States, euro area and developed economies, 2007 (Q1)-2011 (Q2) and projections for 2011 (Q3)-2015 (Q4) 1
Percentage change
0 United States Developed economies Euro area (16)
-1 -2
Inflation does not pose a present danger in developed countries…
…but remains a concern among developing countries
-3 -4
-5
2015Q3
2015Q1
2014Q3
2014Q1
2013Q3
2013Q1
2012Q3
2012Q1
2011Q3
2011Q1
2010Q3
2010Q1
2009Q3
2009Q1
2008Q3
2008Q1
2007Q3
-6
2007Q1
Source: UN/DESA, based on data from ILO and IMF. Note: The chart shows percentage changes of total employment (as a moving average) with respect to prerecession peaks. Projections (dashed lines) are based on estimates of the output elasticity of employment (Okun’s law), following a similar methodology to that of ILO, World of Work Report 2011 (Geneva).
developing economies as a result of rising incomes and wages. Reflationary monetary policies in major developed economies have also contributed to upward pressure by, among other things, increasing liquidity in financial markets, which has kept interest rates down but has also increased financial investment in commodity futures markets, inducing an upward bias in commodity prices and enhancing volatility (see chap. II). Among the developed economies, inflation rates in the United States and Europe have edged up during 2011, moving from the lower to the upper bound of the inflation target bands set by central banks. This increase was in line with the policy objective in these economies, aimed at mitigating the risk of deflation in the aftermath of the financial crisis, as their central banks continued to inject more liquidity into the economy through various unconventional policy measures. In Japan, the disruption caused by the earthquake in March 2011, along with other factors, pushed up the general price level, ending a protracted period of deflation. Nonetheless, inflation should not be a major policy concern for most developed economies. Inflation is expected to be moderate in the outlook for 2012-2013 with the weakening of aggregate demand, subdued wage pressures in the face of continued high unemployment and—barring major supply shocks—the moderating of international commodity prices. Inflation rates surpassed policy targets by a wide margin in a good number of developing economies. The monetary authorities of these economies have responded with a variety of measures, including by tightening monetary policy, increasing subsidies on food and oil, and providing incentives to domestic production. In the outlook, along with an anticipated moderation in global commodity prices and lower global growth, inflation in most developing countries is also expected to decelerate in 2012-2013.
13
Global economic outlook
The international economic environment for developing countries and the economies in transition Increased volatility in private capital flows Net private capital inflows7 to emerging and developing economies increased to about $575 billion in 2011, up by about $90 billion from 2010 levels (figure I.5). The recovery in capital inflows from their precipitous decline during the global financial crisis continued until the middle of 2011 but suffered a strong setback with the sharp deterioration in global financial markets in the third quarter of the year. The current level of inflows remains well below the pre-crisis peak registered in 2007. As a share of GDP of developing countries, net capital inflows are at about half of their peak levels. The outlook for external financing will be subject to uncertainty owing to counteracting forces during 2012 and 2013. On the one hand, continued sovereign debt distress in developed economies will sustain the present uncertainty and volatility in global financial markets, and this will likely deter portfolio capital flows to emerging economies. Deepening of the sovereign debt crisis may lead to more capital being pulled back for deleveraging of financial institutions in developed countries or in a search for safe havens (such as dollar- or Swiss francdenominated assets), as was the case during the financial turmoil of the third quarter of 2011. On the other hand, higher growth prospects for most emerging economies (despite the downgraded forecast) will likely attract more foreign direct investment (FDI), while interest rate differentials will continue to favour lending to emerging economies even if
Private capital flows increased further in 2011…
Figure I.5 Net capital flowsa to developing countries, 2000-2012 600
Billions of dollars Direct investment, net
400
Other private financial flows, net
200
Private portfolio flows, net Official flows, net
0
Change in reservesb
-200 -400 -600 -800 -1000 -1200 -1400 2000
2002 7
2004
2006
2008
The measure used here refers to net inflows minus net outflows.
2010
2012
Source: UN/DESA, based on IMF, World Economic Outlook database, September 2011. a Estimates of net capital flows are based on balance of payments data and are defined as “net net”, that is, as net inflows minus net outflows. b Negative value signifies accumulation of reserves.
14
World Economic Situation and Prospects 2012
...although portfolio flows have shown great volatility
the risk premiums for some of these economies rise further, a trend already visible in the second half of 2011 (figure I.6). Short-term portfolio equity flows to developing countries went into a tailspin in the second half of 2011. As a result, net inflows of portfolio equity to emerging economies in 2011 are estimated to register a decline of about 35 per cent from 2010 levels, exhibiting vivid proof of the high volatility these flows tend to be subject to. International bank lending to emerging and developing economies continued to recover slowly from its sharp decline in 2009. In 2011, bank lending had recovered to only about 20 per cent of its pre-crisis peak level, as international banks headquartered in developed countries continued to struggle in the aftermath of the financial crisis. Nonbank lending has been more vigorous, as both private and public sectors in emerging economies managed to increase bond issuance, taking advantage of low interest rates in global capital markets. Net FDI remained the largest single component of private capital flows in 2011, reaching $429 billion, up by more than $100 billion from its 2010 level. Asian emerging economies received most (about 45 per cent) of the FDI inflows, followed by Latin America. These estimates are net of FDI from emerging market economies, which continued to increase. China and a few other Asian developing countries further increased investments in Latin America and Africa, primarily destined towards sectors producing oil, gas and other primary commodities. Net disbursements of ODA reached a record high of $128.7 billion in 2010. Despite this record level, the amount of aid fell well short (by more than $20 billion) of the commitments made at the Gleneagles Summit of the Group of Eight (G8) on 6 July 2005 and those of other members of the Development Assistance Committee (DAC) of the Organization for Economic Cooperation and Development (OECD) to increase aid Figure I.6 Daily yield spreads on emerging market bonds, January 2010-October 2011 450 Mexico Colombia South Africa Russian Federation
400
Brazil Turkey Indonesia
350
300
250
200
150
Sep-2011
Jul-2011
May-2011
Mar-2011
Jan-2011
Nov-2010
Sep-2010
Jul-2010
May-2010
Mar-2010
Source: JPMorgan Chase.
Jan-2010
100
15
Global economic outlook
to developing countries. Total ODA increased by 6.5 per cent in real terms in 2010, but OECD donor surveys suggest that bilateral aid from DAC members to core development programmes in developing countries will grow at a mere 1.3 per cent per year during 2011‑2013 owing to the fiscal constraints of donors. At the current rate of progress, donors will not fully deliver on their commitments in the near future and will remain far removed from the long-standing United Nations target of providing 0.7 per cent of their gross national income (GNI) by 2015. On balance, however, financial resources continue to flow out of the emerging and developing economies in large quantities as their accumulation of foreign exchange reserves have increased further. In 2011, emerging economies and other developing countries are estimated to have accumulated an additional $1.1 trillion in foreign exchange reserves, totalling about $7 trillion.
Developing countries added more than $1 trillion to their reserve holdings
Continued volatility in commodity prices International prices of oil and other primary commodities continued to rise in early 2011, but declined in the third quarter. The pattern resembles that of 2008, although the reversal has not been as drastic. Nonetheless, average price levels of most commodities for 2011 remained well above those in 2010, by between 20 and 30 per cent. The reversals since mid-2011 have been driven by four key factors: a weaker global demand for commodities resulting from bleaker prospects for the world economy, positive supply shocks in a number of markets, a sell-off in markets for financial commodity derivatives that occurred in concert with the downturn in global equity markets, and an appreciation of the United States dollar. In the outlook, the prices of most primary commodities are expected to moderate by about 10 per cent in both 2012 and 2013, consistent with the forecast of weaker global economic growth. It is to be expected, however, that commodity price volatility will continue to remain high. Brent oil prices averaged $111 per barrel (pb) in the first half of 2011, compared with an average of $79 for 2010 as a whole (figure I.7). The surge was mainly driven by the political unrest in North Africa and Western Asia, which caused disruptions in oil production, especially in Libya. However, oil prices dropped sharply in the third quarter of 2011 amidst weakening global demand, the anticipated resumption of oil production in Libya as well as a rebound of the exchange rate of the United States dollar. In the outlook for 2012, demand for oil is expected to weaken because of slower economic growth in developed countries. Yet, total demand is expected to remain sustained because of the increased energy needs of developing countries, as well as the restocking of oil inventories. Oil production is expected to resume progressively in Libya, while Saudi Arabia may keep its production at the current level. However, the continued geopolitical instability in North Africa and Western Asia is likely to keep the risk premium on oil prices elevated. All things considered, the Brent oil price is expected to decline by 6 per cent, to $100 pb, in the baseline forecast for 2012 and to continue to fluctuate around that level in 2013. Nonetheless, price uncertainty and volatility will remain high because of, among other things, the influence of financial factors. These include, in particular, fluctuations in the value of the United States dollar and unpredictable trends in financial derivatives’ trading in commodity markets. After sliding considerably in the first half of 2010, world food prices have risen sharply, peaking around February 2011 (figure I.7). Despite subsequent falls, prices remain comparatively high. The average price of cereals during the first nine months of 2011 was
Commodity prices have dropped after a strong increase in early 2011
Food prices have been volatile but remain high
16
World Economic Situation and Prospects 2012
Figure I.7 International oil and food prices, January 2000-October 2011 300
160 Food price index 140
100
200
80 150
60 40
Brent oil
Food price index, 2000=100
Brent oil (US dollars per barrel)
250 120
100
20 50
Jul-2011
Jul-2010
Jan-2011
Jan-2010
Jul-2009
Jul-2008
Jan-2009
Jul-2007
Jan-2008
Jan-2007
Jul-2006
Jul-2005
Jan-2006
Jan-2005
Jul-2004
Jul-2003
Jan-2004
Jul-2002
Jan-2003
Jan-2002
Jul-2001
Jul-2000
Jan-2001
0
Jan-2000
Source: UN/DESA, based on data from UNCTAD and IMF, International Financial Statistics database.
about 40 per cent higher than that recorded over the same period of 2010. Despite similar swings, meat, vegetable oils and sugar prices have also been on the rise. The impact on food-dependent developing countries has been considerable, but variable. A famine caused by prolonged droughts was declared in the Horn of Africa, but other countries in Africa enjoyed good harvests of maize and sorghum. Generally speaking, however, higher food prices have been an important factor in the high inflation of many developing countries, or a cause of additional fiscal burdens where the impact was mitigated by food subsidies. In the outlook, food prices may moderate somewhat with the global downturn and expected good harvests for a number of key crops (including wheat). Yet, prices are likely to remain volatile, as food markets remain tight and any adverse supply shock could induce strong price effects. Continued uncertainty in financial markets can also be expected to exacerbate commodity price volatility.
Moderating world trade growth World trade continued to recover in 2011, albeit at a much slower pace than in 2010. After a strong rebound of more than 14 per cent in 2010, the volume of world exports in goods decelerated visibly, to 7 per cent, in 2011 (figure I.8). The level of total world exports had fully recovered to its pre-crisis peak by the end of 2010, but it is estimated to be still below the long-term trend level by the end of 2011. As has been the case with the recovery of WGP, developing countries, particularly Asian economies with large shares in the trade of manufactured goods, led the recovery. While the level of trade in volume terms has already far surpassed the pre-crisis peak for developing countries as a group, the trade volume for
17
Global economic outlook
Figure I.8 World merchandise exports, by volume, January 2006-August 2011 Index: January 2006=100
150
World Developed economies Emerging economies
140
130
120
110
100
90
Jul-2011
Jan-2011
Jul-2010
Jan-2010
Jul-2009
Jan-2009
Jul-2008
Jan-2008
Jul-2007
Jan-2007
Jul-2006
Jan-2006
80
Source: CPB Netherlands Bureau for Economic Policy Analysis, rebased by UN/DESA.
developed economies has yet to recover fully from the global crisis. Commodity-exporting developing countries experienced a strong recovery in the value of their exports in the first half of 2011, owing to the upturn in commodity prices, but saw little growth of export volumes. Some of the value gains were lost again in the second half of the year with the downturn in key commodity prices. In the outlook, the volume growth of world trade is expected to moderate to about 5.0 per cent in 2012-2013. The dichotomy between a robust growth in trade in emerging economies and a weak one in developed economies will continue.
Uncertainties and risks Risks of another global recession Failure of policymakers, especially those in Europe and the United States, to address the jobs crisis and prevent sovereign debt distress and financial sector fragility from escalating, poses the most acute risk for the global economy in the outlook for 2012-2013. A renewed global recession is just around the corner. The developed economies are on the brink of a downward spiral enacted by four weaknesses that mutually reinforce each other: sovereign debt distress, fragile banking sectors, weak aggregate demand (associated with high unemployment and fiscal austerity measures) and policy paralysis caused by political gridlock and institutional deficiencies. All of these weaknesses are already present, but a further worsening of one of them could set off a vicious circle leading to severe financial turmoil and an economic downturn. This would also seriously affect emerging markets and other developing countries through trade and financial channels.
Policy failure poses the most acute risk for the global economy
18
Inability to address sovereign debt problems in the euro area and the United States could trigger another global recession
World Economic Situation and Prospects 2012
The baseline forecast assumes that the set of additional measures agreed upon by the EU in late 2011 will suffice to contain Greece’s debt crisis. The measures include a 50 per cent reduction of Greece’s sovereign debt, steps to recapitalize European banks and deeper fiscal cuts in Greece. The baseline assumes this would help engender an orderly workout of the sovereign debt crisis in the euro area and prevent the Greek default from spreading to other economies and leading to a major collapse of banks. For the United States, the baseline assumes that the Government will put in place a policy package that would provide some minor stimulus in the short run, while cutting Government spending and increasing taxes over the medium run. The baseline further subsumes the policy commitments made by other Group of Twenty (G20) members at the Cannes Summit in France, held on 3 and 4 November 2011. These reaffirm—by and large—existing Government plans, with the main emphasis on moving towards further fiscal austerity while sustaining accommodative monetary policies in most developed countries; and with continued focus on price stability through monetary tightening in major developing economies and those countries who are running large current-account surpluses enacting fiscal policies that promote more domestic-led growth. The presumption of the baseline scenario is that the combination of these policies will allow developed economies to “muddle through” during 2012, but will be insufficient to catapult a robust economic recovery. The risk is high, however, that these relatively benign baseline assumptions will prove to be overly optimistic. It is quite possible that the additional measures planned in Europe will not be effective enough to resolve the sovereign debt crisis in the region, leading to a disorderly and contagious default in a number of countries which will wreak havoc in the economies of the region and beyond. The efforts to solve the sovereign debt crisis in Europe failed to quell the unease in financial markets during November of 2011, and fresh warning signs of further problems emerged as Italy’s cost of borrowing jumped to its highest rate since the country adopted the euro. Another sign of increasing financial distress was a jump in the Euribor-OIS, Europe’s interbank lending rate, from 20 to 100 basis points—not as high as at the onset of the 2008 global financial crisis, but high enough to cause concern. A large number of banks in the euro area already stand to suffer significant losses, but contagion of the sovereign debt crisis to economies as large as Italy would no doubt overstretch the funds available in the European Financial Stability Facility (EFSF), put many banks on the verge of bankruptcy and trigger a worldwide credit crunch and financial market crash in a scenario reminiscent of the September 2008 collapse of Lehman Brothers Holdings Inc. Such a financial meltdown would no doubt lead to a deep recession, not only in those economies under sovereign debt distress, but also in all other major economies in the euro area, possibly with the intensity of the downturn seen in late 2008 and early 2009. The political wrangling over the budget in the United States may also worsen and could harm economic growth if it leads to severe fiscal austerity with immediate effect. This would push up unemployment to new highs, further depress the already muchshaken confidence of households and businesses, and exacerbate the beleaguered housing sector, leading to more foreclosures which, in turn, would put the United States banking sector at risk again. Consequently, the United States economy could well fall into another recession. The United States Federal Reserve might respond by adopting more aggressive monetary measures, for example, through another round of quantitative easing; but in a depressed economy with highly risk averse agents, this would likely be even less effective in terms of boosting economic growth than the measures taken in previous years.
19
Global economic outlook
A recession in either Europe or the United States alone may not be enough to induce a global recession, but a collapse of both economies most likely would. Table I.2 shows the possible implications of a more pessimistic scenario of this kind. GDP of the EU would decline by 1.6 per cent and that of the United States by 0.8 per cent in 2012. This would constitute about one third of the downturn experienced during 2009. The scenario assumes that financial conditions would not escalate into a full-blown banking crisis with worldwide repercussions, but it also assumes some overshooting of the impact into the real economy—as was the case in 2009—allowing for a mild recovery in 2013, albeit with GDP growth remaining well below the baseline forecast. Developing economies and the economies in transition would likely take a significant blow. The impact would vary as their economic and financial linkages to major developed economies differ across countries. Asian developing countries, particularly those in East Asia, would suffer mainly through a drop in their exports to major developed economies, while those in Africa, Latin America and Western Asia, along with the major economies in transition, would be affected by declining primary commodity prices. In addition, all emerging economies would have to cope with large financial shocks, including a contagious sell-off in their equity markets, reversal of capital inflows and direct financial losses due to the declining values of the holdings of European and United States sovereign bonds, which would affect both official reserve holdings and private sector assets. As a result, GDP growth in developing countries would decelerate from 6.0 per cent in 2011 to 3.8 per cent in 2012, that is, to almost half the pace of growth (about 7 per cent per year) achieved during 2003-2007 and about 3 percentage points below the long-term growth trend. This growth deceleration is not quite as big as in 2009 (when the pace of developing country growth dropped by almost 4.5 percentage points), yet various regions would suffer negative per capita income growth, likely causing renewed setbacks in poverty reduction and in achieving the other Millennium Development Goals (MDGs).8 Growth of WGP would decelerate to 0.5 per cent in 2012, implying a downturn in average per capita income for the world.
Developing countries would be hit hard
Uncertainties associated with the global imbalances and heightened exchange-rate volatility The large and persistent external imbalances in the global economy that have developed over the past decade remain a point of concern for policymakers. Reducing these imbalances has been the major focus of consultations among G20 Finance Ministers under the G20 Framework for Strong, Sustainable and Balanced Growth and the related Mutual Assessment Process (MAP) during 2011. The imbalances have declined during the current economic downturn, but there is concern that in the absence of corrective actions, they will rise again as the world economy recovers. The Cannes Action Plan for Growth and Jobs,9 adopted by the G20 leaders at the Cannes Summit on 4 November 2011 includes some concrete policy commitments towards such corrective action. In practice, after a substantial narrowing during the Great Recession, the external imbalances of the major economies stabilized at about half of their pre-crisis peak levels 8
9
For an assessment of the impact of economic downturns suffered during the global crisis of 2008 and 2009 on MDG achievement, see World Economic Situation and Prospects 2011, op. cit., box I.3, pp. 14-15. Available from http://www.g20.org/Documents2011/11/Cannes20Action20plan20420November 202011.pdf.
The global imbalances have stabilized at reduced levels…
20
World Economic Situation and Prospects 2012
Table I.2 A downside scenario for the world economya GDP growth rate (percentage) Deviation from baseline forecast 2011
2012
2013
2012
2013
World
2.8
0.5
2.2
-2.1
-1.0
Developed economies United States of America Japan European Union EU-15 New EU members Euro area Other European countries Other developed countries Economies in transition South-Eastern Europe Commonwealth of Independent States and Georgia Russian Federation Developing economies Africa North Africa Sub-Saharan Africa Nigeria South Africa Others East and South Asia East Asia China South Asia India Western Asia Latin America and the Caribbean South America Brazil Mexico and Central America Mexico Caribbean By level of development High-income countries Upper middle income countries Lower middle income countries Low-income countries Least developed countries
1.3 1.7 -0.5 1.6 1.5 2.9 1.5 1.0 1.4 4.1 1.7
-0.9 -0.8 0.5 -1.6 -1.8 1.1 -2.0 -0.1 0.2 -2.0 -2.8
1.1 1.1 1.2 1.0 0.9 2.6 0.6 1.1 1.7 3.3 2.7
-2.1 -2.3 -1.5 -2.3 -2.3 -1.5 -2.4 -1.2 -2.0 -5.9 -5.1
-0.8 -0.9 -0.8 -0.6 -0.6 -0.5 -0.7 -0.5 -0.7 -0.9 -0.5
4.3 4.0 6.0 2.7 -0.5 4.4 6.3 3.1 4.8 7.1 7.2 9.3 6.5 7.6 6.6 4.3 4.6 3.7 3.8 3.8 3.4
-2.0 -3.6 3.8 3.3 4.7 2.6 4.2 0.0 4.0 5.6 5.6 7.8 5.7 6.7 1.1 0.8 1.2 0.3 -0.4 -0.6 3.8
3.3 3.0 4.5 3.7 4.6 3.2 5.2 1.7 3.5 5.7 5.7 7.6 5.8 6.9 2.5 2.4 2.7 2.0 1.8 1.8 2.6
-6.0 -7.5 -1.7 -1.7 0.0 -2.6 -2.6 -3.7 -1.8 -1.2 -1.3 -0.9 -1.0 -1.0 -2.7 -2.5 -2.4 -2.4 -3.1 -3.1 0.3
-0.9 -1.0 -1.4 -1.5 -0.9 -1.8 -1.8 -1.8 -1.8 -1.2 -1.2 -0.9 -1.1 -1.0 -1.8 -1.8 -1.8 -1.8 -1.8 -1.8 -1.7
1.6 6.1 5.9 5.7 4.9
-0.7 3.2 5.2 6.0 5.4
1.2 4.7 5.3 4.2 4.0
-2.1 -2.3 -1.2 0.0 -0.6
-0.8 -1.2 -1.3 -1.7 -1.8
Source: UN/DESA. a See section on “Risks and uncertainties” for assumptions for this scenario.
21
Global economic outlook
(relative to GDP) during 2010-2011 (figure I.9). The United States remained the largest deficit economy, with an estimated external deficit of about $450 billion (3 per cent of GDP) in 2011, but the deficit has come down substantially from the peak of $800 billion (6 per cent of GDP) registered in 2006. The external surpluses in China, Germany, Japan and a group of fuel-exporting countries, which form the counterpart to the United States deficit, have narrowed, albeit to varying degrees. China, for instance, registered a surplus of about $250 billion (less than 4 per cent of GDP) in 2011, dropping from a high of 10 per cent of GDP in 2007. Japan is estimated to have registered a surplus of 2.5 per cent of GDP in 2011, a reduction of one percentage point of GDP compared with the level in 2010 and about half the size of the peak level reached in 2007. While Germany’s surplus remained at about 5 per cent of GDP in 2011, the current account for the euro area as a whole was virtually in balance. Large surpluses, relative to GDP, were still found in oil-exporting countries, reaching 20 per cent of GDP or more in some of the oil-exporting countries in Western Asia. At issue is whether the adjustment of the imbalances in major economies has been mainly cyclical or structural. In the United States, some of the corresponding adjustment in the domestic saving-investment gap seems to be structural. For example, the household saving rate has increased from about 2 per cent of disposable household income before the financial crisis to about 5 per cent in the past few years. Despite a decline in recent months, it is likely that the average saving rate will stay at this level in the coming years, given the changes that have taken place in house financing and the banking sector after the financial crisis. On the other hand, the significant decline in the business investment rate and the surge in the Government deficit in the aftermath of the financial crisis are more likely to be cyclical. Business investment has been recovering slowly, while the budget deficit is expected to decrease somewhat. As a result, in the baseline scenario, the external deficit of the United States may stabilize at about 3 per cent of GDP in the medium run.
…yet, no benign rebalancing has taken place
Figure I.9 Global imbalances, 1996-2013 3
Current-account balances as a percentage of world gross product China East Asia, excluding China Germany and Japan
2
Oil exporters United States Rest of the world
1
European Union, excluding Germany
0
-1
-2
2013
2012
2011
2010
2009
2008
2007
2006
2005
2004
2003
2002
2001
2000
1999
1998
1997
1996
-3
Source: IMF, World Economic Outlook database, September 2011.
22
There are concerns that the present process of global rebalancing will be addressed at the expense of job growth and will not help stabilize exchange rates
World Economic Situation and Prospects 2012
With regard to the surplus countries, the decline in the external surplus of China has also been driven in part by structural change. China’s exchange-rate policy has become more flexible, with the renminbi appreciating gradually but steadily vis-à-vis the United States dollar over the past year.10 Meanwhile, the Government has scaled up measures to boost household consumption, aligning the goal of reducing China’s external surplus with that of rebalancing the structure of the economy towards greater reliance on domestic demand. However, the process of rebalancing can be only gradual over the medium to long run so as to prevent it from being disruptive. In Japan, a continued appreciation of the yen has contained its external surplus. In Germany, room remains for policies to stimulate more domestic demand so as to further narrow its external surplus. The surpluses in oil-exporting countries are of a quite different nature from those in other economies, as these countries need to share the wealth generated by the endowment of oil with future generations via a continued accumulation of the surplus into the foreseeable future. The policy commitments made at the Cannes G20 Summit promise to gently move things in the same direction, but with much of the narrowing in the short run coming from cyclical factors, including slower aggregate demand growth and moderating commodity prices. Hence, at projected baseline trends, the global imbalances are not expected to widen by a significant margin in the next two years. Should the global economy fall into another recession, the imbalances would narrow further in a deflationary manner. Unsustainably large imbalances must be addressed, but at their present level, the global imbalances should not be a primary reason for concern. There are two other related concerns, however. The first is that the global rebalancing agenda should not develop at the expense of growth; rather, it should promote growth and employment generation as this will also be key to overcoming public debt woes. While the rebalancing as proposed in the Cannes Action Plan is said to be aligned with a strategy for “growth and jobs”, most of the concrete policy actions are already contained in existing Government plans, which— as shown in the outcome of the baseline scenario—add up to only anaemic growth at best, and thus to a further cyclical, rather than structural, adjustment of the global imbalances. The second related problem is the continued build-up of vast external liability positions of deficit countries which have similarly large external asset positions of the surplus countries as a counterpart. In a context of enhanced uncertainty in financial markets, these accumulated net investment positions are part of a larger topic related to enhanced exchange-rate instability. The net external liability position of the major reserve currency country, the United States, stands at about $2.5 trillion (17 per cent of GDP), but is down from its peak of $3.3 trillion (23 per cent of GDP) in 2008. Foreign holdings of United States Government debt dominate the composition of external liabilities, estimated at over $22 trillion, while United States foreign asset holdings mainly consist of private equities. Mounting external liabilities by the United States, associated in part with increasing fiscal deficits, have in fact been a major factor in the downward pressure on the United States dollar against other major currencies since 2002, although there have been large fluctuations around the trend. Confidence in the dollar is subject to volatility as perceptions of the sustainability of the United States liability position can easily shift along with changes in equity prices in global markets and the credibility of fiscal policy, both of which have been under varying (but heavy) pressure during 2011. The political wrangling over the debt ceiling in the United States has damaged market confidence and triggered a sell-off in equity markets worldwide. 10
The renminbi has appreciated by about 30 per cent against the dollar since China abandoned the dollar peg in 2005.
Global economic outlook
23
In the light of events and problems with policy credibility elsewhere, this situation did not lead to univocal dollar depreciation. In the euro area, the lack of policy direction and coherence in dealing with sovereign debt problems put downward pressure on the euro. On a slightly different tack, but essentially in the same vein, the United Kingdom of Great Britain and Northern Ireland suffered its own version of a credibility crisis with the continued failure of its central bank to achieve its inflation target. Japan’s earthquake, in turn, triggered a repatriation of private asset holdings for investment in reconstruction works, putting upward pressure on the yen. The volatility in global capital flows (discussed above) induced further instability into currency markets. Indeed, exchange rates among major international reserve currencies, namely, the United States dollar, euro and Japanese yen, continued to display large fluctuations during 2011 (figure I.10). Developing countries also witnessed greater exchange-rate volatility. The dollar continued its downward trend against other major currencies in the first half of the year, but rebounded notably against the euro in the third quarter when concerns about the sovereign debt crisis in the euro area intensified, and devalued again later in the year after some agreements were reached in Europe on scaling up measures to deal with the debt crisis. Over the year as a whole, the Japanese yen appreciated against both the dollar and the euro, despite interventions by the Bank of Japan to curb the appreciation. Among other currencies in developed economies, the Swiss franc appreciated the most in the first half of the year, as a result of flight-to-safety effects, leading to the decision of the Swiss authorities not to tolerate any strengthening of the exchange rate below SwF 1.20 per euro. Strong capital inflows attracted by robust economic performance put upward pressure on the currencies of most emerging economies over the past two years. This trend went into a tailspin with the heightened turbulence in global financial markets starting in mid-2011 (figure I.11). For instance, Brazil’s real fell 16 per cent against the United States Figure I.10 Exchange rates of major reserve currencies vis-à-vis the United States dollar, 2 January 2008-10 November 2011 160
Index: 2 January 2008=100 Euro
150
Japanese yen Swiss franc
140 130 120 110 100 90
Jul-2011
Jan-2011
Jul-2010
Jan-2010
Jul-2009
Jan-2009
Jul-2008
Jan-2008
80
Source: UN/DESA, based on data from JPMorgan Chase.
24
World Economic Situation and Prospects 2012
Figure I.11 Exchange rates of selected currencies vis-à-vis the United States dollar, 2 January 2008-10 November 2011 Brazilian real
120
Index: 2 January 2008=100
Chinese yuan Korean won
110
Russian rouble South African rand
100
90
80
70
Exchange-rate volatility is posing policy challenges to developing countries
Jul-2011
Jan-2011
Jul-2010
Jan-2010
Jul-2009
Jan-2009
Jul-2008
Source: UN/DESA, based on data from JPMorgan Chase.
Jan-2008
60
dollar in the third quarter, while the Russian rouble and the South African rand depreciated by 15 and 19 per cent, respectively. However, since early 2009, the underlying trend has been for the currencies of most emerging economies to appreciate against the dollar. In the cases of Brazil, Indonesia, the Republic of Korea, South Africa and Thailand, for instance, this trend reflects in part a recovery from the depreciation that occurred at the apex of the global financial crisis in 2008. The Chinese renminbi, in contrast, has slowly but gradually appreciated against the dollar ever since 2005, as part of a deliberate exchange-rate policy. Currency appreciation poses a challenge for many developing countries and some European countries by reducing the competitiveness of their respective export sectors. While domestic demand has been taking on a more significant role as a driver of growth on the back of rising incomes in many emerging economies, a forced and premature shift away from an export-led growth model owing to pronounced and sustained currency appreciation might create significant dislocations, especially in labour markets in the form of a spike in unemployment. Stronger currencies can help on the import side to reduce inflation, but this advantage could be more than offset by the social cost of higher unemployment rates. An additional problem tied to sustained exchange-rate trends lies in an increased probability of sudden trend reversals, as occurred in the third quarter of 2011. Contrary to many fundamental factors, virtual panic about the debt problems in Europe and the possibility of a global recession set off a flight to the dollar, which has again confirmed its role as the safe-haven currency of last resort in situations of extreme market stress. Emerging market currencies that had experienced sustained appreciation pressure suffered a precipitous fall in their values in a very short time span, illustrating the unpredictable nature of developments in currency markets.
25
Global economic outlook
The increased currency volatility has injected an additional element of uncertainty into currency markets and created significant feed-through effects into the real economy. As companies face greater difficulties in pricing their products and anticipating their costs, business planning becomes more uncertain, underpinning a generally more cautious approach that also includes an even greater reluctance to hire new employees. Such increased volatility would also be likely to spill over into more price instability in commodity markets given the high degree of financialization of those markets and the impact of exchange rates (especially the value of the dollar) on commodity prices (see chap. II). Uncertainty and volatility in currency markets can be expected to remain high during 2012-2013.
Policy challenges Overcoming the risks outlined above and reinvigorating the global recovery in a balanced and sustainable manner poses enormous policy challenges. Most developed economies—Europe and the United States, as well as Japan—find themselves in a difficult economic bind. There are no simple solutions that would quickly win political support. Their economies have been growing too slowly for too long, making it more and more difficult to pay for the increasing costs of health care and pensions for ageing populations. The United States and Europe face the risk of their problems feeding into each other. Recent economic stagnation may make voters and policymakers unwilling to opt for hard choices, and the political paralysis might, in turn, worsen the economy by creating new financial turmoil. In the short term, this so-called no growth or low growth trap11 takes the form of resistance to emergency measures—for instance, the opposition in some European countries that are perceived to be more fiscally prudent, to bail out what are seen to be more profligate countries; this may force the latter towards more fiscal austerity and induce lower growth and social opposition. Over the longer term, the trap is created by resistance to the higher taxes and reduced benefits deemed necessary to return countries to financial stability. The resistance is understandable given the weakness of income growth over the past decade, but is unlikely to hold up against the pressures for adjustment. Developing countries find themselves in a different bind. On the one hand, they need to protect themselves against volatile commodity prices and external financing conditions, in some cases through more restrictive macroeconomic policies and reserve accumulation, thereby contributing to the lack of global aggregate demand. On the other hand, they need to step up investment to sustain higher growth and reorient their economies towards faster poverty reduction and more sustainable production. In particular, they need to be mindful that the quality of growth should not be such that it deprives important groups of workers of decent jobs—not just the working poor but also the youth and, in some cases, the better educated amongst them. Feelings of the lack of a meaningful future have become a source of social tensions, most visibly in the Arab world. G20 leaders recognized these concerns to some extent in the Cannes Action Plan and announced a global strategy for growth and jobs. The plan is to address shortterm vulnerabilities, while strengthening the medium-term foundations for growth. The mix of concrete measures and policy commitments for the short run are by and large 11
The trap was so named in a recent article by Benjamin F. Friedman, “The no-growth trap”, National Interest, No. 116 (November-December 2011), available from http://nationalinterest.org/article/ the-no-growth-trap-6050.
Developed countries are in a no-growth trap
Developing countries face different policy dilemmas
26
Current policy intentions of the G20 at best provide for a scenario of “muddling through”
World Economic Situation and Prospects 2012
consistent with what is already subsumed in the baseline forecast for 2012 and 2013. It refers, if only in vague terms, to the possible implementation of some elements of the American Jobs Act proposed by the Government of the United States as well as its commitment to medium-term fiscal consolidation. It further includes Japan’s reconstruction efforts (although these are assumed to be largely tax-financed) and the coming into effect of the “comprehensive” package agreed to by the Governments of the euro area for an orderly workout of the sovereign debt crises in the area.12 It also includes the commitment of ensuring monetary policies that support economic recovery but maintain price stability in the medium run, and commitments of countries with relatively strong public finances (such as Australia, Brazil, Canada, China, Germany, Indonesia and the Republic of Korea) to let automatic stabilizers work and, in the face of worsening world economic conditions, take discretionary measures to support domestic demand. In essence, however, the Cannes Action Plan does not promise to add much more to what was already contained in Government plans enacted during 2011, when macroeconomic policies in most developed economies were already characterized by a combination of an extremely loose monetary policy stance and shifts towards fiscal austerity. The central banks of the euro area, Japan and the United States all maintained their policy interest rates at low levels and expanded the size of their balance sheets to inject more liquidity into the economy through various unconventional monetary measures. The fiscal policy stance in most developed economies was tightened through austerity measures, inducing a drain on GDP growth. In contrast, macroeconomic policy varied greatly across developing countries. Monetary tightening in efforts to stem inflation was perhaps the more common feature among major emerging economies. The Cannes Action Plan does not promise to do much more in the short run (apart for the elements highlighted above), and as the baseline projections show, would fall short of reinvigorating the world economy and bringing down unemployment. Most hopes seem to be set on strengthening the medium-term foundations for growth, but the related six-point plan13 could quickly “fall behind the curve” if the downside risks to the outlook materialize. In fact, during November of 2011 it became clear that markets have been little impressed by either the G20 Action Plan or the euro area’s package for handling the sovereign debt crisis and containing contagion to large economies. Financial turmoil continued amidst increased political uncertainty with the Government leaders of both Greece and Italy being forced to step down over the sovereign debt crisis. Italy’s borrowing costs were pushed to record highs and the world’s seventh-largest economy edged closer towards the brink of default. 12
13
This includes the agreement to (i) flexibilize and enhance the EFSF instruments to a firepower of up to €1 trillion; (ii) significantly strengthen economic and fiscal surveillance and governance of the euro area; (iii) ensure that euro area member States experiencing tensions in sovereign debt markets make stronger efforts in terms of fiscal consolidation and structural reforms; (iv) ensure the sustainability of the Greek public debt through a rigorous adjustment programme and a voluntary nominal discount of 50 per cent on Greek debt held by private investors; and (v) raise confidence in the banking sector, including by facilitating access to term funding, where appropriate, and temporarily increasing the capital position of large banks to 9 per cent of Core Tier 1 capital after accounting for sovereign exposures by the end of June 2012, while maintaining the credit flow to the real economy and ensuring that these plans do not lead to excessive deleveraging. The six-point plan to strengthen the medium-term foundations for growth agreed to by the G20 leaders in Cannes would consist of (1) commitments to fiscal consolidation; (2) commitments to boost private demand in countries with current-account surpluses, and, where appropriate, to rotate demand from the public to the private sector in countries with current-account deficits; (3) structural reforms to raise growth and enhance job creation across G20 member countries; (4) reforms to strengthen national/global financial systems; (5) measures to promote open trade and investment, rejecting protectionism in all its forms; and (6) actions to promote development.
Global economic outlook
This has increased the likelihood of the pessimistic scenario’s materializing, with the consequences outlined in the section above. In order to make the global economic recovery more robust, balanced and sustainable, the policy directions discussed in World Economic Situation and Prospects 2011 still apply, but they have taken on greater urgency. There are important commonalities with the Cannes Action Plan, but actions will need to be much more pervasive and better coordinated, especially in terms of short-term stimulus, sovereign debt resolution and orientation towards job creation, while medium-term plans should focus more strongly on sustainable growth and development and accelerated reforms of financial regulatory systems and the international monetary system.
27
The only way to overcome present economic woes is through much more pervasive policy coordination
Stronger macroeconomic stimulus… As a first step, developed countries, in particular, should be cautious not to embark prematurely on fiscal austerity policies given the still fragile state of the recovery and prevailing high levels of unemployment. While high public indebtedness is a concern and has continued to increase in most developed economies, in a number of cases (including the United States) to over 100 per cent of GDP (figure I.12), many developed country Governments still have plenty of fiscal space left for additional stimulus measures. A high debt-to-GDP ratio does not necessarily render public indebtedness unsustainable. Risk premiums on sovereign debt constitute one indication. The spreads on interest rates on public borrowing have increased significantly for Greece and a few other European economies, but they remain low (and have even decreased further) for Germany, Japan, the United States and other developed countries (figure I.13). Contrary to prevailing political pressures, the countries with fiscal space should pursue a “J-curve” approach towards fiscal adjustment (see box I.3). With high unemployment and weak private demand, a premature fiscal tightening may derail the fragile recovery and lead to further worsening, rather than improvement, of fiscal balances. Instead, the Governments of economies with low financing costs in capital markets should allow automatic stabilizers to operate and sustain or enhance deficit-financed fiscal stimulus in the short run. The additional stimulus should continue up to the point where sufficient GDP and job growth have taken effect and unemployment rates have fallen to levels at which more sustained private demand growth may be expected. In this approach, Governments would allow the fiscal deficit to widen further initially, perhaps for another two or three years, until more robust GDP and employment growth boosts Government revenues, thus facilitating swifter and less harmful budget deficit reduction. As explained further in box I.3, a J-curve process of fiscal consolidation is quite feasible provided one dollar of additional short-term stimulus translates into more than one dollar of additional aggregate demand, which is typically the case when the economy is in a downturn and even more so if the stimulus is oriented towards infrastructure and direct job creation (as argued in more detail below). A second necessary condition is that the cost of Government borrowing in capital markets (the nominal interest rate on longterm bonds) be less than the rate of potential nominal GDP growth so as to ensure a benign debt-GDP growth dynamic. This condition is currently satisfied in Germany, Japan and the United States, and several other developed countries not mired in sovereign debt distress. Given the current high degree of uncertainty in capital markets, the additional
More short-term fiscal stimulus is needed, not less
A J-curve process of fiscal consolidation is feasible
World Economic Situation and Prospects 2012
Figure I.12 Growing public debt burdens (percentage of GDP) A. Developed and emerging market economies, 2006-2013
120 100 80
Developed economies 60 40 Emerging economies 20 0
2006
2007
2008
200
2009
2010
2011
2012
2013
B. Selected developed countries, 2007 and 2011
250 2007 2011
150 100 50
Developed economies
United States
United Kingdom
Spain
Portugal
Japan
Italy
Ireland
Greece
Germany
C. Selected emerging market economies, 2007 and 2011
120 100
France
Canada
Belgium
Australia
0
2007 2011
80 60 40 20
Emerging economies
Turkey
South Africa
Russian Federation
Philippines
Pakistan
Nigeria
Mexico
Indonesia
India
China
Brazil
0
Argentina
28
Source: Data from IMF, Fiscal Monitor: Addressing Fiscal Challenges to Reduce Economic Risks (Washington, D.C., September 2011).
Global economic outlook
Figure I.13 Yields on two-year sovereign bonds in developed countries, January 2010-November 2011 A. Developed countries with low borrowing costs
2.5 France United States Great Britain
2.0
Germany Netherlands Japan
1.5
1.0
0.5
Nov-2011
Sep-2011
Jul-2011
May-2011
Mar-2011
Jan-2011
Nov-2010
Sep-2010
Jul-2010
May-2010
Mar-2010
Jan-2010
0.0
B. Developed countries with high and/or rising borrowing costs
25.0
Ireland Portugal Belgium
20.0
100.0
Italy Spain Greece (right-hand scale)
80.0
Source: JPMorgan Chase.
Nov-2011
Sep-2011
Jul-2011
May-2011
Mar-2011
0.0 Jan-2011
0.0 Nov-2010
20.0
Sep-2010
5.0
Jul-2010
40.0
May-2010
10.0
Mar-2010
60.0
Jan-2010
15.0
29
30
World Economic Situation and Prospects 2012
Box I.3 A “J-curved” fiscal adjustment?
a Valerie Ramey, “Can government purchases stimulate the economy?” Journal of Economic Literature, vol. 49, No. 3, pp. 673-685. b See, for example, Pablo Burriel and others, “Fiscal multipliers in the euro area”, session 3, No. 19 in Fiscal policy: lessons from the crisis, papers presented at the Banca d’Italia workshop held in Perugia, 25-27 March 2010 (Rome: Banca d’Italia), available from http://www.bancaditalia. it/pubblicazioni/seminari_ convegni/Fiscal_Policy/6_ Fiscal_Policy.pdf. c Jonathan Parker, “On measuring the effects of fiscal policy in recessions”, Journal of Economic Literature, vol. 49, No. 3, pp. 703-718. d For example, Alan Auerbach and Yuriy Gordnichenko, in “Measuring the output responses to fiscal policy”, American Economic Journal: Economic Policy (forthcoming), estimate that the multipliers for the United States range between 0.0 and 0.5 during economic expansions, but are much higher, in the range of between 1.0 and 1.5, during economic recessions. Jonas D. Fisher and Ryan Peters provide similar estimates in “Using stock returns to identify government spending shocks”, Economic Journal, vol. 120, No. 544, pp. 414‑436.
Three years after the onset of the Great Recession, fiscal policy in most developed economies is facing a dual challenge: the need for preventing a double-dip recession as the economic recovery falters and the need for safeguarding the fiscal sustainability in the long run. In a few European economies, the debt situation has gone beyond the limits of affordable access to refinancing in capital markets. They seem to have little option left but to frontload austerity measures with or without a deal for an orderly debt restructuring. Other developed economies, however, for which the cost of public borrowing remains low, have more space to implement a fiscal framework that allows for more stimulus in the short run to bolster the economic recovery and bring public debt to more sustainable levels over the long run. The present box postulates a possible “J-curved” trajectory for the fiscal balances of those developed economies without severe debt distress, and discusses the conditions under which such a policy approach would constitute a workable option. In the present-day context of a large fiscal deficit, below-potential growth, elevated unemployment, and continued financial deleveraging, substantial cuts in Government spending and increases in taxes may be ineffective in reducing the budget deficit. Worse still, along the lines of Keynes’s paradox of thrift, when both consumers and Governments simultaneously spend less to save more, the resulting recession and contraction of gross domestic product (GDP) would again render public debt unsustainable. Even if a double-dip recession is avoided, fiscal austerity may keep economic growth below potential for a prolonged period, thus keeping up unemployment. In this case, Government revenue will not recover sufficiently; the large budget deficit will linger and public debt will continue to rise. The view held by some analysts and policymakers in major economies that lower public deficits and debts would enhance the confidence of private sector agents, and hence could help restore growth, tends to hold little ground when unemployment is high and deleveraging firms and banks are highly risk averse. The J-curve approach brings an alternative perspective. In economies with low financing costs in capital markets, Governments have policy space to let automatic stabilizers operate and sustain or enhance deficit-financed fiscal stimulus. It would make sense to use this space up to the point where sufficient GDP and job growth have taken effect and unemployment rates have fallen to levels at which more sustained private demand growth may be expected. In this approach, Governments would allow the fiscal deficit to widen further initially, perhaps for another two or three years, until more robust GDP and employment growth boosts Government revenues, facilitating swifter and less harmful budget deficit reduction. At that point, if needed, more structural fiscal reforms may be put in place to accelerate gradual reduction of the public debt-to-GDP ratio. As a result, the fiscal balance would evolve in the shape of a J-curve: worsening initially, to improve strongly thereafter. The feasibility of achieving such a J-curve depends on a number of economic conditions. One important condition that would need to be satisfied is that the fiscal multiplier in the economy be greater than 1, meaning that an increase of one dollar in Government spending or tax cuts generates an increase of more than one dollar in GDP. If the multiplier is smaller than 1, it implies that an increase in Government spending or a tax cut will be partially offset by reductions in private consumption or investment. Consequently, as a second-round effect, Government revenue would not increase sufficiently to cause the budget deficit to fall over time. Do major developed economies meet this condition? A review of various studies shows that the estimated value of the fiscal multiplier in the United States over the past three decades has been in the range of 0.8-1.5, thus leaving some uncertainty as to whether this condition is satisfied or not.a Estimates of fiscal multipliers for European economies tend to fall into a similar range.b However, the estimate of the multiplier in most of these studies is the average value over a time span that includes both economic booms and recessions.c Indeed, the multiplier is likely to be much larger during recessions, when there is slack in capacity utilization and when households and businesses are too risk averse to spend, as is the case at present.d Moreover, the composition of fiscal stimulus will influence the size of the multiplier. Increases in Government spending on infrastructure investment, for instance, tend to have larger multipliers than tax credits or direct income transfers, especially when comparing the cumulative multiplier effects over a number of years.
31
Global economic outlook
Box I.3 (cont’d) The second necessary condition is that the cost of Government borrowing in capital markets (the nominal interest rate on long-term bonds) be less than the rate of potential nominal GDP growth. This will ensure a benign debt-GDP growth dynamic. Currently, in Germany, Japan and the United States, long-term interest rates on Government bonds are clearly lower than their respective potential nominal GDP growth rates. It is uncertain, however, whether additional Government spending and larger budget deficits would push up interest rates significantly, as has occurred in the European economies that are now facing severe debt distress. A number of complementary actions could help reduce the uncertainty in capital markets. In the present context, these would include (a) a continued commitment to accommodative monetary policies and to low interest rates; (b) support of bank recapitalization and tightening of financial regulation so as to reduce financial fragility and bank exposure to sovereign debt risk; and (c) the advancement of credible and concrete plans aimed at a more structural resolution of fiscal problems over the medium to long run. Last, but not least, the feasibility of a J-curved fiscal adjustment will be highly dependent upon political factors. It will require a broad-based trust of society in support of the Government’s taking the calculated risk of allowing a further worsening of the fiscal deficit to provide more fiscal stimulus in the short run while committing to solving the structural debt problems over the medium to long run.
short-term stimulus could cause interest rates to go up, but Governments can contain this by (a) continued commitment to accommodative monetary policies, (b) more forceful bank recapitalization measures and tighter financial regulation to address financial sector fragility and (c) credible and concrete plans aimed at a more structural resolution of fiscal problems over the medium to long run. Further strengthening of financial safety nets will also be needed to stem market uncertainty and the risk of further debt distress. The establishment of Europe’s temporary funding facilities (the EFSF and the European Financial Stabilisation Mechanism (EFSM)), the more permanent European Stability Mechanism (ESM) and related measures have brought some resolve to dealing with Europe’s sovereign debt crisis.14 However, the continued debt distress and spread of contagion to the larger European economies during the second half of 2011 suggests these measures have not been bold enough. The firepower of the financial safety nets is too limited to cope with the sovereign debt problems of countries like Italy and Spain. Finding ways to significantly enhance the firepower of the ESM will be as important as it is difficult to achieve. It may prove difficult for economic reasons, since leveraging resources for the EFSF (and ESM, for that matter) would be akin to seeking collateralized debt obligations to sub-triple A bonds, and thus may not attract large voluntary contributions. It will not be easy for institutional and political reasons either, because it requires changing the euro area treaty and overcoming opposition from countries not facing debt distress. It is clear that the euro area needs the help and involvement of other major economies, the surplus countries amongst them in particular. This would require reaching a swifter international agreement to enhance International Monetary Fund (IMF) resources 14
In response to the crisis in Greece, the European Council set up a European Financial Stabilisation Mechanism (EFSM) and a European Financial Stability Facility (EFSF) in 2010. Later, these facilities were also used to assist Ireland and Portugal. In early 2011, a permanent crisis management mechanism—the European Stability Mechanism (ESM)—with an effective lending capacity of up to €440 billion was agreed upon. The ESM is to replace the EFSM and EFSF by mid-2013. In July 2011, euro area Government leaders agreed to broaden the mandate of the ESM with a provision for precautionary lending, the provision of loans to sovereigns that are not part of a programme for restoring capital buffers, and the use of the mechanism to purchase sovereign bonds in secondary markets.
32
World Economic Situation and Prospects 2012
Debt workout mechanisms are needed in both Europe and the United States
to supplement the EFSF, and accepting a more accelerated voice and quota reform of the IMF (see below). The European Central Bank (ECB) could contribute further if it were willing to assign itself a greater role as lender of last resort. Debt workout mechanisms should not be restricted to sovereign debts in Europe. Many developed countries, the United States in particular, may face a second round of mortgage crises as so many mortgages are “under water” and problems are likely to increase with persistent high unemployment and the general weakness in housing markets. Countries facing these conditions may need to consider facilitating household bridge loan assistance and mortgage restructuring and “rent-to-start-over” plans in order to ease the process of household deleveraging and avoid large-scale foreclosures. Without such measures, the road to recovery may be much harder. The short-term policy concern for many developing countries will be to prevent rising and volatile food and commodity prices and exchange-rate instability from undermining growth and leading their economies into another boom-bust cycle. These countries would need to ensure that macroeconomic policies are part of a transparent counter-cyclical framework that would include the use of fiscal stabilization funds and strengthened macroprudential financial and capital-account regulation to mitigate the impact of volatile commodity prices and capital inflows. Strengthened social policies would need to offer sufficient income protection for the poor and vulnerable against higher food and energy prices.
…that is adequately coordinated internationally
Global rebalancing with accelerated job recovery is feasible if concerted action is taken
The second (and related) challenge is to ensure that additional short-term stimulus by economies with fiscal space is coordinated and consistent with benign global rebalancing. In Europe, instead of the present asymmetric adjustment through recessionary deflation—which concentrates most of the pain on the countries in debt distress—this would entail a more symmetrical approach of austerity and structural reforms in the countries in distress combined with euro area-wide reflation. The subsequent economic recovery would ease medium-term fiscal consolidation and debt reduction, as mentioned earlier. The United States would equally need to consider such a sequenced approach. The first priority should be to boost demand in order to reduce unemployment, especially through public investment and more direct job creation. This would help households delever and boost consumption demand through income growth. Infrastructure investment and other structural measures would underpin strengthened export competitiveness over the medium run. This would give time for China and other Asian economies to rebalance towards greater reliance on domestic demand growth, in line with existing Government plans and the intentions of the Cannes Action Plan for medium-term global rebalancing. To achieve such benign global rebalancing with accelerated job recovery seems feasible. It would be growth enhancing and would also bring public debt ratios down to sustainable proportions over the medium run. Simulations with the United Nations Global Policy Model—reflecting the key policy directions suggested above and those below regarding coordinated short-term global stimulus, orderly sovereign debt workouts and structural policies aimed at stronger job creation and sustainable development—show that this would be a win-win scenario for all economies, as it would significantly enhance GDP and employment growth compared with the baseline, while reducing public debt-to-GDP ratios and requiring limited exchange-rate realignment (see box I.4). WGP would accelerate to over 4 per cent per year during 2012-2015, especially since developed
33
Global economic outlook
economies would be lifted from their anaemic growth, while developing countries would also reach a higher growth path compared with the baseline situation, where policy coordination is absent. Most importantly, employment rates, especially among developed countries, would recover to near pre-crisis levels, a situation which would remain elusive in the baseline forecast. Also, in developing countries, employment growth would be significantly higher. By and large, the 64 million jobs’ deficit resulting from the global crisis of 2008-2009 would have dissipated by 2016 in this scenario. Even given such a perhaps slow employment recovery, the scenario underscores that providing more fiscal stimulus in the short run and avoiding premature fiscal austerity is a feasible way of dealing effectively with the global jobs crisis while at the same time inducing a benign and more sustainable rebalancing of the global economy.
Box I.4 A coordinated strategy for jobs and growth A scenario of strengthened international policy coordination aimed at dealing with the jobs crisis and averting a double-dip recession was simulated using the United Nations Global Policy Model.a The Model takes on board the key policy directions suggested in the report, including a stronger role for fiscal policy in the short-term outlook—one that gives priority to employment generation and greener growth through better-targeted Government spending, private investment incentives and structural policies. In the policy simulation, there is no premature fiscal austerity overall, and growth of Government spending is kept positive across major economies and regions. Public spending increases at a rate below gross domestic product (GDP) growth, in such a way that budget deficits and public debt-to-GDP ratios are gradually reduced over time. At the same time, policies are assumed to be coordinated to a certain degree with stronger fiscal impulses provided in countries with more fiscal space, as well as in the surplus economies, so as to help bring about a global rebalancing. The scenario further assumes that fiscal and monetary policies in developed economies are redesigned in ways suggested in the text, aimed at putting GDP growth on a path towards reaching levels of (noninflationary) potential output, with an initial post-recession acceleration and with employment rates approaching pre-crisis levels. Furthermore, it is assumed that effective debt workout mechanisms and financial safety nets are put in place to contain the abnormal rise in interest rates on sovereign debt, and that the impulses to enhance short-term employment and output growth will restore consumer and investor confidence and normalization of the credit supply. Emerging and developing countries are also assumed to engage in additional fiscal stimulus in this policy scenario, but the degree of stimulus has been tailored to the available fiscal space in each country grouping using the initial level of public indebtedness as a benchmark. Since greater fiscal space in most cases appears to be closely associated with larger external surpluses accumulated in the recent past, the simulated pattern of stimulus measures across countries is thus helping the global rebalancing. Furthermore, it is assumed that developing countries use most of the stimulus to strengthen investment in infrastructure and sustainable productive capacity in agriculture and energy, and that they gain greater access to developed country markets along with efforts to diversify their export base. This implicitly assumes that multilateral trade rules and a strengthened aid-for-trade programme are supportive of these developments. In low-income countries in particular, the increased public and private investment would lead to larger external deficits in the early years of the simulation period. The simulation assumes these countries have adequate access to official development assistance and other external financing to cover those deficits. Under these assumptions, growth of world gross product would move up to about 4.0 per cent per annum, with both developed and developing economies seeing growth accelerate by between 1 and 2 percentage points in comparison with the baseline (see figure A). Most importantly, employment rates, especially among developed countries, would return to near pre-crisis levels, unlike those in the baseline scenario (figure B). Also, in developing countries, employment growth would be
a Available from http:// www.un.org/en/ development/desa/policy/ un_gpm.shtml.
34
World Economic Situation and Prospects 2012
Box I.4 (cont’d)
Figure A GDP growth of selected major economies and country groupings, 2009-2016 (percentage)
Baseline
10
Coordinated strategy for jobs and growth
8
(i) Europe, Japan and other developed economies
6 4 2 0 -2 -4 2009
2010
2011
2012
2013
2014
2015
2016
2014
2015
2016
2015
2016
(ii) United States
10 8 6 4 2 0 -2 -4 2009
2010
2012
2013
(iii) Transition and developing economies
10 8
2011
China and India
6 4 CIS, Western Asia and other developing economies 2 0 -2 -4 2009
2010
2011
2012
2013
2014
35
Global economic outlook
Figure B Employment rates of selected major economies and country groupings, 2008-2016 (percentage of working-age population)
Box I.4 (cont’d)
(i) Europe, Japan and other developed economies
70
Baseline Coordinated strategy for jobs and growth
68 66 64 62 60 58 2008
2009
2010
2011
2012
2013
2014
2015
2016
2013
2014
2015
2016
(ii) United States
70 68 66 64 62 60 58 2008
2009
2010
2011
2012
(iii) Transition and developing economies
70 68
China and India
66 64 62 60 CIS, Western Asia and other developing economies 58 2008
2009
2010
2011
2012
2013
2014
2015
2016
Source: UN/DESA Global Policy Model (http://www. un.org/en/development/ desa/policy/un_gpm.shtml).
36
World Economic Situation and Prospects 2012
Box I.4 (cont’d) significantly higher. The employment deficit caused by the global crisis of 2008-2009, estimated at 64 million jobs worldwide in 2011, would by and large dissipate by 2016, although, in the present scenario, would still fall slightly short of the global employment rate seen in 2007. The simulation results show further that these outcomes are achievable alongside improving fiscal balances and stabilizing public debt ratios over the medium run (as shown in the appendix table to this chapter), with a gradual decline thereafter. Government budget balances would quickly shift towards the upward slope of the J-curve (see box I.3), given the relatively mild, but well-targeted, fiscal impulses assumed in the scenario. Current-account imbalances would be reduced gradually, in part because surplus countries are providing greater fiscal stimuli that would trigger stronger domestic private investment and consumption growth in those countries. With investments in energy efficiency and more sustainable (and greener) energy supplies, world energy prices would stabilize to lower levels over the medium run. Food prices would also stabilize as stronger demand is met with more rapidly increasing supply underpinned by increased investment in sustainable food production. Thus, external surpluses of major commodity exporting economies would also adjust gradually. Even with such a perhaps slow employment recovery, this scenario underscores that providing more fiscal stimulus in the short run and avoiding premature fiscal austerity is a feasible way to effectively deal with the global jobs crisis while at the same time inducing a benign and more sustainable rebalancing of the global economy. However, it would require much more forceful international policy coordination and a shift in the orientation of the Cannes Action Plan of the Group of Twenty (G20).
Redesigning macroeconomic policies for jobs growth and sustainable development Fiscal policies, in tandem with income and structural policies, will need to be reoriented to foster job creation and green growth
The third related challenge will be to redesign fiscal policy—and economic policies more generally—in order to strengthen its impact on employment and aid in its transition from a pure demand stimulus to one that promotes structural change for more sustainable economic growth. Thus far, stimulus packages in developed countries have mostly focused on income support measures, with tax-related measures accounting for more than half of the stimulus provided. In contrast, in many developing countries, such as Argentina, China and the Republic of Korea, infrastructure investment has tended to make up the larger share of the stimulus and strengthened supply-side conditions. The optimal mix of supporting demand directly through taxes or income subsidies or indirectly through strengthening supply-side conditions, including by investing in infrastructure and new technologies, may vary across countries. In most contexts, however, direct Government spending tends to generate stronger employment effects. A prudent policy would be to target public investments towards alleviating infrastructure bottlenecks that mitigate growth prospects, and to supplement this policy with fiscal efforts to broaden the tax base. One priority area would be to expand public investment in renewable clean energy as part of commitments to reduce greenhouse gas (GHG) emissions and in infrastructure that provides greater resilience to the effects of climate change.15 Such a reorientation of stimulus measures has the potential to provide significantly greater employment effects, as the renewable energy sector tends to be more labour-intensive than existing, non-renewable energy generation. The redesigned fiscal strategy would also need to monitor closely the way in which income growth and productivity gains are shared in society. Recent studies 15
As shown in annex table A.22, GHG emissions in the Annex I countries to the Kyoto Protocol are projected to decline by about 1 per cent per year during 2011-2013 given the slow recovery in GDP growth and existing plans for improving energy efficiency and emissions reductions. However, the pace of the reduction is too slow to meet the agreed targets under the Kyoto Protocol.
Global economic outlook
37
by the IMF, the ILO and the United Nations Conference on Trade and Development (UNCTAD) suggest that rising inequality has implications for the effectiveness of macroeconomic policies and global rebalancing.16 Declining wage shares (resulting from higher unemployment and underemployment or lagging real wage growth) may undermine consumption growth and thereby contribute to national and international imbalances. Labour market and income policies may thus need to supplement fiscal and monetary policies for a more balanced outcome. In particular, allowing labour incomes to grow at the pace of productivity growth can help underpin a steady expansion of domestic demand and prevent income inequality from rising. The supplementary policies could target the unemployed by, for example, providing job-search training, short-term vocational training or general and remedial training. These policies have worked in a number of countries to compensate for sharp declines in vacancies. Social protection policies are another crucial element in cushioning the impact of economic shocks and helping people avoid falling into poverty. They are also important tools for boosting aggregate demand and contributing to the sustainability of economic growth. Just as social transfers, such as family benefits, unemployment benefits and other cash transfers, help protect household consumption against shocks or crises, they also prevent asset depletion that may have adverse long-term consequences and further undermine a sustainable recovery.
Addressing international financial market, commodity price and exchange-rate volatility The fourth challenge is to find greater synergy between fiscal and monetary stimulus, while counteracting damaging international spillover effects in the form of increased exchangerate tensions and volatile short-term capital flows. This will require reaching agreement at the international level on the magnitude, speed and timing of quantitative easing policies within a broader framework of targets to redress the global imbalances. This, in turn, will require stronger bilateral and multilateral surveillance, including through more thorough assessment of spillover effects and systemic risks. While this need has been recognized by the G20 and the International Monetary and Financial Committee of the IMF, accelerated progress needs to be made in order to establish an operational framework that will enable timely and concerted action to be taken to (a) address the present major risks in global currency and financial markets and (b) signal when, for example, monetary policies in major developed countries are likely to influence the size and composition of flows to emerging and other developing countries. Cooperative policy solutions should, therefore, take precedence as they can achieve better outcomes for the global economy and offload pressures on developing countries to take strong measures to mitigate the impact of volatile capital flows. Such cooperative policy solutions should also comprise deeper reforms of (international) financial regulation, including those aimed at addressing risks outside the traditional banking system (investment banks, hedge funds, derivatives markets, and so forth). Requiring higher reserve requirements and/or collateral on cross-border portfolio 16
See Andrew Berg and Jonathan D. Ostry, “Inequality and unsustainable growth: two sides of the same coin?”, IMF Staff Discussion Note, SDN/11/08 (Washington, D.C.: International Monetary Fund, 8 April 2011); International Labour Organization (ILO), World of Work Report 2011 (Geneva), chap. 3; and United Nations Conference on Trade and Development, Trade and Development Report 2011: Post-crisis policy challenges in the world economy (United Nations publication, Sales No. E.11. II.D.3), pp. 16-22.
Better coordinated monetary policies and deeper financial reforms are needed to curtail capital flow, exchange-rate and commodity price volatility
38
World Economic Situation and Prospects 2012
investments by non-banking institutions and setting limits on positions that financial investors can take in commodity futures and derivatives markets may also help stem some of the volatility in capital flows and mitigate commodity price volatility. Such measures will, by no means, provide sufficient safeguards against continued volatility in food, energy and other commodity prices. To achieve that, much more will need to be done to ensure a more sustainable supply of these commodities. These sets of financial reforms will need to be complemented by deeper reforms of the global reserve system, reducing dependence on the dollar as the major reserve currency through, for example, a better pooling of reserves internationally. The sovereign debt crisis in Europe has emphasized the need for much stronger internationally coordinated financial safety nets. This could be achieved through enhancing IMF resources and closer cooperation between the IMF and regional mechanisms of financial cooperation (not just in Europe, but also those in Asia, Africa and Latin America) and through enhancing the role of Special Drawing Rights (SDRs) as international liquidity, while expanding the basket of SDR currencies to include currencies from major developing countries. Such reforms are in the G20 pipeline, but have been sliding down the agenda. Global stability will require that these be moved up the priority list.
Adequate development financing Ensuring more predictable access to development finance for developing countries will require further reforms to the international financial architecture
The fifth challenge is to ensure that sufficient resources are made available to developing countries, especially those possessing limited fiscal space and facing large development needs. These resources will be needed to accelerate progress towards the achievement of the MDGs and for investments in sustainable and resilient growth, especially in the LDCs. Apart from delivering on existing aid commitments, donor countries should consider mechanisms to delink aid flows from their business cycles so as to prevent delivery shortfalls in times of crisis, when the need for development aid is at its most urgent. More broadly, the global crisis and the recent financial turmoil have highlighted the need for very large liquidity buffers to deal with sudden, large capital market shocks. Many developing countries have continued to accumulate vast amounts of reserves ($1.1 trillion in 2011) as a form of self-protection. But doing so comes with high opportunity costs and is contributing to the problem of the global imbalances. A better pooling of reserves, regionally and internationally, could reduce such costs to individual countries and could also form a basis for more reliable emergency financing and the establishment of an international lender-of-last-resort mechanism. Broadening existing SDR arrangements could form part of such new arrangements.
39
Global economic outlook
Appendix A coordinated policy scenario for job creation and stronger global growth, 2011-2016 2011
2012
2013
2014
2015
2016
1.6 1.7 0.2 9.0 5.8 4.1
2.7 2.4 2.3 9.0 6.0 5.5
3.2 2.4 2.3 8.8 6.3 5.5
3.2 2.3 2.5 8.7 6.5 5.6
3.2 2.3 2.5 8.6 6.4 5.6
3.2 2.3 2.5 8.5 6.4 5.6
2.2 1.4 0.1 2.8 0.6 2.7
3.6 2.8 0.6 4.8 1.2 5.2
5.0 3.9 1.2 6.9 1.7 8.1
6.4 4.8 1.5 10.0 2.4 12.1
7.8 5.7 1.8 13.6 3.1 16.7
1.0 0.0 1.6 6.5 5.6 5.8
1.3 0.3 1.4 6.8 4.5 5.2
1.7 0.5 1.2 7.5 4.2 5.1
1.8 0.5 1.1 7.4 4.9 5.2
1.9 0.5 1.1 7.2 5.1 5.2
-2.2 -0.5 2.8 8.1 11.3 6.6
5.2 3.9 4.9 8.1 8.4 7.7
7.0 4.6 4.2 8.0 7.2 7.6
7.3 4.4 3.6 7.6 7.9 7.8
6.9 3.9 3.1 7.4 7.9 7.9
-8.6 -4.8 -1.9 -2.8 -2.7 -3.3
-7.3 -4.1 -1.7 -2.2 -2.0 -3.1
-6.5 -3.5 -1.5 -1.8 -1.5 -3.0
-5.9 -3.0 -1.1 -1.5 -1.0 -2.8
-5.4 -2.5 -0.8 -1.2 -0.7 -2.7
5.7 3.6 1.6 5.8 7.1 4.1
4.9 3.1 1.3 4.8 6.2 3.8
4.2 2.6 1.1 4.2 5.6 3.7
3.5 2.1 0.9 3.6 5.4 3.5
3.0 1.7 0.7 3.1 5.2 3.4
GDP growth (percentage) United States Europe Japan and other developed countries China and India CIS and Western Asia (major oil exporters) Other developing countries
Additional employment with respect to the baseline (millions) United States Europe Japan and other developed countries China and India CIS and Western Asia (major oil exporters) Other developing countries
0.0 0.0 0.0 0.0 0.0 0.0
Growth of government spending (constant prices, percentage) United States Europe Japan and other developed countries China and India CIS and Western Asia (major oil exporters) Other developing countries
1.1 0.0 1.6 6.4 4.3 4.9
Growth of private investment (constant prices, percentage) United States Europe Japan and other developed countries China and India CIS and Western Asia (major oil exporters) Other developing countries
-1.1 2.4 3.7 8.9 13.9 7.0
Fiscal balance (net government financial surplus, percentage of GDP) United States Europe Japan and other developed countries China and India CIS and Western Asia (major oil exporters) Other developing countries
-10.0 -6.0 -1.7 -3.6 -3.1 -3.2
Net private sector financial surplus (percentage of GDP) United States Europe Japan and other developed countries China and India CIS and Western Asia (major oil exporters) Other developing countries
6.5 4.7 2.2 7.1 9.0 4.3
40
World Economic Situation and Prospects 2012
Appendix (continued) 2011
2012
2013
2014
2015
2016
-3.1 -1.3 0.5 3.4 5.9 1.1
-2.9 -1.2 -0.2 3.0 4.4 0.8
-2.5 -1.0 -0.4 2.7 4.1 0.7
-2.3 -0.9 -0.4 2.4 4.2 0.7
-2.4 -0.8 -0.3 2.1 4.4 0.7
-2.4 -0.8 -0.2 1.9 4.5 0.7
84 81 146 18 35 44
87 82 141 19 38 47
89 83 142 17 38 49
90 85 144 17 36 50
90 86 145 18 35 51
89 87 146 18 34 51
2.8
3.9
4.0
4.1
4.1
4.1
3.8
4.8
4.9
5.0
5.0
5.1
0.0
9.7
18.2
26.8
37.3
48.8
-63.8
-58.9
-53.1
-44.3
-29.1
-6.4
8.4 1.5
11.3 1.6
9.3 1.5
8.2 1.4
7.6 1.4
6.8 1.4
1.0 1.0
1.0 1.1
1.0 1.1
1.0 1.1
1.0 1.1
1.0 1.1
Current-account balance (percentage of GDP) United States Europe Japan and other developed countries China and India CIS and Western Asia (major oil exporters) Other developing countries Government debt a (percentage of GDP) United States Europe Japan and other developed countries China and India CIS and Western Asia (major oil exporters) Other developing countries Memorandum items Growth of gross world product at market rate (percentage) Growth of gross world product at PPP rate (percentage) Global creation of employment above baseline (millions) Employment gap compared with 2007 employment rate (millions) Growth of exports of goods and services (percentage) Real world price of energy (index) Real world price of food and primary commodities (index) Real world price of manufactures (index)
Source: UN/DESA Global Policy Model, available from http://www.un.org/en/development/desa/policy/un_gpm.shtml. a Public debt is measured on a cash basis and, data permitting, nets out intragovernment debt.
41
Chapter II
International trade Slowing merchandise trade The recovery of world trade was as vigorous in 2010 as had been its decline in 2009. It lost a great deal of momentum in 2011, however, with the growth of world trade volume slowing from 12.6 per cent in 2010 to 6.6 per cent. Weaker global economic growth, especially among developed economies, is the major factor behind the deceleration. As a result, over the four-year period that started with the sharp deceleration of world trade in 2008, the level of world import volume has remained well below trend.1 In the baseline outlook for 2012 and 2013 (see chap. I), global economic activity would falter without going into recession. Even with the possibly optimistic assumptions of the baseline, world trade would continue to drift further away from the trend (figure II.1). Against this benchmark, the volume of world trade would be 30 per cent below the level that might have been reached had there been no global financial crisis. During the crisis, import volume of developing countries fell to about 13 per cent below trend, but recovered strongly, to catch up almost fully with the rapidly rising trend experienced in the early 2000s (figure II.2). In 2010, developing country import growth contributed to half of world trade growth (compared with 43 per cent in the pre-crisis period of 2004-2007). Among developing regions, East and South Asia led the recovery in
Growth in world trade decelerated in 2011 with the weakening of developed economies
Figure II.1 Below-trend growth of world merchandise trade, 2002-2013 15 240
World import volume (left-hand scale) World gross product (left-hand scale)
220
World import trend (2001-2007) (right-hand scale)
200
World import level (2001=100) (right-hand scale)
180
0
160
140
120
-15
100 2002
2003 1
2004
2005
2006
2007
2008
2009
2010
2011a
This refers to the continued linear trend estimated for 2001-2007.
2012b
2013b
Source: UN/DESA. a Partly estimated. b Projections.
42
World Economic Situation and Prospects 2012
Figure II.2 Diverging trends in world import growth, 2002-2013 Import trend, developing countries (2001-2007) Import level, developing countries (2001=100) Import trend, developed countries (2001-2007) Import level, developed countries (2001=100)
300
250
200
150
Source: UN/DESA. a Partly estimated. b Projections.
100
2002
2003
2004
2005
2006
2007
2008
2009
2010
2011a
2012b
2013b
external demand, accounting for about three quarters of the growth of imports of developing economies in 2010, followed by Latin America and the Caribbean, accounting for 17 per cent; Western Asia and Africa contributed about 7.0 and 2.0 per cent, respectively. China continues to be the key driver of import growth among developing countries, accounting for 37 per cent of the growth of imports of all developing countries in 2010. The below-trend recovery of global trade is almost fully explained by the weaker import demand in developed economies. Import demand had declined to 21 per cent below trend by 2009 and did not catch up thereafter. The gap is expected to widen further, to 30 per cent by 2013, in the baseline scenario.
Shifting patterns of merchandise trade The marked weakness of import demand from developed countries following the collapse in 2008-2009 comes on top of a decade-long decline of their predominance in international trade. Between 1995 and 2010, their value share in world merchandise trade declined from 69 to 55 per cent, while that of developing countries increased from 29 to 41 per cent (figure II.3). Over this 15-year period, China’s share alone increased fourfold from 2.6 per cent to about 10.0 per cent. Over the same period, the market share of Latin America and the Caribbean increased from 4.5 per cent to 5.9 per cent. The value of Africa’s merchandise exports rose from $100 billion in 1995 to $560 billion in 2010, while its share in world trade improved modestly from 2.0 per cent to 3.2 per cent. World market penetration of exports from the least developed countries (LDCs), small island developing States (SIDS) and landlocked developing countries (LLDCs) remains extremely limited. For example, even though LDC exports have grown over fivefold since 1995, their world
43
International trade
Figure II.3 Gains and losses in world market shares of merchandise tradea 80 1995 70
2000 2007
60
2010
50 40 30 20 10 0 Developed countries
Developing countries
Economies in transition
Emerging economiesb
China
India
market share is still less than 1 per cent. World market shares of SIDS and LLDCs amount to much less than 1 per cent. The shifting patterns of trade are associated with the rapid industrial growth of a range of developing countries. Moving from agricultural and other primary production to manufacturing tends to drive up the import intensity of production; moreover, global trade increasingly involves value chains with different geographical locations contributing various parts to the production processes. Such shifting patterns of trade, as well as the increased demand for primary commodities from the rapidly growing economies, has strengthened South-South trade (figure II.4). South-South trade increased at a rate of 13.7 per cent per year between 1995 and 2010—well above the world average of 8.7 per cent. Over the same period, the South’s merchandise exports to the North increased by 9.5 per cent per annum. While recent import demand in most developing countries has remained vigorous, only a few of these countries have succeeded in climbing up the global value chain and diversifying their export base to cater to markets previously dominated by developed economies. Indeed, about 83 per cent of the increase in the share of developing countries’ total world trade between 1995 and 2010 (figure II.3) was accrued by the subset of emerging economies (the BRICS2 plus Mexico and the Republic of Korea). East and South Asia include three of the most dynamic emerging economies—China, India and the Republic of Korea—accounting for about one third of world exports and two thirds of developing country exports in 2010. Some of these gains, as noted, result from growing cross-border specialization involving smaller segments of value chains, which in turn increase trade shares and the value of shipments, imports and exports (box II.1). 2
Brazil, the Russian Federation, India, China and South Africa.
Source: UN/DESA. a Share of total exports and imports in total world exports and world imports. b Includes Brazil, China, India, Mexico, the Republic of Korea, the Russian Federation and South Africa.
South-South trade has expanded rapidly
44
World Economic Situation and Prospects 2012
Figure II.4 Developed (North)a and developing (South)a economies, bilateral shares in world exports, 1995 and 2010 60 1995 2010
50
40
30 Source: UNCTAD secretariat calculations, based on UN Comtrade, available from http://comtrade.un.org/db/. a Developed economies (North) and developing economies (South) are based on the UN/UNCTAD country classification. b Exports from North to South. c Exports from South to North.
20
10
0 North-North
North-Southb
South-Northc
South-South
Box II.1 Maritime transportation underpinning the growing role of the South in world trade Maritime transport handles over 80 per cent of the volume of global trade and accounts for over 70 per cent of its value. Since 1970, global seaborne trade has expanded on average by 3.1 per cent every year, reaching an estimated 8.4 billion tons in 2010. At this pace, and assuming no major upheaval in the world economy, global seaborne trade is expected to increase by 36 per cent in 2020 and to double by 2033. While bulk trade accounts for the largest share of global seaborne trade by volume, the containerized cargo contribution grew more than threefold between 1985 and 2010. Developing countries are driving growth in global merchandise trade, with SouthSouth links emerging strongly. Africa and Latin America are increasingly becoming suppliers of China’s primary commodity needs and, in return, China’s consumer goods are being exported more and more to these regions. These developments are shaping the configuration of maritime transportation. Figure A illustrates the changing position of developing countries in global seaborne trade between 1970 and 2010. The share in unloaded goods grew from 18 to 56 per cent, mainly owing to rising import volumes. As shown in figure B, Asia’s share of unloaded goods increased from 6.4 to 45.9 per cent over the same period, confirming Asia’s increasing share of world trade. Uncertainties in the global supply of shipping capacity In 2010, deliveries of new vessels reached a 36-year record high, increasing the world’s maritime carrying capacity by 11.7 per cent. The surge in deliveries following the deep economic downturn and trade collapse of 2009 reflects the prevailing time lag between orders and deliveries inherent in the shipbuilding industry. The massive order book of 2008, placed when the world economy and trade were booming, led to record ship deliveries in 2010 following the fragile recovery.
45
International trade
Box II.1 (cont’d) Figure A Share of developing countries in world volume of goods, loaded and unloaded, 1970, 1980, 1990, 2000 and 2010 70
Percentage of world total, tons Goods loaded
Goods unloaded
60
50
40
30
20
10
0
1970
1980
1990
2000
2010
Source: UNCTAD, Review of Maritime Transport, various issues, Geneva.
Figure B Share of world volume of goods, loaded and unloaded, by developing regions, 1970 and 2010 50 45
Percentage of world total, tons Goods loaded
Goods unloaded
40 35 30 25 20 15 10 5 0 Africa
Asia 1970
Latin America and the Caribbean
Africa
Asia 2010
Latin America and the Caribbean
Source: UNCTAD, Review of Maritime Transport, various issues, Geneva.
46
World Economic Situation and Prospects 2012
Box II.1 (cont’d) In the next few years, analysts forecast a continued oversupply of deliveries in the dry bulk and container sectors. Moreover, some indicators hint at the continued expansion of shipyard capacities in countries such as China and the Republic of Korea well beyond current market requirements. On the one hand, the current imbalance in ship carrying-capacity strongly challenges the shipping industry, as oversupply exerts a dampening effect on freight rates and revenues. Increased ship sizes pose a further challenge to owners, who need to find ever-larger shipments of cargo to achieve the economies of scale required to operate these larger ships with a profit. On the other hand, this may be good news for importers and exporters, as there should be no lack of affordable shipping capacity to carry the moderate revival of world trade expected for 2012. Investing in seaports and trade infrastructure as a counter-cyclical strategy
a UNCTAD, Review of Maritime Transport 2011 (United Nations publication, forthcoming).
Mirroring growth on the demand and supply sides, world container port throughput increased by an estimated 12.6 per cent, to 528.8 million twenty-foot equivalent units (TEUs), in 2010 after stumbling briefly in 2009. Forecasts for 2011 and 2012 are for continued double-digit growth, strengthened by the resumption of many port expansion projects put on hold during the economic downturn. Keeping in mind the long-term requirements for a country’s foreign trade expansion and the fact that a decline in transport investment today will inevitably entail future capacity restrictions on trade, transport infrastructure investments should be seen as a counter-cyclical policy option with the advantage of contributing to fostering long-term growth through trade. The expansion of maritime trade is accompanied by the opportunity for operational economies of scale. Indeed, the technological developments required for the efficient management of port services and infrastructure have also encouraged the construction of increasingly larger ships. In this rapidly changing environment, transport connectivity seems key in determining the extent to which cost savings derived from economies of scale are passed on to importers and exporters. The resulting improvements in competitiveness are critical to ensuring a country’s effective integration into global trading networks. However, as developing countries strive for improved infrastructure capacity, they will be confronted with increasing concentration of shipping services. Recently, the United Nations Conference on Trade and Development (UNCTAD) found that 35 coastal countries were served by only three or fewer liner companies in 2011.a In other words, the consolidation of services provided by the container shipping industry to achieve improved operational efficiency may also have reduced negotiating powers for some players and resulted in less overall market efficiency in some market segments.
For example, as shown in figure II.5, the share of intraregional trade within the Association of Southeast Asian Nations (ASEAN) as a proportion of ASEAN trade with the rest of the world increased by 2.4 percentage points (from 21.4 to 23.8 per cent) between 2002 and 2010. Meanwhile, the share of total ASEAN trade with China, Japan and the Republic of Korea increased from 26.7 to 29.8 per cent.3 As a result, in 2010, trade within this broader region accounted for more than half of the value of total ASEAN goods traded worldwide. The trade gains from such regional trade are unevenly distributed, however. While the share of the Republic of Korea in total ASEAN trade remained constant, at about 4.6 per cent, that of China doubled to reach 14.3 per cent, mostly at the expense of the share of Japan. It would thus seem that regional trade agreements are not the only driving force behind strengthened intraregional trade; much is likely associated with the reshaping of world trade by global production chains.
3
ASEAN and the three countries mentioned in the text agreed to strengthen economic ties in 1997. This broader regional cooperation is sometimes referred to as ASEAN Plus Three (ASEAN+3 or APT).
47
International trade
Figure II.5 Shifting total trade market shares in Asia, 2002-2010 35
Percentage share of each category over total ASEAN trade with the world
30
25
ASEAN trade with China, Japan and Republic of Korea
20
Intra-ASEAN trade
15 ASEAN trade with Japan 10 ASEAN trade with China 5 ASEAN trade with Republic of Korea 0 2002
2003
2004
2005
2006
2007
2008
2009
2010
Source: UN/DESA, based on data from the International Trade Center. Note: Some values for 2005‑2007 are interpolated from values in 2004 and 2008.
Volatile terms of trade Trade affects national income through three factors: prices of exports, prices of imports and the volume of demand.4 The international terms of trade (defined as the ratio of the average export price and import price indices) provide a synthetic measure of relative price changes over time. Preliminary estimates for 2011, suggest that the terms of trade of mineral- and oil-exporting economies have continued their rebound from the export price collapse in 2009 (figure II.6).5 In contrast, the terms of trade for economies relying on manufactured exports have deteriorated on average. Exporters of minerals, including oil, have seen dramatically large price shocks since 2007. Yet, world market prices for those commodities seem to be on a longer term upward trend (see below). In 2011, mineral exporters experienced strongly improved terms of trade, in part since prices of some precious metals increased sharply because heightened global economic uncertainty raised their importance as a store of value. Regional aggregates of the combined shocks caused by the changes in the terms of trade and in the volume of export and import demand are shown in figure II.7A, and 4
5
These factors can be calculated, with some degree of accuracy, by combining information from UN Comtrade (import and export structure), the United Nations Conference on Trade and Development (UNCTAD) and other sources (international prices), and the Central Planning Bureau of the Netherlands (CPB) and other sources (volume changes of imports and exports). See also Alex Izurieta and Rob Vos, “Measuring the impact of the global shocks on trade balances via price and demand effects”, World Economic Vulnerability Monitor, Methodological Notes, available from http://www.un.org/en/development/desa/policy/publications/wevm/monitor_note.pdf. Estimates for 2011 are extrapolations from observed data covering the first nine months of the year. The forecasts for 2012 and 2013 are based on trade volume and commodity prices implied by the baseline scenario for global trade and output growth presented in chapter I.
Terms of trade have improved for mineral and oil exporters
Primary commodity exporting countries are facing the biggest trade shocks
48
World Economic Situation and Prospects 2012
Figure II.6 Barter terms of trade of selected groups of countries, by export structure, 2000-2013 240
Index: 2000=100 Oil exporters Exporters of minerals and other mining products Exporters of agricultural products Exporters of manufactures
220 200 180 160 140 120 100 80 Sources: UNCTADStat and UN/DESA World Economic Vulnerability Monitor (WEVUM).
Countries with diversified exports or those specialized in manufactures have been less vulnerable to trade shocks
60 2000
2001
2002
2003
2004
2005
2006
2007
2008
2009
2010
2011
2012
2013
trade shocks by country groupings, according to export specialization, in figure II.7B.6 All regions faced negative trade shocks in 2009, followed by a turnaround during the global economic recovery of 2010-2011. The adverse shock of 2009 was mainly caused by the massive contraction of global demand (more than 3 per cent of world income), but in part also by the collapse in commodity prices. The trade shocks were strongest among the economies in transition and countries in Western Asia and Africa. Because of the sharp fluctuations in energy and other commodity prices, energy exporters faced the strongest trade shocks, followed by mineral exporters. Agricultural exporters suffered less dramatic trade shocks, in part because many of them are net energy importers and hence see commodity price shocks that affect both sides of their external balances. For similar reasons, most LDCs have not seen comparably strong terms of trade shocks, despite the large swings in commodity prices. LDCs consist of a heterogeneous group of economies, encompassing a wide range of export specializations, from energy and minerals to agricultural and manufacturing exporters. Given the variety of export structures, LDCs, as a group, resemble an “export-diversified” economy on average, but individual countries have faced large shocks because of their skewed export base and/or high dependence on food and energy imports. Economies with more diversified export specialization have faced milder trade shocks over the past three years and also have more stable export revenues and levels of import demand, enabling more stable output growth. A similar pattern is observed for 6
The figures show the total trade shock estimated as the change in export prices times the volume of the previous year’s exports, minus the change in import prices times the volume of last year’s imports, plus changes in the volume of import demand times the price of last year’s imports. The table in the appendix to the present chapter provides a breakdown of the components of the trade shock.
49
International trade
Figure II.7 Trade shocks by region and export specialization, 2001-2013 (percentage of GDP of the group as a whole) A. By region
15
2001-2007
12 9
2008
6
2009
3
2010-2011a
0 -3
2012-2013b
-6 -9
Least developed countries
Africa
East and South Asia
Western Asia
Latin America and the Caribbean
Economies in transition
Developed economies
World
-12 -15
B. By main sector of export specialization
15 12 9 6 3 0 -3 -6 -9 -12
Diversified
Manufacture (> 50 per cent)
Agriculture (> 40 per cent)
Minerals (> 40 per cent)
Energy (> 40 per cent)
Whole region (W)
-15
countries specializing in manufactured exports, which, although having suffered a decline in their terms of trade, have also seen steady demand growth for their exports. In the outlook for 2012 and 2013, trade shocks are forecast to be mild when measured as annual averages. Trade volumes are expected to show moderately positive growth in the baseline scenario, while most commodity prices, except those of some minerals, especially precious metals, are assumed to experience corrections from the sharp increases witnessed during 2010 and the first half of 2011.
Source: UN/DESA World Economic Vulnerability Monitor (WEVUM). a Partly estimated. b Projections.
50
World Economic Situation and Prospects 2012
Unstable commodity markets The rebound in commodity prices continued upwards until mid-2011
Slow supply expansion and rising demand have pushed up prices
Primary commodity prices boomed from 2003 to mid-2008, constituting the longest rally of the post-Second World War period and following almost three decades of low, albeit volatile, prices. The boom came to an abrupt end with the global financial crisis. Commodity prices collapsed with the fall in global demand, exacerbated by a drop in investments in commodity derivatives due to financial sector deleveraging. Prices rebounded strongly from the second quarter of 2009 in line with the global recovery, but in particular with the resumption of robust growth in emerging and other developing countries (figure II.8). The upward cycle continued for all major commodity groups until the middle of 2011. In the case of metals, agricultural raw materials and tropical beverages, average price levels for the year 2011 as a whole in fact surpassed 2008 averages. The rebound in commodity prices can be explained in part by the “pincer effect” of a tightening market caused by supply constraints and continuously growing demand for commodities, especially from emerging economies. Insufficient investments in oil production and refinery capacity, along with supply shocks caused by, inter alia, the political unrest in the Middle East and North Africa, have constrained oil markets. In the case of food and agricultural markets, a variety of factors have held back supply and kept markets tight, including adverse weather patterns caused by greater climatic variability, declining productivity growth in some regions, low levels of inventories, and increasing scarcity of arable farmland and water. Measures in recent years by Governments in a number of countries, including export restrictions and subsidies on the use of food crops for biofuel production, have further increased scarcity in the markets for food crops in particular. Figure II.8 Total non-oil commodity price index, 2000-2011a 350
Index: 2000=100 Dollar Special Drawing Rights
300
250
200
150
100
2011
2010
2009
2008
2007
2006
2005
2004
2003
2002
2001
50 2000
Source: UNCTAD. a Average of the first nine months.
51
International trade
Financial factors have had a visible impact on recent commodity price trends and volatility. The longer term trend towards a depreciating United States dollar has exacerbated the upward trend in commodity prices, since most commodity trade is in dollars and traders demand higher prices in order not to lose revenue because of the exchange-rate effect. Weak regulation of financial derivatives markets and policies of keeping interest rates low have pushed massive financial investments into speculative trading in buoyant commodity futures markets.7 This is assessed to have increased price volatility as well as to have inserted an upward bias in spot prices.8 The annual number of commodity futures contracts traded globally has risen from 418 million in 2001 to 2.6 trillion in 2011, with a more than 14-fold increase in notional value, to $13 trillion.9 The dramatic rise in the volume of transactions by large financial actors has been suggested as a plausible explanation for the disconnection between price movements and market fundamentals. Consequently, the issue has attracted the growing attention of the international community, including the Group of Twenty (G20) and the larger arena of the United Nations General Assembly (box II.2).
Financial variables are increasingly influencing commodity prices
Food and agricultural commodities After sliding considerably in the first half of 2010, the agricultural commodity price indices of the United Nations Conference on Trade and Development (UNCTAD) rose sharply, reaching peaks around February 2011 (figure II.9). Despite subsequent falls, prices remain comparatively high. The food price index averaged 268 points from January to September 2011, up 21.8 per cent from the same period in 2010. Within this category, the average price of the main cereals (wheat, maize and rice) has continued its upward movement, although rising at a slower pace than in the previous year. Meat, vegetable oils and sugar prices have also been on the rise. The impact on net food-importing countries has been considerable, but variable. For example, the Horn of Africa was hit by famine following prolonged drought, compounded by conflict and insecurity, while other countries in Africa enjoyed good harvests of maize and sorghum. In developing Asia, in particular, rising prices for wheat, edible oil and other food items have been a major factor in accelerating headline inflation. Where food price increases were contained by food subsidies, they have given rise to widening fiscal deficits, as was the case in Western Asia. The outlook for wheat crops in 2012 is uncertain. Increased production projections for the European Union (EU) and the Commonwealth of Independent States (CIS), 7
The deregulation of United States exchanges in 2000 allowed index investors to be considered “commercial” market participants, thereby exempting them from certain regulatory obligations. For instance, investments in futures markets can be treated as “over-the-counter” (OTC) derivatives, not listed in the exchanges. The OTC market involves trading derivatives directly between two parties, where there is a risk that one party may default. In exchange trading, all parties must place collateral (called a “margin”) against their positions held at the exchange. Margin calls are required by the exchange whenever the collateral of any trading agent falls short of the margin required to hold their positions. Positions are immediately liquidated if the margin call is not met. This reduces risk-taking and the risk of default. 8 See World Economic Situation and Prospects 2011 (United Nations publication, Sales No. E. 11.II.C.2), box II.1, pp. 53-54; and UNCTAD, Trade and Development Report 2011: Post-crisis policy challenges in the world economy (United Nations publication, Sales No. E.11.II.D.3), chap. V. 9 UNCTAD projections based on Bank for International Settlements statistics (see UNCTAD, Commodities and Development Report 2012: Commodities in the twenty-first century: Perennial problems, new challenges, which way forward? (United Nations publication, forthcoming).
Food prices peaked in early 2011
The impact on net foodimporting countries has been considerable
52
World Economic Situation and Prospects 2012
Box II.2 Commodity market volatility and financialization reaches the international policy agenda
a For a review of such studies and further analysis of the interplay between physical and financial commodity markets, see UNCTAD, Trade and Development Report 2011: Post-crisis policy challenges in the world economy (United Nations publication, Sales No. E.11.II.D.3), chap. V. b See http://agriculture. gouv.fr/IMG/pdf/2011-0623_-_Action_Plan_-_ VFinale.pdf. c The report is available from http://www.g20.org/exp_01. aspx.. d See UNCTAD, Trade and
Development Report 2011, op. cit., for further analysis.
e See International Organization of Securities Commissions (IOSCO), “Principles for the Regulation and Supervision of Commodity Derivatives Markets”, September 2011. Available from http://www. iosco.org/library/pubdocs/ pdf/IOSCOPD358.pdf.
Major shifts in commodity market supply and demand balances have occurred over the past few years. However, these shifts alone are insufficient explanation of the rapid increase in price volatility affecting a wide range of commodities over the last half decade. Recent research and analyses increasingly support the view that the greater involvement of financial investors and their increased investments in commodities as financial assets have altered the functioning of commodity markets. a The adverse impact of food price volatility on the livelihood of millions of poor households and the potential inflationary effects of high food and energy prices have placed commodity price issues back on the international policy agenda. In response to these concerns, the G20 identified food security as a priority area for the first time in the November 2010 Seoul Development Consensus for Shared Growth. During the Ministerial Meeting on Development in Washington, D.C., in September 2011, the work of the G20 in this area culminated in the endorsement of the Action Plan on Food Price Volatility and Agriculture to which Agriculture Ministers had agreed earlier in Paris in June 2011.b This policy-oriented Action Plan emphasizes the need for enhanced agricultural productivity and greater market transparency, while encouraging market participants to make better use of commodity price risk management tools. Taking a broader approach, the G20 Study Group on Commodities endorsed an analytically oriented report in November 2011. This report examines the determinants of recent commodity price volatility, including the changing nature of commodity-related financial instruments and market participants, in order to shed light on their growing influence on commodity price developments.c It argues that financial investors can cause commodity prices to deviate from fundamental values when their investment is large and when they engage in herd behaviour. Herding occurs when market participants extrapolate from past price movements or mimic other traders’ position-taking without looking at market fundamentals.d While the report acknowledges the existence of conflicting empirical evidence of a persistent impact of financial investors on the level, volatility and correlation of commodity prices, it also recognizes the growing research supporting the view that recent financial investments have decisively affected price dynamics over short time horizons; furthermore, it finds that some episodes of large and sudden price movements support the common-sense hypothesis that amplification mechanisms existing in other financial markets are also at work in commodities futures and options markets. Subsequently, at the Cannes Summit in November 2011, the G20 endorsed a report on commodity derivatives markets, prepared by the International Organization of Securities Commissions (IOSCO), calling for more stringent regulation and enhancing the intervention power of market authorities to ensure that commodity derivatives markets fulfil their function as price-discovery and risk-transfer mechanisms.e Although these recommendations have a similar thrust, they are less ambitious than the regulations that the U.S. Commodity Futures Trading Commission (CFTC) and the European Commission propose to implement in the United States of America and the European Union, respectively, over the next two years. Partly as a result of the sequence in which the various reports on commodity price developments have become available, the recent analytical findings and regulatory recommendations are thus far reflected in G20 policy statements only to a limited extent. However, the continued salience of commodity price issues may lead the G20 to deepen its approach and translate these findings and recommendations into tangible and internationally harmonized policy actions. In addition, the growing consensus that heightened commodity price volatility affects food security and sustainable development, in particular in commodity-dependent countries, has triggered a deepening debate extending beyond the perceived scope of G20 engagement. Nonmembers of the G20 are increasingly contributing to this debate with their own initiatives. The draft resolution on addressing excessive price volatility in food and related financial and commodity markets, initially tabled by the Group of 77 and China could, if adopted by the General Assembly in December 2011, represent an important step in addressing this issue under the global and representative umbrella of the United Nations.
53
International trade
Figure II.9 Price indices of commodity groups, January 2000-September 2011 450
Index: 2000=100 Price index—all groups (in terms of current dollars)
400
Tropical beverages Minerals, ores and metals Food Agricultural raw materials
350 300 250 200 150 100
Jan-2011
Jan-2010
Jan-2009
Jan-2008
Jan-2007
Jan-2006
Jan-2005
Jan-2004
Jan-2003
Jan-2002
Jan-2001
Jan-2000
50
Source: UNCTAD.
together with competitive prices relative to maize, may continue to encourage the use of wheat for livestock feed, which could push up prices. The sugar price may continue its rise in 2012, underscored by higher projected world demand for refined sugar in the light of anticipated market deficits. The tropical beverages price index, which has risen steadily since December 2010, may show moderation as a result of better-than-expected supply conditions. The vegetable oilseeds and oil price index has declined from its all-time high of February 2011, but price volatility may continue amidst uncertain supply and demand prospects in major oilseed-producing and -importing countries. The average price index for agricultural raw materials increased by 91 points over the first three quarters of 2011 compared with the same period in 2010, mostly as a result of supply shortfalls generated by adverse weather conditions and strong demand in Asian emerging economies. Natural rubber prices remained high in 2011 owing to strong demand for tyres in emerging market economies and high energy costs (especially crude oil) which affected synthetic rubber prices. Supply disruptions from poor weather conditions in major producing countries also contributed to increased prices. This pattern was evident for cotton, too, which reached a historic high in March 2011 ($2.3 per lb), up 63 per cent from its 2009 average.
Minerals, ores and metals The average UNCTAD price index for minerals, ores and metals, calculated from January to September 2011, increased by 21 per cent compared with the same period in 2010 (figure II.10). Metal prices remained high over this period owing to a combination of tightening supply and strong industrial demand from Asian countries and Brazil.
Prices of metals have increased and are expected to rise further in 2012
54
World Economic Situation and Prospects 2012
Figure II.10 Price indices of non-ferrous metals, January 2007-September 2011 900
Index: 2000=100
800 700
Aluminium
Lead
Copper Nickel
Zinc
600 500 400 300 200 100
Jul-2011
Apr-2011
Jan-2011
Oct-2010
Jul-2010
Apr-2010
Jan-2010
Oct-2009
Jul-2009
Apr-2009
Jan-2009
Oct-2008
Jul-2008
Apr-2008
Jan-2008
Oct-2007
Jul-2007
Apr-2007
Source: UNCTAD.
Jan-2007
0
Over the next few years, the slow expansion of supply in the mining sector, coupled with an already challenging situation in upgrading mining capacity, is set to tighten supply further, likely resulting in rising metal prices in the medium term. According to the International Copper Study Group (ICSG), the growth in global copper demand is expected to outstrip copper production before the end of 2011 causing a production deficit of about 160,000 tonnes of refined copper. Gold continues to serve as a safe store of wealth during times of uncertainty or exchange-rate volatility. Between January and December 2009, gold prices rose by 32 per cent, and yet again by 24 per cent from January to December 2010. By September 2011, the monthly average gold price set a new record of $1,772 an ounce, as investors took refuge following weaker-than-expected recovery in both the United States of America and Europe, coupled with perceived sovereign debt problems on both sides of the Atlantic.
The oil market Oil prices increased moderately as demand from emerging economies grew, while OECD demand slackened
During the first three quarters of 2011, global oil demand increased by 1.2 per cent compared to the same period in 2010. Oil demand in developed countries declined by 0.7 per cent as their economies weakened. This decline was offset by strong demand for oil from emerging market and developing countries, up by 3.4 per cent in 2010, pushed by robust economic growth, particularly in China and India. Non-Organization for Economic Cooperation and Development (OECD) countries commanded an estimated 48.7 per cent of global oil demand in 2011. World oil supply increased by 1.2 per cent during the first three quarters of 2011. Production in the member States of the Organization of the Petroleum Exporting
55
International trade
Countries (OPEC) increased by 2.7 per cent. Saudi Arabia has activated its spare capacity and raised its supply by 1.4 million barrels per day (mbd), to reach 9.4 mbd in the third quarter to compensate for the production loss in Libya. Meanwhile, oil supply by nonOPEC countries, which represents two thirds of world production, is estimated to have increased by 0.1 per cent owing to slowing production in OECD countries. Oil stocks in the OECD countries decreased slightly in the first half of 2011. Furthermore, on 23 June, the International Energy Agency (IEA) decided to release 60 mb of strategic stocks in a coordinated manner over a 30-day period. During the first ten months of 2011, oil traded at about 40 per cent above the average price of 2010. The Brent oil price averaged $112 per barrel (pb), compared with $79 pb for 2010 as a whole. A price hike occurred after the first of the Arab uprisings in Tunisia on 18 December 2010; it intensified as political unrest spread across North Africa and Western Asia. Speculation in oil futures markets about possible supply shortages because of the political unrest pushed up oil prices long before production facilities in Libya were actually affected and despite the fact that supply outages were fully compensated for by the activation of Saudi spare capacity. The Brent oil price peaked at $126 pb in midand end-April before stabilizing at around $110 pb. The coordinated release of strategic stocks by IEA members failed to appease fears of supply shortages; the Brent price did not fall below $100 pb until October 2011, and only did so for a very short time. Furthermore, Brent oil has been trading at an increased premium compared to other crudes, especially West Texas Intermediate (WTI) crude (figure II.11A). A number of factors are thought to explain the widening spread. On the supply side, infrastructure constraints, including constraints in pipelines and access to storage facilities at the delivery point of North American crudes in Oklahoma have led to a build-up of inventories. Additionally, Brent production in the mature North Sea fields is slowing down. These two phenomena are not new, however. Other explanations point to specific demand factors and the role of financial speculation. Indeed, as most of Libya’s oil is exported to Europe, the outage in supply caused by the war translated into acute demand pressures on Brent, which is chemically one of the closest substitutes for light sweet crudes from Libya. Rumours that the European downstream industry might not be able to process similar quantities of more heavy crudes in the short run subsequently nurtured fears that oil shipment patterns would need to be rerouted. These fears further aroused the interest of financial speculators, causing a surge of 32 per cent (year on year) in Brent open interests between January and September, compared with 2 per cent in WTI open interest.10 During the first three quarters of 2011, oil price volatility also increased. Brent oil prices, in particular, registered larger swings than in 2010 (figure II.11B). This has increased the cost of hedging for buyers and sellers engaged in the physical oil trade. Several studies suggest that the financialization of commodity markets has shaped the process of price formation in spot markets, and a more stringent regulation of these markets is called for (box II.2). However, the debate is not settled and is likely to remain controversial, especially considering the huge vested interests of the financial players. In the outlook for 2012, global oil demand is assumed to increase by 1.6 per cent, to 90.6 mbd. Demand from non-OECD countries, mainly driven by economic growth in China and India, is expected to rise by 3.7 per cent on the back of expanding industrial production and private energy consumption. Among OECD member 10
Open interest is the total number of derivative contracts not settled in the immediately preceding period for a specific underlying security. A large open interest indicates more activity and liquidity for the contract.
Political instability and fears of supply shortages kept prices high during most of 2011
Financialization of commodity markets has amplified price swings in spot markets
Oil demand is expected to rise moderately in 2012, driven by demand from developing countries
World Economic Situation and Prospects 2012
Figure II.11 Oil prices A. Widening spread between Brent and WTI spot prices (daily prices), 2010-2011
130
Brent West Texas Intermediate (WTI)
120 110 Dollars per barrel
100 90 80 70
Oct-2011
Sep-2011
Aug-2011
Jul-2011
Jun-2011
May-2011
Apr-2011
Mar-2011
Feb-2011
Jan-2011
Dec-2010
Nov-2010
Oct-2010
Sep-2010
Aug-2010
Jul-2010
Jun-2010
May-2010
Apr-2010
Mar-2010
Feb-2010
Jan-2010
60
B. Increasing Brent price volatility (daily prices), 1987-2011
200
Absolute volatility (rebased)
180
Spot price (dollars per barrel)
160 140 120 100 80 60 40 20
Jul-2011
Jul-2009
Jul-2007
Jul-2005
Jul-2003
Jul-2001
Jul-1999
Jul-1997
Jul-1995
Jul-1993
Jul-1991
Jul-1989
0 Jul-1987
56
Source: UN/DESA, based on data from the United States Energy Information Administration, available from http://www.eia.gov/dnav/pet/pet_pri_spt_s1_d.htm.
International trade
57
States, demand is projected to remain at the 2011 level. On the supply side, non-OPEC countries are expected to post an increase in output of 1.8 per cent in 2012, to 53.7 mbd, driven by non-OECD producers such as the Russian Federation, Brazil and newcomer Ghana. Supply in OECD countries, which provide about 35 per cent of non-OPEC output, will rise by 1.6 per cent as the exploitation of Canadian tar sands is expanding. Many Gulf countries will likely seek to enhance oil revenues to fund increased social spending resulting from measures announced in the wake of political unrest spreading across the Middle East. Consequently, output from OPEC countries is expected to increase unless oil prices stay up. Setting aside the uncertain influence of financial speculation, the Brent price is forecast to average $100 pb in 2012. Market conditions will be characterized on the supply side by a tightening of spare capacity among OPEC producers as well as by a restocking of strategic oil reserves, while global demand will continue to be driven by developing countries, especially those in Asia. The outlook is subject to significant uncertainty, however. Weaker-than-expected global economic activity could create significant downward pressure on oil prices, while a revival of political unrest in Gulf countries or a stronger depreciation of the value of the dollar could trigger renewed price hikes. In addition, in the context of low interest rates in major financial markets, more speculative capital could be attracted to commodity markets in search of higher yields, possibly exacerbating oil price volatility.
Growing trade in services In 2010, services trade returned to positive growth in all regions and groups of countries, especially developing countries, the least developed amongst them in particular. Nonetheless, the level of world trade in services has not yet fully recovered from the downturn caused by the global financial crisis, mainly because of the sluggish recovery of such trade in the developed countries and economies in transition. In all regions, growth in services trade is lagging behind its pre-crisis pace (figure II.12A and B). Unlike merchandise trade, however, services trade has shown less sensitivity to the global demand shock triggered by the financial crisis. As a corollary, the rebound in trade in services was also less pronounced during the recovery from the crisis. International tourism services experienced similar patterns (box II.3). As a result of diverging growth, the share of developing countries in world services trade has increased notably, essentially at the expense of developed countries. Despite fast growth of their tradable services industry, the share of LDCs has remained almost constant since their initial level of services trade was very low. The major services exporters among developing and transition economies further improved their overall ranking in the world’s top 10 between 2006 and 2010 (table II.1). China, which is both the largest importer and exporter of services among developing countries and transition economies, moved from the eighth to the fourth position in terms of exports, and from the sixth to the third position in terms of imports. In the top 10 for developing countries and economies in transition, 8 of the top exporters also rank among the top 10 importers. While their share in world trade in services is growing, most developing countries and economies in transition continue to run a deficit on their internationally traded services balance.
World trade in services has been more stable than merchandise trade
58
World Economic Situation and Prospects 2012
Figure II.12 International trade in services World Developing economies Economies in transition Developed economies Least developed countries
A. Exports of services (annual growth rates)
30 25 20 15 10 5 0 -5 -10 -15 -20
2006
2007
2008
2009
2010
B. Imports of services (annual growth rates)
0.4
0.3
0.2
0.1
0
-0.1
-0.2
-0.3 2006
Source: UN/DESA.
2007
2008
2009
2010
59
International trade
Box II.3 International tourism Rebounding tourism In 2010, world tourism rebounded from the recession induced by the financial crisis. Worldwide, international tourist arrivals reached 940 million in 2010, up 6.6 per cent over the previous year. The majority of destinations reported positive and often double-digit increases, sufficient to surpass pre-crisis peak levels or bring them close thereto. Recovery was stronger in developing economies, showing a growth rate of 8 per cent, compared to 5 per cent in developed countries that have not yet fully recovered from a greater fall in 2009 (with Europe following a slightly different pattern as weather and geological shocks caused some travel restrictions during 2010). Receipts earned from international tourism by destination countries are registered as services exports (travel credits) in the balance of payments. Worldwide, receipts increased by 5.4 per cent in real terms, reaching a value of $926 billion in 2010. Throughout 2009, international tourism was more resilient than other trade categories, decreasing only by 5.5 per cent in real terms, while overall exports decreased by 10.7 per cent. Besides travel-related financial services, tourism also generates export earnings through international passenger transport. As the latter amounted to $174 billion in 2010, total tourism receipts reached $1.1 trillion in 2010. Travel and passenger transport exports account for 30 per cent of the world’s exports of commercial services and 6 per cent of overall exports of goods and services. As a worldwide export category, tourism ranks fourth after fuels, chemicals and food, while ranking first in many developing countries (see figure). In the first eight months of 2011, international tourist arrivals grew robustly, by 4.5 per cent. Europe, with 6 per cent growth, was the region showing the strongest growth, which may seem surprising considering the continued economic uncertainty. Northern Europe, Central and Eastern Europe, and Southern Europe grew by 7 per cent or more in 2011, following a milder recovery in the previous year. Furthermore, Mediterranean destinations benefited from the shift of travel away from the Middle East and North Africa, which fell by 9 and 15 per cent, respectively, impacted in both cases by political turbulence.
International tourism revenue vis-à-vis other main export commodities, 1990-2010 3,000
Billions of dollars International tourism Fuels Chemicals Food Automotive products
2,500
2,000
1,500
1,000
500
0 1990
1992
1994
1996
1998
2000
2002
2004
2006
2008
2010
Sources: World Tourism Organization (UNWTO) and World Trade Organization (WTO). Note: International tourism accounts for 30 per cent of service exports and 6 per cent of goods and services exports.
60
World Economic Situation and Prospects 2012
Box II.3 (cont’d)
a World Tourism Organization (UNWTO), “Positioning tourism in economic policy: evidence and some proposals”, available from http:// statistics.unwto.org/sites/all/ files/docpdf/t20_0.pdf. b UNWTO, “Economic crisis, tourism decline and its impact on the poor” (forthcoming). A preliminary version of the study is available from http://www. unglobalpulse.org/projects/ rivaf-research-economiccrisis-tourism-decline-andits-impact-poor.
Growth in Asia reached 6 per cent, but was unevenly distributed across subregions. While South-East Asia and South Asia registered double-digit rates, North-East Asia and Oceania grew more weakly. South America, benefiting from favourable economic momentum and increased regional integration, experienced growth of 13 per cent. In sub-Saharan Africa, arrivals grew by 4 per cent. On the demand side, expenditures on travel abroad (imports) for the first part of 2011 continued to be buoyant, thanks to the emerging economies of Brazil, China, India and the Russian Federation, each increasing by over 20 per cent. Major mature markets—such as Canada, Germany, Italy and the United States—showed healthy growth rates in the range of 4-6 per cent, while Australia, the Republic of Korea and the Scandinavian markets had even stronger growth. According to the latest survey of the World Tourism Organization (UNWTO) Panel of Experts, while confidence has been deteriorating, it remains positive. Tourism demand is expected to soften for the remainder of 2011, with full-year arrivals growing between 4 and 4.5 per cent. In 2012, growth is projected to be in the range of 3 to 4 per cent. Tourism and employment Tourism is a significant sector for both developed and emerging economies, driving growth by offering opportunities for development and diversification through the creation of jobs, enterprises and infrastructure. The direct contribution to gross domestic product (GDP) in major economies of both inbound and domestic tourism varies between 1.5 and 7.7 per cent.a If additional non-direct effects were included, the contribution of the sector may be anticipated to reach 11 per cent. The direct contribution to employment lies between 2 and 14 per cent of the growth of total employment. A recent UNWTO study finds that employment in tourism was less impacted by and recovered more rapidly from the crisis compared to other economic sectors.b Employment decline in hotels and restaurants was limited to developed economies in Europe and the Americas, while in emerging economies, relevant employment growth was actually positive during the crisis.
Growing trade in transport services
Economies of scale form barriers to entry in the maritime services business
Trade in services in developing countries is concentrated mostly in transport, travel and other merchandise trade-related services. This is the case on both the import and export sides. Transport services play a key role in the process of economic development as they allow for the integration of local goods production into global supply chains and for bringing domestically produced goods directly to international markets. In recent decades, developing countries have substantially expanded their expertise in the field of transportation, especially maritime transport. After initially becoming major market players in the provision of seafarer and vessel registration, they more recently extended their dominant position to practically all major maritime sectors. Today, developing economies have more than a 50 per cent market share in 6 of the 11 sectors covered in table II.2. In shipbuilding, scrapping and provision of seafarer and vessel registration, developing countries account for more than three quarters of the supply. In 3 of the 11 sectors, developed countries continue to dominate, with about 90 per cent or more of the market, notably in protection and indemnity (P&I) insurance services, ship financing and ship classification. The existing elevated degree of market concentration in the maritime services business and lack of adequate institutional capacity are seen to form major barriers to entry for many players. The increased specialization of maritime services providers in a limited number of countries increases the distance between them. As a result, different industries in the maritime services business develop ever more independently from each other, but linkages strengthened by external economies of scale remain between them. For example, a ship owner might find it more convenient to have both insurance and financing services
61
International trade
Table II.1 Rankings of top developing countries and economies in transition in trade in services, 2006-2010 Annual percentage change Share
2006
2010
World Rank
Rank among developing countries
World Rank
Rank among developing countries
2006
2007
2008
2009
2010
3.2 2.4 2.3 2.5 1.7 1.1 1.0 0.9 0.9 0.7 25.1 2.4
3.5 2.5 2.4 2.4 1.8 1.1 1.0 0.9 0.8 0.7 25.5 2.6
3.8 2.7 2.6 2.4 2.3 1.3 0.9 0.9 0.9 0.8 26.4 2.9
3.7 2.6 2.6 2.5 2.1 1.2 0.9 0.9 1.0 0.8 27 2.7
4.2 3.1 2.9 2.9 2.2 1.2 1.1 0.9 0.9 0.9 29.6 2.7
8 12 13 10 19 25 26 28 27 31
1 3 4 2 5 6 7 9 8 11
4 8 9 10 15 23 24 27 28 29
1 2 3 4 5 6 7 8 9 10
3.7 2.1 2.4 2.5 1.8 1.6 1.1 1.3 1.2 0.9 29.9 3.0
4.0 2.2 2.3 2.6 1.9 1.8 1.1 1.3 1.2 1.0 30.7 3.3
4.3 2.4 2.4 2.6 2.0 2.0 1.3 1.3 1.3 1.2 32.1 3.6
4.8 2.5 2.5 2.4 2.3 1.9 1.4 1.3 1.2 1.1 33.1 3.3
5.1 3.1 2.8 2.6 2.1 2.0 1.8 1.4 1.3 1.1 35.7 3.4
6 14 13 12 16 18 27 20 23 29
1 4 3 2 5 6 10 7 9 11
3 8 10 11 16 17 18 20 23 25
1 2 3 4 5 6 7 8 9 10
Sharesa and rankings of top 10 exporters China India Singapore Hong Kong SARb Korea, Republic of Russian Federation Taiwan Province of China Thailand Turkey Brazil Developing economies Economies in transition Sharesa and rankings of top 10 importers China India Singapore Korea, Republic of Saudi Arabia Russian Federation Brazil Hong Kong SAR* Thailand United Arab Emirates Developing economies Economies in transition Source: UNCTADStat. a Shares in world total. * Special Administrative Region of China.
in the same country. Similarly, for ship classification, businesses may prefer to be closer to their clients in the shipbuilding and ship operation businesses, or to banks that finance ships requiring certification. Furthermore, institutional capacity and demand matter as well. Having a well-functioning legal framework as well as adequate technical standards and infrastructure in place is necessary for the expansion of an industrial base that will allow advantage to be taken of internal economies of scale arising in sectors of maritime services, such as the operation of container ships or shipbuilding. In addition to those factors, the participation of developing countries in global maritime and related businesses has been guided by different strategies. Some have relied on the cost advantage of low wages, others have offered fiscal incentives or have chosen to support the development of national maritime services through promotional policies and
62
World Economic Situation and Prospects 2012
Table II.2 Maritime sectors, comparison
Maritime transport sectors Ship scrapping (dwt) Ship registration (dwt) Ratings (headcounts) Officers (headcounts) Shipbuilding (dwt) Classification (dwt) Container terminal operations (TEU) Container ship operation (TEU) Ship owning (dwt) Insurance, protection and indemnity (dwt) Ship financing (US dollars)
Share of top 10 countries in world total 99 72 50 52 98 69 62 73 95 75 70
Share of developing Number of developing countries in top countries among 10 countries top 10 countries 99 53 90 75 76 26 67 42 11 2 0
5 6 8 6 6 4 5 5 2 2 0
Source: UNCTAD, Review of Maritime Transport 2011 (United Nations publication, forthcoming). Note: “TEU” and ”dwt” are cargo capacity measurement units meaning “twenty-foot equivalent unit” and “deadweight tonnage”.
targeted support. Developing countries such as the Republic of Korea and Singapore have shown that growth of maritime businesses can work as a catalyst for economic progress.11
Trade policy developments The Doha Round The Doha Round remains in a stalemate
The stalemate has increased the role of RTAs
The ongoing multilateral trade negotiations under the Doha Round (or “Doha Development Agenda”) of the World Trade Organization (WTO)), which was launched more than ten years ago, in November 2001, are at a complete stalemate, with practically no prospects of completion owing to the “all or nothing” approach of the WTO, although there has been considerable progress on specific issues. The most feasible way to conclude the Round would seem to be by agreeing to a “smaller package” based on what has been agreed upon thus far, with significant additional concessions to provide the LDCs with an “early harvest”. Otherwise, the likelihood of any further progress on multilateral trade negotiations may well be undermined. In this context, some participating Governments have raised the notion of a “variable geometry” approach in WTO negotiations with a view to undertaking deeper commitments and obligations amongst themselves. This approach is clearly a step removed from the fundamental concept of the WTO as a “single undertaking”, which is the basis for all existing WTO multilateral trade agreements—but not for those of the General Agreement on Tariffs and Trade (GATT) before it. If implemented, it may put at risk the unconditional most favoured nation (MFN) treatment, which has been the cornerstone of the multilateral trading system since the inception of GATT at the end of the 1940s. The current irreconcilable deadlock in the Doha Round has provided additional motivation for countries to engage in preferential bilateral and regional trade 11
See UNCTAD, Review of Maritime Transport 2011 (United Nations publication, forthcoming).
International trade
63
agreements (RTAs). The incentive for RTAs, in comparison to the WTO multilateral trade agreements, is the possibility of undertaking deeper trade policy integration by including and implementing WTO-plus and/or WTO-extra provisions such as those for non-tariff measures, services sectors, intellectual property rights, or trade policy-related labour and environment issues. RTAs also require much less time to negotiate—a crucial factor for businesses. But this does not necessarily mean that RTAs also serve the objectives of longterm development strategies of developing countries or that they would be in the interest of workers in developed countries. Contradictions may arise when relatively small countries find themselves either negotiating with powerful global businesses or with powerful country counterparts. Likewise, without the safeguards of multilateral and globally inclusive understandings regarding the protection of employment, workers remain vulnerable to the growing political power of corporations operating as global supply chains. For example, global supply chains led by business interests play a major catalytic role for new RTAs, as an increasing number of firms are now offshoring production networks to developing and other economies. This will require new predictable trade and investment rules. According to WTO estimates, there are now about 300 RTAs in force worldwide compared with 37 in 1994, half of which have come into effect since 2000. Many countries, including developing economies, see RTAs as a way to shield themselves against external shocks, lock in market access with their key market counterparts, particularly those in the North, and circumvent the lengthy multilateral process of negotiations under the WTO. In the case of South-South trade, it is easier to improve market access through RTAs, consistent with each country’s development objectives. Many developing countries perceive this to be the most feasible means for gaining market access as the prospects for completing the multilateral trade negotiations seem more remote.
The continued threat of protectionism Since early 2008, a number of countries have introduced protectionist measures restricting trade as part of their response to the global crisis. These attempts at protecting domestic industries have raised fears of spiralling retaliatory responses, but resurgent protectionism has been restrained thus far. The most recent joint WTO-OECD-UNCTAD report of 25 October 2011 showed that new import restriction measures taken between May and mid-October of 2011 affect only 0.6 per cent of total G20 imports, the same proportion recorded during the prior six months. Restrictive measures mainly affected machinery and mechanical appliances, iron and steel articles, electrical machinery and equipment, organic chemicals, plastics and man-made staple fibres. The incidence is less than that recorded from October 2008 to October 2009 when trade-restrictive measures peaked, affecting 1.01 per cent of total world imports. However, the report noted that the political will to resist creeping protectionism appears to be under increasing pressure. Commitments made by G20 members to roll back export restrictions have not been met. In fact, the number of export restrictions has continued to increase.12 12
While the number of export restrictions has increased significantly, from 16 over the period from September 2009 to mid-October 2010 to 30 from mid-October 2010 to mid-October 2011, the amount of world trade covered by all restrictions has fallen from 0.8 per cent of total world imports in the first report of September 2009 to 0.5 per cent in the most recent report. See Reports on G20 Trade and Investment Measures, issued on 14 September 2009 and 25 October 2011 by the World Trade Organization (WTO), Organization for Economic Cooperation and Development (OECD) and UNCTAD.
Protectionist measures in response to the crisis have been of low intensity so far
64
NTMs are posing a serious policy challenge
World Economic Situation and Prospects 2012
The institutional function of the WTO to administer multilateral trade rules and disciplines is pivotal in ensuring that members do not resort to full-blown “beggarthy-neighbour” policies. Yet, given the present international economic environment, there is still a danger that more countries will enhance protectionist measures, especially nontariff measures (NTMs), should political emotions dull the memories of the damaging effects of past “beggar-thy-neighbour” policies and overpower the commitments to and rationale for a multilateral trading system. The danger may increase if unemployment rates remain high and the recovery loses further momentum. In this context, there is an urgent need to address NTMs. There are legitimate reasons for NTMs, such as the protection of health, safety and the environment, but they have also been abused as a pretext for protectionism. NTMs therefore pose a major trade policy challenge. Since 2008, the leaders of G20 countries have repeatedly discussed refraining from NTM use because of their potential for slowing down the positive outcomes of trade expansion and integration.13 “Green protectionism” through NTMs has recently increased. While there are legitimate grounds for environmental protection in support of sustainable production and consumption, concerns have arisen that such incentives are forms of trade distortion that cannot be properly challenged in the dispute settlement mechanism under current WTO trade rules. Hence, multilateral trade rules need further revision to ensure that the necessary Government support to promote environmental protection and sustainable production and consumption is provided without undermining the principles of a fair trading system.
13
See the G20 Cannes Summit Final Declaration of 4 November 2011, para. 65: “At this critical time for the global economy, it is important to underscore the merits of the multilateral trading system as a way to avoid protectionism and not turn inward. We reaffirm our standstill commitments until the end of 2013, as agreed in Toronto, commit to roll back any new protectionist measure that may have risen, including new export restrictions and WTO-inconsistent measures to stimulate exports and ask the WTO, OECD and UNCTAD to continue monitoring the situation and to report publicly on a semi-annual basis.” Available from http://www.g20.org/index.aspx.
65
International trade
Appendix Trade shocks and changes in merchandise trade balance, by region, 2001-2013 Percentage of gross domestic product of the region Demand shock: Terms-of-trade change of export shock: net value volume change
Total trade shock
Change in import volume
Net change in trade balance
World Average 2001-2007 2008 2009 2010 2011a 2012b 2013b
1.3 0.9 -3.4 3.2 1.7 1.0 1.3
0.0 0.0 0.0 0.0 0.1 0.0 0.0
1.3 0.8 -3.3 3.2 1.8 1.1 1.4
1.3 0.8 -3.3 3.2 1.8 1.1 1.4
0.0 0.0 0.0 0.0 0.0 0.0 0.0
0.8 0.4 -3.4 2.4 1.2 0.6 0.9
-0.2 -0.7 0.7 -0.3 -0.5 0.1 0.0
0.5 -0.3 -2.7 2.1 0.7 0.8 1.0
0.8 -0.2 -3.5 2.2 0.7 0.6 0.8
-0.3 -0.1 0.8 -0.1 0.0 0.1 0.2
3.6 1.7 -4.1 3.1 2.3 0.8 1.3
2.2 4.7 -6.1 3.0 4.0 -0.8 -0.4
5.7 6.4 -10.1 6.0 6.2 -0.1 1.0
2.9 1.8 -5.8 2.7 2.3 1.4 1.5
2.8 4.5 -4.4 3.4 3.9 -1.5 -0.5
3.1 2.1 -3.1 4.8 2.7 1.8 2.0
0.5 1.1 -0.9 0.6 0.8 -0.1 0.0
3.6 3.2 -4.0 5.4 3.5 1.7 2.1
2.7 1.7 -2.7 4.8 2.0 2.1 2.2
0.8 1.5 -1.3 0.6 1.5 -0.3 -0.1
3.1 2.1 -3.1 4.8 2.7 1.8 2.0
0.5 1.1 -0.9 0.6 0.8 -0.1 0.0
3.6 3.2 -4.0 5.4 3.5 1.7 2.1
2.7 1.7 -2.7 4.8 2.0 2.1 2.2
0.8 1.5 -1.3 0.6 1.5 -0.3 -0.1
Developed economies Average 2001-2007 2008 2009 2010 2011a 2012b 2013b Economies in transition Average 2001-2007 2008 2009 2010 2011a 2012b 2013b Developing economies Average 2001-2007 2008 2009 2010 2011a 2012b 2013b Least developed countries Average 2001-2007 2008 2009 2010 2011a 2012b 2013b
66
World Economic Situation and Prospects 2012
Appendix (cont’d) Demand shock: Terms-of-trade change of export shock: net value volume change
Total trade shock
Change in import volume
Net change in trade balance
East and South Asia Average 2001-2007 2008 2009 2010 2011a 2012b 2013b
4.9 2.6 -3.2 7.1 3.8 2.5 2.6
-0.2 -0.5 1.3 -0.7 -0.2 0.4 0.4
4.7 2.1 -1.9 6.4 3.7 2.9 3.0
3.5 1.8 -2.2 5.9 2.5 2.3 2.5
1.2 0.4 0.3 0.5 1.1 0.5 0.4
1.2 4.0 -5.5 1.6 1.3 1.2 1.8
2.5 7.3 -8.6 4.1 4.9 -1.2 -0.4
3.7 11.3 -14.1 5.7 6.3 0.0 1.4
3.1 2.0 -3.4 2.5 0.4 2.2 1.4
0.5 9.3 -10.6 3.2 5.9 -2.2 -0.1
0.7 2.5 -3.6 0.9 0.9 0.8 1.2
1.2 2.9 -3.1 1.9 1.9 -0.6 -0.4
1.9 5.4 -6.8 2.8 2.8 0.1 0.8
2.7 2.1 -2.8 2.1 0.4 2.1 1.3
-0.8 3.3 -3.9 0.7 2.4 -2.0 -0.5
1.0 -0.1 -1.5 2.1 1.0 0.8 1.0
0.7 1.0 -0.8 1.5 0.9 -0.6 -0.5
1.7 0.9 -2.3 3.6 1.9 0.3 0.5
1.0 1.4 -3.3 4.0 1.9 1.3 1.8
0.7 -0.5 1.0 -0.4 -0.1 -1.0 -1.3
Western Asia Average 2001-2007 2008 2009 2010 2011a 2012b 2013b Africa Average 2001-2007 2008 2009 2010 2011a 2012b 2013b Latin America and the Caribbean Average 2001-2007 2008 2009 2010 2011a 2012b 2013b
Source: UN/DESA World Economic Vulnerability Monitor, based on UN Comtrade and UNCTAD data. a Figures for 2011 are partly estimated. b Figures for 2012-2013 are projections.
67
Chapter III
International finance for development Financing for development is inherently linked to the global environment. While the international community has taken steps to strengthen the global financial system through regulatory reforms—as contained in the internationally agreed Basel III framework, the United States Dodd-Frank Wall Street Reform and Consumer Protection Act and other new regulations implemented elsewhere—these reforms do not adequately address risks in the international financial system, including their impacts on developing countries. Volatile capital flows originating in the developed economies continue to threaten boom and bust cycles in developing countries. The sovereign debt crisis in Europe and the uneven global recovery have led to heightened risk aversion, which has increased the volatility of private capital flows. A growing liquidity squeeze in the European interbank market has impacted cross-border interbank flows. At the same time, official development assistance (ODA) and other forms of official flows are being affected by greater fiscal austerity and sovereign debt problems in developed countries. Similar to private flows, aid delivery has been pro-cyclical and volatile. The effectiveness of development finance is also severely hindered by shortcomings in international cooperation pertaining to increasing ODA, as well as by the lack of adequate mechanisms for resolving sovereign distress. Reforms of the international financial system should focus on reducing risk and volatility associated with both private and official flows. Mechanisms to this end, such as improved regulations and reforms to the international reserve system, are crucial to maintaining policy space for developing countries and ensuring adequate financing for development. This chapter discusses the current global issues associated with the international financial system and their impact on financing for development.
Recent reforms to the international financial system do not adequately address risks
Private capital flows and macroeconomic imbalances Managing the macroeconomic volatility induced by private financial flows is a major challenge for emerging market and developing country policymakers. Waves of capital inflows in excess of an economy’s absorptive capacity, or highly speculative in nature, complicate macroeconomic management and carry risks for financial and economic stability. They may lead to exchange-rate overshooting, credit and debt bubbles, inflation and asset price bubbles. More importantly, there is a risk of sudden stops and withdrawals of international capital due to heightened risk aversion, which contribute to spreading financial crises. Policymakers in many developing countries have responded to these risks by increasing the accumulation of international reserves as a form of “self-insurance”. However, this has had the effect of exacerbating global imbalances. Furthermore, the strategy of building up international reserves is a costly one, particularly in terms of the opportunity cost of forgone domestic investment. A large share of international reserves is invested in low-yielding (yet considered safe) United States Treasuries, implying a net transfer of
Volatile capital inflows complicate macroeconomic management
68
World Economic Situation and Prospects 2012
resources from poorer countries to wealthier ones. Policymakers in many developing and emerging market countries have thus begun to look to capital-account regulations to manage volatile inflows and increase domestic policy space.
Trends in private capital flows Private capital flows continue to be highly volatile
Private capital flows are subject to both short- and medium-term fluctuations
Over the past several years, international capital flows to developing countries have been characterized by extreme volatility. The collapse in capital flows during the global financial crisis was followed by a renewed surge in inflows in 2010. Capital inflows began to fall again in September 2011, as growing fears among portfolio investors over the sustainability of public finances in Europe gave rise to a general “flight to safety”. Overall, the latest figures indicate that net private capital flows to developing countries amounted to $482 billion in 2010 and are forecast to total about $575 billion in 2011, about half of their peak level of 2007, as discussed in chapter I.1 However, aggregate numbers on net flows mask differences in the types of inflows and risks, additional risks from derivatives, as well as differences across regions and countries (see table III.1). The data on private capital flows is generally divided into three categories: foreign direct investment (FDI), portfolio flows and other flows such as cross-border interbank lending. As shown in chapter I, figure I.5, FDI is the largest capital inflow with the lowest volatility. Lower relative volatility of FDI is in large part because FDI, especially greenfield direct investment, tends to have longer-term investment horizons, and be attracted by factors such as high growth rates, cheap asset prices, rule of law and strong macroeconomic fundamentals. On the other hand, short-term flows, including many forms of portfolio investment and cross-border interbank lending, tend to be attracted to developing countries because of high relative short-term interest rates, which often outweigh longer-term fundamentals. Capital flows to developing countries are not only subject to short-term volatility, but also to medium-term fluctuations, reflecting the successive waves of optimism and pessimism that characterize financial markets. These fluctuations are reflected in the procyclical pattern of spreads, which narrow during booms and widen during crises, shorter maturity of financing during crises and variations in the availability of financing. International capital flows are also dependent on economic conditions in developed countries. In particular, there is evidence that international flows are highly correlated with global risk aversion.2 Although the evidence on the impact of global liquidity on total capital flows is more ambiguous, short-term private flows, such as cross-border interbank lending, seem to be particularly responsive to liquidity and interest rates. 3 When interest rates are low, international investors look to invest abroad in search for higher yields. On the other hand, during periods of tight liquidity, banks often reduce lending abroad to deal with liquidity shortages at home. 1
2
3
Data in the text refer to the “net net” concept of capital flows, which is measured as “net inflows minus net outflows”, according to balance-of-payments definitions. Cited numbers are from the International Monetary Fund (IMF), World Economic Outlook database, September 2011. Kristin J. Forbes and Francis E. Warnock, “Capital flow waves: surges, stops, flight, and retrenchment”. NBER Working Paper, No. 17351 (Cambridge, Massachusetts: National Bureau of Economic Research, August 2011), finds that flows are highly correlated with global volatility. Bank for International Settlements (BIS), “Global liquidity—concept, measurement and policy implications”, CGFS Publication, No. 45 (Basel, Switzerland: Committee on the Global Financial System, November 2011).
International finance for development
Table III.1 Net financial flows to developing countries and economies in transition, 1998-2012 Billions of dollars Average annual flow 19982001
20022007
2008
2009
2010
2011a
2012b
56.8 153.5 -5.0 -91.7 -12.9 43.9 -83.0
160.9 204.6 -58.4 14.7 -74.3 86.6 -534.0
176.5 360.6 -94.2 -89.9 -125.4 51.2 -786.3
350.6 237.7 28.5 84.4 14.6 365.1 -691.5
404.5 279.7 46.8 77.9 47.7 452.2 -943.3
522.7 364.0 -76.4 235.1 -132.4 390.4 -1116.6
528.7 384.5 -84.5 228.7 -147.8 380.9 -1074.2
10.4 12.7 -0.3 -2.0 -1.7 8.8 -7.2
14.9 25.2 0.5 -10.8 -4.5 10.4 -46.2
13.3 51.4 -43.0 4.9 9.0 22.4 -74.0
26.1 46.1 -18.0 -2.0 22.5 48.6 2.3
19.0 35.0 -6.1 -9.9 32.0 51.0 -29.7
38.3 40.9 -7.9 5.3 11.4 49.6 -49.9
51.1 46.1 -1.6 6.6 17.0 68.1 -46.5
-9.4 62.7 5.9 -77.9 0.9 -8.5 -75.5
101.5 101.8 -25.7 25.3 -26.5 75.0 -368.2
21.3 154.9 -42.2 -91.4 -30.4 -9.1 -528.8
273.7 68.3 47.5 157.9 -5.6 268.1 -650.9
298.7 140.7 41.3 116.7 -5.4 293.3 -708.7
324.5 156.4 -43.6 211.7 -58.4 266.0 -823.7
314.5 152.8 -72.3 233.9 -71.1 243.4 -856.1
8.1 6.9 -6.9 8.1 -18.1 -10.0 -2.6
17.3 25.2 -24.8 16.8 -33.9 -16.6 -73.6
87.0 58.1 10.2 18.7 -105.5 -18.5 -133.2
68.1 55.9 14.7 -2.5 -43.6 24.5 6.1
49.7 32.4 0.9 16.4 -25.6 24.1 -101.7
39.7 40.1 -21.1 20.7 -119.1 -79.4 -123.0
63.8 48.0 -9.6 25.4 -123.5 -59.7 -109.3
47.6 71.2 -3.7 -19.9 6.0 53.6 2.3
27.2 52.3 -8.5 -16.6 -9.3 17.9 -45.9
54.9 96.1 -19.2 -22.1 1.5 56.4 -50.4
-17.3 67.4 -15.7 -69.0 41.2 24.0 -48.9
37.1 71.7 10.7 -45.3 46.7 83.8 -103.3
120.3 126.7 -3.8 -2.6 33.8 154.1 -120.0
99.3 137.6 -1.0 -37.3 29.7 129.0 -62.4
Developing countries Net private capital flows Net direct investment Net portfolio investmentc Other net investmentd Net official flows Total net flows Change in reservese Africa Net private capital flows Net direct investment Net portfolio investmentc Other net investmentd Net official flows Total net flows Change in reservese East and South Asia Net private capital flows Net direct investment Net portfolio investmentc Other net investmentd Net official flows Total net flows Change in reservese Western Asia Net private capital flows Net direct investment Net portfolio investmentc Other net investmentd Net official flows Total net flows Change in reservese Latin America and the Caribbean Net private capital flows Net direct investment Net portfolio investmentc Other net investmentd Net official flows Total net flows Change in reservese
69
70
World Economic Situation and Prospects 2012
Table III.1 (cont’d) Average annual flow 19982001
20022007
2008
2009
2010
2011a
2012b
-7.5 6.0 -1.4 -12.0 -2.5 -10.0 -8.5
51.7 19.7 6.2 25.9 -9.9 41.8 -82.6
-77.6 60.4 -31.9 -106.1 -10.0 -87.6 30.0
-50.2 22.4 -9.9 -62.7 49.3 -0.9 -11.8
-23.7 9.8 9.8 -43.3 11.5 -12.2 -51.8
-15.0 33.6 6.9 -55.6 12.3 -2.8 -95.9
12.1 36.3 9.7 -33.9 18.2 30.3 -83.3
Economies in transition Net private capital flows Net direct investment Net portfolio investmentc Other net investmentd Net official flows Total net flows Change in reservese
Source: International Monetary Fund (IMF), World Economic Outlook database, September 2011. Note: The composition of developing countries above is based on the country classification located in the statistical annex, which differs from the classification used in the World Economic Outlook. a b c d e
Preliminary. Forecasts. Including portfolio debt and equity investment. Including short- and long-term bank lending, and possibly including some official flows owing to data limitations. Negative values denote increases in reserves.
Foreign direct investment (FDI)
FDI has become increasingly important in the least developed countries
As shown in chapter I, FDI in developing countries has tended to be more stable and geared towards the longer term than other types of private capital flows. However, FDI remains concentrated in a few regions and countries. Approximately 70 per cent of FDI is invested in East and South Asia and Latin America and the Caribbean. Almost 90 per cent of FDI in East and South Asia is in China and India, while 50 per cent of FDI in Latin America and the Caribbean is invested in Brazil. FDI is becoming increasingly significant in least developed countries (LDCs). In recent years, FDI flows have become larger than bilateral ODA to LDCs as a group, with the major share of FDI to LDCs taking the form of greenfield projects. However, FDI inflows to the LDCs accounted for only 5 per cent of FDI inflows to the developing world in 2010.4 In addition, the distribution of FDI flows among LDCs remains uneven, with over 80 per cent of the capital going to resource-rich economies in Africa. In regions with greater proportions of FDI, there is growing evidence that FDI has become more financialized, with less investment in greenfield direct investment and more investments in financial companies or in intracompany debt.5 Some items recorded as financial sector FDI can disguise a build-up in intragroup debt in the financial sector, which has a risk profile that is more akin to debt than FDI. Similarly, privatizations and mergers and acquisitions are categorized as FDI, even though they often represent an ownership transfer rather than new investment. In fact, during the recent crisis, countries with larger stocks of debt liabilities or financial FDI fared worse than those with larger stocks of greenfield investment.6 4
United Nations Conference on Trade and Development (UNCTAD), “Foreign direct investment in LDCs: lessons learned from the decade 2001-2010 and the way forward”, (Geneva, May 2011). 5 UNCTAD, World Investment Report 2011: Non-Equity Modes of International Production and Development (United Nations publication, Sales No. E.11.II.D.2). 6 Jonathan D. Ostry and others, “Managing capital inflows: what tools to use”, IMF Staff Discussion Note, SDN11/06 (Washington, D.C., April 2011).
71
International finance for development
In this regard, it has been claimed that the proportion of short-term and volatile flows in FDI has increased, and that part of the growth in FDI flows during the past two years has been made for the purpose of short-term gains. For example, an international company might invest in a domestic entity in a developing country. Rather than investing in greenfield direct investment, that entity uses the funds to buy short-term fixed income securities that can be easily liquidated. This type of transaction has been particularly problematic in countries such as China7 that have capital-account regulations that prohibit foreigners from investing directly in the short-term interest rate market. Nonetheless, they remain small relative to the total size of FDI flows in China, partly because China has adjusted its capital-account regulations to address the evasion. South-South FDI flows have become increasingly important. Such flows proved particularly resilient during the global crisis of 2008-2009, in part because they were less dependent on debt financing. Companies from developing and transition economies, especially Brazil, China, India and the Russian Federation, have become increasingly important investors, with their share of global FDI rising from 15 per cent in 2007 to 28 per cent in 2010. This reflects the strength of their economies, the increasing dynamism of their corporations and their desire to acquire strategic resources abroad. Over 70 per cent of this investment is directed towards other developing and transition economies. South-South FDI is expected to increase in importance over the medium term in line with the growing strength of emerging economies and the growth of their transnational corporations. 8 However, FDI flows to developing countries more generally are likely to be adversely affected in the event of a renewed slowdown in the global economy and, moreover, may be more volatile than in the past given the growing proportion of short-term and volatile flows contained within them.
Portfolio flows and cross-border interbank loans Similar to FDI, a large share of the increase in cross-border lending to developing countries has been directed towards the rapidly growing economies of the Asia-Pacific region, especially China and Latin America and the Caribbean, where Brazil has accounted for a large proportion of international bank loans.9 Moreover, there have also been concerns specific to regions, such as the Middle East and North Africa, owing to political turmoil, and Central and Eastern Europe, owing to the heavy reliance of a number of countries on loans from Western European financial institutions.10 International bank lending has recovered somewhat from its sharp decline in 2009, but is still only about 20 per cent of its pre-crisis level, as discussed in chapter I. The continuing financial difficulties facing the financial sector make bank lending vulnerable to any renewed downturn in the global economy, and it remains weighed down by continuing financial difficulties faced by banks in developed countries. In particular, a liquidity squeeze in European banks, as discussed below, is restricting lending from European institutions. The impact of this has been particularly acute in the transition economies in Europe and Asia and has served to restrain lending within these regions.11 7
Yongding Yu, The Management of Cross-Border Capital Flows and Macroeconomic Stability in China (Penang, Malaysia: Third World Network, 2009); Shari Spiegel, “How to evade capital controls, and why they are still effective” in Managing Capital Flows for Long-run Development (Boston, Massachusetts: Boston University Pardee Center for the Study of the Longer Range Future, forthcoming). 8 UNCTAD, Global Investment Trends Monitor, No. 6 (27 April 2011). 9 IMF, World Economic Outlook database, op. cit. 10 World Bank, Global Economic Prospects: Maintaining Progress amid Turmoil, vol. 3 (Washington, D.C., June 2011). 11 BIS, BIS Quarterly Review (Basel, Switzerland, June 2011).
While less volatile, FDI has become increasingly pro-cyclical
South-South FDI is becoming increasingly important
72
World Economic Situation and Prospects 2012
Portfolio equity and bond flows to developing countries are also vulnerable to sharp shifts in sentiment. Corporate leverage appears to have increased in a number of emerging market countries in the earlier part of 2011, with weaker firms increasingly able to access capital markets. A point of concern is that the surge in capital flows into emerging corporate debt markets has been related to a mispricing of credit and a lack of due diligence on the part of investors, thereby increasing the vulnerability of emerging corporate debt markets to external shocks.12 As global risk aversion increased, equity flows fell significantly in the third quarter of 2011. Although there was less of a sell-off in bond funds, investors chose to hedge the currency risk implicit in their holdings instead of selling the bonds, thus causing currencies around the world to weaken.
Carry trade and other derivatives The carry trade is not fully reflected in the official balance-of-payment statistics
Most investors that wish to take advantage of high short-term interest rates in emerging market and developing countries do not actually buy short-term cash instruments, such as local currency treasury bills or local commercial paper. Instead, they transact through currency forwards, futures and options, in what is often called the carry trade.13 The size of carry trades in emerging market and developing country currencies at any one time is almost impossible to calculate, but estimates of the size of the market range from $700 billion to as much as $1.5 trillion,14 which would be significantly larger than other forms of capital inflows. In 1993, the International Monetary Fund (IMF) recommended including these cross-border derivatives in the current account as a line item under the reporting category of “portfolio investment”. In 1998, it further recommended that member countries report such data as a separate reporting category labelled “financial derivatives”. Many countries have not done so, however. The United States of America, for example, began to include derivatives in balance-of-payments data only in 2007.15 In addition, cross-border derivatives contracts are difficult for regulators to monitor and are often not reported. The balance of payments measures the amount of currency that flows across borders, so that the net value of derivative contracts is included in capital-account statistics. Although this measure might be appropriate from an accounting perspective, the net value is not a good measure of the risk associated with the transaction. In essence, the carry trade is a leveraged investment. An investor borrows in a currency with low interest rates, such as the United States dollar, and invests in a currency with higher rates, such as the Brazilian real, for a specified period. Thus, demand for the Brazilian real and Brazilian interest rates increases by the notional gross size of the contract. When the global appetite for risk changes and the carry trade unwinds, enormous pressure will mount on the local currency. Policymakers should thus monitor cross-border derivatives in conjunction with capital-account and balance-of-payment data. To do so, they need better surveillance of derivative products, as discussed below. 12
See, IMF, Global Financial Stability Report: Grappling with Crisis Legacies (Washington, D.C., September 2011). The World Bank estimates that corporate borrowers have dominated bonds with about 80 per cent of year-to-date volume, with most issues coming from companies in China, Emerging Europe and Latin America (see World Bank, Global Economic Prospects, op. cit.). 13 In a typical forward carry trade, the investor agrees to buy a high yielding currency forward at a specified date and price, with the price determined by the relative interest rates between the two currencies. 14 Mike Dola, “Regulators tackle the ‘carry trade’”, The New York Times, 11 February 2010. 15 IMF, IMF Balance of Payments Manual, 5th ed. (Washington, D.C.); IMF, “Financial derivatives”, BOPCOM98/1/20, paper prepared for the Eleventh Meeting of the IMF Committee on Balance of Payments Statistics on 21-23 October 1998; Board of Governors of the Federal Reserve System, Federal Reserve Bulletin, vol. 93 (Washington, D.C., 2007).
73
International finance for development
International reserves and the problem of the global imbalances In response to risks associated with volatile inflows, many countries have used boom periods to build international reserves. This self-insurance strategy originated in the aftermath of a number of financial crises in emerging economies in the 1990s and served to protect those economies during the recent world financial and economic crisis, when a number of countries used reserves to moderate currency volatility, offset shortages in dollars faced by local markets and help create fiscal space. For example, in several East Asian economies reserve accumulation contributed to the policy space countries needed to allow them to put in place effective economic stimulus packages. While the tapping by a number of developing countries into their surplus reserves led to a fall in aggregate reserve holdings during the crisis, the recovery of exports and the subsequent return of capital flows facilitated renewed growth of reserve holdings. Reserve holdings by emerging and developing countries are currently about $7 trillion, a large proportion of which has been accumulated by developing countries in Asia, particularly China,16 as discussed in chapter I. However, the strategy of reserve accumulation can be sustainable only if there is at least one reserve-issuing country large enough and willing to run ever larger current-account deficits to ensure sufficient liquidity for global economic activity. These ever rising deficits can erode confidence in the reserve currency in that they eventually undermine its value, leading to a breakdown of the system. This dilemma emerges from the use of a national currency as the main international reserve currency and is one of the most important medium-term risks in generating global imbalances. There are two main paths of reform that are being discussed by a variety of academics, analysts and policymakers. The first is to have multiple reserve currencies compete against each other. A multicurrency reserve system fails, however, to resolve the core deficiencies of the current system for a number of reasons. First, it would require national currencies, most of which would still be currencies of major industrial countries, to be used as reserve assets. A group of reserve currency countries would have to run increasing current-account deficits (or capital-account surpluses) to supply the world with reserve currencies. It would be particularly difficult for the European countries that are already restrained in monetary and fiscal policies to offset the contractionary impact of trade deficits arising from the supply of reserve currencies. Second, and more importantly, the diversification of reserve accumulation would then come at the cost of exchange-rate volatility among reserve currencies. Another reason for the undesirability of the multicurrency system is that it would not solve the inequity bias of the current system, since most developing countries would still be investing their savings into reserve assets issued by developed countries, and thereby transferring resources to them at very low interest rates. An alternative path is the design of a global currency, which can play the role of a reserve asset. One possibility is the use of Special Drawing Rights (SDRs) of the IMF.17 The Group of Twenty (G20) has encouraged discussion on reforming the international reserve system through reforms of the SDR mechanism (but not to the extent of using SDRs as a reserve currency). There are several reasons for resuming the allocations 16 17
IMF, World Economic Outlook database, op. cit., table A15. See Bilge Erten, “Allocation of SDRs for development purposes”, background paper for World Economic and Social Survey 2012 (United Nations publication, forthcoming).
Emerging and developing countries hold about $7 trillion in reserves
Self-insurance through building reserves has exacerbated global imbalances
74
World Economic Situation and Prospects 2012
of SDRs. SDRs can be used as an instrument to fund IMF emergency financing during crises, as discussed below. Sustained SDR allocations could also provide a low-cost alternative to accumulation of international reserves, and could reduce the need for precautionary reserve accumulation by providing access to foreign currency liquidity. In other words, greater use of SDRs could reduce the need for self-insurance by many developing countries. Second, regular SDR allocations are a potential source of finance since seigniorage related to additional demand for global currencies accrues to IMF member States. Under the current quota distribution, more than half of the newly allocated SDRs will accrue to developed countries. Nonetheless, countries with excess allocations can lend SDRs to countries in need, thereby leveraging existing SDR allocations. Countries can then exchange the SDRs for tradable currencies to meet balance-of-payment obligations. However, the use of SDRs as direct development finance is somewhat problematic since fiscal use of allocated SDRs by developing countries is illegal under the current IMF Articles of Agreement and would require a substantial amendment of these Articles. One suggestion to address this limitation is for the IMF to use newly allocated SDRs to buy bonds issued by multilateral banks, which could in turn use the funds to finance development projects.18 Other solutions envision employing unused SDRs to finance global public goods, such as through a green fund.
Net financial transfers Developing countries transferred $827 billion in financial resources to developed countries in 2011
The vast majority of global reserves have been invested in low-yielding United States Treasuries and other sovereign paper, with the effect of transferring financial resources from the developing to the developed world. Developing countries, as a group, are expected to have transferred a net amount of financial resources19 of approximately $826.6 billion to developed countries in 2011 (see figure III.1A and table III.2). The largest net outward transfers are in East and South Asia, reflecting trade surpluses and high levels of reserve accumulations. Africa and West Asia experienced strong increases in net outward resource transfers in the first half of 2011, reflecting continued growth in export revenues of net fuel exporters in both regions, owing to the continued surge in oil prices. Net outward transfers of countries in Latin America and Caribbean remained at high levels in line with a relatively stable regional trade performance and increased reserve accumulation in some countries, such as Brazil. Sub-Saharan Africa was the only region not to have net outward transfers. As shown in figure III.1B, most of the net transfers from developing to developed countries were from upper middle income countries. Net outflows from upper middle income countries increased by $85 billion in 2011, to $580 billion, reflecting the continued reserve accumulation in these countries. Net outflows from lower middle income countries increased to $40 billion in 2011, nearly doubling 2010 levels. However, lower middle income countries receive net inflows of $36 billion, representing a slight increase in inflows from 2010. Thus, in 2011, the pre-crisis pattern returned; upper middle 18
19
José Antonio Ocampo, “Reforming the international monetary system”, lecture delivered at the 14th WIDER Annual Lecture held at the United Nations in New York, 9 December 2010. Available from http://www.wider.unu.edu/publications/annual-lectures/en_GB/AL14/. The net transfer of financial resources measures the total receipts of net capital inflows from abroad minus total income payments (or outflows), including increases in foreign reserves and foreign investment income payments. Therefore, when reserves are greater than net capital inflows, there is a net outflow of financial resources.
75
International finance for development
Figure III.1A Net transfers of financial resources to developing economies and economies in transition, 1999-2011 200
Billions of dollars Sub-Saharan Africa (excluding Nigeria and South Africa) Least developed countries
0
Latin America and the Caribbean
-200
Africa Economies in transition Western Asia
-400
Eastern and Southern Asia Developing economies
-600
2011a
Source: UN/DESA, based on International Monetary Fund (IMF), World Economic Outlook database, September 2011 and IMF, Balance of Payments Statistics. a Partly estimated.
Upper middle income countries
Source: UN/DESA, based on International Monetary Fund (IMF), World Economic Outlook database, September 2011 and IMF, Balance of Payments Statistics. Note: The pattern differs significantly from that reported in World Economic Situation and Prospects 2011, because China has moved up to the group of upper middle income countries, hence pushing up net (outward) financial transfers from that group of countries and reducing that of the lower middle income countries.
-800
-1000 1999
2000
2001
2002
2003
2004
2005
2006
2007
2008
2009
2010
Figure III.1B Net financial transfers, by income category, 2001-2011 100
Billions of dollars
0 -100
-200 -300 -400
-500 Average 2001-2009
-600
2010 2011
-700 Low-income countries
Lower middle income countries
76
World Economic Situation and Prospects 2012
Table III.2 Net transfers of financial resources to developing economies and economies in transition, 1999-2011 Billions of dollars 1999
2000
2001
2002
2003
2004
2005
2006
2007
2008
2009
2010
2011b
Developing economies -130.3 -197.5 -165.8 -212.6 -304.3 -382.0 -598.8 -815.4 -890.9 -891.6 -531.9 -659.8 -826.6 Africa Sub-Saharan Africa (excluding Nigeria and South Africa East and South Asia Western Asia Latin America and the Caribbean Economies in transition Least developed countriesa
1.2
-31.9
-16.8
-5.9
-16.5
-34.8
-76.1 -108.5 -102.5 -101.8
8.8
-33.1
-68.3
8.2 2.8 6.8 3.6 6.0 4.4 0.6 -8.6 -7.1 -3.3 36.5 14.7 2.9 -141.5 -126.0 -121.0 -150.6 -178.0 -186.9 -268.7 -393.9 -544.8 -494.7 -422.5 -452.8 -501.5 2.7 -35.3 -30.6 -22.5 -46.2 -76.0 -143.1 -175.6 -137.3 -223.0 -46.1 -120.0 -203.0 7.3
-4.3
2.5
-33.7
-63.5
-84.3 -110.9 -137.4 -106.4
-25.1
-51.6
-32.9
-27.6
-37.5
-62.0
11.4
6.4
9.3
6.2
8.9
6.2
-99.3 -122.3 2.5
-72.1
-99.4 -152.3
-6.4
-4.5
-4.4
-72.1
-53.9
-53.8
-81.3 -135.0 -186.5 30.4
13.2
7.4
Sources: UN/DESA, based on International Monetary Fund (IMF), World Economic Outlook database, September 2011 and IMF, Balance of Payments Statistics. a Cape Verde graduated in December 2007; hence excluded from the calculations. b Partly estimated.
income countries transferred significant resources to richer nations while continuing with the accumulation of foreign-exchange reserves as self-protection against new global economic shocks, while poorer countries continued to have positive net transfers, albeit at a low level compared to total global flows. The continued high volatility in portfolio flows will likely increase the perceived need for self-protection during 2012. Nonetheless, many middle-income countries have already accumulated large international reserves, and additional accumulation of reserves can be costly. As discussed above, there is an opportunity cost associated with buying United States Treasuries as opposed to investing in domestic development. In addition, to buy reserves, central banks intervene in the domestic foreign exchange market, buying dollars or other currencies and selling the domestic currency. This has the effect of increasing the domestic money supply, which can be inflationary. In response, central banks often sterilize the inflows through open market or similar operations. This results in greater demand for local securities, which drives up interest rates. Ironically, the higher interest rates can then attract even greater amounts of short-term capital flows, in a continuing cycle. In response, policymakers have been implementing or considering implementing capital-account regulations to moderate high volatility in capital inflows.
Capital-account management Capital controls can help mitigate the impact of volatile financial flows
Capital-account management has recently gained greater acceptance as a prudent policy measure by the international community. The IMF, which recommended against the use of capital controls in the 1990s (even though it was in contravention of Article VI of the IMF Articles of Agreement, which recognizes the sovereign right of member States to control their capital accounts), has acknowledged that capital flow management can help reduce the volatility associated with international flows under certain conditions. Indeed, over the past few years, several countries, including Brazil, Indonesia and Thailand, have introduced measures to contain the surge in short-term capital flows, as shown in table III.3.
77
International finance for development
Table III.3 Selected capital account regulations taken by developing countries (since 2009) Instrument
Country
Policy Measure
Effective Date
Tax measures and fees
Republic of Korea
Reintroduced a 14 per cent withholding tax on interest income and 20 per cent capital gains tax on Korean government bonds (KTBs) and monetary stabilization bonds (MSBs). Imposed a macroprudential levy of up to 0.5 per cent on banks’ non-deposit foreign currency liabilities. Removed a 15 per cent tax exemption for foreigners on capital gains and interest payments earned from investing in domestic bonds. Raised tax on fixed-income foreign investment to 6 per cent (introduced in October 2009 at 2 per cent). Introduced a 1 per cent tax on derivatives transactions which result in an increase in short currency (dollar) exposure or a reduction in long currency (dollar) exposure. Increased fee on non-resident purchases of central bank certificates of deposit (CDs) from 10 basis points to 400 basis points.
January 2011
Instituted a cap on banks’ holdings of foreign exchange derivative contracts (250 per cent of equity capital for foreign bank branches and 50 per cent for domestic banks).
June 2010
Reduced the limit on currency forward transactions from 125 per cent to 100 per cent of the real transactions being hedged. Instituted a cap on derivative positions (in response to an options sell-off on 11 Nov 2010), limiting the number of speculative options and futures contracts an institutional investor can hold to a maximum of 10,000 per day (Previously, institutions could hold 7,500 futures, with no limit on options contracts). Reintroduced a 30 per cent cap on lenders’ short-term overseas borrowing. Introduced a ban on foreign investors’ placing funds into time deposits. Reactivated regulation that caps foreign investment in Taiwan government bonds and money market products at 30 per cent of investors’ total portfolio. (Previously, the 30 per cent cap had only applied to debt maturing in less than one year). Imposed a minimum one-month holding period for Bank Indonesia Certificates (SBIs).
June 2010
Thailand
Brazil
Peru
Quantitative limits
Republic of Korea
Indonesia Taiwan Province of China
August 2011 October 2010
October 2010 October 2011
August 2010
January 2011
January 2011 November 2009 November 2010
Minimum investment periods
Indonesia
Reserve requirements
Indonesia
Raised the reserve requirement ratio for foreign currency deposits from 1 per cent to 5 per cent (proposed to increase to 8 per cent in June 2011).
March 2011
Brazil
Introduced requirement for local banks to deposit 60 per cent of their short positions in US dollars, interest-free, at the Central Bank after deducting 3 billion dollars or their capital base, whichever is smaller. Increased the marginal reserve requirements for short-term domestic currency deposits to 120 per cent (from 65 per cent)
April 2011
Peru
July 2010
September 2011
Sources: Institute of International Finance (IIF), “Capital flows to emerging market economies”, IIF Research Note, 24 January 2011; IMF, “Recent experiences in managing capital inflows—cross-cutting themes and possible policy framework”, 14 February 2011; national central banks and other agencies.
78
World Economic Situation and Prospects 2012
As capital flows exhibit medium-term volatility, permanent regimes of management may be preferable
Countries have a range of policy instruments at their disposal to manage cross-border capital flows. Three categories of responses are usually distinguished: macroeconomic policies, macroprudential measures and other forms of capital-account management, including capital flow regulations. Capital-account regulations should be an essential part of a broader counter-cyclical macroprudential risk management of the domestic financial sector, and should not be viewed any differently than regulation of domestic risks. Such regulations—which include price and quantity regulations, including taxes, reserve requirements, minimum investment periods and quantitative limits on certain types of cross-border capital transactions—directly target capital flows, whereas macro-tools focus on overall economic variables and the domestic regulatory framework. The IMF position has been that capital-account regulations should be employed only when macroeconomic and prudential policy measures are not sufficient to counter the negative impact of capital inflows. However, the textbook response of dealing with capital inflows by letting foreign exchange rates appreciate and slashing fiscal spending is often inadequate and can have negative side effects. Letting the exchange rate strengthen can penalize export-oriented sectors, thus impacting growth and development, while fiscal cuts can be costly, and the slow speed of fiscal decision-making makes it an ineffective policy tool for dealing with short-term volatile capital inflows. Furthermore, adopting regulations at an early stage could help limit capital inflows before asset bubbles and other risks to the economy materialize. Instead, policy measures should target the source of shocks from the outset, and therefore aim at reducing the volatility of capital flows. The IMF also contends that countries should let their currencies appreciate to fair valuation before capital controls are enforced, in order to avoid beggar-thy-neighbour policies. However, policymakers from developing countries are wary of this rule as it could impede domestic policy space. This is particularly the case since it is extremely difficult to gauge when a currency is fairly valued; in fact, one of the reasons that capital-account regulations are necessary is because the market is not fairly valuing currencies. In addition, economic costs associated with boom and bust cycles, including increased volatility of the exchange rate and potential bubbles in sectors of the economy, exist whether or not a currency is considered over- or undervalued from a theoretical perspective. Although many economists argue that capital controls should be temporary, there is a case to be made for permanent regimes, especially given the medium-term cycles in capital flows discussed above. Since capital flows can change rapidly, policymakers may need to be able to react swiftly, which is easier in a permanent regime of capital-account regulation. Such a permanent regime could be adjusted to the country’s circumstances. In this way, policies could be re-enacted quickly in a counter-cyclical fashion, and market actors would not be caught off-guard if capital-account regulations have to be reintroduced. Despite renewed interest in capital-account regulations, their effectiveness remains under debate. Most available studies find that capital controls have been effective in changing the composition of inflows away from short-term debt in many cases.20 However, the impact on total flows is more ambiguous, with regulations appearing to have been more successful in some cases than in others. This implies that the design of regulations is crucial to their success. No one-size fits all for the effectiveness of the alternative tools, and 20
See, for example, Jonathan D. Ostry and others, “Capital inflows: the role of controls”, IMF Staff Position Note, SPN10/04 (Washington, D.C., February 2010).
International finance for development
a thorough analysis of the unique situation of each country needs to guide the decisionmaking over which tools to use. Countries that have a high level of dollarization, such as Peru, might choose to focus on prudential regulations in the banking system to minimize currency mismatches, while countries with large domestic local currency markets, such as Brazil, might choose to implement direct regulations, such as taxes on inflows. As shown in table III.3, Brazil has initiated a 6 per cent tax on inflows. In addition, Brazil has also initiated new measures on cross-border derivatives which seek to limit speculative positions in the foreign exchange market via a tax on unhedged bets. For this regulation to work, Brazil needs reliable information, which they ensure by making the legal enforceability of derivatives contracts depend upon their registration in clearing houses. As such, Brazilian authorities believe that the imposition of the tax will help them keep better track of derivative positions. Brazil introduced this tax at a low level of 2 per cent, although it reserves the right to increase the tax to up to 25 per cent. Nonetheless, despite these measures, the Brazilian real devalued by 16 per cent during the increased global risk aversion of the third quarter of 2011, as discussed in chapter I. Although policymakers might welcome the weaker currency, the implication is that the earlier capital-account regulations were not fully effective in reducing volatility. However, the regulations on derivatives affected only new transactions and were only introduced in August, when sizable positions were already built in the local markets. In addition, policymakers in Brazil acknowledge that a 2 per cent tax is likely not sufficient to reduce inflows when local yields are still above 10 per cent. Brazil’s tax on inflows is a form of price control. Many economic analysts tend to prefer such price controls over quantity controls, such as China’s or India’s ban on shortterm flows. They do so in the belief that price controls are less opaque and more flexible, a factor considered particularly important in sophisticated markets. In practice, however, it is difficult to calculate the optimal tax for a price-based mechanism, especially when information asymmetries exist. Because information asymmetries are particularly acute in the financial sector, the IMF suggests a rule of thumb with price-based measures preferable in general, and quantity-based measures more appropriate for prudential purposes.21 However, when interest rate differentials are large and/or the market expects strong currency appreciation, the tax or other price-based mechanism might have to be so high to be effective as to render its implementation politically infeasible or impractical. Quantity restrictions could be preferable in such cases. In an era of financial globalization, it is no longer possible for any individual country to fully manage cross-border risk by unilateral action. Multilateral cooperation on capital-account regulations could be an important element of the international financial system. In particular, there is some fear that the implementation of measures to manage capital flows in one country might divert more speculative flows to other countries. However, developing countries have argued that evidence of negative spillover effects is limited, and that multilateral coordination of capital-account regulations and rules would serve only to reduce countries’ policy space. Bilateral and regional coordination might be an alternative to global rules. In addition, coordination would optimally include policy actions in the source countries to help reduce flows from the outset. To do so, however, would require reforms of the international financial architecture and domestic regulations. 21
Jonathan D. Ostry and others, “Managing capital inflows: what tools to use”, op. cit.
79
80
World Economic Situation and Prospects 2012
International financial reform New reforms of the financial systems are being phased in gradually
The international community has continued its efforts to reform and strengthen the international financial system. These include the introduction of Basel III, and the United States Dodd-Frank Wall Street Reform and Consumer Protection Act, as well as discussions on regulations for systemically important institutions. However, most of these measures are being phased in over a prolonged period of time and, as such, have not had an impact on the current economic and financial situation, including the risks in the European banking sector. The extent of credit risk and insolvency in the European banking system owing to the European sovereign debt crisis is unclear. Several studies have estimated that the impact is uneven across the banking sector. A recent IMF analysis found that only a small number of banks are in the high-risk zone, representing 1 per cent of assets, while a greater proportion (22 per cent of banks representing 12 per cent of assets) fall into the second-highest risk zone.22 Nonetheless, the banks that are stronger appear to have been hoarding cash, which has led to a liquidity squeeze in the interbank market. For example, most of the €56 billion supplemental long-term refinancing operations (SLTRO) provided on 26 October 2011 were placed back into the deposit facility, which implies that banks with surpluses are holding cash rather than lending it on the interbank market.23 Figure III.2 shows how bank wholesale term funding has collapsed. The fact that issuance of covered bonds, which have limited credit exposure, has also dropped significantly is a sign that the drop in funding is the result of a liquidity crisis rather than of solvency issues. Figure III.2 European bank wholesale term funding, debt securities issued by bank sector borrowers, January-October 2011 35
Billions of euros Covered
30
Unsecured
25 20 15 10 5
23
Oct-2011
Sep-2011
Aug-2011
Jul-2011
Jun-2011
May-2011
Apr-2011
Feb-2011 22
Mar-2011
0 Jan-2011
Sources: Daniel Davies and Jag Yogarajah, “Liquidity— when it comes to the crunch”, (Paris, France: Exane BNP Paribas, 7 November 2011); Dealogic.
IMF, “Global Financial Stability Report”, op. cit. Daniel Davies and Jag Yogarajah, “Liquidity—when it comes to the crunch”, (Paris, France: Exane BNP Paribas, 7 November 2011).
81
International finance for development
As discussed above, banks facing funding pressures often limit intragroup financing of foreign branches to preserve liquidity, thereby impacting financing for emerging and other developing countries. This is particularly problematic for developing countries with large foreign banks, as we saw during the financial crisis. The current strain of the liquidity squeeze in Europe will likely have a particularly strong impact on Eastern European countries. More broadly, risks to the international financial system threaten financing for developing countries, increasing the perceived need for countries to self-insure. Steps to reduce risks in financial systems in industrialized countries should thus have positive spillovers on global risk and development. In addition, these new regulations have implications for the design of developing countries’ domestic financial regulations.
Progress in reforming international financial regulation24 The Basel III standard on bank capital and liquidity A major step in the reform process has been the introduction of the Basel III framework for bank capital and liquidity regulation. The Basel Committee on Banking Supervision issued the Basel III rules text on 16 December 2010, following the endorsement by the G20 leaders at their November 2010 summit. It now needs to be transposed into national law and applied according to the agreed schedule. The Basel III requirements will be phased in gradually starting from January 2013 and are to be fully implemented by January 2019. Basel III is intended to cure several shortcomings revealed by the crisis. It provides for higher minimum capital requirements (doubling core capital), improved quality of capital and larger liquidity buffers. In addition, a simple leverage measure of 1 to 30 is introduced as a capital conservation buffer. Along with the traditional microprudential approaches, which focus on the risk of individual banks, Basel III also attempts to strengthen the macroprudential policy framework. Macroprudential policies aim to address a system-wide risk by dampening financial system pro-cyclicality and reducing systemic risk concentrations. One macroprudential tool introduced by Basel III is a separate counter-cyclical capital buffer. This buffer will be determined by the relevant regulator in each jurisdiction according to its perception of the systemic risk that has built up in the banking system as a result of excess credit growth, and will range from between 0.0 and 2.5 per cent of a bank’s risk-weighted assets, to be held in common equity. These changes are meant to increase the capacity of banks to better withstand future shocks. However, several recent studies have suggested that the changes are likely too small to increase the resilience of the system sufficiently. They suggest that core capital should be 25 per cent of risk-weighted assets.25 A recent study by the Bank of England, using fifty years of data, suggests even stronger requirements; it finds that 50 per cent of risk-weighted assets is an appropriate level of capital adequacy, given the historical frequency and severity of crises.26 Both of these amounts are significantly greater than what 24
For a more detailed discussion and critique of these measures and policy implications for emerging market countries, see Stephany Griffith-Jones, Shari Spiegel and Matthias Thiemann, “Recent developments in regulation in light of the global financial crisis: implications for developing countries”, background paper for the UN/DESA-sponsored conference on “Managing the capital account and regulating the financial sector: a developing country perspective”, held in Rio de Janeiro, Brazil, on 23-24 August 2011. Available from http://www.un.org/en/development/desa/ policy/capacity/capital_account/. 25 Ibid. 26 David Miles, Jing Yang and Gilberto Marcheggiano, “Optimal bank capital”. External MPC Unit Discussion Paper, No. 31 (London: Bank of England, April 2011).
Basel III is a major step in the reform process
Basel III does not adequately address present global risks
82
World Economic Situation and Prospects 2012
is currently envisaged by Basel III. Critics have also pointed out that a leverage ratio of 1 to 30 would not have posed significant problems for most banks before the crisis. The Basel III liquidity standards require banks to have sufficient high quality liquid assets to withstand a 30-day stressed funding scenario that is specified by supervisors. One of the important innovations is to include off-balance-sheet obligations of the banks. However, the extent to which these measures will increase the resilience of the financial system cannot yet be gauged, because they will come into force only in 2018. In the meantime, the liquidity coverage ratio has successfully been applied in the Netherlands, where it has been in force since 2003. Most Dutch banks remained liquid throughout the crisis and avoided failure, even though many of the banks had high offbalance-sheet obligations. It is unclear whether the strengthened regulatory framework of Basel III would have been sufficient to prevent the current liquidity crunch in Europe. To the extent that there is always a risk of a bank run, in either the wholesale market or the deposit market, the role of a lender of last resort is necessary to limit liquidity squeezes. This is somewhat complicated in Europe where the European Central Bank (ECB) is exclusively tasked with guarding inflation and is not supposed to maintain the health of the banking system, and individual country central banks cannot print money. One goal of Basel III is to create a globally consistent and harmonized regulatory structure as a way to ensure a level playing field. It is thus considered important to discourage a competitive race to the bottom and beggar-thy-neighbour policies that might benefit narrow national interests at the expense of global financial stability. At the same time, given diverse national structures, the challenge is to strike the right balance between ensuring an international level playing field and accommodating country differences, in order not to place an unnecessary burden of adjustment on national financial systems. Repercussions of Basel III on access to financing for low-income countries should also be taken into account, including possible adverse impacts on trade finance, since Basel rules do not give credit to the collateral used to secure trade financing. Similarly, applying Basel III to developing country banks could result in reduced domestic long-term lending. This may be counteracted, however, through changes in domestic regulatory systems in developing countries, as discussed below.
Regulation of systemically important financial institutions and the shadow banking system
The Financial Stability Board has developed a framework to address globally systemically important financial institutions
The 2008-2009 global financial crisis underscored the need to put in place additional measures to reduce the likelihood and the severity of problems emerging at systemically important financial institutions. Accordingly, in addition to the Basel III standards, an international effort is under way to reduce the probability of failure for such institutions or, in the event of a failure still occurring, to limit its impact on the financial system as a whole. The Financial Stability Board (FSB) has developed a set of policy measures to address systemically important financial institutions (SIFIs), particularly globally systemically important financial institutions (G-SIFIs).27 The implementation of the set of policy measures and the timeline for their implementation were endorsed by the G20 leaders at their Cannes Summit in early November 2011. 27
Financial Stability Board (FSB), “Policy measures to address systemically important financial institutions” (Basel, Switzerland, 4 November 2011), available from http://www. financialstabilityboard.org/publications/r_111104bb.pdf.
International finance for development
A key element of the measures is that SIFIs should have a loss-absorbing capacity beyond the general Basel III, including an additional 1.0-2.5 per cent capital versus risk-weighted assets, to be held in common equity, depending on a bank’s systemic importance. For banks facing the highest surcharge, an additional loss absorbency of 1 per cent could be applied. The additional capital charges are also thought to level the playing field by reducing too-big-to-fail competitive advantages in funding markets. The FSB and the Basel Committee on Banking Supervision have identified an initial group of 29 G-SIFIs, which will be updated annually based on criteria such as size, interconnectedness and substitutability. However, the additional 1.0-3.5 per cent is still significantly below what many studies have determined as sufficient levels of capital. Nonetheless, the attention to the issue and the additional requirements constitute important steps in reducing the risks associated with being “too big to fail”. The measures put forth by the FSB further aim to establish more intensive and effective supervision of all SIFIs. Moreover, the FSB defined key features and instruments that all national resolution regimes should have to enable authorities to resolve failing financial firms in an orderly manner and to determine requirements for resolvability assessments and for recovery and resolution planning for G-SIFIs. The implementation of these measures will begin in 2012, with full implementation targeted for 2019, a relatively long phase-in period, which opens up the risk that rules will not be implemented consistently across countries. The FSB intends to complement these policy measures with stronger international standards for core financial market infrastructures to reduce contagion risks when failures occur. Another important issue is integrating into the regulatory framework the so-called shadow banking system, for instance, credit intermediation through non-bank channels. In this context, there is a need to ensure that tighter regulatory rules on banks do not provide incentives for financial institutions to shift their activities to unregulated areas. The challenge is to establish an appropriate definition of shadow banking and outline possible regulatory measures to address the risks posed by this sector. In October 2011, the FSB set out principles for the monitoring of shadow banking, 28 which calls on the relevant authorities to first assess the broad scale and trends of non-bank credit intermediation in the financial system. Based on this assessment, authorities should narrow their focus to those types of non-bank credit intermediation that have the potential to pose systemic risks, by focusing in particular on those involving key risk factors, such as maturity transformation, liquidity transformation, imperfect credit risk transfer and/or leverage. Authorities should then assess the potential impact of the severe distress or failure of certain shadow banking entities on the overall financial system. In addition, the FSB defined five specific areas for which recommendations for further regulatory action will be developed in 2012: banks’ interactions with shadow banking entities, money market funds, other shadow banking entities, securitization and securities lending and repurchase agreements. In addition to the key areas outlined, the FSB is studying other regulatory initiatives, including regulations for over-the-counter derivatives, rating agencies, alternative investment vehicles, consumer finance protection and financial market infrastructures.
28
FSB, “Shadow banking: strengthening oversight and regulation” (Basel, Switzerland, 27 October 2011), available from http://www.financialstabilityboard.org/publications/r_111027a.pdf.
83
The FSB is also developing a regulatory framework for the shadow banking system
84
World Economic Situation and Prospects 2012
Financial stability and regulation in emerging economies and developing countries Developing countries can draw lessons from international financial reforms
There are several lessons that policymakers in developing and emerging markets can draw from these reforms for the design of domestic regulations. As Basel III was designed for sophisticated financial markets, it is not clear that all of the measures in the agreement are appropriate for developing countries. In particular, reforms to banking regulation also need to take into account any impact they may have on growth and access to credit, as well as on stability. Policymakers in developing countries can choose to implement the elements of these agreements that best suit their needs. For example, it might make sense for policymakers to integrate several of the ideas underlying Basel III—such as counter-cyclical buffers, liquidity ratios, increase in the quantity and, especially, the quality of core capital, adapted to local circumstances—into national regulatory frameworks. A case may even be made for countries to accelerate the implementation of Basel III suggestions onto a schedule that is quicker than the gradual one of Basel itself in areas that would be particularly relevant to their financial systems (such as, for example, counter-cyclical regulation). Policymakers should also engage in emergency planning to address the failure of large international banks operating in the country. Requiring banks to have subsidiaries, rather than branches, in the local market can help in this area. Alternative measures such as public development banks and directed credit could also be employed to improve access to credit. More broadly, reforming and improving financial regulation in emerging economies and developing countries is an important part of the global reform agenda to promote the mobilization of resources, reduce risks and promote financing for development.
Global liquidity mechanisms: current debates and the need for further reform Countries rely on a hybrid mechanism to cope with systemic crises
An effective global financial safety net is an important backstop for the preservation of global economic and financial stability. Currently, countries rely on a hybrid system of financial safety, combining reserve accumulation, bilateral agreements and regional and multilateral mechanisms to cope with systemic crises. The international financial safety net was strengthened during the recent crisis and its aftermath. In 2010, the IMF increased the duration and credit available under the existing Flexible Credit Line, an insurance option for countries with very strong policies and economic fundamentals, and established a new Precautionary Credit Line. The Precautionary Credit Line, a form of contingency protection, is designed for those countries that do not qualify for the Flexible Credit Line, but that have only moderate vulnerabilities. Unlike the Flexible Credit Line, the Precautionary Credit Line features ex post conditionalities focused on reducing any remaining vulnerabilities identified in the qualification assessment. G20 leaders, at their summit in November 2011, expressed support for the IMF in putting forth a new Precautionary and Liquidity Line (PLL) to provide, on a case-by-case basis, increased and more flexible short-term liquidity to countries with strong policies and fundamentals facing exogenous shocks. Resources available to the IMF to carry out its lending activities have increased significantly. The Fourteenth General Review of Quotas was completed in
85
International finance for development
December 2010, with a decision to double IMF quota resources to approximately $750 billion, and is awaiting ratification by the membership. Borrowing arrangements with member countries and central banks have also been enhanced. The expanded and more flexible New Arrangements to Borrow, with a total borrowing capacity of about $580 billion, became operational in 2011. However, discussions to further enhance IMF resources have stalled. In order to ensure the capacity of the IMF to provide large-scale liquidity support in the future, there are proposals to further enlarge its resource base, such as by issuing SDRs, as discussed earlier. The G20 is considering enhancing the SDR basket to include additional currencies and potentially increasing allocations of SDRs. The current requirement for inclusion in the basket, as set out in the IMF Articles, is that a currency be “freely usable”, implying widely used and widely traded. This requirement was implemented only in 2000, and discussions are currently under way for including alternative criteria, tailored explicitly to the reserve asset characteristics of the SDR, to be based on three key characteristics: liquidity in foreign exchange markets; “hedgeability”; and availability of appropriate interest rate instruments. However, this view has been challenged by some developing countries, which point out that the basket has included non-tradable currencies that did not meet these criteria in the past. While the cooperative efforts during the crisis have strengthened the global financial safety net, important issues remain regarding the sufficiency and composition of international liquidity support. Indeed, the crisis has highlighted the need for large liquidity buffers to deal with fast and sizeable capital market swings. This requires a further strengthening of the multilateral capacity to cope with shocks of a systemic nature. In this regard, it has been stressed that in the recent crisis, the bulk of the needed liquidity was provided through ad hoc arrangements deployed on a one-off basis by key central banks. It has also become evident that uncertainties about the availability and functioning of financial safety nets can impose significant costs.29 There are a number of suggestions on how to make the global financial safety net more effective and predictable. An ambitious proposal is to develop the IMF as an international lender of last resort that would provide access to liquidity when no other lender is willing to lend in sufficient volume to deal effectively with a financial crisis.30 Countries could qualify for access to this facility through regular Article IV IMF surveillance without additional conditions. The liquidity would need to be largely provided by countries issuing reserve currencies, which would, however, impose far-reaching obligations on major central banks to grant access to liquidity when the facility is triggered. The IMF itself is exploring related options to set up a permanent mechanism to provide liquidity in systemic crises in conjunction with bilateral and regional liquidity support arrangements.31 A key element in strengthening the global financial safety net is closer cooperation with regional and subregional mechanisms. Regional financial arrangements can play an important role in preventing and mitigating financial crises and strengthening the global 29
30
31
See, “Assessing the agenda for economic policy cooperation”, speech by John Lipsky, IMF First Deputy Managing Director, at the Conference on Macro and Growth Policies in the Wake of the Crisis, Washington, D.C., 7 March 2011, available from www.imf.org. See, for instance, Eduardo Fernández-Arias and Eduardo Levy-Yeyati, “Global financial safety nets: where do we go from here?”, IDB Working Paper Series, No. IDB-WP-231 (Washington, D.C.: InterAmerican Development Bank, November 2010). IMF, “The Fund’s mandate—the future financing role: reform proposals”, Washington, D.C., 29 June 2010, available from www.imf.org.
SDR issuance could be used to strengthen the global financial safety net
Greater coordination is needed between multilateral and regional financial safety net mechanisms
86
World Economic Situation and Prospects 2012
financial safety net. Major regional arrangements are the Arab Monetary Fund (AMF), the Chiang-Mai Initiative (CMI), assistance facilities within the European Union (EU) and the Latin American Reserve Fund (FLAR). Positive experiences with regard to regional balance-of-payments assistance facilities exist particularly in Latin America. The FLAR is the issuer with the highest rating in Latin America and has been contributing to regional financial stability by providing member countries with crisis liquidity. In other regions, reserve funds and financial assistance facilities are currently being enhanced. In Europe, the European Financial Stability Facility was created in 2010 as a vehicle to fund assistance to member countries in financial distress; it is to be succeeded by the permanent European Stability Mechanism (ESM) in 2013. In Asia, the Association of Southeast Asian Nations (ASEAN)+3 countries32 in 2010 enhanced the Chiang-Mai Initiative from a bilateral swap network to a multilateral reserve pool arrangement so as to strengthen the region’s capacity to address balance-of-payments and short-term liquidity difficulties. Member countries also introduced a voting procedure for the disbursement of funds. Most of these mechanisms have provided crisis liquidity to member States during the recent economic and financial crisis, partly in conjunction with IMF programmes.
International development cooperation and official flows Official development assistance ODA peaked at $128.7 billion in 2010…
…but fell well short of commitments
Official development assistance (ODA) from member countries of the Development Assistance Committee (DAC) of the Organization for Economic Co-operation and Development (OECD) reached a record level of $128.7 billion as at the end of 2010 (see figure III.3). This accounts for 0.32 per cent of DAC members’ combined gross national income (GNI). The largest increases in real terms in ODA between 2009 and 2010 were recorded by Australia, Belgium, Canada, Japan, the Republic of Korea, Portugal and the United Kingdom of Great Britain and Northern Ireland. 33 However, aid flows remain insufficient and aid delivery has been pro-cyclical and volatile. Global aid delivery remains far below the United Nations target of 0.7 per cent measured as the ratio of net ODA to donor country GNI. Only five countries (Denmark, Luxembourg, the Netherlands, Norway and Sweden) have met or exceeded that target. For DAC donors as a whole, however, aid flows fell $18 billion short of the $127 billion (in 2004 prices and exchange rates) pledged for 2010 at the 2005 Gleneagles Group of Eight (G8) Summit. The shortfall in aid to Africa is an even larger percentage. At Gleneagles, donors pledged to increase ODA to Africa by $25 billion per year, yet Africa had only received an additional $11 billion on an annual basis by the end of 2010. DAC member countries’ ODA to the least developed countries (LDCs) rose from 0.05 per cent (or $12 billion) of their aggregate GNI to 0.10 per cent (or $37 billion). Again, this level of ODA is still well below the United Nations target of 0.15-0.20 per cent to be reached by 2015. As of 2009, only seven OECD DAC donors (Belgium, Denmark, Ireland, Luxembourg, the 32
33
Ten members of ASEAN (Brunei Darussalam, Cambodia, Indonesia, the Lao People’s Democratic Republic, Malaysia, Myanmar, Philippines, Singapore, Thailand and Viet Nam) and China, Japan and the Republic of Korea. The data analysis draws heavily on the MDG Gap Task Force Report 2011: Time to Deliver (United Nations publication, Sales No E.11.I.11), available from http://www.un.org/en/development/desa/ policy/mdg_gap/index.shtml.
International finance for development
87
Figure III.3 ODA growth rate per annum, 2000-2013 40.0
Percentage
30.0
World
20.0 10.0 0.0 -10.0 -20.0 -30.0
Africa
20112013a
2010
2009
2008
2007
2006
2005
2004
2003
2002
2001
2000
-40.0
Netherlands, Norway and Sweden) had exceeded the upper bound of the United Nations target and two donors (Finland and the United Kingdom) had surpassed the lower bound of the target. While country programmable aid to the majority of LDCs is projected to increase by a total of $2.3 billion from 2009 to 2012, 13 countries are likely to face a reduction of about $0.8 billion, with virtually no growth projected for 2012. The 2010 Millennium Development Goals (MDGs) Summit, recognizing the shortfalls in ODA delivery, reiterated the critical importance of fulfilling all ODA commitments and encouraged donors to establish specific timetables to reach their pledge targets. Similarly, the May 2011 Istanbul Programme of Action for LDCs called upon donor countries to implement their ODA commitments to LDCs by 2015 and to consider further measures to increase the availability of resources for the most disadvantaged countries. However, the short- and medium-term forecast for increasing ODA looks very uncertain. Given the fragile recovery in developed countries and the possibility of a doubledip recession in Europe, most donors plan to increase aid over the coming three years at a much reduced pace. Whereas ODA from the 15 EU countries had increased slightly from 0.44 per cent of their combined GNI in 2009 to 0.46 per cent in 2010, the ongoing fiscal crises in Greece, Ireland, Italy and Spain have already translated into significant drops in their ODA (figure III.4). According to a recent OECD survey, country programmable aid will grow at 2 per cent per year between 2011 and 2013, compared to the average of 8 per cent per year over the past three years. On the positive side, grants and the grant element of concessional loans have increased over time, especially in aid directed towards LDCs, their weight having reached 99.3 per cent in 2008-2009, compared to the 96.1 per cent of aid to all recipients. Also, 84 per cent of bilateral aid was classified as untied by 2009, although that share drops to 70 per cent with the inclusion of technical cooperation and food aid.
Source: OECD-DAC aid statistics, 2011, available from http://www.oecd. org/document/29/0,3746, en_21571361_44315115_ 47519517_1_1_1_1,00.html. a UN/DESA projections.
ODA flows are expected to decelerate in the coming three years
88
World Economic Situation and Prospects 2012
Figure III.4 EU-15 ODA growth rate per annum, 2009-2010 40.0
Percentage 31.5
30.0
8.8 4.3
6.9
7.3
9.9 2.2
0.0 -1.5
-0.3
-4.9
-5.9
-10.0
-7.1
United Kingdom
Sweden
Portugal
Netherlands
Luxembourg
Italy
Ireland
Germany
France
Finland
Denmark
Belgium
Greece
-16.2
-20.0 Austria
Source: OECD-DAC aid statistics, 2011, available from http://www.oecd.org/ document/35/0,3746, en_2649_34447_47515235_1 _1_1_1,00.html.
Spain
10.0
19.4
19.1
20.0
The allocation of aid remains unequal. As of 2009, the top 10 ODA recipients received one fourth of all aid; in 2000, these same countries absorbed about 13 per cent of the total. This suggests that aid concentration persists despite the fact that favoured aid recipients change over time. The current pattern of aid allocation illustrates the difficulties donors face in meeting multiple priorities in an environment of weakening growth in their aid volume, a situation which, in turn, poses the threat of overlooking critical development needs of the recipient countries. While aid is not the only source funding productive investment, the contribution of aid-financed, productivity-enhancing public investment in developing countries continues to be essential, especially in the LDCs. However, a background study for the 2012 United Nations Development Cooperation Forum (DCF) found that the proportion of aid funding for economic infrastructure in LDCs has hardly changed (4.0 per cent in 2002 to 4.1 per cent in 2009). Furthermore, LDCs with relatively low aid dependence (that is, whose aid receipts are less than 9.2 per cent of their GNI) were the only programme country grouping that received a lower proportion of aid for economic infrastructure in 2009 (0.9 per cent) than in 2002 (1.8 per cent).34 The shortfalls in meeting aid commitments have led to renewed calls to strengthen further the follow-up processes on development cooperation by improving existing global monitoring and evaluation mechanisms and exploring new modalities, such as international peer reviews. The DAC adopted, in April 2011, a “Recommendation on Good Pledging Practice”, advising its members to ensure clarity by specifying in their 34
See, “Trends in international financial cooperation for LDCs”, background study for the 2012 Development Cooperation Forum, draft of 29 April 2011, p. 27, available from http://www.un.org/ en/ecosoc/newfunct/pdf/ldc_study-executive_summary_en.pdf.
International finance for development
89
pledges all parameters relevant to the assessment of the pledges. Related topics were discussed at the High-level Dialogue on Financing for Development of the General Assembly, held in New York from 7 to 9 December 2011, and at the preparatory meetings for the 2012 DCF. Donor States, recipient countries and other relevant stakeholders also met for the Fourth High-Level Forum on Aid Effectiveness (Busan, Republic of Korea, 29 November-1 December 2011) to reassess the aid effectiveness agenda. In the run-up to the Fourth High-Level Forum on Aid Effectiveness, OECDDAC conducted an online survey of the priorities and ideas of Governments, donors and non-State actors in over 80 developing countries.35 Alongside calls for the full implementation of the Paris Declaration, the results of the survey called for broadening the agenda to consider more actors, additional sources of finance, and non-aid dimensions of development effectiveness. The agreement reached by the High-Level Forum in Busan stressed the importance of domestic ownership, greater cooperation between developing countries, improved domestic institutions, South-South cooperation, domestic resource mobilization, and the role of the private sector. Specific commitments in the agreement were made on improving standards for transparency and implementing a common standard for the electronic publication of information on resources by 2015. However, donors did not make new commitments in other areas, such as aid predictability, improving efficiency or untying aid. For example, those donors who made commitments on aid predictability in the Accra Agenda reaffirmed those commitments, but other actors agreed only to aim to provide developing countries with timely and relevant information on their intentions in this area. Donors agreed to accelerate efforts to address insufficient resources by agreeing on principles to guide actions by the end of 2012. The 2012 DCF will provide an important opportunity to review the issues and the recent trends in international development cooperation, including the coherence of national and international aid efforts and a burgeoning number of potential additional sources of aid, so as to best align aid policies with national development strategies. The debate and activities under the DCF complement those of the Paris and Accra initiatives, and include the second survey on mutual accountability between donors and programme countries and aid transparency at the country level, undertaken with the United Nations Development Programme (UNDP). The DCF is also exploring ways to strengthen developing country policy space and their capacity to monitor and manage results, as well as mutual accountability for development cooperation.
South-South cooperation ODA from DAC members is increasingly complemented by other programmes of assistance from developing countries and economies in transition. South-South cooperation has helped to meet certain gaps in assistance provided by Northern donors, particularly in the area of infrastructure, and has been seen as relatively predictable, more flexible and responsive to national priorities.36 These flows were estimated to have reached $7 billion in 2009, although this is believed to grossly understate the total extent of South-South coop35
36
See Organization for Economic Cooperation and Development (OECD) Working Party on Aid Effectiveness, “What do partner countries want from HLF-4? Results of the online consultation”, 22 February 2011. “Trends in international financial cooperation for LDCs”, op. cit., p. 26.
South-South cooperation has been seen as more reliable and flexible
90
World Economic Situation and Prospects 2012
eration. A study for the World Bank estimated that non-DAC official assistance was in the range of $12 billion to $15 billion in 2008.37 Another study undertaken for the DCF has estimated that South-South cooperation flows reached $15 billion in 2008, an increase of 78 per cent since 2006. In recognition of the growing importance of South-South aid, the DAC Working Party on Aid Effectiveness hosted a Task Team on South-South Cooperation comprising Governments from the North and the South, regional organizations and civil society. The DAC formalized its efforts to forge a global partnership with other key players by issuing, in May 2011, a statement calling for open dialogue without preconditions.
Innovative sources of finance
The overall contributions of innovative financing mechanisms are still modest
Innovative sources of development finance (IDF) aim to raise financing for development from sources other than central Government budgets in the developed world, to provide stable and predictable funding sources and to address gaps in the current aid architecture (such as financing for the provisioning of global public goods). There has been considerable progress in innovative financing mechanisms since the Monterrey Consensus, although their overall contributions are still modest. During the period 2002-2010, based on the OECD classification, innovative financing mechanisms contributed $5.5 billion to development finance for the health sector and $31 billion for climate change and the environment, the latter mostly from carbon emissions trading. Although innovative financing should supplement and not be a substitute for traditional sources of financing, most of the $5.5 billion raised for the health sector is currently counted as ODA. The resources that have not counted as ODA amounted to only $0.2 billion of non-government contributions, although even these non-ODA resources may eventually be reported as ODA when they are disbursed. 38 Of the $31 billion raised for climate change and the environment, most represented private financial and investment flows and were, therefore, classified as non-ODA.39 Given the tremendous financing needs of developing countries and the unpredictability of existing aid flows, ways to expand innovative sources of development financing should be explored further and, where appropriate, expanded to complement traditional ODA. Delivery mechanisms and the allocation of aid flows need to be strengthened so that such resources can be provided on a stable, predictable and voluntary basis. Harmonization of fragmented monitoring and evaluation mechanisms is needed to reduce transaction costs. There is also a need for independent monitoring and evaluation at the international level to assess the delivery, allocation and impact of innovative financing on development outcomes.
37
38 39
Penny Davies, “A review of the roles and activities of new development partners”, CFP Working Paper series, No. 4 (Washington, D.C.: Concessional Finance and Global Partnerships, World Bank, January 2010). United Nations, “Report of the Secretary-General on innovative mechanisms of financing for development”, 1 September 2011, A/66/334. There is considerable divergence between the OECD and the World Bank classifications regarding what constitutes innovative financing, and estimates vary as a result. For further details, see United Nations, “Report of the Secretary-General on innovative mechanisms of financing for development”, ibid.
International finance for development
91
Developing country debt relief40 The rise in public expenditure and decreased revenue resulting from the global crisis has led to increased fiscal deficits and borrowing in many developing countries. Across regions, 20 countries remain at high risk of or are already in debt distress.41 In 2010, 60 countries maintained public debt-to-GDP ratios over 40 per cent (17 low-income countries, 22 lower middle income countries and 21 upper middle income countries).42 Yet, despite an 8 per cent increase in nominal external debt in 2010, the recovery in growth and exports of many developing countries has led to an improvement in debt indicators.43 The ratio of external debt to GDP decreased from 23.7 per cent in 2009 to 21.6 per cent in 2010. Estimates for the ratio of external debt service to exports of goods and services for 2010 also show a return to pre-crisis levels for all income groups, reaching 6.5 per cent in low-income countries, 19 per cent in lower middle income countries and 35 per cent in upper middle income countries, as shown in figure III.5. In many countries, fiscal deficits have been partly financed through rising domestic debt, which increased to 3.7 per cent of GDP for low-income countries and 4.5 per cent for middle-income countries in 2009. Owing to the economic recovery, however, fiscal deficits decreased slightly in 2010 to 3.6 per cent and 3.7 per cent in low-income and lower middle income countries, respectively. Upper middle income countries have not
The recovery in growth has led to an improvement in debt indicators
Figure III.5 External debt service-to-exports ratio, 2005-2010 50
Percentage
40 Upper middle income countries 30
All low- and middleincome countries
20
10
Lower middle income countries
Low-income countries
0 2005 40
2006
2007
2008
2009
2010
This section’s analysis also draws on the MDG Gap Task Force Report 2011: Time to Deliver, op. cit. IMF, “List of LIC DSAs for PRGT-eligible countries, as of 7 October 2011”, available from www.imf. org/external/pubs/ft/dsa/dsalist.pdf. 42 Based on IMF, World Economic Outlook database, April 2011. 43 Ibid. 41
Source: International Monetary Fund (IMF) World Economic Outlook, April 2011 database. Note: The debt service recorded refers to actual payments.
92
World Economic Situation and Prospects 2012
The HIPC Initiative and MDRI has reduced the debt of 36 countries by over 80 per cent
The debt sustainability frameworks are under review
The European debt crisis has highlighted the lack of a legal framework for sovereign debt restructuring
yet recovered the surplus they exhibited until 2008, with a deficit of 3 per cent of GDP in 2010 compared to a surplus of 1 per cent in 2006-2008. The recovery has been uneven, with some countries and regions still coping with large fiscal deficits, especially given the additional shocks of higher food and energy prices. The Heavily Indebted Poor Countries (HIPC) Initiative, together with the Multilateral Debt Relief Initiative (MDRI), had reduced the debt of 36 post-decision-point heavily indebted poor countries 44 by over 80 per cent by the end of 2010.45 From 1999 to 2010, the aggregated debt-service payments of the 36 post-decision-point countries fell from 18 per cent of exports to 3 per cent, and the present value of debt to GDP declined from 114 per cent to 19 per cent. The fiscal space created by the reduced debt burden has been used, in part, to increase spending for poverty reduction. Related expenditures were projected to have increased from 44 per cent of revenue in 2001 to 57 per cent of revenue in 2010.46 The main debt sustainability monitoring instruments—the joint World Bank-IMF Debt Sustainability Framework for low-income countries and the IMF Debt Sustainability Analysis (DSA) for market access countries—are currently under review. Modernizing the framework for fiscal policy and public debt sustainability analysis (DSA) has become necessary, particularly in the light of the recent crisis and rising sustainability concerns in some advanced economies. While recognizing the inherently challenging nature of such analysis, a recent IMF paper recommended that the DSA should be improved through a greater focus on the realism of baseline assumptions, the level of public debt as one of the triggers for further analysis, analysis of fiscal risks, vulnerabilities associated with the debt profile and broader coverage of fiscal balance and public debt.47 It also proposes to move to a risk-based approach to DSAs for all market access countries, such that the depth and extent of analysis would be commensurate with concerns regarding sustainability, with a reasonable level of standardization. In addition to these improvements, it remains crucial that future DSA analysis pay heed to the total liability structure of public and private debt, domestic and external, including contingent liabilities in the financial sector, as well as the purpose and cost-benefit analysis of loans to be taken into account when gauging debt sustainability. Further measures should be taken to improve the data availability and reliability in reporting procedures. Debt problems often occur due to natural disasters, international financial volatility and other exogenous shocks, even when countries have good economic policies and strong debt management. Structural vulnerabilities to shocks can therefore be as important as policy and institutional quality. The European debt crisis has highlighted the lack of a legal framework for sovereign debt restructuring for countries in debt distress. In general, without a legal framework, sovereign debt restructuring risks being incomplete, drawn out, chaotic and costly. The uncertainty surrounding the process adds risk to the global financial system; 44 45 46
47
The number of Multilateral Debt Relief Initiative beneficiary countries is 32, excluding 4 interim heavily indebted poor countries. World Bank, “HIPC At-A-Glance Guide (Spring 2011)”, (Washington, D.C.), available from http:// www.worldbank.org/economicpolicyanddebt. International Development Association (IDA) and IMF, “Heavily Indebted Poor Countries (HIPC) Initiative and Multilateral Debt Relief Initiative (MDRI): Status of implementation”, 14 September 2010. IMF, “Modernizing the framework for fiscal policy and public debt sustainability analysis”, (Washington, D.C.: IMF Fiscal Affairs Department and Strategy, Policy, and Review Department, 5 August 2011).
International finance for development
this risk has been cited as one of the reasons why countries feel the need to build reserves.48 A sovereign bankruptcy framework, with a fair arbiter, could thus be an important element in reducing global risk. In addition, current debt relief and restructuring approaches have not paid sufficient attention to basic growth requirements and the expansion of policy space genuinely needed to overcome debt distress. The Paris Club of official creditors’ arrangement calls into question a process in which an ad hoc committee of creditors passes judgement on debtor country obligations. The share of creditors that are members of the Paris Club in total debt has become relatively small, owing to increased borrowing from multilateral, private sector and emerging market creditors and earlier debt-reduction operations provided by the Paris Club. Paris Club lenders accounted for 20 per cent and 13 per cent of the debt for low-income and lower middle income countries in 2009, while their share for upper middle income countries was only 2 per cent.49 Since flows from non-Paris Club creditors are on the rise, new modalities may be needed to deal with problems in debt owed by emerging economies and developing countries to non‑Paris Club creditors. In addition, the legal basis for private and official non-Paris Club creditors to provide treatment comparable to that of the Paris Club is weak and non-binding. There are also issues related to the transparency and efficiency of the process, such as problems in debt data reconciliation and the interest rate at which debt rescheduling is carried out. Furthermore, there are possible conflicts of interest between the role of the IMF as a preferential creditor in official debt restructuring, on the one hand, and its role in assessing the financing gap to be filled by the Paris Club, on the other. There are also numerous other conflicts of interest in the debt restructuring process that are difficult to resolve with some form of adjudication. The outcome document of the 2010 MDG Summit called for the consideration of an enhanced approach to debt restructuring, but no action has been taken so far. The establishment of a more permanent debt-restructuring machinery that would invite all creditors to deal simultaneously and comprehensively with a debtor country’s difficulties, as needed, could resolve many of the shortcomings in the existing system. An international mechanism could be empowered to adjudicate disputes if informal negotiations fail. Other difficulties that it could address pertain to the delay and attendant high costs in finding a resolution, as well as the lack of comprehensiveness in dealing with all liabilities. The system needs to be fairer and to be able to work out debt problems in a more timely and effective manner. Going forward, the practical options for enhancing the financial architecture for debt restructuring could be discussed at the United Nations with the participation of all relevant stakeholders from the official and private sectors. In more general terms, risk in the international financial system threatens financing for development and has led to a build-up in reserves and a worsening of global imbalances. Reforms of the international system are necessary in order to secure financing and enable development.
48 49
Barry Herman, José Antonio Ocampo and Shari Spiegel, Overcoming Developing Country Debt Crises (New York: Oxford University Press, April 2010). See Paris Club, available from http://www.clubdeparis.org/; and IMF, World Economic Outlook database, April 2011, op. cit.
93
95
Chapter IV
Regional developments and outlook Developed market economies: recovery weakens with ominous overtones Growth in the developed market economies is slowing and the risks of recession have increased dramatically. The post-recession recovery was already weak, which is typical of recoveries following financial crises where bank lending is constrained as balance sheets are repaired and consumers increase savings rates to make up for large losses in wealth and high levels of debt. Due to the loss of revenue and increased expenditures incurred, the recession also left Governments with greatly elevated levels of budget deficits and debts that have now led to considerable pressure for budget consolidation in most countries. High levels of unemployment in many developed countries are a most bitter legacy of the recession. These have hardly budged since the onset of the recovery, and threaten to become entrenched. The recovery to date has been heavily dependent on external demand emanating from the emerging markets and the remnants of fiscal and monetary stimuli enacted during the recession. Headwinds began to emerge as oil prices spiked early in the year, the multifaceted disaster in Japan disrupted global manufacturing supply lines and demand from emerging markets began to decelerate. The largest shock, however, was the emergence of the sovereign debt crisis in Europe. The crisis is having multiple negative impacts on economic activity. It has forced affected countries to adopt extreme fiscal tightening programmes that have pushed them close to or into recession and generally increased pressure for fiscal austerity across the region. It has led to renewed financial crisis where sharp increases in sovereign bond spreads for the affected countries have weakened the balance sheets of banks holding this debt, causing further turmoil in an already delicate banking system, currency swings as investors search for safe havens and general turbulence in financial markets. It has also plunged the confidence of both producers and consumers, thereby affecting consumption and investment spending. The baseline forecast assumes that the crisis remains contained (see box I.1 for a more complete discussion of the underlying assumptions), but the risks of a considerably less favourable outcome have increased.
North America United States of America: growth decelerating and dangers from fiscal impasse During the first half 2011, economic growth in the United States decelerated significantly to an annualized rate of 0.8 per cent from 3.0 per cent for 2010 as a whole. Among other things, the spike in world oil prices beginning in late 2010 and the impact of the earthquake in Japan on the supply chains to industrial producers were two important causes for this slowdown. During the third quarter, many survey-based indicators plummeted close
96
World Economic Situation and Prospects 2012
Households are cautious about increasing spending
Fiscal support for growth is declining fast
to recession levels. Nevertheless, hard data covering this period showed that growth actually accelerated. For the whole of 2011, gross domestic product (GDP) is expected to grow by 1.7 per cent, followed by 1.5 per cent and 2.0 per cent for 2012 and 2013, respectively (see annex table A.1). Personal consumption expenditure is expected to remain modest in the outlook conditioned on three major factors: a historically weak labour market, a continued balance-sheet adjustment by households and the impact of the shift to fiscal austerity. First, the situation for employment has been dismal, with the unemployment rate staying at about 9 per cent throughout 2011. Almost no improvement is expected in 2012 and 2013 (annex table A.7). After almost two years of recovery, the number of payroll employees is still more than 4 per cent lower than its pre-crisis peak. The slack in the labour market also dampened wage growth (figure IV.1). Consequently, total labour income for households in nominal terms was only about 2 per cent higher in 2011 than in 2008. Second, households have yet to fully repair their balance sheets, damaged from the financial crisis and the collapse in the housing market. Although house prices seemed to be approaching stabilization in late 2011, their level is still more than 25 per cent below their peak in 2006. The value of real estate owned by households suffered a loss of similar magnitude, while on the liability side, outstanding mortgages declined by only about 6.5 per cent over the same period. Financial assets held by households almost resumed their pre-crisis level by mid-2011, but the volatile developments in global equity markets have contributed to a heightened level of caution by consumers. Under all these pressures, private consumption growth is projected to be about 2 per cent per year over the baseline forecast period. The third restraining factor comes from public finance. It is assumed that the economy will receive only minor fiscal stimulus over the forecast period. After the Figure IV.1 Unemployment ratea and hourly earningsb in the United States, January 1990-October 2011 4.5
3 Hourly earnings (left-hand scale)
3.5
5
3.0
6
2.5
7
2.0
8
Unemployment rate (right-hand scale)
Jan-2010
Jan-2008
Jan-2006
Jan-2004
Jan-2002
11 Jan-2000
0.5 Jan-1998
10
Jan-1996
1.0
Jan-1994
9
Jan-1992
1.5
Jan-1990
Source: UN/DESA, based on data from the United States Bureau of Labor Statistics. a Seasonally adjusted civilian unemployment rate (percentage). b Annual percentage of average hourly earnings of production and nonsupervisory employees, total private sector.
4
Reversed scale
4.0
97
Regional developments and outlook
acceleration in federal Government debt accumulation during the recession, policy shifted towards a strategy to stabilize the debt situation over time. Unfortunately, since the 2010 mid-term elections, the decision-making-process has become extremely protracted. The federal Government budget for fiscal year 2011, which ended in September 2011, was not finalized until April 2011, and the impasse during that process almost forced a shutdown of the federal Government. In July 2011, the battle resumed, this time over raising the debt ceiling, which became coupled with a major political struggle over how to cut the fiscal deficit, and raised the spectre of a possible default. Although a stop-gap agreement was finally reached at the last minute to avoid the much feared default on the Treasury securities, it was not enough to stop one credit rating company (Standard & Poor’s) from downgrading the rating for United States Treasury long-term securities by one notch. The low level of consumer and business confidence observed in August and September 2011 was strongly connected to these developments. The special committee set up under that agreement failed to reach a deal for deficit reduction by the sanctioned deadline, and longterm action to cut spending may take effect in 2013. In the baseline scenario outlook, it is assumed however, that two elements of the proposed American Jobs Act—the payroll tax holiday and emergency unemployment compensation—will be enacted in 2012. The federal fiscal deficit is projected to decline from a level of 8.6 per cent of GDP for fiscal year 2011 to 5.2 per cent for fiscal year 2013. In the forecast, residential fixed investment, while not expected to provide significant support to growth, will not have the same dampening effect that it did over the period 2008-2010. Business investment, however, is expected to provide noticeable support. Many large profit-making corporations have accumulated huge amounts of very liquid assets over the course of the recovery. Interest rates remain low due to the continuing expansionary monetary policy. For those businesses with access to bank lending or those that can raise funds from financial markets, the financing cost for new investment is very low by historical standards. Investment in equipment and software, which has been expanding strongly since the onset of the recovery, is expected to continue to grow, albeit at a reduced pace over 2012 and 2013. The United States dollar has depreciated by about 25 per cent over the past decade,1 despite the period of appreciation that occurred during the recession. As a consequence, the trade balance has improved in real terms, and helped support growth particularly during the recession. Going forward, net exports are expected to continue to support growth, but will make a smaller contribution. This is because part of the boost to growth during the recession was technical in nature, stemming from the dramatic drop in imports. In the outlook, real export growth is projected to continue to outpace that of real imports, but given the large external deficit at the start of the forecast, the level of the current-account deficit will hardly change. However, as a ratio to nominal GDP, it will average about 3.5 per cent over forecast period, much lower than the level observed before the crisis. During the recession, the United States Federal Reserve (Fed) introduced two rounds of quantitative easing (QE) actions, under which it purchased large amounts of long-term securities from the market. By doing so, it brought down the interest rate on long-term securities. According to the Fed’s communications, market concerns regarding a possible double-dip recession and deflation were the motivating factors behind these actions. In September 2011, the Fed announced a new policy stating that by the end of June 1
Measured on a broad index against other currencies.
Investment may be solid despite heightened uncertainty
The external balance has improved somewhat
Monetary policy is still providing limited support
98
World Economic Situation and Prospects 2012
Downside risks abound
2012, it would swap $400 billion worth of Treasury securities maturing within 3 years or less into Treasury securities maturing within 6 to 30 years, the so-called Operation Twist. The Fed is hoping to further reduce long-term interest rates. However, long-term interest rates were already very low, even before the Fed’s last action, and it remains to be seen how much further downward adjustment this operation can create. In the outlook, it is assumed that there will be no more large-scale quantitative easing actions. The risks to the baseline outlook for the United States economy are unfavourable. The key external risk is that the euro area sovereign debt crisis will evolve into a disorderly default and lead to crisis in European financial markets and economic recession. The direct impact on the financial institutions in the United States and linkage effects through lower profit-earning from Europe and reduced exports would retard growth. Domestically, the top concern is the fiscal adjustment. The Budget Control Act of 2011 set up a framework to reach an agreement to cut at least $1.2 trillion from the federal budget deficit over ten years, with a default clause stating that if no agreement is reached, there will be automatic spending cuts of $1.2 trillion. In addition, the debt ceiling will need to be raised and the Government will again go through the same fraught political procedure discussed previously. This may damage the confidence of consumers, businesses and financial markets, dragging down growth prospects. The housing market poses another domestic risk. A significant proportion of homeowners will still be holding negative home equity at the end of 2011. If house prices decline significantly, it could trigger another vicious circle of foreclosures and falling prices that would severely damage the balance sheets of banks and households.
Canada: facing increasing headwinds After seven quarters of expansion, the Canadian economy declined slightly in the second quarter of 2011. Exports fell at the annualized rate of 8.3 per cent (quarter over quarter) causing GDP to decline by 0.4 per cent. Although growth has since resumed, many indicators suggest that the momentum is weak. For 2011 as a whole, GDP is expected to grow by 2.1 per cent, followed by 1.7 per cent and 2.3 per cent for 2012 and 2013, respectively. The sharp drop in exports during the second quarter of 2011 was largely due to the disruption of the supply chain for auto production caused by the earthquake in Japan. Nevertheless, even after this impact faded, the external sector continued to hamper growth. The Canadian currency has appreciated significantly against the dollar over the past few years, weakening competitiveness in the United States market, which is the destination for more than 75 per cent of its exports. The tepid growth of the United States economy also limits the expansion of manufacturing exports. Consequently the currentaccount balance is expected to remain in deficit over the forecast period. The current governing party gained a majority in parliament for the first time following a federal election in May, an outcome that will enhance its capacity to balance the federal budget by 2016. Based on this, it is assumed that Government expenditure (as a share of GDP) will fall over the forecast period. Favourable financial conditions have boosted business investment, especially in machinery and equipment. This upward trend is expected to continue, though at a slower speed. The housing market expanded quickly in 2010, but has since shifted into lower gear. Household debt as a ratio of disposable income has increased from 110 per cent to the current 150 per cent over a decade, and may pose a risk going forward. For Canada, the most significant risk is a renewed recession in other developed economies, especially in the United States.
99
Regional developments and outlook
Developed Asia and the Pacific Japan: earthquake recovery, but one threatened by slowing global demand In the first half of 2011 and in the aftermath of the devastating earthquake in March, the economy of Japan contracted by about 3 per cent. While the recovery was strong in the third quarter, it tapered off towards the year’s end. Though GDP is estimated to have fallen by 0.5 per cent for 2011 as a whole, growth of about 2 per cent, driven by post-quake reconstruction, is forecast for 2012 and 2013. However, much weaker demand in other major economies and challenges in the Government budget to finance the reconstruction could drag the economy of Japan down to a much weaker growth rate than baseline projections. The employment situation was aggravated by the earthquake and related disasters, but has since been gradually improving. The unemployment rate declined to about 4 per cent in late 2011, the lowest since it peaked at 5.6 per cent in 2009. The ratio of job offers to applicants has been increasing, but nominal wages per employee nonetheless declined somewhat during most of 2011. In 2011, higher international prices of oil and other primary commodities and the disruptive shock of the earthquake pushed up the general price level in Japan, lifting the economy out of a protracted deflation. The consumer price index (CPI) is estimated to have risen by about 0.8 per cent in 2011, from the deflation of about 1 per cent in the previous two years. In the outlook, however, prices may fall again in 2012-2013. In May 2011, exports began to rebound from the major disruptions of March, but export growth decelerated later in the year as global demand softened (see figure IV.2).
The employment situation has improved
Deflationary conditions have temporarily abated
Japan rebounds from natural disasters, but exports face headwinds
Figure IV.2 Index for Japanese export volume, January 2009-September 2011 130
Index: 2005=100
120
110
100
90
80
Jul-2011
Apr-2011
Jan-2011
Oct-2010
Jul-2010
Apr-2010
Jan-2010
Oct-2009
Jul-2009
Apr-2009
Jan-2009
70
Source: Bank of Japan.
100
Monetary policy continues to rely on unconventional measures
Fiscal policy is hovering between post-disaster reconstruction needs and debt sustainability
World Economic Situation and Prospects 2012
The steady appreciation of the yen likely also curbed exports, but past experience shows that global demand has a more important impact on Japan’s exports than exchange-rate shifts. Shortly after the natural disaster, imports rose notably, pushed mainly by higher demand for food, but import growth has since slowed. Japan’s trade surplus dropped significantly during 2011, while the current-account surplus decreased by about 1 percentage point of GDP. In the outlook, the surplus is expected to stay somewhat below 3 per cent of GDP. With policy interest rates near zero for many years, monetary policy in Japan has mainly featured the expansion of the balance sheet of the country’s central bank. Throughout 2011, the Bank of Japan (BoJ) continued to increase the size of the Asset Purchase Program (APP), including the purchase of risky assets, such as commercial paper and corporate bonds, in addition to Government bonds. In the outlook, the BoJ is expected to continue relying on the APP, combined with intervention in the foreign-exchange market to prevent the further appreciation of the yen. In order to limit the impact of reconstruction spending on the budget deficit, the Government is employing various options, including tax increases and the sale of some Government assets. The gross Government debt of Japan is currently more than 200 per cent of GDP, the highest among developed countries. The Government has proposed an increase in the consumption tax, to 10 per cent by 2015, but it is highly uncertain whether this will be sufficient to bring the debt-to-GDP ratio to more sustainable levels.
Australia: recovering from record flooding In Australia, the recovery from the mammoth flood in the eastern states has been slower than expected. GDP is estimated to grow by only 0.5 per cent during 2011. While a gradual recovery in coal production from the flood damage and a continued increase in mining sector investment supported growth, investment in other sectors has been weakening, along with a weak labour market and consumer sentiment. GDP is expected to grow about 2.6-2.8 per cent in the outlook for 2012-2013. Any increase in the policy interest rate is expected to be limited. Fiscal policy has been tightening as the Government aims to return the budget to surplus in 2013, although the extra spending on reconstruction related to the flood damage may challenge the budget target.
New Zealand: earthquake reconstruction boosts growth In New Zealand, the damage from the earthquake that occurred in February 2011 in the Canterbury region was tremendous, but an economy-wide recession was avoided. GDP increased by about 1.4 per cent in 2011. Business investment has been recovering since the earthquake, but private consumption remains lacklustre. GDP is expected to recover to about 2.5-3.0 per cent in the baseline forecast for 2012-2013. Two of the three major international rating agencies downgraded New Zealand’s sovereign debt rating in September 2011, triggered by concerns over the elevated level of the country’s external debt, which stands at about 80 per cent of GDP. The Government has planned a number of measures, including significant spending cuts in the medium term and some partial privatization of State-owned assets, aimed at returning to budget surplus in 2014-2015.
101
Regional developments and outlook
Europe Western Europe: sharply slowing growth as the debt crisis grips the region Western Europe grew strongly in the first quarter of 2011, but activity decelerated significantly thereafter and is expected to stall by the end of the year. To some extent, the initial sharp deceleration in the second quarter was heavily influenced by unusual factors, including the German nuclear power plant closures, supply chain disruptions from the multiple disasters in Japan, normalization in the construction sector after its sharp rebound in the first quarter from the bad winter weather and the sharp rise in oil prices. But GDP growth was no better in the third quarter (although there was large diversity across countries), and a wide variety of leading indicators have shown a clear and substantial decline in sentiment across countries and sectors. Growth is hindered by a number of factors. The global manufacturing cycle has peaked and is now in a downturn as global demand slows, particularly in East Asia and the United States. Fiscal austerity programmes are in force across the region. The sovereign debt crisis that erupted in Greece in May—which subsequently spread, first to Ireland and Portugal and then to Spain and Italy—has led to plunging confidence of both producers and consumers, as well as to a weakening of the already delicate banking system. Growth is expected to be 1.5 per cent in the European Union-15 (EU-15) in 2011, similar to the spring forecast, but only due to a much stronger-than-anticipated first quarter balanced by a much weaker-than-expected rest of the year. Given the extremely low momentum going into 2012, GDP growth is expected to be only 0.5 per cent, a substantial downward revision from the spring forecast, and with only a modest upturn expected for 2013, growth is expected to be only 1.6 per cent (see annex table A.1). High frequency hard data and indicators of sentiment through the first quarter of 2011 depict a recovery led by a sharp rebound in the manufacturing sector, with services following a more muted path and construction playing a restraining role. In April 2011, a wide variety of measures indicated a clear change of direction with broad-based declines across both country and sectoral surveys. These declines continued throughout the year and have reached levels consistent with a contraction in activity. The hard data, however, at least through August, showed no evidence of a downturn: industrial production continued to increase, albeit with signs of deceleration; construction remained only marginally above its recession-era trough, clearly weak, but showed no sign of a downturn; and retail trade also showed some deceleration, but again no major downturn. The September release for these data, however, does show a significant decline. Comparing industrial production with industrial confidence and quarterly GDP growth rates, the pattern is worryingly similar to the period prior to the Great Recession of 2008-2009 (see figure IV.3), and indicates that the brunt of the slowdown will be concentrated in the final quarter of 2011 and the beginning of 2012.2 In the first quarter of 2011, private consumption was an important driver of growth. It was supported by greatly growing confidence and a moderate improvement in real disposable income through a combination of good labour market performance in a number of countries, falling unemployment, rising nominal wages and low inflation. Then 2
The continuing strength of the industrial sector helps explain the strength of the rebound in Germany and France in the third quarter after the unusual one-off events depressed second quarter growth.
After a strong start, growth decelerated sharply to near stagnation in 2011
Multiple headwinds batter the region
High frequency data are sending warning signals
Domestic demand showed promise, but then lost vigour
102
World Economic Situation and Prospects 2012
Figure IV.3 GDP, industrial production and industrial confidence in the euro area, first quarter 2005-third quarter 2011 Index: 2005=100
1.2
110
0.8 105
0.4
100
0.0
95
-0.4 -0.8
90
-1.2 85
GDP growth (quarter over quarter, right-hand scale)
-1.6
80
Industrial production (excluding construction, left-hand scale)
-2.0
75
European Commission economic sentiment indicator (left-hand scale)
-2.4
Growth relies too heavily on slowing exports
2011-Q1 2011-Q2 2011-Q3 2011-Q4
2008-Q1 2008-Q2 2008-Q3 2008-Q4 2009-Q1 2009-Q2 2009-Q3 2009-Q4 2010-Q1 2010-Q2 2010-Q3 2010-Q4
2006-Q1 2006-Q2 2006-Q3 2006-Q4 2007-Q1 2007-Q2 2007-Q3 2007-Q4
2005-Q4
2005-Q2 2005-Q3
2005-Q1
-2.8 Sources: Eurostat, European Commission and OECD Main Economic Indicators.
higher oil prices started to hit disposable income and the sovereign debt crisis led to a dramatic drop in confidence, and in some cases far tighter fiscal policy. In the outlook, consumption is expected to remain very subdued, constrained by continuing fiscal consolidation measures, less certain labour market prospects, uncertainty from the debt crisis and tightening bank-lending conditions. Slowing inflation on the other hand, provides some support. In the crisis-affected countries, consumption is expected to continue to contract. Fixed investment in plants and machinery was the other major component of domestic demand that drove GDP growth in the first quarter of 2011, particularly in those economies most geared to export markets and capital goods. The strong rebound in manufacturing industries, fuelled by external demand coupled with increasing capacity utilization (which in the euro area reached 81.6 per cent in the second quarter of 2011), rising business profits and stabilizing financing conditions, supported investment growth. Confidence was at record highs in Germany. Going forward however, investment is expected to weaken significantly, impacted by now decelerating external demand coupled with deteriorating financing conditions and declining capacity utilization and, more generally, by increasing uncertainty. Housing investment has been a drag on activity since the beginning of the recovery and is expected to remain lacklustre. The dynamic growth of export volumes has been a key factor driving the recovery, both through its impact on net exports as a source of growth and through its influence on investment spending. However, it is decelerating in line with the slowdown in global growth. In the first quarter of 2011, there was some evidence of a maturing of the recovery, with domestic demand becoming a more prominent source of growth and net exports becoming neutral, as import volumes accelerated. This was short-lived, however, and going forward, despite the slowing of global demand, the sharp deceleration of activity in the region is again leading to a growth profile dominated by net exports.
103
Regional developments and outlook
At the aggregate level, labour markets have shown very little change since the end of the recession, with unemployment remaining near 10 per cent in the euro area since September 2009. This result comes from balancing countries, including those that have seen large improvements, such as Austria, Belgium and Germany, with those that have seen large deteriorations, including all the crisis countries. These different outcomes can be attributed to relative growth performances (heightened by the tremendous fiscal consolidations taking place in some countries), different degrees and types of labour market policies and structural differences. Given the subdued outlook, unemployment is expected to remain near current levels for the EU-15, with the crisis countries deteriorating further, or at best, remaining at elevated levels (see annex table A.7). Headline inflation, as measured by the Harmonised Index of Consumer Prices (HICP), rose steadily throughout 2010, reaching 2.9 per cent in the second quarter of 2011 in the euro area, and then after receding for a few months, began to rise again, reaching 3.0 per cent in September. Core inflation, on the other hand, remained quite stable in 2010, but traced a similar pattern to that of headline inflation in 2011, rising to 1.6 per cent in September. The rising prices of oil and other commodities were key factors in explaining this movement, though in the first quarter, growth was insufficient to make much headway in closing the output gap, and real wage growth lagged productivity improvements. Going forward, weakening activity is expected to put downward pressure on prices (see annex table A.4). The euro area fiscal deficit increased substantially during the recession from 2.1 per cent of GDP in 2008, to 6.4 per cent in 2009, and dipped only slightly, to 6.2 per cent, in 2010. All members of the euro area, except Finland, Luxembourg and new member Estonia, registered deficits greater than 3 per cent of GDP in both 2009 and 2010, which is the limit enshrined in the Stability and Growth Pact (SGP). Under the Excessive Deficit Procedure (EDP) these countries had to submit stability programmes with explicit plans for bringing their deficits back to below 3 per cent. Most members of the euro area are tightening their budgets, with a minimum requirement of an improvement in budget deficits of 0.5 per cent of GDP per annum. The annual consolidations, however, are much higher in the crisis affected countries and may need to be strengthened if there are shortfalls in revenues. After its deficit rose sharply, the United Kingdom of Great Britain and Northern Ireland also came under pressure, and is pursuing a dramatic consolidation programme. After leaving its main policy rate at 1.0 per cent for more than a year and a half following the recession and relying solely on unconventional policy measures, the European Central Bank (ECB) surprised the markets by raising interest rates in early and mid-2011 by a total of 50 basis points. Part of the surprise lay in the fact that it was widely believed at the time, that the unconventional policies would be phased out prior to any resumption of conventional interest-rate policy moves, but the unconventional policy measures were still in active use. They were, however, targeted almost exclusively to support the banks and the sovereign debt of the crisis-affected countries, rather than to support the banking system as a whole, so there could be a separation of policies. But as the euro area debt crisis has worsened, embroiling more countries and banks, this distinction is fading. These unconventional policies consist of various ways to supply liquidity to the affected banks: refinancing operations at various term lengths, the purchase of covered bonds and, in concert with other major central banks, the provision of United States dollar liquidity. They also (and more controversially) include the purchase of Government bonds in secondary markets.
Labour markets show diverging trends
Rising inflation will be short-lived
Fiscal austerity grips the region
The ECB reverses course, reducing its main policy interest rate, and steps up the use of unconventional measures
104
Downside risks are substantial and centre on sovereign debt crises
World Economic Situation and Prospects 2012
The worsening crisis led the ECB to change course in November, cutting its main policy rate by 25 basis points. With another similar cut assumed in December, the main policy rate will return to 1.0 per cent, after which conventional policy will again be on hold. It is also assumed that unconventional policies will remain in use throughout the forecast period. Key risks to the forecast are weighted downward. They are led by the still deepening and expanding sovereign debt crisis, with threats of further contagion to the larger economies of the region and to the fragile banking system, both of which would place far larger demands on financing needs, and in the case of the banking system, cause a renewed financial crisis. A related risk is that the current fiscal austerity programmes could be strengthened, as a result of the pressures from the crisis, or that their impact on growth would be more than anticipated. Finally, the prolonged period of low growth, and hence high unemployment, in many regional economies risks increasing the rate of long-term unemployment in the region, making it far more difficult to reduce unemployment in the future. This would also reduce the growth rate of potential output.
The new EU members: dangers from a weakening in the rest of the EU
Exports will provide little impetus to growth in 2012
During 2011, the economies of the new EU member States from Eastern Europe continued to recover from the deep recession that started in late 2008. The recovery, however, is still mired by weak labour markets, feeble consumer and business confidence and strong social discontent towards the Governments’ fiscal austerity measures. In a number of economies, the initial export-led expansion has evolved into a more broad-based recovery with strengthening household consumption and investment, while in others, exports still remain the sole driving force. Mirroring their main export markets in the euro area, many of the new EU economies lost steam in the second half of 2011. Stock markets tumbled, reflecting worries about the short-term prospects of those countries. For many reasons, including much improved current accounts, the new EU members are not as vulnerable to the sovereign debt crisis or possible banking crisis in the euro area, as they were to the global financial crisis in 2008. At the same time, however, they are now more vulnerable because they have exhausted most of their fiscal space for conducting counter-cyclical policies to mitigate the impact of another global downturn. The capital position of the banking system improved, but there is no guarantee that foreign banks operating in these economies will keep their promise not to withdraw vast amounts of resources during a new crisis, much as they did in 2008-2009. Against the backdrop of an anticipated slowdown in the euro area in 2012, the nature and speed of the recovery in domestic demand will determine the short-term macroeconomic prospects for the region. However, the cycle of inventory rebuilding that had been supporting growth is virtually complete, while private consumption remains constrained by household indebtedness and many investment projects have been put on hold. Consequently, in 2012, domestic demand is unlikely to bolster growth. Growth of the aggregate GDP of the new EU members, which accelerated from 2.3 per cent in 2010 to 2.9 per cent in 2011, is therefore expected to slow to 2.6 per cent in 2012, strengthening later to 3.1 per cent in 2013. However, forecast growth remains significantly below precrisis levels (see annex table A.1). The largest and least export-dependent economy in the new EU, Poland, maintained its strong economic momentum in 2011, with GDP increasing by 4 per cent, largely
105
Regional developments and outlook
supported by domestic demand. The construction sector expanded rapidly, boosted by preparations for the UEFA Euro 2012 football championships and public infrastructure spending supported by EU funds. Provided that robust investment spending is sustained and a more competitive exchange rate offsets weaker import demand from the EU, the economy could expand by over 3 per cent in 2012. However, a weaker currency may also dampen consumption, as households repay their foreign currency loans. For the smaller economies of Central Europe, growth in 2011 was predominantly driven by exports, especially by the automotive and electronic sectors. Foreign direct investment (FDI) flows into those countries have modestly recovered and are expected to rise in coming years. The Baltic States have registered the highest growth rates, but they are bouncing back from deep recessions, and income remains significantly below pre-crisis levels. In the Czech Republic and in the Baltic countries, domestic demand recovered somewhat in 2011, but it remains depressed in Bulgaria, Hungary and Romania. The appreciation of the Swiss franc placed strong pressure on households and businesses in Hungary and Poland, which had borrowed heavily in that currency. If this appreciation is sustained, it may seriously affect consumer spending and investment (see box IV.1). Most of these economies are expected to grow by 2 to 3 per cent in 2012. The spike in oil and food prices led to higher inflation in the region in early 2011, although its impact on the overall CPI varied across the countries. One-off factors such as higher value added tax (VAT) rates fed into consumer prices, but these were offset by weak domestic demand and subdued wage growth. Inflation moderated in the second half of the year as food prices retreated. In some countries, including in the Baltic States, however, core inflation started to rise. Similar one-off factors, such as higher VAT rates in Hungary and the liberalization of energy prices in Romania are expected to influence inflation in 2012. Nonetheless, slower export growth and stagnating nominal wages and credit should keep inflation in the low single digits (see annex table A.4). Estonia adopted the euro in January 2011, and in line with the ECB rules, reduced mandatory reserve requirements for commercial banks. The central banks in Hungary and Poland raised interest rates in 2011 to keep inflation within the target range. Provided that inflationary pressure is contained, however, monetary policy should remain accommodative in 2012. In any case, even though banks in the new EU countries are not facing liquidity constraints and the number of non-performing loans has probably peaked, they remain reluctant to lend. Labour markets of the new EU member States continue to recover even as unemployment rates remain high, at more than 10 per cent in over half of the countries in 2011. Improvements were largest in the countries with the highest unemployment rates, for instance, the Baltic States. Elsewhere, progress has been slower. Conditions are expected to continue improving in 2012, even if at a rather slow pace (see annex table A.7). The rise of structural unemployment and the substantial skill mismatches in the supply and demand for labour will affect the growth of potential output in the long run. Governments are constrained in stimulating employment growth given their limited fiscal space. On the fiscal policy side, most of the Governments of the new EU members have yet to reduce their budget deficits to the EU target of less than 3 per cent of GDP. In parallel, they are aiming to reform public finance, especially by improving the sustainability of pension systems, in the light of impending unfavourable demographic developments. Reaching political consensus on specific policies, however, is proving to be difficult. The proposed budgets for 2012 envisage further austerity measures, such as reductions in the size of the public sector, as well as increases in indirect taxes. The Government of Hungary
Oil and food prices pushed up inflation in early 2011
Credit supply is slow to pick up
Employment is steadily recovering in the Baltic States, but skill mismatches remain problematic
Fiscal policies are shifting to greater austerity
106
World Economic Situation and Prospects 2012
Box IV.1 The impact of the appreciation of the Swiss franc on the economies of Eastern Europe Foreign currency denominated loans account for a sizable percentage of loans in a number of the new European Union (EU) member States and South-Eastern European economies (see figure). This would make these countries vulnerable to rising debt-servicing costs should these foreign currencies appreciate substantially with respect to their national currencies. Indeed, several economies, mostly new EU member States, have been adversely affected by the steep appreciation of the Swiss franc, which investors took in as a safe-haven currency during the financial turmoil of 2011. Homeowners and investors acquired substantial foreign currency loans (especially mortgages), as these carried much lower interest rates than domestic ones, and residents anticipated (incorrectly in retrospect) that their national currencies would appreciate against the euro and Swiss franc. The interest rates on Swiss franc loans were particularly low and hence the most popular. For example, in Hungary, the Swiss franc rate for a home equity loan was 4.8 per cent in 2005, while it was 17.6 per cent for loans in Hungarian forint. As a result, more than half of all mortgages in Hungary are denominated in Swiss francs and total private sector loans in francs amounted to 20 per cent of GDP in 2011. In Poland, 700,000—or over half of total mortgage loans outstanding—were denominated in Swiss francs. Over a quarter of these loans (or one half of those issued in 2006-2008) went under water in 2011 as a result of the appreciation of the franc, substantially increasing the domestic currency value and debt-servicing costs of these loans. In some economies, borrowing in foreign currency by commercial businesses and, in some cases, local governments is also widespread. The losses of financial wealth and higher borrowing costs caused by the foreign currency appreciation have drained purchasing power from these economies at a time when unemployment is high. In Hungary, the Government has felt compelled to provide assistance to homeowners holding foreign currency mortgages. Under the programme, homeowners are allowed to pay back their loans at below market exchange rates (180 forint to the Swiss franc instead of the market rate, which was about 235 forint in the fall of 2011), while the banks are forced to accept the losses. The measure could affect bank lending and the investment climate, possibly affecting future growth. The large share of foreign currency loans also limits the scope of economies with flexible exchange rates to allow their currencies to depreciate in order to stimulate exports and output growth as such devaluations may trigger a wave of debt defaults.
Share of foreign currency denominated loans, 2010 80
Percentage of loans denominated in foreign currency
70 60 50 40 30
Sources: Jarko Fidrmuc, Mariya Hake and Helmut Stix, “Households’ foreign currency borrowing in Central and Eastern Europe”, Österreichische Nationalbank Working Paper, No. 171 (Vienna, Austria, September 2011).
20 10 0 Hungary
Poland
Bulgaria
Romania
Albania
Croatia
Serbia
Regional developments and outlook
intends to retain the extra taxes introduced in 2010 on financial institutions and on large corporations until 2013. Most of the new EU member States would be affected by further deepening of the sovereign debt crisis in the euro area, since in such a scenario, weaker exports may lead to even lower growth rates in 2012. Moreover, there is a risk, as indicated earlier, that many large EU-15 banks present in those countries, in the instance that their balance sheets are damaged, may decide to deleverage and withdraw capital from the region, thereby stifling credit growth. Possible worsening of the terms of access to capital markets would complicate the refinancing of external debt obligations of the new EU members.
Economies in transition In 2011, aggregate GDP of the transition economies expanded by 4.1 per cent. Growth was largely driven by stronger export performance and domestic demand, although continued deleveraging of the financial sector kept investment subdued. While labour market indicators improved during 2011, inflation accelerated despite a slowdown in price increases in some countries in the second half of 2011. A weaker external environment contributed to a softening of growth in the second half of 2011, such that overall, the increase in aggregate GDP remained unchanged from 2010. Performance diverged across the economies in transition, however. In the economies of South-Eastern Europe, the economic recovery that commenced in 2010 gained a stronger foothold and aggregate GDP growth accelerated from 0.6 per cent in 2010 to 1.7 per cent in 2011, in particular as Croatia exited from its recession. In contrast, growth in the Commonwealth of Independent States (CIS) decelerated from 4.5 per cent in 2010 to 4.3 per cent, reflecting the impact of weaker commodity prices on the larger economies of the region (see annex table A.2). The economies in transition remain vulnerable to external economic developments. This is due to structural factors, including their pattern of export specialization and a high dependence on external funding. Thus, while the continued fragility of the financial sector and the dependence on international commodity prices remains a cause for concern in the CIS, spillover effects of the European debt crisis through financial channels pose more of a threat to South-Eastern Europe. Continued financial turbulence and more fragile growth prospects for developed economies will therefore lead to a more moderate expansion of aggregate GDP in the outlook. Growth rates are expected to remain well below those observed in the pre-crisis era.
South-Eastern Europe: an already slow recovery threatened by euro area troubles The tentative economic recovery in the economies of South-Eastern Europe that began in 2010 gained further ground in 2011, driven initially by export growth and by rising domestic demand thereafter. Nevertheless, the region continues to experience below-trend growth as household consumption and investment remain subdued by weak consumer sentiment, limited availability of credit, slow real wage growth and tepid FDI inflows. The continued financial turbulence and weak growth in the euro area threaten to spill over into the region via trade and financial channels, and could easily unsettle the recovery. GDP growth was positive in 2011 in all economies of the region, averaging 1.7 per cent, up from less than 1 per cent in 2010 (see annex table A.2). Since their major export markets are in the EU—which is facing the prospect of a protracted slowdown— none of the economies in the region is expected to see strong output growth in the outlook
107
The new EU members are vulnerable to the euro zone crisis
108
World Economic Situation and Prospects 2012
Food and energy prices raised inflation in early 2011
Labour markets remain slack but show some positive trends
Credit supply remains subdued, while the stronger Swiss franc affects borrowers
FDI remains below pre-crisis levels
for 2012. In addition, Governments are adopting fiscal austerity programmes; however, their impact is cushioned to some extent by attempts to preserve and, in some cases, boost public investment. Domestic consumption and investment are expected to pick up only marginally, although investment in Croatia is expected to recover from its long period of contraction. Aggregate GDP of South-Eastern Europe is expected to expand by only 2.3 per cent in 2012, well below trend growth, but slightly higher than in 2011 due to the slight acceleration of growth in Croatia and Serbia. Growth should strengthen to 3.2 per cent in 2013, in line with the improving economic environment. One-off factors have continued to influence consumer inflation, which picked up throughout the region during 2011. This reflected the impact of increased world market prices for energy and food. In 2010, strongly expansionary monetary policy fanned inflation into the double digits in Serbia. Inflation moderated in the course of 2011, along with monetary tightening and the stabilization of world energy and food prices. Nonetheless, annual inflation averaged more than 11 per cent. In 2012, absent any serious supply-side shocks, inflation is expected to hover around 3 per cent for the region as a whole, with slow wage growth and cautious consumer demand curbing its growth. Inflation in Serbia may still be above the regional average (see annex table A.5). In the first half of 2011, unemployment increased further from already high levels in most of the countries in the region, especially in Croatia and Serbia, as job growth lagged the output recovery. In the second half of the year, unemployment started to decline, driven by the cyclical upturn and continued labour market reforms. These reforms are aimed at boosting incentives to work and increasing formal employment, while at the same time maintaining social protection. If these trends persist, unemployment is likely to decline throughout the region in 2012 (see annex table A.8). Nevertheless, much of the unemployment is structural and will require fundamental supply-side reforms in labour market, education and competition policies. Formal or de facto currency pegs constrain the conduct of monetary policy in most South-Eastern European countries. Growth of credit to the private sector remains weak in the region, reflecting concerns about the health of the banking sector that is predominantly controlled by foreign banks. Concerns centre on the volume of nonperforming loans, the need for further deleveraging and the continued weak demand for credit. The appreciation of the Swiss franc has dampened household spending in Croatia, where over 40 per cent of mortgages and almost 50 per cent of car loans are pegged to the Swiss currency (figure IV.4; see also box IV.1). As a result, the Government has offered a fixed exchange-rate loan repayment scheme that only defers financial obligations. Households are thus likely to save much of the income freed from reduced payments. Increased payments for foreign-currency denominated loans have also affected households in Serbia, as its currency has depreciated against both the euro and the franc. The risk has been less acute in other South-Eastern European countries that have higher shares of euro-denominated loans and their currencies pegged to the euro. FDI inflows into the region declined further in 2010 after significant falls in 2009, with the exception of Albania where they reached record levels. A prompt return to the very high levels of FDI inflows these countries enjoyed in the years before the global crisis is unlikely, given the lasting impact of the Great Recession, the ongoing euro area debt crisis and continued ethnic tensions in parts of the region, which will also likely hold back prospective investors. Even so, foreign investment in Croatia might increase in 2012, provided that the country’s accession to the EU remains on track for 2013.
109
Regional developments and outlook
Figure IV.4 Currency composition of outstanding loans in Croatia, 2002-2011 Percentage
100.0
Domestic Other
90.0
Swiss franc
80.0
Euro
70.0 60.0 50.0 40.0 30.0 20.0 10.0
Mar-2011
Sep-2010
Mar-2010
Sep-2009
Mar-2009
Sep-2008
Mar-2008
Sep-2007
Mar-2007
Sep-2006
Mar-2006
Sep-2005
Mar-2005
Sep-2004
Mar-2004
Sep-2003
Mar-2003
Sep-2002
Mar-2002
0.0
After enacting counter-cyclical policies during the crisis, Governments across the region are consolidating their finances while preserving capital expenditure levels. Resources directed through development banks have promoted business lending in support of economic diversification, but progress in the use of those funds has been slow. To a large extent, critical social spending has also been protected throughout much of the region (Bosnia and Herzegovina, Serbia and the former Yugoslav Republic of Macedonia) with the assistance from international financial institutions. The region remains exposed to spillover risks from the Greek debt crisis, mostly through finance, given the heavy presence of Greek banks and reduced FDI flows. In addition, Albania, Montenegro and the former Yugoslav Republic of Macedonia may experience a contraction in remittances and weaker exports. An intensification of the debt crisis in Italy would have an even more disruptive impact on the region through the same channels.
Source: Croatian National Bank.
While consolidating budgets, Governments are also trying to protect infrastructure spending
The region remains vulnerable to developments in the euro area
The Commonwealth of Independent States: recovery continues, but risks increase In 2011, economic activity expanded in the CIS, although growth was subdued in comparison to the faster pace observed in the period prior to the 2009 crisis. 3 A somewhat weaker performance is expected in the outlook due to the deterioration of the global economic situation (figure IV.5). In 2011, stronger commodity prices gave impetus to the expansion of output in several economies, including the largest economy, the Russian Federation, which remained the major force of economic dynamism in the CIS. The deterioration of 3
Georgia’s performance is discussed in the context of this group of countries for reasons of geographic proximity and similarities in economic structure.
Growth remains steady but unimpressive
110
World Economic Situation and Prospects 2012
Figure IV.5 The general slowdown in GDP growth rates in the Commonwealth of Independent States and Georgiaa Percentage points 2010 2011 2012
Uzbekistan Belarus Kazakhstan
Slowdown in 2011 and 2012
Republic of Moldova Tajikistan Georgiaa Sources: ECE and UN/DESA, based on data from Project LINK. a Georgia officially left the Commonwealth of Independent States on 18 August 2009. However, its performance is discussed in the context of this group of countries for reasons of geographic proximity and similarities in economic structure.
Domestic demand is fuelling expansion
Unemployment is falling
Russian Federation Turkmenistan Ukraine
Slowdown in 2012
Kyrgyzstan Armenia
Acceleration in 2012
Azerbaijan
-2
0
2
4
6
8
10
the external environment towards the end of the year resulted in softer commodity prices and reduced prospects for external finance. Aggregate GDP in the region rose by about 4.3 per cent in 2011, compared to 4.5 per cent in 2010 (see annex table A.2). While aggregate growth is expected to decelerate to 4.0 per cent in 2012 before accelerating somewhat in 2013, the high growth rates achieved in the pre-crisis era will remain elusive. Improved terms of trade and better employment prospects supported the growth of domestic demand in the region. However, the fragility of the banking sector and continued deleveraging constrained investment activity, despite some improvement in the Russian Federation and Ukraine. In Belarus, domestic demand contracted, but exports rose strongly as a consequence of a sharp devaluation of the rouble. This was triggered by significant pressures on foreign-exchange reserves as large State spending and unsustainable growth in wages and credit fuelled import demand. In Azerbaijan, repair works at some drilling platforms disrupted oil production and contributed to a sharp deceleration in growth. By contrast, gas exports increased in Turkmenistan due to new infrastructure. The recovery from political unrest in 2010 and donor-funded infrastructure significantly boosted output in Kyrgyzstan. The region experienced a significant rebound in agriculture after a bad harvest in 2010. This was especially important for Armenia, as well as Ukraine, which also benefited from increased construction in preparation for the UEFA Euro 2012 football championships. The economic recovery has been accompanied by a modest improvement in labour market indicators, with unemployment rates falling in the largest countries in the region (see annex table A.8). In Kazakhstan, the impact of the substantial employment growth on unemployment rates was partially offset by a rapid increase in the labour force. By contrast, Georgia and the Republic of Moldova showed limited ability to generate
111
Regional developments and outlook
employment, despite continued output growth. Outward migration alleviated pressures on labour markets in these countries. In the outlook, labour market indicators are expected to improve modestly in the region. Inflation for the region accelerated to 9.6 per cent in 2011, up from 7.1 per cent in 2010 (see annex table A.5). However, inflation patterns have been rather uneven in the region. In most non-energy exporters, the acceleration in 2011 was mainly due to increasing food and fuel prices, and in some cases, also to growing demand pressures. The larger weight of food in consumer price indices in several economies explains some of the observed inflation dynamics. By contrast, headline inflation peaked in the Russian Federation and declined sharply in the second half of the year as the impact of the 2010 drought diminished. In Belarus, the devaluation of the rouble resulted in a sharp acceleration of inflation. In Kazakhstan, the one-off effects of the customs union with Belarus and the Russian Federation resulted in price increases, as some imports became more expensive. In the outlook, more subdued economic growth due to the global economic slowdown will lead to more moderate increases in prices in the region. Inflation for the region is expected to decelerate to 7.8 per cent in 2012 and is likely to decline further in 2013. As the economic recovery continued and food and fuel prices increased, many countries raised interest rates and tightened liquidity throughout 2011. Monetary measures were complemented in some cases with price controls and support to agriculture to ease the situation in food markets. In Belarus, the authorities tried to contain the inflationary pressures unleashed by the devaluation of the rouble through price controls and sharp increases in interest rates. By November 2011, the refinancing rate had been increased during the year by over 2900 basis points to 40 per cent. In the Russian Federation, a moderation of price pressures in the last part of 2011 and the deterioration of the economic outlook led to a pause in interest-rate increases. However, foreign-exchange interventions to support the rouble amid worsening risk perceptions resulted in tighter liquidity. In 2012, growing downside risks to the global economy and lower inflationary pressures may prompt a loosening of the monetary stance in the region. This has already taken place in Armenia and Georgia, where key interest rates were reduced in the second half of 2011; in Georgia, reserve requirements were loosened to stimulate the long-term financing of commercial banks. Economic growth strengthened fiscal positions throughout the region in 2011, especially in the energy-producing economies. However, increased spending in response to external shocks limited such improvements in fiscal balances in some cases. In Azerbaijan, the authorities sought to offset the depressing effect of oil sector problems with significant fiscal outlays. In the Russian Federation, despite high oil prices, payroll tax reform and increased tariff revenue, the budget ended roughly in balance, which indicated its vulnerability to changes in the external environment. In Kazakhstan, a doubling of the duty on oil in 2011 to $40 per tonne helped reduce the deficit. Meanwhile, several countries in the region continued to receive external resources to support their economies. Among these, fiscal consolidation was substantial in Ukraine, while in Kyrgyzstan increased social and infrastructure spending widened the deficit. With a weakening of oil prices, deficits are likely to widen in the outlook unless revenue is strengthened. This is particularly applicable in the Russian Federation, where social and public spending is likely to increase in the run-up to the presidential elections. Higher commodity prices and increased export volumes have driven an increase of exports in the region (see annex table A.16). The aggregate current-account surplus of the region widened, mainly due to the improved performance of Kazakhstan and the Russian Federation. The latter’s surplus financed significant capital outflows of
Inflation is declining from early peaks
Monetary policy tightening may be put on hold
Expansion is supporting fiscal balances
The current-account surplus for the region is widening
112
World Economic Situation and Prospects 2012
Downside risks have increased
$49.3 billion for the first nine months of 2011. Regardless of the depreciation of the exchange rate, the current-account deficit remained large in Belarus, which is increasingly relying on official sources to finance the deficit; support from the Eurasian Economic Community in response to the crisis became critical in avoiding a sharper adjustment. High food and fuel prices contributed to the large deficits observed in the non-energyexporting countries, which continued to increase, despite growing remittances, with the exception of Armenia. In Ukraine, strong import demand, in part due to investment and construction related to the UEFA Euro 2012 football championships, offset higher exports and led to a widening of the current-account deficit. Growth in the region remains well below that observed in the pre-crisis period. External factors, in particular commodity prices, are the dominant influence on economic performance. Foreign financing remains critical for the region, in particular for Ukraine and other non-energy-exporting countries that continue to have large current-account deficits. The increased likelihood of slower global economic activity and heightened risk aversion are likely to depress commodity prices and impair access to global capital markets. Although the adjustments induced by the recent crisis have reduced reliance on external funding in Kazakhstan and the Russian Federation, thus lowering their vulnerability, the financial sector remains fragile in several other economies. This is dampening domestic demand. Further global turmoil may take its toll and expose the region to multiple shocks given its continued high reliance on exports of natural resources and external financing, and its vulnerability to external events, especially those in Europe.
Developing economies Despite a significant deceleration by developed economies, developing countries exhibited strong growth performance in 2011, and are expected to continue on a significantly higher growth path than the former group over the forecast period. Yet, the average growth rate of 6.0 per cent in 2011 and the expected growth rates of 5.6 per cent in 2012 and 5.9 per cent in 2013 remain below the average 7.5 per cent of the pre-crisis period. In the aggregate, the better growth performance of developing countries reflects both the fact that the economic crisis of 2008-2009 did not originate within this region and the fact that policy stimuli on various fronts were enacted promptly and were kept in place until recovery of either investment or consumption was well under way. In addition, for many of the countries in this group, most notably those in East Asia, domestic demand drivers reinforced trade linkages, especially South-South relations. In a number of other countries, policy stimuli appeared to be stronger during 2011 than before, as social unrest triggered by high unemployment and rising prices of food, among other factors, made Governments more aware of the pressing need to address unresolved employment and social challenges. Of course, the confluence of the positive factors does not apply equally to all countries in the developing world. Many countries in Africa or in South Asia were not able to enjoy the policy space or were threatened by rising inflation owing to reasons beyond Government control—factors that eroded the ability to sustain domestic demand when other growth drivers faltered. In another example, some countries have not benefited from the favourable terms of trade experienced by exporters of energy and minerals. In particular, food-importing countries have run into food-inflation problems, while countries in the Horn of Africa have in addition to other challenges, experienced sustained droughts and famine. Similarly, social unrest in some countries of North Africa and Western Asia
113
Regional developments and outlook
continues to challenge policymakers, as well as neighbouring regions and trade partners. Critical challenges mount when social unrest leads to either direct military intervention by other countries or economic sanctions. The deteriorating economic situation in developed economies is also taking a toll. Developing countries with close economic ties to the United States and Europe have seen less-than-expected growth of exports and/or remittances. The reverberations of financial and equity markets in the developed world have caused greater volatility of capital flows, exchange rates and equity markets, particularly in Latin America and the open economies of East Asia. This outcome reduces the freedom of policy makers to operate. The outlook, even if more positive in the baseline than that of other regions, remains uncertain and subject to downside risks. This is particularly the case if combinations of sluggish global trade activity, declining international prices, unremitting unemployment, high food prices, inflationary pressures, fiscal constraints and/or volatility of exchange and equity markets unleash a chain of downward pressure.
Africa: growth remains on a high, but uneven and uncertain path Africa is forecast to see an increase in its overall growth from 2.7 per cent in 2011 to 5.0 per cent in 2012, marking a pronounced recovery from the disruptions caused by political unrest, as well as a return to the solid growth trend that had emerged after the economic slowdown at the peak of the global economic crisis. Important driving forces for this trend, which is forecast to lead to growth of 5.1 per cent in 2013, will be relatively strong commodity prices, solid external capital inflows and a continued expansion of demand and investment from Asia (see annex table A.3). However, countries across the continent will continue to have widely divergent growth outcomes owing to a number of circumstances, such as military conflicts, a lack of infrastructure, corruption and severe drought conditions. In some countries, these factors will severely depress growth and, much more importantly, will likely have a grave humanitarian toll. Dramatic political problems and change continue to grip economic growth in North Africa. The economy of Libya is estimated to have contracted by 22 per cent in 2011 in the wake of recent regime change, but reconstruction is expected to drive a rebound in 2012. Egypt, Morocco and Tunisia will all see a more pronounced increase in economic growth in 2012, largely due to the lower base for comparison in 2011 owing to the fallout from political unrest. However, economic performances will remain constrained by the uncertain political conditions in the subregion, negatively affecting the tourism sector in particular. In sub-Saharan Africa, South Africa is forecast to see stronger economic growth in 2012, underpinned by favourable external demand, continued fiscal stimulus and rising consumption driven by higher wages. Elevated oil prices will continue to create significant upside potential for oil-producing economies such as Angola, Ghana and Nigeria. However, infrastructure shortfalls, especially in the energy sector, as well as political instability in the Niger Delta will prevent Nigeria from exploiting its full growth potential. In Angola, the start of operations at a new liquefied natural gas project will boost growth in 2012. In East Africa, Kenya will see continued strength in its headline GDP growth figure, driven by infrastructure investment, the expansion of the telecommunication sector and increased banking participation rates. Similarly, Uganda is expected to see solid
Regional growth increases, albeit unevenly
North Africa should see a post-conflict growth bounce, but important uncertainties remain
South Africa and other energy producers continue to grow
Parts of East Africa are facing severe drought, exacerbating hunger
114
World Economic Situation and Prospects 2012
growth on the back of large energy investments, for example, in a new refinery project, although political unrest poses an increasing downside risk. Strong growth in Ethiopia will reflect continued infrastructure improvements, especially in the energy sector, which overshadow the negative impact of drought conditions on agricultural output in some areas. In contrast, large areas in the Horn of Africa have been hit by a severe drought that is taking a high humanitarian toll, forcing many people to flee their home areas and prompting the United Nations to officially declare the situation a famine (box IV.2). Conditions are especially precarious in Somalia, where a combination of drought, poverty and military conflict have trapped many people in life-threatening situations where survival is tied to external assistance.
Box IV.2 Drought in the Horn of Africa takes a heavy human and economic toll The drought and its human and economic impacts
a Food and Agriculture Organization of the United Nations (FAO), “Emergency in the Horn of Africa”, August 2011, available from http:// www.fao.org/crisis/hornafrica/key-documents/en/. b Ibid. c World Bank, “Drought in the Horn of Africa”, Situation Brief, No. 5 (Washington, D.C., 12 September 2011). d See World Food Programme website on Horn of Africa crisis, available from http://www. wfp.org/crisis/horn-of-africa, accessed on 7 October 2011.
e World Bank, op. cit.
East Africa—particularly the Horn of Africa, which includes Eritrea, Ethiopia, Djibouti and Somalia—is experiencing the worst drought in 60 years, caused by a prolonged lack of rain (for two consecutive seasons) and resultant dry conditions since late 2010. The drought has severely degraded vegetation throughout the region and depleted pastoral land, leading to serious crop failure and the loss of thousands of livestock.a South-eastern Ethiopia, northern and eastern Kenya, and southern Somalia, are the worst affected areas. The severity and scale of the drought has raised concerns because the majority of the population (80 per cent) in this subregion depend upon crops and livestock for their livelihoods and food security, but only about 1 per cent of the arable land is irrigated. b While droughts are not uncommon in the area, a spike in the prices of food staples and an unusually dry climate have deepened the severity of the impact of the most recent drought. In the case of Somalia, a protracted military conflict has compounded the crisis. The drought has led to a humanitarian crisis and heavy economic costs. Currently, more than 13 million people are estimated to be in need of emergency food aid and livelihood assistance in Djibouti, Ethiopia, Kenya and Somalia.c Somalia has been suffering the most, the food crisis there having escalated to famine in parts of the central and southern regions of the country.d In 2011, for example, the cereal crop harvest in southern Somalia was estimated at only 19 per cent of total production in 2010. This has forced hundreds of thousands of Somalis to seek refuge in Ethiopia and Kenya, where the host population itself faces a severe food security crisis. The drought has induced a sharp rise in prices of food staples and, hence, overall inflation rates, creating severe hardships for both the rural and urban populations of the region. In Kenya, for example, inflation has spiked to double digits because of significantly increased food prices. The affected countries are also facing significant fiscal pressures due to increased public spending on emergency food supplies, the cost of which is only partially covered by international agencies responding to the drought. Because of the dependence on hydroelectricity, many of these countries have faced power shortages and will consequently face higher import bills as they are forced to buy fuel to facilitate power generation. The economic and social impacts of the drought will last well beyond the immediate future. The already high poverty levels in the region will most likely rise because of the dependence on pastoralism.e Recovering lost livestock, which is the region’s essential economic asset, will take several years. The acute malnutrition suffered by the population is likely to have an irreversible toll on the health of children and adults alike. Moreover, limited food, animal feed and water resources may fuel tensions and escalate existing political conflict and instability in the area. Underlying factors Although the region has long been plagued by cyclical drought because of its arid and semi-arid climate, the onset of the current humanitarian crisis and famine is a direct result of a combination of these natural disasters, failed policies, recurrent conflicts and an adverse global economic
115
Regional developments and outlook
Box IV.2 (cont’d) environment. While the majority of the population depend upon rain-fed crops and livestock for a living, public investment in agriculture has remained low or even absent in rural areas. Prolonged regional conflicts and political instability have resulted in insufficient social safety nets. There has been no public spending on agricultural infrastructure and social protection programmes in Somalia because of the lack of governance. The political situation in Somalia is so dire that it has, at times, prevented United Nations humanitarian assistance from reaching the most drought-affected people in a timely manner. While the people of the region have traditionally coped well with occasional droughts, the population has expanded rapidly in recent years, putting increased pressure on local farm and pastoral lands and an already fragile ecosystem. Adverse weather conditions, caused by global climate change, have exacerbated this trend. To meet the expanding food consumption gap, countries in the region have relied on food imports and food aid, solutions which have often proved to be unsustainable. Short- and long-term responses to the drought Responding effectively to the humanitarian emergency requires implementing short-term and long-term interventions simultaneously.f The short-term interventions should ensure that food security needs are fully met, by providing and expanding social safety nets that protect vulnerable households and their livestock assets from the drought and rising food prices. Since the onset of the drought, various United Nations agencies, along with other international organizations, have been engaged in food distribution and other humanitarian assistance. However, the unstable political situation and infrastructure deficit are hindering the smooth flow of foreign aid to those people most in need in some areas of Somalia. In terms of long-run solutions, a permanent peace settlement of the political conflict in Somalia is the precondition for any success of relevant economic or social policies in the Horn of Africa. At the subregional level, long-term interventions should focus on addressing the technical and policy environment that limits the region’s potential to design a sustainable livelihood system conducive to arid and semi-arid climates. Concerted efforts are also required in order to build regional economic resilience to negative shocks, such as adverse weather conditions, by supporting intraregional markets and expanding intraregional, as well as intra-African, trade to ensure the availability of affordable food staples to countries facing shortages from other parts of the region. Regional coordination institutions and mechanisms are essential in this regard. In this context, in early 2011, the United Nations Economic Commission for Africa (ECA) led the initiative to establish a food security programme for East Africa, which was anchored in four components involving agricultural markets, research and technology, natural resource management and social safety nets.g For individual countries in the region, emphasis should be placed on designing economic and social policies that establish and strengthen their long-term capability to enhance food security and ameliorate the adverse impacts of droughts. Governments should scale up public spending on agricultural infrastructure and technologies, and intensify efforts to continue to diversify their economies away from heavy dependence on agriculture and natural resources. In regard to social policy, countries need to expand the coverage and depth of social safety nets in order to mitigate the impact of droughts as well as external shocks.h
Inflation rates are expected to fall back slightly on average across the continent in 2012, following a more pronounced impact of higher fuel and food prices in 2011. The Communauté Financière Africaine (CFA) franc zone is expected to see average inflation of less than 4 per cent in 2012 assuming normal forecast harvest patterns. At the other extreme lies West Africa, where inflation will recede slightly but remain in solid double digits in 2012. In Nigeria, for example, strong Government spending and high liquidity will remain sources of inflationary pressure, implying a continued tightening stance by the central bank. Similarly, Ghana will also see double-digit inflation of about 10 per cent in 2012, partially driven by subsidy cuts and wage increases. However, a tighter fiscal
f See goodwill message
by Abdoulie Janneh, Executive Secretary of the United Nations Economic Commission for Africa, to the FAO meeting on “Emergency in the Horn of Africa: Follow-up and Response Actions”, held in Rome, Italy on 18 August 2011, available from http:// www.fao.org/fileadmin/ templates/horn_africa18/ documents/Goodwill_ Message_Abdoulie_Janneh. pdf.
g Ibid. f The United Nations
High-level Task Force on the Global Food Security Crisis, “Comprehensive Framework for Action”, July 2008, provides guidance on building resilience to food insecurity at the country level.
Inflation in the CFA franc zone remains moderate while the rest of West Africa copes with double-digit rates
116
The continuing need for further fiscal policy action is facing a bias towards fiscal restraint
External balances should improve in North Africa, but may deteriorate in sub-Saharan Africa due to increased imports
Unemployment and poverty remain high despite positive headline growth figures
Downside risks are tied to conditions in developed countries and adverse weather
World Economic Situation and Prospects 2012
policy and strong agricultural output may contribute to a relatively more stable inflation picture. In East Africa, the catastrophic drought has also led to a strong jump in food prices. However, the baseline envisages more normal harvest patterns in 2012, resulting in reduced inflation pressure. In South Africa, rising wages and electricity rates are expected to be partially offset by spare capacity in some sectors, resulting in an inflation rate of about 5.3 per cent in 2012. Across the continent, monetary policy is expected to maintain a tightening bias over the forecast horizon. Fiscal policy remains subject to a number of frequently conflicting factors. The need for significant investment in infrastructure and a lack of employment opportunities, compounded by fallout from the global economic crisis, are expected to underpin continued targeted increases in fiscal spending. At the same time, a number of Governments will likely maintain a bias against substantial increases of spending, seeking to achieve the sustainability of public finances. For example, South Africa is projected to register a budget deficit of about 5 per cent of GDP in 2012, but moderation of fiscal spending, combined with positive growth prospects, is expected to lead to a subsequent decline in the budget deficit to about 4 per cent of GDP, while the debt level will remain below 50 per cent of GDP. The assumed slight decline of oil prices will limit fiscal space for oil exporters such as Nigeria, whose budget deficit is expected to remain at about 4 per cent over the forecast period. In North Africa, Egypt, Morocco and Tunisia are expected to see lower current-account deficits in 2012 on the back of relative improvements in the tourism sector following disruptions due to regional political unrest. At the same time, a recovery in oil production in Libya is projected to boost its current-account surplus to about 20 per cent of GDP in 2012. In sub-Saharan Africa, oil producers such as Nigeria and Angola are expected to see sharply lower current-account surpluses in 2012, with stronger private consumption, as well as infrastructure investments, underpinning relatively strong import growth. Similarly, in South Africa, strong capital good imports combined with weak demand from developed countries on the export side likely will result in a deeper currentaccount deficit in 2012. However, a major risk in this respect is a sharper-than-expected slowdown in China, the largest export destination for South Africa, which would lead to an even bigger external deficit. High urban unemployment rates and, consequently, poverty remain a major problem across the continent despite the relatively solid expected growth trajectory. The underlying causes include a lack of economic diversification, particularly into activities generating higher value added, a shortage of skilled workers and low productivity. In South Africa, for example, unemployment will decrease only marginally in 2012 and 2013, remaining above 20 per cent in both years. In North Africa, high unemployment, especially among youth, was a major catalyst for the protests that led to the change in Government in Egypt and Tunisia. In the short term, the disruption to economic activity resulting from the political change will lead to a further increase in unemployment, but more significant reforms, including privatizations, could provide significant impetus for a more dynamic private sector. Correspondingly, in Egypt, for example, the unemployment rate will continue to rise, from 9 per cent in 2010 to about 12 per cent in 2011, before moderately receding to about 10 per cent after 2012. The outlook is subject to a number of downside risks. For example, a more pronounced slowdown in growth and the debt crisis in the developed countries might push the global economy into stagnation, while emerging economies are at risk of overheating. Under these adverse developments, Africa’s external sector may contract significantly if
117
Regional developments and outlook
commodity demand and prices, as well as tourism receipts, decrease. In parallel to this, flows of official development assistance (ODA), FDI and remittances would all likely fall as well, negatively affecting African financial markets. Adverse weather conditions are another significant downside risk given the large role of agriculture across the continent.
East Asia: growth drivers lose momentum East Asia’s strong growth momentum moderated in 2011, particularly in the second half of the year, as the region felt the impact of increased global uncertainty and weaker demand in developed economies (figure IV.6). The region’s GDP is estimated to have expanded by 7.2 per cent in 2011, down from 9.2 per cent in 2010. With exports projected to slow further in the coming quarters, average growth is forecast to decline to 6.9 per cent in 2012 and 2013 (see annex table A.3). While the region’s recovery from the global financial crisis was initially driven by a rebound in exports and investment, private consumption has become a more important factor over the past year. In almost all economies, with the notable exceptions of Thailand and Viet Nam, consumption growth gained further strength in 2011. This trend has been supported by rising wages and incomes, as well as persistently low real interest rates. Export growth slowed considerably in the course of 2011, as demand in the major developed economies weakened. Since this trend is projected to persist in 2012, countries with large domestic demand bases, notably China and Indonesia, will be in a better position to maintain high growth than the more export-oriented economies. In Thailand, the worst floods in half a century caused major damage to agriculture and manufacturing, lowering full-year
Growth is forecast to moderate further…
…as exports and investment lose momentum
Domestic consumption is helping to offset falling developed country demand
Figure IV.6 GDP growth rates in selected East Asian economies, 2011-2012 Percentage China
9.3
8.7
East Asia
6.9
7.2
6.5 6.3
Indonesia 5.8 6.0
Viet Nam Singapore
5.0
4.0
Hong Kong SAR a
4.9
4.1 4.6 4.4
Malaysia Taiwan Province of China Philippines
4.4
3.9
4.3 4.4
Republic of Korea
3.6
3.9
2.3
Thailand 0
1
2
2011 2012
4.1
3
4
5
6
7
8
9
10
Source: UN/DESA, based on data from Project LINK. a Special Administrative Region of China.
118
World Economic Situation and Prospects 2012
Labour market conditions remain favourable
Inflation has started to ease, but remains high
Central banks have started to shift their focus towards growth and away from inflation
growth in 2011 by a significant margin. China’s economy remains the engine of growth in the region, expanding by 9.3 per cent in 2011. In the outlook, growth in China is expected to slow gradually to 8.7 per cent in 2012 and 8.5 per cent in 2013, as strong consumption growth will only partly offset the slowdown in investment and exports. Unlike in other regions, labour market conditions in East Asia remain favourable for now, as employment in the manufacturing and services sectors continues to increase in 2011 amid strong domestic demand and solid exports. In most economies, unemployment rates are near or below the pre-crisis levels of 2007-2008, but subject to risks of a turnaround resulting from falling developed country demand. The Republic of Korea has the lowest unemployment rate among the Organization for Economic Cooperation and Development (OECD) countries, estimated at 3.1 per cent in October 2011. Unemployment rates in Hong Kong Special Administrative Region (SAR) of China and Indonesia fell to decade lows of 3.2 and 6.8 per cent, respectively, in 2011. However, despite recent progress, the proportion of vulnerable employment in total employment remains high in several countries, notably Indonesia, Thailand and Viet Nam. Unemployment rates are expected to show little change in 2012 and 2013, as growth is projected to remain fairly robust. Real wages continued to move up in 2011 on the back of productivity gains and policy measures, such as minimum wage hikes. This trend is expected to continue in the outlook period, especially in the economies with lower per-capita income and large domestic demand bases such as China, Indonesia and Viet Nam. China’s 12th Five-Year Plan (2011-2015) aims to increase the minimum wage by at least 13 per cent per year. After accelerating earlier in the year, consumer price inflation moderated in the second half of 2011, as food and commodity price gains eased. However, price pressures abated only slowly, and in many economies inflation has remained above the central bank’s target range. For the region as a whole, consumer price inflation is estimated to have averaged 5.1 per cent in 2011, up from 3.2 per cent in 2010 and ranging from 1.5 per cent in Taiwan Province of China to 18.5 per cent in Viet Nam. In most economies, higher food prices were the main contributor to accelerating consumer price inflation. The sharp upturn in food prices reflects the impact of supply disruptions, higher input costs (particularly for fuel) and rapidly growing demand in the wake of rising incomes. Inflation has also been fuelled by strong credit growth, notably in China and Viet Nam, significant capital inflows during the first half of 2011, and higher inflationary expectations. While robust consumption demand across East Asia is likely to be sustained by strong wage growth, a softening of international commodity prices will likely reduce inflationary pressures in the outlook. Average consumer price inflation is projected to decline gradually, to 3.9 per cent in 2012 and 3.4 per cent in 2013. With the world economy facing a renewed downturn and price pressures across the region slowly easing, most central banks, including the People’s Bank of China, have gradually started to shift their focus towards stimulating economic growth and away from fighting inflation. Bank Indonesia has been the most proactive in supporting domestic demand, cutting its main policy rate by 75 basis points in the fourth quarter of 2011. The recent policy shift in the region follows a period of gradual monetary tightening in the form of interest-rate hikes and increases in reserve requirements. The People’s Bank of China and the Bank of Korea raised the main interest rates five times between July 2010 and July 2011, by a total of 125 basis points each. Generally, however, central banks remained reluctant to tighten monetary policy aggressively owing to concerns over the global recovery and fears that interest-rate hikes could stimulate short-term capital inflows. Thus, in most countries, average real interest rates were negative in 2011. In 2012, East Asia’s central banks are expected to further ease monetary policy unless global economic conditions improve.
119
Regional developments and outlook
Most East Asian economies continue to have strong fiscal positions, with relatively low levels of public debt. Government spending expanded at a solid pace in 2011, albeit more slowly than in the aftermath of the crisis. To mitigate the impact of slowing exports, several Governments, including those of Indonesia, the Philippines and Thailand announced new, moderate-sized fiscal stimulus measures in the fourth quarter of 2011. After fiscal balances across the region improved considerably in 2010 as rapid economic growth boosted revenues, trends were more mixed in 2011. In the Philippines, the Republic of Korea and Singapore, budgets strengthened further, with the latter two countries and Hong Kong SAR registering a fiscal surplus. By contrast, Indonesia, Malaysia and Thailand saw a slight widening of deficits as Government spending increased markedly. China’s central Government deficit stood at about 1.5 per cent of GDP in 2011. Though precise local and state government deficits are not known, and may even be larger in the aggregate than the deficit of the central Government, the general view is that the fiscal situation is very manageable. While most Governments have ample fiscal space, large-scale stimulus packages may be implemented only if the growth and employment outlook deteriorates significantly. East Asia continued to see strong growth in exports and imports in 2011, despite some moderation in the second half of the year as demand from developed economies weakened and international commodity prices eased. Compared to 2010, total nominal export receipts are estimated to have increased by about 20 per cent in China, Indonesia and the Republic of Korea. This primarily reflects rapidly growing trade within the region, as well as with other emerging countries. Sluggish global demand for electronics adversely affected the region’s export sectors, most notably in the Philippines, where electronics shipments account for more than half of total exports. In most economies, import spending increased at a rate similar to that of export revenues, which resulted in largely unchanged trade balances in 2011. With the exception of Viet Nam, all East Asian economies recorded a current-account surplus in 2011. China’s current-account surplus, which had reached 10.6 per cent of GDP in 2007, declined to about 3.5 per cent of GDP in 2011. Since demand in developed economies is projected to remain sluggish in the outlook period, imports are expected to grow faster than exports, leading to a slight narrowing of external surpluses across the region. East Asia experienced significant net outflows of portfolio capital in the third quarter of 2011 amid increased risk aversion among global investors and concerns that the crisis in developed economies could severely affect growth across the region. These outflows, mostly in the form of equity investment, led to a drop in the value of national currencies against the dollar. This marks a sharp reversal of the trend observed over the past two years, when the region saw large portfolio investment inflows resulting in considerable appreciation pressure on national currencies. To dampen the volatility of short-run capital inflows and limit currency appreciation, several economies, notably Indonesia, the Republic of Korea, Taiwan Province of China, and Thailand have been imposing new capital management measures since 2009. Despite the recent episode of portfolio capital outflows, East Asia is set to record significant net inflows of private capital for 2011 as a whole. Given the region’s comparatively strong growth outlook and widely available liquidity, this trend is likely to continue in 2012 and 2013, with most currencies in East Asia projected to appreciate gradually. While East Asia is not immune to a downturn in developed economies, the region is in a strong position to tackle the challenges arising from weaker external demand. However, deep and prolonged recessions in major developed economies would
Fiscal positions remain strong as Government spending expands
Trade activity has started to slow down
Portfolio capital flows are still volatile, leading to more capital controls
Slower growth in developed economies and China pose downside risks
120
World Economic Situation and Prospects 2012
have a severe impact on economic growth in the region as falling exports and increased uncertainty could trigger a slowdown in private investment and consumption. In addition, should China’s growth in 2012-2013 decelerate to the 7 per cent target rate of the 12th Five-Year Plan (2011-2015), the rest of the region would also see a more pronounced slowdown than currently expected.
South Asia: robust domestic demand drives growth Economic growth is expected to remain resilient….
…but is diverging widely across South Asia
Employment is improving in India and Sri Lanka but remains weak elsewhere in the region
Economic growth in South Asia moderated in 2011, primarily owing to a slowdown of the Indian economy. After expanding by 7.2 per cent in 2010, real GDP is estimated to have grown by 6.5 per cent in 2011. The region is expected to remain fairly resilient to the global economic downturn and sustain its growth momentum in the outlook period. Driven by robust domestic demand, average growth is forecast to accelerate slightly to 6.7 per cent in 2012 and 6.9 per cent in 2013 (see annex table A.3). Private consumption and investment continued to be the main growth drivers in the region, with domestic demand supported by strong agricultural output and robust remittance inflows. Strong exports, particularly in the first half of the year, and a solid expansion of Government spending also contributed positively to growth. However, growth disparities within the region remained wide with Bangladesh, India and Sri Lanka recording GDP growth of 6.5 per cent or higher, and the Islamic Republic of Iran, Nepal and Pakistan registering growth rates of less than 4 per cent. India’s economy has slowed over the past year as monetary policy was tightened in order to bring down inflation. With domestic demand moderating, GDP growth is estimated to have declined from 9 per cent in 2010 to 7.6 per cent in 2011. Assuming a gradual easing of inflationary pressures and an end to the monetary tightening cycle, growth is forecast to increase slightly to 7.7 per cent in 2012 and 7.9 per cent in 2013. Buoyant domestic demand and a recovery in exports underpinned strong growth in Bangladesh and Sri Lanka in 2011. In the Islamic Republic of Iran, Nepal and Pakistan, long-standing structural problems such as weak policy implementation, security concerns and low investment in physical and human capital constrain growth. In all three countries, economic conditions are expected to improve slightly in the outlook period, but growth will remain well below potential. The latest labour force surveys in South Asia provide a mixed picture. While the employment situation in the fast-growing economies of India and Sri Lanka has improved, it remained weak in other parts of the region, notably in the Islamic Republic of Iran and crisis-ridden Pakistan. In Sri Lanka, the unemployment rate declined to an all-time low of 4.3 per cent in early 2011 on the back of a strong expansion in the services and industry sectors. By contrast, in the Islamic Republic of Iran and Pakistan, sluggish growth over the past few years has had a negative impact on employment. The average unemployment rate has increased in the Islamic Republic of Iran from 11.9 per cent in the fiscal year 2009-2010 to 14.6 per cent in 2010-2011 and in Pakistan from 5.6 per cent in the fiscal year 2009-2010 to 6.0 per cent in 2010-2011. In addition to elevated unemployment rates, South Asia’s labour markets face deep-rooted structural challenges, such as the highest share of vulnerable employment among all developing regions and widespread youth unemployment. Moreover, in all countries of the region, unemployment rates among women are far higher than among men.
Regional developments and outlook
Consumer price inflation remained high across South Asia in 2011, presenting a major challenge for policymakers. Regional inflation averaged 10.3 per cent, down only slightly from 11.6 per cent in 2010 and ranging from 7.0 per cent in Sri Lanka to 17 per cent in the Islamic Republic of Iran. The increases in consumer prices were driven by a variety of factors, including higher international food and energy prices, domestic supply shortages, the reduction of fuel subsidies in several countries (including the Islamic Republic of Iran) and buoyant demand conditions in Bangladesh, India and Sri Lanka. In the outlook, inflation is projected to decline slowly, averaging 9.1 per cent in 2012 and 8.0 per cent in 2013, as pressure from higher food and commodity prices eases and the impact of monetary policy tightening is felt in Bangladesh and India. However, there are substantial upside risks to inflation, including renewed supply shocks such as insufficient monsoon rains and a rise in international commodity prices. Facing high and persistent inflation, several central banks in South Asia, most notably the Reserve Bank of India, continued to tighten monetary policy in 2011. However, with risks to the world economy again rising, the focus of monetary authorities has started to shift towards supporting domestic demand. The Reserve Bank of India signalled an end to the current tightening cycle in October 2011 after hiking its key policy rates for the thirteenth time since early 2010. In Pakistan, a slowdown in inflation during the third quarter of 2011 led the State Bank to cut its main policy rate from 14 per cent to 12 per cent in an attempt to stimulate private investment and growth. Bangladesh Bank by contrast, stepped up measures to contain accelerating inflation, lifting interest rates and restraining credit flows, especially to sectors considered unproductive. Looking ahead, central banks are likely to continue to move towards a growth-supportive monetary policy if inflationary pressures ease. Despite some progress in recent years, fiscal deficits continue to be high in most South Asian countries, particularly in India, Pakistan and Sri Lanka (figure IV.7). Government spending rose significantly in 2011 as development expenditures (such as education, health and infrastructure spending), non-development expenditures (such as civil service pay and defence spending) and interest payments increased. Pakistan recorded a deficit of about 6 per cent of GDP in the fiscal year 2010-2011, missing the International Monetary Fund (IMF) target of 4.7 per cent. This can be mainly attributed to the devastating floods in 2010, higher security expenditures and failed efforts to implement a general sales tax due to domestic political opposition. India’s fiscal deficit declined to 5.1 per cent of GDP in the fiscal year 2010-2011, as strong growth boosted tax revenues and the sale of 3G telecommunications licences increased non-tax revenues. However, India’s Government is unlikely to reach the deficit target of 4.7 per cent of GDP for the fiscal year 2011-2012, as slowing growth is leading to a shortfall in tax revenues and the disinvestment of stakes in State-run companies is put on hold. After recovering rapidly in the first half of 2011, South Asia’s export sectors experienced a moderation in demand owing to deteriorating conditions in developed economies. Nonetheless, in most countries of the region, total export earnings in 2011 were about 20 per cent higher than a year ago. Bangladesh, Pakistan and Sri Lanka benefited from a strong recovery in demand for textiles and garments, partly as a result of significant cost increases in China and political turmoil in North Africa and Western Asia. In India, exports of engineering goods, petroleum products, gems and jewellery soared. High oil and commodity prices and strong domestic demand boosted import spending in 2011, notably in Bangladesh, India and Sri Lanka. Since, in most countries, imports had started from a higher base than exports, merchandise trade deficits widened further in
121
Inflation remains high, but is projected to decline slowly
Monetary policies diverge across countries depending on their inflation rates
Fiscal deficits remain high
Trade deficits are widening further despite strong export growth
122
World Economic Situation and Prospects 2012
Figure IV.7 Central Government deficits in selected South Asian countries, fiscal years 2009-2011 Percentage of GDP 2009 2010 2011
6.3
India
5.1 5.6
5.3
Pakistan
6.3 6.0
9.9
Sri Lanka
Sources: UN/DESA, based on data from national sources, the Economist Intelligence Unit and the IMF. Note: In India, the fiscal year begins in April; in Bangladesh and Pakistan, the fiscal year ends in June; and in Sri Lanka, the fiscal year corresponds to the calendar year.
A prolonged recession in Europe will pose serious downside risks
7.9 6.9
4.0
Bangladesh
3.7 4.2 0
2
4
6
8
10
12
2011. This was partly offset by improvements in the services balance and higher current transfers, although workers’ remittances grew at a slower rate than in previous years. In 2012, export growth is likely to decelerate, resulting in a further widening of trade deficits in most countries. A prolonged recession in Europe could have a significant impact on growth across South Asia as European countries continue to be a key export market for the region and a main source of tourism revenues. Renewed increases in international commodity prices also represent a risk for South Asia, as this would complicate fiscal deficit reduction and monetary policy decisions while also leading to a widening of current-account deficits.
Western Asia: growth trajectories shaken by political unrest Political unrest is having strong asymmetric effects on regional economies
Growth in oil-exporting countries is driven by rising oil prices, public spending and domestic demand
Western Asia’s economic prospects have been subject to high uncertainty since the start of the Arab spring. As spreading political unrest pushed up oil prices despite weakening global aggregate demand, the economic performance of net oil exporters and importers diverged sharply in 2011, the former growing much faster than the latter. Violent clashes further affected economic activity in several countries. In Israel and Turkey, robust economic activity weakened during the second half of the year. In 2012, regional growth is forecast to decline from 6.6 per cent to 3.7 per cent with economic activity slowing down in most countries (see annex table A.3 and figure IV.8). Economic growth in oil-exporting countries strongly benefited from rising oil prices, as well as strong public spending and private consumption. Amidst growing volatility and widening spreads between two of the major oil price benchmarks (see chapter II), average yearly price levels have reached unprecedented highs in 2011 with the basket
Regional developments and outlook
123
Figure IV.8 Diverging GDP growth trajectories in Western Asia, 2000-2013 10
Percentage
8 6 4 2 0 -2 Net oil exporters Israel and Turkey Other net oil importers
-4 -6 2000
2001
2002
2003
2004
2005
2006
2007
2008
2009
2010
2011
2012
2013
price of the Organization of the Petroleum Exporting Countries (OPEC) remaining above $100 per barrel (pb) during most of the year compared to an average of $77 pb in 2010.4 Furthermore, when the conflict in Libya reduced global oil supply by 1.6 million barrels per day (mbd), Bahrain and the United Arab Emirates stepped up oil production, as did Saudi Arabia, which increased its crude supply to a record high of 9.8 mbd in August, well over the OPEC quota of 8.05 mbd. Qatar also benefited from rising energy prices as its liquefied natural gas production increased by 40 per cent during the first half of 2011. The generous social spending measures announced by many Arab Governments in reaction to popular protests further boosted economic growth by increasing public and private consumption. As a result, most Gulf Cooperation Council (GCC) countries, as well as Iraq, fared even better in 2011 than they did in 2010. In 2012, growth is forecast to decline on the back of fading political turmoil and slackening economic activity in developed economies. Lasting protests and violent clashes with authorities have dented growth in several countries. Bahrain, which promptly responded with military support from GCC countries to protests that had erupted in March, will experience positive though lowerthan-expected growth in 2011. The unresolved sectarian divide, however, may discourage investors and harm Bahrain’s ambition of becoming a regional hub for financial and other services. Yemen, as well as the Syrian Arab Republic, registered negative growth in 2011. Prospects for 2012 are dependent upon domestic political developments and the potential internationalization of Western economic sanctions. Fuel importers experienced continued growth on sometimes shaky ground. Modest economic support measures stimulated private consumption on the back of 4
See chap. II, section on the oil market for further discussion based on the analysis of Brent price.
Source: UN/DESA, based on data from Project LINK.
Unresolved domestic political issues may hamper growth in some countries
Oil-importing countries are expected to see slower growth
124
World Economic Situation and Prospects 2012
Despite low female participation in labour markets, unemployment remains high, especially among youth
Inflationary pressures have weakened
Many countries are pegged to the dollar, while others are tightening policies to deal with inflation
growing budget deficits. Regional unrest, however, in addition to rising oil prices and import bills, affected trade and tourism revenues, most starkly in Lebanon. In Turkey, strong private consumption supported economic activity, especially in the construction, trade, transportation and communication sectors. The economy grew by 7.5 per cent in 2011, but momentum faded during the second half of the year. The Turkish economy, along with that of Israel and many other countries in the region, is expected to see its growth slowing down in 2012 in the context of weakening external demand. Recent political unrest highlights the poor employment situation as well as the common problematic features of many labour markets in the region. Despite extremely low female participation rates, unemployment rates in the region are among the highest in the world, especially among educated youth. At the same time, migrant workers represent on average more than 70 per cent of the labour force in GCC countries. These conditions point, inter alia, at a longstanding lack of coherence between education and economic development policies. In order to counter the threat of spreading unrest, many Governments promised to quickly create jobs for nationals in the public sector and increase wages. Saudi Arabia is trying to impose quotas for nationals in private businesses. In Turkey, after peaking above 14 per cent in 2009, the unemployment rate oscillated around 10 per cent during 2011. In Israel, unemployment receded to 5.6 per cent, below its pre-crisis level. Despite this apparent improvement, in July and August of 2011, rising income disparities and the high cost of living led the struggling working class to organize the largest social protests the country has experienced since its creation. During the first half of 2011, inflation was on the rise in all countries of the region as a result of increasing food and energy prices. In countries with pegged currencies, the weakness of the dollar further contributed to the rise in imported inflation. Over the same period, price levels rose significantly in Israel and Turkey driven by strong private consumption and credit growth. In Israel, this was compounded by the dramatic rise in housing prices, which have soared by 60 per cent since 2007. During the second half of the year, inflationary pressures in the region lessened with the weakening of aggregate demand and receding world food and energy prices. In Turkey, however, inflation remained above the central bank’s target, and is expected to moderate further in 2012. Monetary authorities in the region pursue different objectives. In most Arab countries, currencies are pegged to or closely managed against the dollar, and monetary policy is tied to the stance of the Fed in order to limit unhealthy carry trades. Inflationtargeting led the Bank of Israel to raise its policy rate four times in a row in 2011 before lowering it twice as weakening demand from its main export markets threatened to affect domestic demand. Like other emerging markets, Turkey has to deal with the effects of large capital inflows and outflows. Since the end of 2010, the central bank’s policy mix has consisted of capping loan growth instead of raising interest rates to avoid overheating. This initially allowed it to simultaneously stabilize inflation while discouraging carry trade. However, as capital kept moving out of the country, the effective nominal exchange rate depreciated by almost 20 per cent and pushed up imported inflation. Indeed, as external demand declined in an increasingly depressed international environment, import demand remained high given continued strong domestic demand growth and typically slow responsiveness of imports to exchange-rate changes. In October, annual inflation rose sharply to 7.7 per cent, up 1.5 percentage points compared to the previous month. Although the central bank forecasts inflation of 8.3 per cent this year, 2.8 percentage points above the target, it has kept the policy interest rate unchanged in a bid to sustain economic growth. Monetary tightening occurred, however, through the sharp rise in
125
Regional developments and outlook
October of the overnight rate from 5.75 per cent to 12.5 per cent, while reserve requirements were loosened to ensure adequate liquidity. Fiscal policy in Western Asia was significantly affected by political turmoil, forcing rulers to devise unprecedented social spending measures to quench claims for domestic political reform. In Saudi Arabia, for instance, two extraordinary spending packages worth a combined 30 per cent of GDP have been announced, which aimed to increase employment, wages and consumption in the short run as well as address housing shortages in the long run. Other countries threatened by political unrest adopted similar, although more modest spending packages. Such measures were financed out of existing budget surpluses in oil-exporting countries, but they widened fiscal deficits in oil importing countries, whose Governments had to recur to international development assistance and financial markets to raise funds. Policies aimed at increasing consumption instead of stimulating economic diversification and productivity growth may become a drag on public budgets and economic development over the long run. External balances in fuel-exporting countries showed solid surpluses in 2011 as a result of the combination of higher oil prices and increased production. Oil importing countries saw their import bills rise substantially with the oil price increase. Their external environment worsened further with the region-wide repricing of risk that weighs more on the oil-importing countries. All countries registered portfolio investment outflows, and FDI into the region is estimated to have declined for the third consecutive year, by 14 per cent in 2011. The impact in oil-exporting countries, however, has been cushioned as the financing for large-scale oil projects remained uninterrupted. In Turkey, the weak lira improved the competitiveness of Turkish tradable goods and services. However, in the context of strong domestic and weak external demand, exports have not kept pace with imports, causing the current-account deficit to widen to about 10 per cent of GDP in 2011. In Israel, exports representing about a quarter of GDP were negatively affected by declining demand from its main export markets starting in the second half of 2011, and the current-account balance may turn slightly negative for the first time since 2002. In the outlook, Western Asia faces three major downside risks. First, the region may be destabilized by the revival of international tensions or by sprawling domestic political unrest. Second, if the financial woes and deeper fiscal austerity in developed countries were to trigger a global downturn, oil prices could drop below break-even prices for fiscal sustainability in oil-exporting countries. In the long run, inaction in relation to the dire employment situation and, more broadly, the failure to implement effective diversification strategies based on a more inclusive development paradigm represent major risks to stability and prosperity in the region.
Spending packages have been devised to address political unrest
Oil exporters continue to have strong external balances…
…but the rest of the region is facing current-account deficits
Continued political unrest, a possible global downturn and lack of economic diversification pose serious downside risks
Latin America and the Caribbean: robust but uneven recovery Economies in Latin America and the Caribbean experienced, on average, robust growth in 2011, with an estimated 4.3 per cent increase of GDP, though this did mark a deceleration from the 6 per cent growth rate achieved in 2010. The average masks important differences in performance across countries (figure IV.9). Growth trends also differed starkly between the first and second halves of the year. South America’s GDP grew on average by an estimated 4.6 per cent in 2011. It boomed in the first quarter of the year only to gradually decelerate thereafter. Both
South American growth is robust but slowing
126
World Economic Situation and Prospects 2012
Figure IV.9 Growth forecast for Latin America and the Caribbean, 2012 Change in percentage of GDP
Source: UN/DESA, based on data from Project LINK.
The recovery in Mexico, Central America and the Caribbean is slowing as growth in developed countries weakens
New fiscal stimuli under way to counter a global downturn…
Argentina Peru Panama Guyana Honduras Trinidad and Tobago Dominican Republic Guatemala Colombia Costa Rica Bolivia, Plurinational State of Ecuador South America Caribbean Uruguay Chile Paraguay El Salvador Latin America and the Caribbean Barbados Haiti Cuba Brazil Mexico and Central America Mexico Nicaragua Jamaica Venezuela, Bolivarian Republic of
7.2 5.2 5.0 4.7 4.6 4.4 4.2 4.1 4.0 3.9 3.8 3.6 3.6 3.5 3.4 3.4 3.4 3.3 3.3 3.1 3.1 3.0 2.7 2.7 2.5 2.3 2.3 2.0
internal and external factors drove the expansion. Internally, increasing employment reduced poverty and inequality, thereby boosting private consumption. This occurred most markedly in Brazil, the region’s largest and most populated economy, but also in the rest of South America, where urban unemployment is currently lower than before the crisis. Meanwhile, private and public investment increased too, fuelled by expanding credit and underpinned by solid bank balance sheets. Rising commodity prices pushed up export revenues, providing Governments with additional revenue through royalties, State-owned commodity operations and taxes. The economies of Mexico and Central America grew by a more moderate average of 3.8 per cent and the Caribbean grew by 3.4 per cent in 2011. On average, private and public consumption saw a downward trend, while unemployment rates remained virtually unchanged compared to 2010. Exports, typically a major driver of growth in Central America and the Caribbean, were held back by the economic slowdown of the United States and other high-income countries that are their major market destinations. Also, several Central American and Caribbean economies heavily rely on remittances and tourism, which decreased during the global recession and have since remained below their long-term average as recovery in advanced economies has faltered. Fiscal policies tightened in several South American countries in the first and part of the second quarter of 2011. In Brazil and Peru, several stimulus programmes put in place in response to the 2009 global crisis were phased out. In the third quarter, as fears of overheating faded and concerns about a second global downturn mounted, Governments announced the preparation of additional expansionary measures to be deployed in the event of an actual new downturn. The Governments of some commodity-exporting countries, such as Chile and Peru, announced their intention to tap the funds accumulated
Regional developments and outlook
during the period of rallying commodity prices and deploy additional resources to expand social cash-transfer programmes. In November, Brazil returned to fiscal expansion with a $1.5 billion programme targeting food purchases and consumption of other goods. In the same month, the Government of Ecuador presented an expansionary fiscal budget for 2012 featuring a strong investment push. Compared to 2008-2009, however, the fiscal space for large-scale countercyclical measures is relatively limited. Indeed, the additional spending aimed at containing the impact of the global recession, combined with an incomplete restoration of tax revenues, raised the public debt-to-GDP ratio by more than 5 percentage points. On the monetary front, policy has been active, too. Monetary policies in most parts of the region were initially characterized by repeated increases of the policy interest rates amid fears of inflation. On average, inflation was slightly above 7 per cent in Latin America and the Caribbean in 2011. Monetary stances have differed strongly, however. Monetary authorities in Brazil, Chile, Colombia, Mexico, Peru and Uruguay have focused primarily on price stability, adopting inflation targeting. Yet, they recorded consumer price indices near the upper bound of their target range. Among these, the inflation rates of Brazil, Peru and Uruguay were above their upper bounds, between 3 per cent and 7.5 per cent. In these economies, inflation remained high because of rapid growth of internal demand and rising food and asset prices. In the fourth quarter of 2011, upward pressure on nominal wages intensified in Brazil. In Mexico, Nicaragua and Central America, the impact of rising food prices on overall inflation was stronger as food expenditures weighed more heavily on household budgets than they did in South America. Two large economies in the region, Argentina and the Bolivarian Republic of Venezuela, recorded double-digit inflation in 2011. In the latter, annual inflation reached approximately 24 per cent in September 2011, driven by growing consumption and the depreciation of the bolivar. In Argentina, inflation, as measured through the GDP deflator, was 17 per cent, while nominal wages and the monetary base grew by 25 per cent and 30 per cent, respectively. As economic activity slowed in the second and third quarters, central banks in Brazil, Chile, Colombia and Peru changed course, interrupting tightening trends and increasing liquidity. In Mexico, concerns over another possible downturn of the United States economy dominated monetary policy considerations. The stance was kept accommodative throughout 2011. International commodity prices recorded sustained increases in the first half of 2011. They have slowed since, but stayed above long-term averages. On balance, terms of trade improved on average by an estimated 6 per cent in 2011, but with commodityexporting countries recording large gains and commodity importers suffering losses. Exporters of metals and minerals (Chile and Peru) benefited the most, followed by oil and gas exporters (the Bolivarian Republic of Venezuela, Colombia, Ecuador and the Plurinational State of Bolivia) and exporters of agricultural commodities (Argentina, Brazil, Chile, Paraguay and Uruguay). On the other hand, when commodity prices, especially those of non-precious metals, retreated in the second half of 2011, the economies of Chile and Peru were affected the most. Argentina was affected by the fall in grain prices. Despite the slowdown of commodity prices in the second half of the year, early increases allowed Jamaica, Suriname and Trinidad and Tobago, to record current-account surpluses. Several Caribbean countries, in contrast, faced adverse conditions due to rising
127
…but fiscal space is more limited for counter-cyclical responses
Inflation and slowing economic growth across the region pose dilemmas for central banks
Rising commodity prices have helped improve the terms of trade of primary commodity-exporting countries
128
World Economic Situation and Prospects 2012
Financial markets have been volatile, but the banking sector remains stronger than in other regions
External volatility has prompted various countries to intervene in foreignexchange markets
Growth is forecast to slow moderately across the region
food and energy prices. Haiti was hit particularly hard by higher food prices and poor crops in 2011, and was listed by the Food and Agriculture Organization of the United Nations (FAO) among those countries requiring external food assistance. Asset prices also showed high volatility throughout the year. Major financial markets in the region also suffered from contagion of the global financial turmoil during the third quarter of 2011, reflected in a sell-off in stock markets and sudden reversals of short-term capital flows. Speculative capital flows affected the non-banking financial sector more than Latin American banks. Banks’ balance sheets have remained solid, with a relatively low share of non-performing loans. One concern, however, is the strong presence of Spanish banks whose exposure in the European sovereign bonds market, especially those of Italy and Portugal, tops €120 billion. Sovereign defaults in the euro area or further capital requirements beyond those already under way may prompt these banks to reduce credit or liquidate assets in Latin American operations to repatriate capital to Spain. In order to respond to external volatility, monetary authorities, in particular those of Argentina, Brazil, Colombia, Costa Rica, Mexico, Peru and Uruguay adopted various forms of intervention in foreign-exchange markets. While exchange rates have generally been free to fluctuate, several central banks intervened in the second and third quarters of 2011 in order to mitigate currency appreciation and preserve export competitiveness. Both Brazil and Peru enhanced capital account regulations, while some countries experimented with indirect measures such as stockpiling international reserves and prepaying external debt. Brazil has been particularly active in trying to stabilize the value of its currency. Amidst concerns of overvaluation and deindustrialization, the Government intervened to lower the exchange rate in September, and soon after, a free fall of the real forced it to change course and support the rate. As capital movements remained very volatile, Brazil introduced mild forms of capital-account regulation aimed not only at stabilizing the currency but also at gaining better control over monetary policy. In the outlook for 2012, South American economies are expected to continue the deceleration that set in during 2011, reaching a modest 3.6 per cent GDP growth in the baseline forecast. The economies of the Caribbean, Central America and Mexico are expected to slow down as well, with growth projected to average 3 per cent in 2012. Risks to the outlook are mainly on the downside. Economic growth prospects in the Caribbean, Central America and Mexico will darken considerably with a possible downturn in Europe and the United States. This could then trigger a downward spiral of lower tax revenues, difficulties in servicing public debts, greater fiscal austerity and even lower demand growth. A slowdown of the Chinese economy, a major buyer of the region’s commodities and major investor in South America, may weaken demand for manufacturing exports and soften commodity prices, further affecting the South American economies. A deepening of the sovereign debt crises in Europe and fears of dollar funding drying up could spill over through rising spreads on emerging market bonds and make public and private financing more expensive or unavailable for some countries in the region. Finally, if such financial spillover effects lead to tighter domestic credit supplies, investment and consumer demand growth would be held back further. Some financial institutions, including the IMF and some central banks, optimistically see possible upside risks in the event that sovereign debt crises in the developed countries unwind more quickly than expected, allowing for stronger rebounds in demand and FDI.
Statistical annex
131
Country classification Data sources, country classifications and aggregation methodology The statistical annex contains a set of data that the World Economic Situation and Prospects (WESP) employs to delineate trends in various dimensions of the world economy.
Data sources The annex was prepared by the Development Policy and Analysis Division (DPAD) of the Department of Economic and Social Affairs of the United Nations Secretariat (UN/ DESA). It is based on information obtained from the Statistics Division and the Population Division of UN/DESA, as well as from the five United Nations regional commissions, the United Nations Conference on Trade and Development (UNCTAD), the United Nations World Tourism Organization (UNWTO), the International Monetary Fund (IMF), the World Bank, the Organization for Economic Cooperation and Development (OECD), and national and private sources. Estimates for the most recent years were made by DPAD in consultation with the regional commissions, UNCTAD, UNWTO and participants in Project LINK, an international collaborative research group for econometric modelling coordinated jointly by DPAD and the University of Toronto. Forecasts for 2012 and 2013 are primarily based on the World Economic Forecasting Model of DPAD, with support from Project LINK. Data presented in WESP may differ from those published by other organizations for a series of reasons, including differences in timing, sample composition and aggregation methods. Historical data may differ from those in previous editions of WESP because of updating and changes in the availability of data for individual countries.
Country classifications For analytical purposes, WESP classifies all countries of the world into one of three broad categories: developed economies, economies in transition and developing countries. The composition of these groupings, specified in tables A, B and C, is intended to reflect basic economic country conditions. Several countries (in particular the economies in transition) have characteristics that could place them in more than one category; however, for purposes of analysis, the groupings have been made mutually exclusive. Within each broad category, some subgroups are defined based either on geographical location or on ad hoc criteria, such as the subgroup of “major developed economies”, which is based on the membership of the Group of Seven. Geographical regions for developing countries are as follows: Africa, East Asia, South Asia, Western Asia, and Latin America and the Caribbean.a In parts of the analysis, a distinction is made between fuel exporters and fuel importers from among the economies in transition and the developing countries. An a
Names and composition of geographical areas follow those specified in the statistical paper entitled “Standard country or area codes for statistical use” (ST/ESA/STAT/SER.M/49/Rev. 4).
132
World Economic Situation and Prospects 2012
economy is classified as a fuel exporter if the share of fuel exports in its total merchandise exports is greater than 20 per cent and the level of fuel exports is at least 20 per cent higher than that of the country’s fuel imports. This criterion is drawn from the share of fuel exports in the total value of world merchandise trade. Fuels include coal, oil and natural gas (table D). For other parts of the analysis, countries have been classified by their level of development as measured by per capita gross national income (GNI). Accordingly, countries have been grouped as high-income, upper middle income, lower middle income and low-income (table E). To maintain compatibility with similar classifications used elsewhere, the threshold levels of GNI per capita are those established by the World Bank. Countries with less than $1005 GNI per capita are classified as low-income countries, those with between $1,006 and $3,975 as lower middle income countries, those with between $3,976 and $12,275 as upper middle income countries, and those with incomes of more than $12,276 as high-income countries. GNI per capita in dollar terms is estimated using the World Bank Atlas method,b and the classification in table E is based on data for 2010. The list of the least developed countries (LDCs) is decided upon by the United Nations Economic and Social Council and, ultimately, by the General Assembly, on the basis of recommendations made by the Committee for Development Policy. The basic criteria for inclusion require that certain thresholds be met with regard to per capita GNI, a human assets index and an economic vulnerability index.c As at 25 November 2011, there were 48 LDCs (table F). WESP also makes reference to the group of heavily indebted poor countries (HIPCs), which are considered by the World Bank and IMF as part of their debt-relief initiative (the Enhanced HIPC Initiative).d In November 2011, there were 40 HIPCs (table G). South Sudan became independent on 9 July 2011 and became a Member State of the United Nations on 14 July 2011. Information on South Sudan is not included in this year’s WESP owing to lack of statistical data.
Aggregation methodology Aggregate data are either sums or weighted averages of individual country data. Unless otherwise indicated, multi-year averages of growth rates are expressed as compound annual percentage rates of change. The convention followed is to omit the base year in a multi-year growth rate. For example, the 10-year average growth rate for the decade of the 2000s would be identified as the average annual growth rate for the period from 2001 to 2010. WESP utilizes exchange-rate conversions of national data in order to aggregate output of individual countries into regional and global totals. The growth of output in each group of countries is calculated from the sum of gross domestic product (GDP) of individual countries measured at 2005 prices and exchange rates. Data for GDP in 2005 in national currencies were converted into dollars (with selected adjustments) and extended b c
d
See http://data.worldbank.org/about/country-classifications. Handbook on the Least Developed Country Category: Inclusion, Graduation and Special Support Measures (United Nations publication, Sales No. E.07.II.A.9). Available from http://www.un.org/en/ development/desa/policy/cdp/cdp_ldcs_handbook.shtml. International Development Association (IDA) and IMF, “Heavily Indebted Poor Countries (HIPC) Initiative and Multilateral Debt Relief Initiative (MDRI): Status of implementation”, 14 September 2010. Available from http://www.imf.org/external/np/pp/eng/2010/091410.pdf.
Country classification
forwards and backwards in time using changes in real GDP for each country. This method supplies a reasonable set of aggregate growth rates for a period of about 15 years, centred on 2005. The exchange-rate based method differs from the one mainly applied by the IMF and the World Bank for their estimates of world and regional economic growth, which is based on purchasing power parity (PPP) weights. Over the past two decades, the growth of world gross product (WGP) on the basis of the exchange-rate based approach has been below that based on PPP weights. This is because developing countries, in the aggregate, have seen significantly higher economic growth than the rest of the world in the 1990s and 2000s and the share in WGP of these countries is larger under PPP measurements than under market exchange rates.
Table A Developed economies Europe European Union
Other Europe
Other countries
Major developed economies (G7)
EU-15 Austria Belgium Denmark Finland France Germany Greece Ireland Italy Luxembourg Netherlands Portugal Spain Sweden United Kingdom
Iceland Norway Switzerland
Australia Canada Japan New Zealand United States
Canada Japan France Germany Italy United Kingdom United States
New EU member States Bulgaria Cyprus Czech Republic Estonia Hungary Latvia Lithuania Malta Poland Romania Slovakia Slovenia
133
134
World Economic Situation and Prospects 2012
Table B Economies in transition
South-Eastern Europe Albania Bosnia and Herzegovina Croatia Montenegro Serbia The former Yugoslav Republic of Macedonia
Commonwealth of Independent States and Georgiaa Armenia Azerbaijan Belarus Georgiaa Kazakhstan Kyrgyzstan Republic of Moldova Russian Federation Tajikistan Turkmenistan Ukraine Uzbekistan
a Georgia officially left the Commonwealth of Independent States on 18 August 2009. However, its performance
is discussed in the context of this group of countries for reasons of geographic proximity and similarities in economic structure.
Country classification
Table C Developing economies by regiona Africa
Asia
Latin America and the Caribbean
East Asia Caribbean North Africa Brunei Darussalam Barbados Algeria China Cuba Egypt Hong Kong SARc Dominican Republic Libyab Guyana Morocco Indonesia Haiti Tunisia Malaysia Jamaica Sub-Saharan Africa Myanmar Trinidad and Tobago Central Africa Papua New Guinea Mexico and Central America Cameroon Philippines Costa Rica Central African Republic Republic of Korea El Salvador Chad Singapore Congo Taiwan Province of China Guatemala Honduras Equatorial Guinea Thailand Mexico Gabon Viet Nam Nicaragua Sao Tome and Prinicipe South Asia Panama East Africa Bangladesh South America Burundi India Comoros Iran (Islamic Republic of ) Argentina Bolivia (Plurinational State of ) Democratic Republic of the Congo Nepal Brazil Djibouti Pakistan Chile Eritrea Sri Lanka Colombia Ethiopia Western Asia Ecuador Kenya Bahrain Paraguay Madagascar Iraq Peru Rwanda Israel Uruguay Somalia Jordan Venezuela (Bolivarian Republic of ) Sudan Kuwait Uganda Lebanon United Republic of Tanzania Oman Southern Africa Qatar Angola Saudi Arabia Botswana Syrian Arab Repuplic Lesotho Turkey Malawi United Arab Emirates Mauritius Yemen Mozambique Namibia South Africa Zambia Zimbabwe West Africa Benin Burkina Faso Cape Verde Côte d’Ivoire Gambia Ghana Guinea Guinea-Bissau Liberia Mali Mauritania Niger Nigeria Senegal Sierra Leone Togo a Economies systematically monitored by the Global Economic Monitoring Unit of DPAD. b The name of the Libyan Arab Jamahiriya was officially changed to Libya on 16 September 2011. c Special Administrative Region of China.
135
136
World Economic Situation and Prospects 2012
Table D Fuel-exporting countries Developing countries Economies in transition
Latin America and the Caribbean
Azerbaijan Kazakhstan Russian Federation Turkmenistan Uzbekistan
Bolivia (Plurinational State of ) Colombia Ecuador Trinidad and Tobago Venezuela (Bolivarian Republic of )
Africa
East Asia
South Asia
Western Asia
Algeria Angola Cameroon Chad Congo Côte d’Ivoire Egypt Equatorial Guinea Gabon Libyaa Nigeria Sudan
Brunei Darussalam Indonesia Viet Nam
Iran (Islamic Republic of )
Bahrain Iraq Kuwait Oman Qatar Saudi Arabia United Arab Emirates Yemen
a The name of the Libyan Arab Jamahiriya was officially changed to Libya on 16 September 2011.
Country classification
Table E Economies by per capita GNI in 2011a High-income
Upper middle income
Lower middle income
Low-income
Australia Austria Bahrain Barbados Belgium Brunei Darussalam Canada Croatia Cyprus Czech Republic Denmark Equatorial Guinea Estonia Finland France Germany Greece Hong Kong SARb Hungary Iceland Ireland Israel Italy Japan Kuwait Montenegro Luxembourg Malta Netherlands New Zealand Norway Oman Poland Portugal Qatar Republic of Korea Saudi Arabia Singapore Slovakia Slovenia Spain Sweden Switzerland Taiwan Province of China Trinidad and Tobago United Arab Emirates United Kingdom United States
Albania Algeria Argentina Azerbaijan Belarus Bosnia and Herzegovina Botswana Brazil Bulgaria Chile Chinac Colombia Costa Rica Cuba Dominican Republic Ecuadorc Gabon Iran (Islamic Republic of ) Jamaica Jordanc Kazakhstan Latviad Lebanon Libyae Lithuania Malaysia Mauritius Mexico Papua New Guinea Namibia Panama Peru Romania Russian Federation Serbia South Africa Thailandc The former Yugoslav Republic of Macedonia Tunisiac Turkey Uruguay Venezuela (Bolivarian Republic of )
Angola Armenia Bolivia (Plurinational State of ) Cameroon Cape Verde Congo Côte d’Ivoire Djibouti Egypt El Salvador Georgia Ghanac Guatemala Guyana Honduras India Indonesia Iraq Lesotho Mauritaniac Morocco Nicaragua Nigeria Pakistan Paraguay Philippines Republic of Moldova Sao Tome and Prinicipe Senegal Sri Lanka Sudan Syrian Arab Repuplic Turkmenistan Ukraine Uzbekistan Viet Nam Yemen Zambiac
Bangladesh Benin Burkina Faso Burundi Central African Republic Chad Comoros Democratic Republic of the Congo Eritrea Ethiopia Gambia Guinea Guinea-Bissau Haiti Kenya Kyrgyzstan Liberia Madagascar Malawi Mali Mozambique Myanmar Nepal Niger Rwanda Sierra Leone Somalia Tajikistan Togo Uganda United Republic of Tanzania Zimbabwe
a Economies systematically monitored for the World Economic Situation and Prospects report and included in the b c d e
United Nations’ global economic forecast. Special Administrative Region of China. Indicates the country has been shifted upward by one category from previous year’s classification. Indicates the country has been shifted downward by one category from previous year’s classification. The name of the Libyan Arab Jamahiriya was officially changed to Libya on 16 September 2011.
137
138
World Economic Situation and Prospects 2012
Table F Least developed countries As of November 2011 Africa
East Asia
South Asia
Western Asia
Latin America and the Caribbean
Angola Benin Burkina Faso Burundi Central African Republic Chad Comoros Democratic Republic of the Congo Djibouti Equatorial Guinea Eritrea Ethiopia Gambia Guinea Guinea-Bissau Lesotho Liberia Madagascar Malawi Mali Mauritania Mozambique Niger Rwanda Sao Tome and Principe Senegal Sierra Leone Somalia Sudan Togo Uganda United Republic of Tanzania Zambia
Cambodiaa Kiribatia Lao People’s Democratic Republica Myanmar Samoaa,b Solomon Islandsa Timor Lestea Tuvalua Vanuatua
Afghanistana Bangladesh Bhutana Nepal
Yemen
Haiti
a Not included in the WESP discussion because of insufficient data. b Samoa will graduate from the list of the least developed countries in January 2014.
Country classification
Table G Heavily indebted poor countries As of November 2011 Post-completion point HIPCsa
Interim HIPCsb
Pre-decision point HIPCsc
Afghanistan Benin Bolivia Burkina Faso Burundi Cameroon Central African Republic Congo Democratic Republic of the Congo Ethiopia Ghana Guyana Gambia Haiti Honduras Liberia Madagascar Malawi Mali Mauritania Mozambique Nicaragua Niger Rwanda Sao Tome and Principe Senegal Sierra Leone Uganda United Republic of Tanzania Zambia
Chad Comoros Côte d’Ivoire Guinea Guinea-Bissau Togo
Eritrea Kyrgyzstand Somalia Sudan
a Countries that have qualified for irrevocable debt relief under the HIPC Initiative. b Countries that have qualified for assistance under the HIPC Initiative (that is to say, have reached decision
point), but have not yet reached completion point. Countries that are potentially eligible and may wish to avail themselves of the HIPC Initiative or the Multilateral Debt Relief Initiative (MDRI). d The Kyrgyz authorities indicated in early 2007 that they did not wish to avail themselves of debt relief under the HIPC Initiative, but subsequently expressed interest in the MDRI. Based on the latest available data, however, indebtedness indicators were estimated to be below the applicable HIPC Initiative thresholds, while income levels were estimated to be above the MDRI thresholds. c
139
140
World Economic Situation and Prospects 2012
Table H Small island developing States American Samoa Anguilla Antigua and Barbuda Aruba Bahamas Barbados Belize British Virgin Islands Cape Verde Commonwealth of Northern Marianas Comoros Cook Islands Cuba Dominica Dominican Republic Fiji French Polynesia Grenada Guam Guinea-Bissau Guyana Haiti Jamaica Kiribati Maldives Marshall Islands
Mauritius Micronesia (Federated States of ) Montserrat Nauru Netherlands Antilles New Caledonia Niue Palau Papua New Guinea Puerto Rico Samoa Sao Tome and Principe Seychelles Singapore Solomon Islands St. Kitts and Nevis St. Lucia St. Vincent and the Grenadines Suriname Timor-Leste Tonga Trinidad and Tobago Tuvalu U.S. Virgin Islands Vanuatu
Table I Landlocked developing countries Afghanistan Armenia Azerbaijan Bhutan Bolivia (Plurinational State of ) Botswana Burkina Faso Burundi Central African Republic Chad Ethiopia Kazakhstan Kyrgystan Lao People’s Democratic Republic Lesotho Malawi
Mali Republic of Moldova Mongolia Nepal Niger Paraguay Rwanda Swaziland Tajikistan The former Yugoslav Republic of Macedonia Turkmenistan Uganda Uzbekistan Zambia Zimbabwe
Annex tables
List of tables A. 1 A. 2 A. 3 A. 4 A. 5 A. 6 A. 7 A. 8 A. 9 A.10 A.11 A.12 A.13 A.14 A.15 A.16 A.17 A.18 A.19 A.20 A.21 A.22
Developed economies: rates of growth of real GDP, 2003-2013....................................................................................... 143 Economies in transition: rates of growth of real GDP, 2003-2013..................................................................................... 144 Developing economies: rates of growth of real GDP, 2003-2013..................................................................................... 145 Developed economies: consumer price inflation, 2003-2013........................................................................................... 147 Economies in transition: consumer price inflation, 2003-2013.......................................................................................... 148 Developing economies: consumer price inflation, 2003-2013.......................................................................................... 149 Developed economies: unemployment rates, 2003-2013................................................................................................... 151 Economies in transition and developing economies: unemployment rates, 2002-2011................................. 153 Major developed economies: quarterly indicators of growth, unemployment and inflation, 2009-2011..................................................................................................................................... 155 Selected economies in transition: quarterly indicators of growth and inflation, 2009-2011.......................... 156 Major developing economies: quarterly indicators of growth, unemployment and inflation, 2009-2011..................................................................................................................................... 157 Major developed economies: financial indicators, 2002-2011........................................................................................... 159 Selected economies: real effective exchange rates, broad measurement, 2002-2011....................................... 160 Indices of prices of primary commodities, 2002-2011............................................................................................................ 162 World oil supply and demand, 2003-2012...................................................................................................................................... 163 World trade: changes in value and volume of exports and imports, by major country group, 2003-2013................................................................................................................................................ 164 Balance of payments on current accounts, by country or country group, summary table, 2002-2010.................................................................................................... 166 Balance of payments on current accounts, by country or country group, 2002-2010....................................... 167 Net ODA from major sources, by type, 1990-2010.................................................................................................................... 170 Total net ODA flows from OECD Development Assistance Committee countries, by type, 2001-2010.............................................................................................................................................................. 171 Commitments and net flows of financial resources, by selected multilateral institutions, 2001-2010....................................................................................................................... 172 Greenhouse gas emissions of Annex 1 Parties to the United Nations Framework Convention on Climate Change, 1990-2013...................................................................................................... 173
143
Annex tables
Table A.1 Developed economies: rates of growth of real GDP, 2003-2013 Annual percentage change
Developed economies United States Canada Japan Australia New Zealand European Union EU-15 Austria Belgium Denmark Finland France Germany Greece Ireland Italy Luxembourg Netherlands Portugal Spain Sweden United Kingdom New EU member States Bulgaria Cyprus Czech Republic Estonia Hungary Latvia Lithuania Malta Poland Romania Slovakia Slovenia Other Europe Iceland Norway Switzerland Memorandum items North America Western Europe Asia and Oceania Major developed economies Euro area
"20032010a" 1.3 1.4 1.7 0.7 2.8 2.0 1.2 1.1 1.7 1.6 0.7 1.8 1.1 1.2 1.1 1.3 0.0 2.7 1.6 0.7 1.6 2.1 1.0 3.6 3.7 2.8 3.5 2.1 1.1 2.1 2.9 2.0 4.6 3.5 5.0 2.5 1.9 2.2 1.5 2.2
2003 1.9 2.6 1.9 1.4 4.2 3.9 1.4 1.2 0.9 0.8 0.4 2.0 0.9 -0.4 5.9 4.2 0.0 1.5 0.3 -0.9 3.1 2.3 3.5 4.3 5.5 1.9 3.8 7.8 3.9 7.6 10.3 0.1 3.9 5.2 4.8 2.9 0.4 2.4 1.0 -0.2
2004 3.0 3.5 3.1 2.7 3.0 3.6 2.5 2.4 2.6 3.3 2.3 4.1 2.5 1.2 4.4 4.5 1.5 4.4 2.2 1.6 3.3 4.2 3.0 5.6 6.7 4.2 4.7 6.3 4.8 8.9 7.4 -0.5 5.3 8.5 5.1 4.4 3.2 7.8 3.9 2.5
2005 2.4 3.1 3.0 1.9 3.1 3.2 1.9 1.8 2.4 1.7 2.4 2.9 1.8 0.7 2.3 5.3 0.7 5.4 2.0 0.8 3.6 3.2 2.1 4.8 6.4 3.9 6.8 8.9 4.0 10.1 7.8 3.7 3.6 4.2 6.7 4.0 2.7 7.2 2.7 2.6
2006 2.9 2.7 2.8 2.0 3.6 2.2 3.3 3.1 3.7 2.7 3.4 4.4 2.5 3.7 5.5 5.3 2.0 5.0 3.4 1.4 4.0 4.3 2.6 6.5 6.5 4.1 7.0 10.1 3.9 11.2 7.8 2.2 6.2 7.9 8.3 5.8 3.1 4.7 2.3 3.6
2007 2.6 1.9 2.2 2.4 3.8 2.9 3.2 3.0 3.7 2.9 1.6 5.4 2.3 3.3 3.0 5.2 1.5 6.6 3.9 2.4 3.6 3.3 3.5 6.0 6.4 5.1 5.7 7.5 0.1 9.6 9.8 4.3 6.8 6.3 10.5 6.9 3.4 6.0 3.1 3.6
2008 -0.1 -0.4 0.7 -1.2 1.4 -1.1 0.3 0.0 1.4 1.0 -1.1 1.0 -0.1 1.1 -0.2 -3.0 -1.3 0.8 1.8 0.0 0.9 -0.6 -1.1 4.1 6.2 3.6 3.1 -3.7 0.9 -3.3 2.9 4.4 5.1 7.3 5.9 3.6 1.3 1.3 0.3 2.1
2009 -4.0 -3.5 -2.8 -6.3 2.3 0.8 -4.3 -4.3 -3.8 -2.8 -5.2 -8.2 -2.7 -5.1 -3.3 -7.0 -5.2 -5.3 -3.5 -2.5 -3.7 -5.3 -4.4 -3.7 -5.5 -1.9 -4.7 -14.3 -6.8 -17.7 -14.8 -2.7 1.6 -6.6 -4.9 -8.0 -1.9 -6.7 -1.7 -1.9
2010 2.7 3.0 3.2 4.0 2.5 2.3 2.0 1.9 2.3 2.3 1.7 3.6 1.5 3.7 -3.5 -0.4 1.3 2.7 1.7 1.4 -0.1 5.7 1.8 2.3 0.2 1.1 2.7 2.3 1.3 -0.3 1.4 2.7 3.9 -1.9 4.2 1.4 1.5 -4.0 0.3 2.7
2011b 1.3 1.7 2.1 -0.5 0.5 1.4 1.6 1.5 3.0 2.0 0.8 3.8 1.6 2.9 -7.5 1.5 0.6 3.4 1.5 -1.7 0.7 4.3 0.9 2.9 1.8 0.5 2.1 6.4 1.4 3.9 5.6 2.2 4.0 1.5 3.0 2.0 1.0 1.2 1.6 0.5
2012c 1.3 1.5 1.7 2.0 2.8 2.5 0.7 0.5 1.3 1.1 0.2 2.6 0.3 1.0 -5.7 0.0 -0.3 1.0 1.0 -3.4 0.3 1.9 1.1 2.6 2.5 0.5 2.0 2.5 1.5 2.6 2.7 1.3 3.6 2.1 2.1 2.0 1.1 1.1 2.9 -0.3
2013c 1.9 2.0 2.3 2.0 2.6 3.0 1.7 1.6 2.2 1.6 1.2 2.4 1.4 1.4 0.0 0.8 1.0 3.0 1.2 -1.5 1.1 3.4 2.6 3.1 3.8 1.0 2.7 3.2 1.6 3.2 3.6 2.5 3.8 3.0 2.5 2.2 1.6 2.0 2.6 0.8
1.5 1.3 1.1 1.2 1.1
2.5 1.4 1.8 1.8 0.8
3.5 2.6 2.8 2.9 2.2
3.1 2.0 2.1 2.3 1.7
2.7 3.3 2.2 2.6 3.2
1.9 3.2 2.6 2.3 3.0
-0.3 0.3 -0.8 -0.4 0.4
-3.4 -4.2 -4.9 -4.2 -4.3
3.0 1.9 3.7 2.9 1.9
1.7 1.6 -0.3 1.3 1.5
1.5 0.7 2.1 1.3 0.4
2.0 1.7 2.1 1.9 1.3
Source: UN/DESA, based on data of the United Nations Statistics Division and individual national sources. Note: Country groups are calculated as a weighted average of individual country growth rates of gross domestic product (GDP), where weights are based on GDP in 2005 prices and exchange rates. a Average percentage change. b Partly estimated. c Baseline scenario forecasts, based in part on Project LINK and the UN/DESA World Economic Forecasting Model.
144
World Economic Situation and Prospects 2012
Table A.2 Economies in transition: rates of growth of real GDP, 2003-2013 Annual percentage change 20032010a
2003
2004
2005
2006
2007
2008
2009
2010
2011b
2012c
2013c
Economies in transition
4.7
7.3
7.7
6.5
8.4
8.6
5.1
-6.6
4.1
4.1
3.9
4.1
South-Eastern Europe
3.2
4.3
5.6
4.7
5.2
6.0
4.2
-3.7
0.6
1.7
2.3
3.2
5.3 3.7 1.8 4.4 4.3
5.7 3.9 5.4 2.5 2.4
5.7 6.3 4.1 4.4 8.3
5.8 3.9 4.3 4.2 5.6
5.4 6.0 4.9 8.6 5.2
5.9 6.2 5.1 10.7 6.9
7.7 5.7 2.2 6.9 5.5
3.3 -2.9 -6.0 -5.7 -3.1
3.5 0.8 -1.2 2.5 1.8
3.0 2.1 0.8 2.3 2.2
3.0 2.0 2.0 2.5 2.5
3.9 2.3 3.0 3.8 3.6
3.7
2.8
4.6
4.4
5.0
6.1
5.0
-0.9
1.8
3.0
3.0
3.4
4.9
7.6
7.9
6.7
8.7
8.8
5.2
-6.9
4.5
4.3
4.0
4.2
4.9 16.9 7.1 4.4 10.0 8.2 4.5 6.2 8.1 5.9 4.0 4.4 7.1 2.8
7.4 11.2 9.3 7.3 3.3 4.4 9.1 14.0 7.0 11.1 7.0 6.6 11.1 9.6
7.4 10.2 9.6 7.2 5.0 7.7 11.4 10.5 11.4 5.9 7.0 7.4 10.3 12.1
6.9 26.4 9.7 6.4 13.0 7.0 4.9 13.9 9.4 9.6 -0.2 7.5 6.7 2.7
8.8 34.5 10.6 8.2 11.0 7.3 8.1 13.2 10.0 9.4 3.1 4.8 6.6 7.3
8.9 25.1 8.7 8.5 11.1 9.5 8.4 13.7 8.6 12.3 8.5 3.0 7.8 7.9
5.3 10.8 3.3 5.2 14.7 9.0 4.6 6.9 10.2 2.3 8.4 7.8 7.6 2.3
-6.4 9.3 1.2 -7.8 6.1 8.1 -9.8 -14.1 0.2 -3.8 2.9 -6.0 4.0 -14.8
4.4 5.0 7.0 4.0 9.2 8.5 5.1 2.1 7.6 6.4 -1.4 6.9 6.5 4.2
4.2 0.9 6.5 4.0 9.7 7.3 4.7 4.3 4.8 5.5 6.0 5.5 6.0 4.4
4.1 4.0 5.8 3.9 7.0 7.0 3.2 4.1 1.0 5.0 5.4 3.9 5.7 3.8
4.2 3.9 5.9 4.0 7.0 7.0 4.2 4.4 3.5 4.7 5.0 4.3 6.0 4.3
Albania Bosnia and Herzegovina Croatia Montenegro Serbia The former Yugoslav Republic of Macedonia Commonwealth of Independent States and Georgia d Net fuel exporters Azerbaijan Kazakhstan Russian Federation Turkmenistan Uzbekistan Net fuel importers Armenia Belarus Georgia d Kyrgyzstan Republic of Moldova Tajikistan Ukraine
Source: UN/DESA, based on data of the United Nations Statistics Division and individual national sources. Note: Country groups are calculated as a weighted average of individual country growth rates of gross domestic product (GDP), where weights are based on GDP in 2005 prices and exchange rates. a b c d
Average percentage change. Partly estimated. Baseline scenario forecasts, based in part on Project LINK and the UN/DESA World Economic Forecasting Model. Georgia officially left the Commonwealth of Independent States on 18 August 2009. However, its performance is discussed in the context of this group of countries for reasons of geographic proximity and similarities in economic structure.
145
Annex tables
Table A.3 Developing economies: rates of growth of real GDP, 2003-2013 Annual percentage change
Developing countriesd Africa North Africa Sub-Saharan Africa (excluding Nigeria and South Africa) Net fuel exporters Net fuel importers East and South Asia East Asia South Asia Net fuel exporters Net fuel importers Western Asia Net fuel exporters Net fuel importers Latin America and the Caribbean South America Mexico and Central America Caribbean Net fuel exporters Net fuel importers
20032010a
2003
2004
2005
2006
2007
2008
2009
2010
2011b
2012c
2013c
6.4
5.2
7.4
6.8
7.6
7.9
5.3
2.4
7.5
6.0
5.6
5.9
4.9 4.5
5.1 6.3
8.0 4.7
5.3 5.1
6.0 5.4
5.8 4.7
4.6 4.6
0.8 3.2
3.9 4.0
2.7 -0.5
5.0 4.7
5.1 5.5
5.2 5.4 4.5 7.9 8.0 7.4 5.0 8.1 5.0 5.2 4.8 4.2 5.1 2.5 5.2 5.4 4.0
4.7 6.5 3.9 7.0 6.8 7.7 6.1 7.1 5.5 7.0 4.2 1.8 1.8 1.6 3.4 -0.5 2.1
6.5 11.3 5.2 7.8 7.9 7.5 5.2 8.1 8.3 8.5 8.2 5.8 7.0 4.1 3.8 10.6 5.2
5.4 5.6 5.2 8.1 8.1 8.2 5.7 8.3 6.7 6.1 7.3 4.6 5.0 3.5 8.2 7.1 4.1
6.4 6.0 6.0 9.0 9.2 8.5 6.0 9.4 6.5 6.7 6.3 5.6 5.5 5.2 10.3 8.1 5.1
6.6 6.2 5.5 9.9 10.2 8.8 7.7 10.2 4.6 4.1 5.0 5.6 6.7 3.8 6.5 7.0 5.4
5.3 4.7 4.7 6.2 6.4 5.8 3.5 6.5 3.8 5.8 2.0 4.0 5.4 1.5 3.6 4.2 3.9
1.7 0.4 1.1 5.2 5.1 5.5 2.9 5.4 -0.9 0.7 -2.5 -2.1 -0.4 -5.7 0.9 -0.8 -2.4
4.8 3.8 4.0 8.8 9.2 7.2 4.4 9.2 6.3 4.9 7.7 6.0 6.4 5.6 3.5 1.7 6.8
4.6 1.4 3.9 7.1 7.2 6.5 5.0 7.3 6.6 7.3 5.9 4.3 4.6 3.8 3.4 4.0 4.4
5.3 5.6 4.5 6.8 6.9 6.7 5.1 7.0 3.7 4.4 3.1 3.3 3.6 2.7 3.6 3.2 3.3
5.0 5.9 4.5 6.9 6.9 6.9 5.2 7.1 4.3 3.9 4.7 4.2 4.5 3.6 4.3 3.9 4.2
7.1
5.1
7.7
7.6
7.5
8.4
7.5
5.2
5.6
4.9
6.0
5.7
6.0 4.7 4.7
3.9 4.0 6.4
6.6 5.9 6.0
6.4 5.0 6.2
6.4 5.7 6.2
7.6 6.1 7.0
6.5 2.7 2.2
3.6 0.1 2.2
5.1 7.7 3.2
4.8 4.5 3.7
5.8 4.3 4.1
5.3 4.6 4.3
5.3 7.1 5.7
6.5 5.7 4.0
8.3 7.7 6.0
6.0 8.2 7.2
6.4 9.1 8.6
4.3 8.7 7.5
5.8 6.3 2.9
1.2 3.1 0.2
5.0 6.7 8.1
6.5 5.5 4.0
4.3 5.6 3.6
3.8 5.6 4.2
7.4 4.4 4.0 11.1 4.7 5.6 5.0 8.6 5.6 3.8 4.3
8.8 1.1 3.9 10.0 3.9 3.1 3.0 8.4 4.8 7.9 1.5
9.0 5.7 6.0 10.1 5.3 4.1 8.5 8.3 5.0 5.1 4.8
9.2 3.2 5.6 11.3 4.7 4.5 7.1 9.3 5.7 5.3 4.9
8.5 4.0 4.6 12.7 6.7 6.8 7.0 9.6 5.5 6.1 5.6
8.7 6.1 4.6 14.2 6.9 7.1 6.4 9.7 7.4 8.3 5.5
6.8 5.2 3.7 9.6 3.5 7.2 2.3 7.5 4.9 1.0 4.0
0.9 -0.6 -1.7 9.2 1.5 4.7 -2.7 7.0 4.6 0.1 0.8
9.2 7.5 5.2 10.4 4.3 5.1 7.0 9.0 6.1 1.0 4.8
7.6 3.7 6.4 9.3 4.4 1.3 4.9 7.6 6.5 2.6 4.3
7.2 2.7 3.4 8.7 4.0 3.8 4.1 7.7 6.3 3.0 2.5
7.2 3.8 6.0 8.5 3.8 5.5 4.5 7.9 6.4 3.1 2.9
Memorandum items Least developed countries Sub-Saharan Africa (excluding Nigeria and South Africa) East Asia (excluding China) South Asia (excluding India) Western Asia (excluding Israel and Turkey) Landlocked developing economies Small island developing economies Major developing economies Argentina Brazil Chile China Colombia Egypt Hong Kong SARe India Indonesia Iran, Islamic Republic of Israel
146
World Economic Situation and Prospects 2012
Table A.3 (cont’d)
Korea, Republic of Malaysia Mexico Nigeria Pakistan Peru Philippines Saudi Arabia Singapore South Africa Taiwan Province of China Thailand Turkey Venezuela, Bolivarian Republic of
20032010a
2003
2004
2005
2006
2007
2008
2009
2010
2011b
2012c
2013c
3.9 4.9 2.3 6.0 5.2 6.8 5.2 3.5 6.9 3.7 4.5 4.1 4.8 6.5
2.8 5.8 1.4 10.4 4.8 4.0 5.0 7.7 4.6 2.9 3.7 7.1 5.3 -7.8
4.6 6.8 4.1 33.7 7.4 5.0 6.7 5.3 9.2 4.6 6.2 6.3 9.4 18.3
4.0 5.3 3.3 3.4 7.7 6.8 4.8 5.6 7.4 5.3 4.7 4.6 8.4 10.3
5.2 5.8 5.1 7.5 6.2 7.7 5.2 3.2 8.7 5.6 5.4 5.1 6.9 9.9
5.1 6.5 3.4 5.1 5.7 8.9 6.6 2.0 8.8 5.6 6.0 5.0 4.7 8.8
2.3 4.8 1.2 2.3 1.6 9.8 4.2 4.2 1.5 3.6 0.7 2.5 0.7 4.2
0.3 -1.6 -6.3 -8.3 3.6 0.9 1.1 0.2 -0.8 -1.7 -1.9 -2.3 -4.8 -3.3
6.2 7.2 5.8 2.8 4.1 8.8 7.6 3.8 14.5 2.8 10.9 7.8 9.0 -1.4
3.9 4.6 3.8 6.3 3.3 5.9 4.3 6.8 5.0 3.1 4.4 2.3 7.5 3.5
3.6 4.4 2.5 6.8 4.1 5.2 4.4 3.9 4.0 3.7 3.9 4.1 3.2 2.0
4.0 5.0 3.6 7.0 4.4 4.7 4.9 3.5 4.5 3.5 4.3 4.2 5.4 3.9
Source: UN/DESA, based on data of the United Nations Statistics Division and individual national sources. Note: Country groups are calculated as a weighted average of individual country growth rates of gross domestic product (GDP), where weights are based on GDP in 2005 prices and exchange rates. a b c d e
Average percentage change. Partly estimated. Baseline scenario forecasts, based in part on Project LINK and the UN/DESA World Economic Forecasting Model. Covering countries that account for 98 per cent of the population of all developing countries. Special Administrative Region of China.
147
Annex tables
Table A.4 Developed economies: consumer price inflation, 2003-2013 Annual percentage changea 2011b 2012c
2013c
2003
2004
2005
2006
2007
2008
2009
2010
1.9
2.0
2.3
2.3
2.2
3.3
0.1
1.4
2.6
1.8
1.7
United States Canada Japan Australia New Zealand
2.3 2.8 -0.2 2.8 1.8
2.7 1.9 0.0 2.3 2.3
3.4 2.2 -0.3 2.7 3.0
3.2 2.0 0.2 3.5 3.4
2.9 2.1 0.1 2.3 2.4
3.8 2.4 1.4 4.4 4.0
-0.3 0.3 -1.4 1.7 2.0
1.6 1.8 -0.8 1.9 2.3
3.0 2.9 0.8 2.8 4.4
2.1 2.0 0.5 3.8 3.0
1.9 1.8 0.3 4.8 2.3
European Union
2.1
2.1
2.2
2.2
2.2
3.5
0.8
1.9
2.9
2.0
1.8
2.0 1.3 1.5 2.0 1.3 2.2 1.0 3.4 4.0 2.8 2.5 2.2 3.3 3.1 2.3 1.4 3.7 2.2 4.1 0.1 1.3 4.6 3.0 -1.1 1.3 0.8 15.3 8.6 5.6
1.9 2.0 1.9 0.9 0.1 2.3 1.8 3.0 2.3 2.3 3.2 1.4 2.5 3.1 1.0 1.3 5.1 6.3 2.3 2.8 3.0 6.8 6.2 1.1 2.8 3.6 11.9 7.5 3.6
2.1 2.1 2.5 1.7 0.8 1.9 1.9 3.5 2.2 2.2 2.5 1.5 2.1 3.4 0.8 2.1 3.4 5.0 2.6 1.9 4.1 3.5 6.7 2.7 3.0 2.2 8.9 2.7 2.5
2.2 1.7 2.3 1.8 1.3 1.9 1.8 3.3 2.7 2.2 2.7 1.7 3.0 3.6 1.5 2.3 3.2 7.3 2.5 2.5 4.4 3.9 6.5 3.7 2.8 1.3 6.6 4.5 2.5
2.1 2.2 1.8 1.7 1.6 1.6 2.3 3.0 2.9 2.0 2.3 1.6 2.4 2.8 1.7 2.3 4.1 8.4 2.3 3.0 6.6 8.0 10.1 5.8 1.3 2.4 4.8 2.8 3.6
3.3 3.2 4.5 3.6 3.9 3.2 2.8 4.2 3.1 3.5 3.4 2.2 2.7 4.1 3.4 3.6 6.1 12.3 4.7 6.3 10.4 6.1 15.4 10.9 4.3 4.2 7.9 4.6 5.7
0.7 0.4 0.0 1.1 1.6 0.1 0.2 1.4 -1.7 0.8 0.4 1.0 -0.9 -0.2 1.9 2.2 3.2 2.8 0.4 1.0 -0.1 4.2 3.6 4.4 2.1 3.8 5.6 1.6 0.9
1.9 1.7 2.3 2.2 1.7 1.7 1.1 4.7 -1.6 1.6 2.3 0.9 1.4 2.0 1.9 3.3 2.9 3.0 2.4 1.5 3.0 4.7 -1.2 1.3 1.5 2.7 6.1 0.7 1.8
2.9 3.2 3.3 2.8 3.4 2.2 2.3 2.9 1.2 2.7 3.4 2.3 3.2 3.1 1.4 4.6 3.8 4.0 3.5 1.9 5.0 3.8 4.5 4.5 2.8 3.9 6.0 4.0 2.4
1.9 2.1 2.3 2.1 2.1 1.7 1.8 1.3 1.3 1.7 2.6 2.0 1.0 1.8 1.1 2.5 3.3 4.0 2.9 2.6 3.5 5.0 3.0 3.0 2.3 2.9 4.3 2.4 2.8
1.7 1.8 2.5 2.2 2.1 1.8 1.7 0.7 1.0 1.6 2.0 1.6 1.2 1.9 2.1 1.7 2.9 2.5 2.7 2.3 3.0 3.5 2.5 2.5 2.7 3.0 3.6 2.6 2.5
Other Europe
1.2
0.8
1.4
1.8
0.8
3.1
1.0
1.5
0.9
0.2
0.8
Iceland Norway Switzerland
2.1 1.9 0.6
3.2 0.6 0.8
4.0 1.5 1.2
6.7 2.5 1.1
5.1 0.7 0.7
12.7 3.4 2.4
12.0 2.3 -0.5
5.4 2.3 0.7
4.0 1.4 0.3
4.0 0.9 -0.6
4.0 1.6 0.1
1.7 2.1
1.9 2.2
2.3 2.2
2.3 2.2
2.1 2.1
3.1 3.3
-0.1 0.3
1.3 1.6
2.6 2.5
1.8 1.8
1.6 1.7
Developed economies
EU-15 Austria Belgium Denmark Finland France Germany Greece Ireland Italy Luxembourg Netherlands Portugal Spain Sweden United Kingdom New EU member States Bulgaria Cyprus Czech Republic Estonia Hungary Latvia Lithuania Malta Poland Romania Slovakia Slovenia
Memorandum items Major developed economies Euro area
Source: UN/DESA, based on OECD, Main Economic Indicators; Eurostat; and individual national sources. a Data for country groups are weighted averages, where weights for each year are based on 2005 GDP in United States dollars. b Partly estimated. c Baseline scenario forecasts, based in part on Project LINK and the UN/DESA World Economic Forecasting Model.
148
World Economic Situation and Prospects 2012
Table A.5 Economies in transition: consumer price inflation, 2003-2013 Annual percentage changea
Economies in transition South-Eastern Europe Albania Bosnia and Herzegovina Croatia Montenegro Serbia The former Yugoslav Republic of Macedonia Commonwealth of Independent States and Georgiad Net fuel exporters Azerbaijan Kazakhstan Russian Federation Turkmenistan Uzbekistan Net fuel importers Armenia Belarus Georgiad Kyrgyzstan Republic of Moldova Tajikistan Ukraine
2011b
2012c
2013c
6.7
9.2
7.5
6.6
3.5 2.3 -0.3 2.4 3.8 8.1
2.8 3.6 2.1 1.1 0.5 6.3
5.0 3.8 4.0 2.3 3.5 11.0
3.4 3.6 3.0 2.7 3.0 5.0
3.3 3.2 3.0 2.8 3.0 4.5
7.2
-0.3
1.6
4.2
3.0
3.0
15.2 14.2 20.8 17.1 14.0 14.5 7.8 21.2 8.9 14.9 9.9 24.5 12.8 20.9 25.2
11.3 11.0 1.4 7.3 11.6 -2.7 7.4 13.4 3.4 12.9 1.8 6.9 -0.1 6.4 15.9
7.1 6.9 5.6 7.1 6.9 4.5 7.3 8.7 8.2 7.7 7.1 8.0 7.4 6.5 9.4
9.6 8.7 8.0 8.5 8.7 6.5 11.0 15.7 8.2 38.0 6.0 19.5 7.8 13.0 9.2
7.8 7.1 6.0 8.5 6.9 8.0 10.0 12.9 5.5 30.0 6.0 9.5 5.0 9.0 8.3
6.9 6.7 6.0 6.0 6.7 8.0 10.0 8.2 4.0 10.0 7.0 8.0 6.0 6.0 8.0
2003
2004
2005
2006
2007
2008
2009
2010
11.7
9.9
11.7
9.1
9.0
14.5
10.6
3.7 0.5 0.5 1.8 6.7 9.9
4.1 2.3 0.3 2.0 2.1 11.0
6.4 2.4 3.6 3.3 2.7 16.3
5.7 2.4 6.1 3.2 3.0 11.8
3.6 2.9 1.5 2.9 4.3 6.1
7.8 3.3 7.4 6.0 9.0 12.4
1.1
0.9
-0.7
3.3
2.8
12.5 12.8 2.2 6.4 13.7 5.6 3.8 10.6 4.7 28.4 4.8 3.0 11.7 16.3 5.2
10.4 10.4 6.7 6.9 10.9 5.9 3.7 10.8 7.0 18.1 5.7 4.1 12.5 7.1 9.0
12.2 12.2 9.5 7.5 12.7 10.7 7.8 11.8 0.6 10.4 8.2 4.4 12.0 7.2 13.5
9.4 9.5 8.2 8.6 9.7 8.2 6.8 8.4 2.9 7.0 9.2 5.6 12.8 10.0 9.1
9.5 9.2 16.6 10.8 9.0 6.3 6.8 11.3 4.4 8.2 9.2 10.1 12.3 13.4 12.8
Source: UN/DESA, based on data of the Economic Commission for Europe. a Data for country groups are weighted averages, where weights for each year are based on 2005 GDP in United States dollars. b Partly estimated. c Baseline scenario forecasts, based in part on Project LINK and the UN/DESA World Economic Forecasting Model. d Georgia officially left the Commonwealth of Independent States on 18 August 2009. However, its performance is discussed in the context of this group of countries for reasons of geographic proximity and similarities in economic structure.
149
Annex tables
Table A.6 Developing economies: consumer price inflation, 2003-2013 Annual percentage changea
Developing countries by region Africa North Africa Sub-Saharan Africa (excluding Nigeria and South Africa) Net fuel exporters Net fuel importers East and South Asia East Asia South Asia Net fuel exporters Net fuel importers Western Asia Net fuel exporters Net fuel importers Latin America and the Caribbean South America Mexico and Central America Caribbean Net fuel exporters Net fuel importers
2003
2004
2005
2006
2007
2008
2009
2010
2011b
2012c
2013c
6.1
5.1
4.7
4.5
5.2
8.2
4.3
5.5
6.6
5.5
4.9
7.9 2.2
6.1 4.6
6.2 2.6
5.5 4.1
6.0 5.2
10.8 9.2
7.3 5.9
6.8 6.7
7.8 7.1
6.6 5.7
6.1 5.3
13.8 10.9 6.2 2.7 1.8 5.9 9.8 2.0 11.1 0.8 18.8 10.6 13.7 4.6 18.4 16.8 9.6
8.4 8.4 3.4 4.1 3.5 6.2 9.4 3.6 5.1 1.1 8.1 6.9 7.0 4.9 29.8 12.0 6.1
9.3 8.7 4.5 3.7 2.9 6.5 11.2 2.9 5.6 2.1 8.2 6.2 7.1 4.4 7.4 9.4 5.7
8.1 5.3 5.3 3.7 2.7 7.1 11.9 2.8 6.4 3.2 8.8 5.1 5.7 3.9 8.2 8.2 4.6
7.1 4.9 6.3 4.9 3.9 8.5 10.5 4.3 6.2 5.3 6.8 5.3 5.8 4.2 7.2 10.8 4.4
13.1 9.0 10.8 7.5 6.0 12.7 17.0 6.5 10.1 10.4 9.8 7.8 8.8 5.7 13.0 17.6 6.3
7.4 6.9 6.8 2.9 0.6 11.2 7.9 2.4 4.8 3.9 5.4 6.1 6.7 5.1 4.3 14.5 4.8
6.5 8.6 4.6 5.0 3.2 11.6 7.3 4.8 6.0 4.3 7.2 6.1 7.1 4.1 8.2 13.8 4.9
10.0 8.4 6.4 6.2 5.1 10.3 10.9 5.7 6.3 5.2 7.1 7.1 8.4 4.5 10.3 12.6 6.2
7.2 7.0 5.4 5.0 3.9 9.1 9.3 4.6 5.2 4.3 5.8 6.2 7.2 4.4 7.4 11.5 5.4
6.6 6.7 5.1 4.4 3.4 8.0 8.0 4.0 4.6 3.8 5.2 5.6 6.3 4.3 5.8 9.6 4.9
15.1 2.5 9.9
9.8 3.2 11.0
10.1 3.9 11.0
8.9 3.9 9.8
9.4 3.1 12.8
13.6 6.1 21.3
7.0 1.8 11.9
8.4 3.0 10.8
11.1 4.5 13.9
8.7 3.6 11.8
7.7 3.2 10.3
1.4
1.7
2.7
3.9
5.3
11.0
3.8
4.5
5.3
4.5
4.0
13.4 14.7 2.8 1.2 7.1 4.5 -2.5 3.8 6.6 16.5 0.7 3.5 1.0 4.5 14.0
4.4 6.6 1.1 3.9 5.9 11.3 -0.4 3.8 6.2 14.8 -0.4 3.6 1.5 4.7 15.0
9.6 6.8 3.1 1.8 5.0 4.9 0.9 4.2 10.5 13.4 1.3 2.8 3.0 4.0 17.9
10.9 4.2 3.4 1.5 4.3 7.6 2.1 5.8 13.1 11.9 2.1 2.2 3.6 3.6 8.2
8.8 3.6 4.4 4.7 5.5 9.3 2.0 6.4 6.5 17.2 0.5 2.5 2.0 4.0 5.4
8.6 5.7 8.7 5.9 7.0 18.3 4.3 8.4 10.2 25.6 4.6 4.7 5.4 5.1 11.6
6.3 4.9 0.4 -0.7 4.2 11.8 0.6 10.9 4.4 13.5 3.3 2.8 0.6 5.3 11.5
10.8 5.0 1.4 3.3 2.3 11.1 2.3 12.0 5.1 10.1 2.7 2.9 1.7 4.2 13.5
11.0 7.3 3.2 5.7 3.5 13.3 5.2 8.5 5.4 17.0 3.6 4.6 3.1 4.3 10.8
11.0 5.6 3.0 4.2 3.5 11.0 3.8 7.7 5.0 14.5 1.2 3.5 2.7 4.3 10.1
10.5 4.6 4.0 3.6 4.2 9.1 3.3 6.9 4.8 12.5 2.1 3.0 2.5 4.3 10.1
Memorandum items Least developed countries East Asia (excluding China) South Asia (excluding India) Western Asia (excluding Israel and Turkey) Major developing economies Argentina Brazil Chile China Colombia Egypt Hong Kong SARd India Indonesia Iran, Islamic Republic of Israel Korea, Republic of Malaysia Mexico Nigeria
150
World Economic Situation and Prospects 2012
Table A.6 (cont’d) Pakistan Peru Philippines Saudi Arabia Singapore South Africa Taiwan Province of China Thailand Turkey Venezuela, Bolivarian Republic of
2003
2004
2005
2006
2007
2008
2009
2010
2011b
2012c
2013c
2.9 2.3 3.5 0.6 0.5 5.9 -0.3 1.8 25.3 31.1
7.4 3.7 6.0 0.3 1.7 1.4 1.6 2.8 10.6 21.7
9.1 1.6 7.6 0.7 0.4 2.0 2.3 4.5 10.1 16.0
7.9 2.0 6.2 2.2 1.0 3.2 0.6 4.6 10.5 13.7
7.6 1.8 2.8 4.2 2.1 6.2 1.8 2.3 8.8 18.7
20.3 5.8 9.3 9.9 6.5 10.1 3.5 5.4 10.4 31.4
13.7 2.9 3.2 5.1 0.6 7.2 -0.9 -0.9 6.3 28.6
13.9 1.5 3.8 5.3 2.8 4.1 1.0 3.3 8.6 29.1
12.2 3.2 4.7 5.5 5.1 5.0 1.5 3.9 8.2 25.0
10.1 2.5 4.2 4.4 3.0 5.3 1.4 3.5 7.0 22.5
9.0 3.0 4.0 3.9 2.3 4.8 1.4 3.3 6.0 17.5
Source: UN/DESA, based on IMF, International Financial Statistics. a Data for country groups are weighted averages, where weights are based on GDP in 2005 prices and exchange rates. b Partly estimated. c Baseline scenario forecasts, based in part on Project LINK and the UN/DESA World Economic Forecasting Model. d Special Administrative Region of China.
151
Annex tables
Table A.7 Developed economies: unemployment rates, a, b 2003-2013 Percentage of labour force 2003
2004
2005
2006
2007
2008
2009
2010
2011c
2012d
2013d
Developed economies
7.4
7.2
6.9
6.3
5.8
6.1
8.4
8.8
8.6
8.5
8.3
United States Canada Japan Australia New Zealand
6.0 7.6 5.3 5.9 4.8
5.5 7.2 4.7 5.4 4.1
5.1 6.8 4.4 5.0 3.8
4.6 6.3 4.1 4.8 3.9
4.6 6.0 3.9 4.4 3.7
5.8 6.1 4.0 4.2 4.2
9.3 8.3 5.1 5.6 6.1
9.6 8.0 5.1 5.2 6.5
9.1 7.6 5.0 5.6 6.1
9.2 7.4 4.1 5.7 5.5
9.1 7.1 4.1 5.7 5.6
European Union
9.1
9.2
9.0
8.2
7.3
7.1
9.0
9.8
9.6
9.6
9.3
8.1 4.3 8.2 5.4 9.1 9.0 9.8 9.7 4.6 8.5 3.8 4.1 7.1 11.1 6.6 5.0 12.9 13.7 4.1 7.8 10.0 5.9 10.5 12.5 7.7 19.7 6.8 17.6 6.7
8.3 4.9 8.4 5.5 8.9 9.2 10.5 10.5 4.5 8.0 5.0 5.1 7.5 10.6 7.4 4.7 12.8 12.1 4.6 8.3 9.7 6.1 10.4 11.4 7.2 19.0 8.0 18.2 6.3
8.3 5.2 8.5 4.8 8.3 9.3 11.2 9.9 4.4 7.7 4.6 5.3 8.6 9.2 7.7 4.8 11.9 10.1 5.3 7.9 7.9 7.2 8.9 8.3 7.3 17.8 7.2 16.2 6.5
7.8 4.7 8.3 3.9 7.7 9.2 10.1 8.9 4.5 6.8 4.6 4.3 8.6 8.5 7.1 5.4 10.0 9.0 4.6 7.2 5.9 7.4 6.8 5.6 6.9 13.9 7.3 13.4 6.0
7.2 4.4 7.5 3.8 6.9 8.4 8.8 8.3 4.6 6.1 4.2 3.6 8.9 8.3 6.1 5.3 7.6 6.9 3.9 5.3 4.7 7.4 6.0 4.3 6.5 9.6 6.4 11.1 4.9
7.2 3.8 7.0 3.4 6.4 7.8 7.6 7.7 6.3 6.8 4.9 3.1 8.5 11.4 6.2 5.6 6.5 5.6 3.7 4.4 5.5 7.8 7.5 5.8 6.0 7.1 5.8 9.5 4.4
9.1 4.8 7.9 6.1 8.2 9.5 7.7 9.5 11.9 7.8 5.1 3.7 10.6 18.0 8.3 7.6 8.4 6.8 5.3 6.7 13.8 10.0 17.1 13.7 6.9 8.2 6.9 12.0 5.9
9.6 4.4 8.3 7.4 8.4 9.8 7.1 12.6 13.7 8.4 4.6 4.5 12.0 20.1 8.4 7.8 10.6 10.2 6.2 6.0 16.9 11.2 18.7 17.8 6.9 12.1 7.3 14.4 7.3
9.5 4.1 7.3 7.5 7.9 9.8 6.2 14.8 14.3 8.1 4.7 4.2 12.5 20.8 7.5 8.0 10.2 11.8 7.2 6.8 12.6 11.0 16.0 15.4 7.0 11.3 7.3 13.4 8.0
9.6 4.3 8.2 7.3 7.4 9.9 6.0 17.4 14.5 8.5 5.0 4.2 13.4 20.5 7.5 8.5 9.6 11.4 7.3 6.6 10.9 10.5 15.0 13.6 6.6 10.1 7.0 13.8 8.0
9.4 4.2 7.7 7.1 7.0 9.6 6.0 17.6 14.9 8.3 4.8 4.0 14.0 19.9 7.3 8.1 9.0 10.8 7.0 6.2 9.1 9.0 13.8 11.5 6.7 9.8 6.5 13.6 7.5
EU-15 Austria Belgium Denmark Finland France Germany Greece Ireland Italy Luxembourg Netherlands Portugal Spain Sweden United Kingdom New EU member States Bulgaria Cyprus Czech Republic Estonia Hungary Latvia Lithuania Malta Poland Romania Slovakia Slovenia
152
World Economic Situation and Prospects 2012
Table A.7 (cont’d) 2003
2004
2005
2006
2007
2008
2009
2010
2011c
2012d
2013d
Other Europe
4.0
4.1
4.3
3.6
3.1
2.9
3.8
4.0
4.2
4.4
4.8
Icelande Norway Switzerland
3.4 4.2 3.9
3.1 4.3 4.1
2.6 4.5 4.2
2.9 3.4 3.8
2.3 2.5 3.4
3.0 2.5 3.2
7.2 3.1 4.1
8.1 3.5 4.2
7.5 3.4 4.6
7.6 3.4 4.9
7.5 3.3 5.6
6.7 9.0
6.4 9.2
6.3 9.2
5.8 8.4
5.5 7.6
5.9 7.7
8.1 9.5
8.3 10.1
8.1 9.9
8.2 10.0
8.2 9.8
Memorandum items Major developed economies Euro area
Source: UN/DESA, based on data of the OECD and Eurostat. a Unemployment data are standardized by the OECD and Eurostat for comparability among countries and over time, in conformity with the definitions of the International Labour Organization (see OECD, Standardized Unemployment Rates: Sources and Methods (Paris, 1985)). b Data for country groups are weighted averages, where labour force is used for weights. c Partly estimated. d Baseline scenario forecasts, based in part on Project LINK and the UN/DESA World Economic Forecasting Model. e Not standardized.
153
Annex tables
Table A.8 Economies in transition and developing economies: unemployment rates,a 2002-2011 2002
2003
2004
2005
2006
2007
20078
2009
2010
2011b
15.8 .. 15.1 36.5 13.3 31.9
15.0 .. 13.9 33.4 14.6 36.7
14.4 .. 13.7 31.1 18.5 37.2
14.1 .. 12.6 27.3 20.8 37.3
13.8 31.1 11.1 22.3 20.9 36.0
13.4 29.0 9.6 18.0 18.1 34.9
13.0 23.4 8.4 16.8 14.0 33.8
13.8 24.1 9.1 19.1 16.1 32.2
13.5 27.2 12.3 19.7 19.2 32.1
13.3 27.5 14.2 20.0 19.9 31.0
10.5 .. 3.0 12.6 9.3 3.1 6.8 7.9 2.6 2.5 9.6 0.4
10.2 10.7 3.1 11.5 8.8 2.9 8.0 8.2 2.3 2.5 9.1 0.3
9.4 8.4 1.9 12.6 8.4 2.9 8.2 7.8 2.0 .. 8.6 0.4
7.6 7.6 1.5 13.8 8.1 3.3 7.3 7.2 2.1 3.7 7.2 0.3
7.2 6.8 1.1 13.6 7.8 3.5 7.4 7.2 2.3 .. 7.4 0.3
6.4 6.5 1.0 13.3 7.3 3.3 5.1 6.1 2.5 3.6 6.6 0.2
6.3 6.0 0.8 16.5 6.6 2.9 4.0 6.4 2.1 2.5 6.4 0.2
6.8 5.9 0.9 16.9 6.6 2.8 6.4 8.4 2.1 2.2 8.8 0.2
7.1 5.6 0.7 16.3 5.8 .. 7.5 7.5 2.2 .. 8.1 0.2
6.5 5.5 0.7 .. 5.6 .. 7.8 6.7 2.1 .. 8.0 0.2
25.9 .. 10.2 7.2 11.6 30.0 ..
23.7 23.8 11.9 7.7 11.9 29.8 ..
17.7 .. 10.3 8.4 10.8 27.0 ..
15.3 .. 11.2 9.6 11.0 26.6 12.9
12.3 17.6 10.7 9.1 9.7 25.5 12.5
13.8 20.2 8.9 8.5 9.8 23.3 12.4
11.3 .. 8.7 7.2 9.6 22.9 12.4
10.2 .. 9.4 7.3 9.1 24.0 13.3
10.0 .. 9.0 7.8 9.1 24.9 13.0
10.0 .. 12.2 7.8 9.2 23.9 16.0
19.7 10.3 8.7 11.7 9.8 18.1 6.8 16.1 8.6 6.2 5.4 6.1 14.2
17.3 11.0 9.2 12.3 9.5 17.1 6.7 16.7 9.8 6.2 5.2 7.6 11.4
13.6 9.8 6.2 11.5 10.0 15.8 6.7 18.4 9.7 6.5 4.4 8.0 11.7
11.6 9.1 8.1 9.8 9.2 14.3 6.9 17.9 8.5 7.3 .. 6.5 11.3
10.2 8.7 8.0 10.0 7.7 13.1 6.0 16.2 8.1 5.7 .. 4.9 10.3
8.5 7.4 7.7 9.3 7.1 11.4 4.8 15.6 7.4 5.8 .. 4.0 9.8
7.9 8.1 6.7 7.9 7.8 11.5 4.8 14.1 6.9 5.5 .. 4.1 10.6
8.7 10.0 7.9 8.1 10.8 13.0 8.5 14.9 8.5 7.1 .. 4.9 11.4
7.7 10.8 7.9 6.7 8.1 12.4 7.1 14.3 7.6 .. .. 6.4 12.4
7.4 10.0 7.6 6.3 7.3 11.2 6.0 14.1 7.0 .. .. 6.0 12.9
South-Eastern Europe Albaniac Bosnia and Herzegovina Croatia Montenegro Serbia The former Yugoslav Republic of Macedonia Commonwealth of Independent States and Georgiad Armeniac Azerbaijan Belarusc Georgiad Kazakhstan Kyrgyzstanc Republic of Moldovac Russian Federation Tajikistanc Turkmenistanc Ukraine Uzbekistanc Africa Algeria Botswana Egypt Mauritius Morocco South Africa Tunisiae Developing America Argentinaf, g Barbados Boliviaf Brazilh, i Chile Colombiaj Costa Rica Dominican Republic Ecuadork El Salvador Guatemala Honduras Jamaica
154
World Economic Situation and Prospects 2012
Table A.8 (cont’d) Mexico Nicaragua Panama Paraguayf Peruf, l Trinidad and Tobago Uruguayf Venezuela, Bolivarian Republic of
2011b
2002
2003
2004
2005
2006
2007
20078
2009
2010
3.0 11.6 16.5 14.7 9.4 10.4 17.0 15.8
3.4 10.2 15.9 11.2 9.4 10.5 16.9 18.0
3.9 9.3 14.1 10.0 9.4 8.4 13.1 15.3
3.6 7.0 12.1 7.6 9.6 8.0 12.2 12.4
3.6 7.0 10.4 8.9 8.5 6.2 10.9 10.0
3.7 6.9 7.8 7.2 8.4 5.6 9.2 8.5
4.0 8.0 6.5 7.4 8.4 4.6 7.7 6.9
5.5 10.5 6.6 8.0 8.4 5.3 7.3 7.9
5.4 9.7 6.5 6.9 7.9 6.1 6.8 8.5
5.4 9.2 5.6 7.4 9.4 6.2 6.2 9.3
4.0 7.3 .. 9.1 12.8 10.3 14.4 3.3 3.5 8.3 31.3 10.2 5.3 3.6 8.8 5.2 2.4 10.3 6.0
4.3 7.9 .. 9.5 .. 10.7 14.8 3.6 3.6 8.3 25.6 10.2 5.6 4.0 8.1 5.0 2.2 10.5 5.8
4.2 6.8 5.0 9.9 10.3 10.4 12.5 3.7 3.6 7.7 26.8 10.9 5.8 3.4 8.1 4.4 2.1 10.3 5.6
4.2 5.6 .. 11.2 11.5 9.0 14.8 3.7 3.6 7.7 23.5 7.8 6.1 3.1 7.7 4.1 1.8 10.3 5.3
4.1 4.8 .. 10.4 .. 8.4 14.0 3.5 3.3 6.2 23.6 7.9 6.3 2.7 6.5 3.9 1.5 9.9 4.8
4.0 4.0 .. 9.4 10.5 7.3 13.1 3.2 3.3 5.3 21.5 7.3 6.1 2.1 6.0 3.9 1.4 10.2 4.6
4.2 3.5 .. 8.4 10.3 6.1 12.7 3.2 3.3 5.2 26.0 7.4 6.3 2.1 5.4 4.1 1.4 10.9 4.7
4.3 5.2 9.4 8.0 11.5 7.6 12.9 3.6 3.6 5.5 24.5 7.5 6.3 3.0 5.8 5.8 1.5 14.0 4.6
4.2 4.3 .. 7.2 13.5 6.7 12.5 3.7 3.3 5.8 23.7 7.3 6.2 2.2 5.0 5.2 1.0 11.9 4.3
4.1 3.5 .. 6.8 11.3 5.6 12.3 3.4 3.1 6.0 25.9 7.2 5.9 2.0 4.3 4.4 0.8 10.1 4.3
Developing Asia China Hong Kong SARm India Indonesia Iran, Islamic Republic of Israel Jordan Korea, Republic of Malaysia Pakistan Palestinian Occupied Territory Philippines n, o Saudi Arabia Singapore Sri Lankap Taiwan Province of China Thailand Turkey Viet Namf
Source: UN/DESA, based on data of the Economic Commission for Europe (ECE); ILO LABORSTAT database and KILM 6th edition; Economic Commission for Latin America and the Caribbean (ECLAC); and national sources. a As a percentage of labour force. Reflects national definitions and coverage. Not comparable across economies. b Partly estimated. c End-of-period registered unemployment data (as a percentage of labour force). d Georgia officially left the Commonwealth of Independent States on 18 August 2009. However, its performance is discussed in the context of this group of countries for reasons of geographic proximity and similarities in economic structure. e New methodology starting in 2005. f Urban areas. g Break in series: new methodology starting in 2003. h Six main cities. i Break in series: new methodology starting in 2002. j Thirteen main cities. k Covers Quito, Guayaquil and Cuenca. l Metropolitan Lima. m Special Administrative Region of China. n Partly adopts the ILO definition; that is to say, it does not include one ILO criterion, namely, “currently available for work”. o Break in series: new methodology starting in 2005. p Excluding Northern and Eastern provinces.
155
Annex tables
Table A.9 Major developed economies: quarterly indicators of growth, unemployment and inflation, 2009-2011 Percentage 2009 I
II
2010 III
IV
I
II
2011 III
IV
I
II
III
Growth of gross domestic producta (percentage change in seasonally adjusted data from preceding quarter) Canada France Germany Italy Japan United Kingdom United States Major developed economies Euro area
-7.9 -6.1 -15.1 -11.5 -17.7 -6.1 -6.7 -9.7 -10.2
-3.7 0.3 1.3 -1.1 8.4 -0.8 -0.7 0.8 -0.8
1.7 1.0 3.3 1.4 -2.3 0.9 1.7 1.1 1.8
5.0 2.4 2.9 -0.2 6.4 3.0 3.8 3.7 1.6
5.6 0.4 2.1 2.6 10.2 0.6 3.9 4.2 1.3
2.3 2.1 8.0 1.9 0.1 4.3 3.8 3.3 3.8
2.5 1.7 3.2 1.3 2.9 2.5 2.5 2.5 1.6
3.1 1.3 1.9 0.3 -2.7 -2.0 2.3 0.9 1.1
3.5 3.8 5.5 0.5 -2.7 1.6 0.4 0.9 3.1
-0.5 -0.2 1.2 1.2 -1.3 0.4 1.3 0.6 0.7
3.5 1.6 2.0 .. 6.0 2.0 2.0 .. 0.6
7.7 9.7 6.3 8.2 4.7 7.7 8.9 7.7 10.0
7.5 9.7 6.0 8.1 4.6 7.9 9.1 7.8 10.0
7.2 9.9 5.9 8.2 4.4 8.3 9.1 7.7 10.2
3.3 2.8 3.7 -2.1 -1.2 6.1 5.1 3.2 1.8
5.6 4.8 3.2 11.0 0.9 6.3 7.2 5.7 6.6
0.8 -0.2 1.8 -3.0 0.0 2.5 1.7 1.0 -0.9
Unemployment rateb (percentage of total labour force) Canada France Germany Italy Japan United Kingdom United States Major developed economies Euro area
7.8 9.0 7.6 7.4 4.5 7.0 8.2 7.3 9.0
8.4 9.5 7.9 7.6 5.1 7.7 9.3 8.1 9.5
8.5 9.6 7.9 8.0 5.4 7.8 9.7 8.4 9.8
8.4 10.0 7.7 8.3 5.3 7.7 10.0 8.5 10.0
8.2 9.9 7.5 8.5 5.0 7.9 9.7 8.3 10.1
8.0 9.8 7.2 8.6 5.1 7.7 9.6 8.2 10.2
8.0 9.8 6.9 8.2 5.0 7.7 9.6 8.1 10.1
7.7 9.7 6.6 8.3 5.0 7.8 9.6 8.1 10.1
Change in consumer pricesc (percentage change from preceding quarter) Canada France Germany Italy Japan United Kingdom United States Major developed economies Euro area
-1.3 -1.7 -0.5 -5.3 -4.9 -1.6 -1.8 -2.4 -2.7
3.5 2.3 1.0 7.0 0.0 4.6 4.1 3.2 3.4
0.4 -0.3 0.6 -2.5 -1.2 2.4 2.9 1.2 -1.1
0.6 1.4 0.2 4.2 -2.0 3.0 0.7 0.7 2.2
2.0 2.4 1.4 -3.2 -0.2 3.0 1.5 1.1 0.0
2.5 3.8 1.9 8.2 0.5 5.3 2.2 2.7 5.4
2.2 -0.5 1.2 -1.9 -2.2 1.1 0.4 -0.1 -0.6
2.3 1.9 1.9 5.4 0.8 4.1 1.1 1.8 3.4
Source: UN/DESA, based on Eurostat, OECD and national sources. a Expressed as an annualized rate. Calculated as a weighted average, where weights are based on annual GDP valued in 2005 prices and exchange rates. b Seasonally adjusted data as standardized by OECD. c Expressed as an annualized rate. Calculated as a weighted average, where weights are based on 2005 GDP in United States dollars.
156
World Economic Situation and Prospects 2012
Table A.10 Selected economies in transition: quarterly indicators of growth and inflation, 2009-2011 Percentage 2009 I
II
2010 III
IV
I
II
2011 III
IV
I
II
III
1.2 .. 10.9 -0.8 5.8 6.6 0.4 .. 4.1 5.1 5.3
3.9 .. 11.4 0.8 4.7 7.6 .. .. 3.4 5.3 3.8
.. .. .. 0.6 .. 7.0 .. .. .. .. 6.6
11.1 8.9 12.6 3.5 2.2 13.3 8.5 20.5 6.1 9.5 3.8 7.7
8.8 8.5 31.6 4.1 2.3 12.6 8.4 22.5 7.1 9.5 4.5 10.8
5.8 8.3 63.0 4.0 2.1 6.7 8.8 17.2 8.8 8.1 3.6 8.5
Rates of growth of gross domestic producta Armenia Azerbaijan Belarus Croatia Georgia Kazakhstan Kyrgyzstan Republic of Moldova Russian Federation The former Yugoslav Republic of Macedonia Ukraine
-6.3 -18.6 -19.7 5.8 6.0 7.3 1.1 -0.4 -1.1 -6.7 -6.9 -5.7 -4.8 -9.0 -1.5 -4.5 -2.6 -0.3 -1.8 0.3 4.6 -4.5 -5.2 -6.6 -9.2 -11.1 -8.6 -1.4 -2.4 -2.1 -19.6 -17.3 -15.7
-7.8 16.7 1.7 -4.6 0.0 10.3 5.5 -6.9 -2.6 2.0 -6.7
3.4 4.2 4.0 -2.3 3.9 7.3 18.5 6.6 3.5 -0.5 4.8
8.2 3.7 8.9 -2.3 8.7 8.0 -5.7 6.9 5.0 1.5 5.5
-2.9 3.3 7.1 0.3 6.7 7.2 -7.2 7.2 3.1 2.1 3.6
2.4 5.1 10.2 -0.6 6.0 5.6 -2.3 7.0 4.5 3.8 4.2
Change in consumer pricesa Armenia Azerbaijan Belarus Bosnia and Herzegovina Croatia Georgia Kazakhstan Kyrgyzstan Republic of Moldova Russian Federation The former Yugoslav Republic of Macedonia Ukraine
2.0 8.2 15.6 1.6 3.8 2.8 8.8 16.2 3.1 13.7 0.9 20.4
3.3 -0.7 13.9 -1.0 2.8 2.3 8.3 9.1 -0.9 12.4 -0.4 15.1
3.4 -1.0 12.4 -1.4 1.2 -0.8 6.4 2.8 -1.7 11.4 -0.6 15.3
4.9 -0.5 10.2 -0.7 1.6 3.0 5.9 0.6 -0.6 9.2 -1.0 13.3
Source: UN/DESA, based on data of the Economic Commission for Europe and national sources. a Percentage change from the corresponding period of the preceding year.
9.1 3.8 6.1 1.7 0.9 4.7 7.3 2.6 5.8 7.2 1.3 11.2
6.8 6.0 6.8 2.5 0.7 4.4 6.9 3.1 8.0 5.9 1.9 8.3
8.1 5.6 7.7 1.8 1.1 8.8 6.6 9.1 7.9 6.2 2.3 8.5
8.7 7.2 10.0 2.5 1.5 10.4 7.6 17.2 7.9 8.1 3.0 9.4
157
Annex tables
Table A.11 Major developing economies: quarterly indicators of growth, unemployment and inflation, 2009-2011 Percentage 2009 I
II
2010 III
IV
I
II
2011 III
IV
I
II
III
9.2 5.0 5.8 9.8 4.8 7.0 6.4 8.3 6.9 6.4 4.7 4.8 4.4 6.1 12.0 3.8 7.1 3.8 9.2 0.5
9.9 4.2 9.9 9.7 5.1 8.6 7.5 7.8 6.5 7.0 4.2 4.9 4.5 4.6 9.3 3.5 6.2 3.2 11.6 4.8
9.1 3.1 6.6 9.5 5.2 8.9 5.3 7.7 6.5 3.5 3.4 4.3 3.2 3.1 1.0 3.0 5.0 2.7 8.8 2.5
.. .. 4.8 9.1 .. .. 4.3 6.9 6.5 5.1 3.4 5.8 4.5 3.2 5.9 3.1 3.4 3.5 .. 4.2
7.3 5.7 7.3 11.0 6.1 3.7 6.5 3.3 3.1 5.3 7.1 2.2 24.0 4.9 0.8 11.2 6.0 7.7
7.4 6.3 7.3 12.2 7.0 3.4 5.7 4.2 3.1 5.1 7.4 1.9 25.0 4.6 0.8 11.4 6.3 9.3
7.3 6.3 7.1 11.1 6.4 3.6 5.2 3.4 3.0 5.2 7.2 2.1 25.7 4.3 0.6 9.5 6.2 8.4
7.2 6.0 7.4 10.4 5.5 3.5 6.1 3.1 3.1 5.7 7.1 2.0 25.0 4.4 .. 9.2 6.0 8.2
Rates of growth of gross domestic producta Argentina Brazil Chile China Colombia Ecuador Hong Kong SARb India Indonesia Israel Korea, Republic of Malaysia Mexico Philippines Singapore South Africa Taiwan Province of China Thailand Turkey Venezuela, Bolivarian Republic of
2.0 -1.8 -2.5 6.4 1.1 2.8 -7.0 5.8 4.5 0.8 -4.3 -6.2 -7.4 0.5 -8.9 -1.4 -8.6 -7.0 -14.7 0.7
-0.8 -1.2 -4.8 7.8 0.7 0.5 -2.9 6.0 4.1 0.1 -2.2 -3.9 -9.6 1.2 -1.7 -2.6 -7.2 -5.2 -7.8 -2.5
-0.3 -0.2 -1.4 9.0 1.1 -1.2 -3.4 8.6 4.2 -0.1 1.0 -1.2 -5.5 0.2 1.8 -2.1 -1.2 -2.8 -2.8 -4.5
2.6 4.8 2.1 10.8 2.9 -0.5 2.7 6.5 5.4 2.5 6.0 4.4 -2.0 2.1 3.8 -0.6 9.2 5.9 5.9 -5.8
6.8 9.3 1.7 11.9 4.1 0.4 8.0 9.4 5.7 2.0 8.5 10.1 4.5 8.4 16.9 1.7 13.6 12.0 12.2 -4.8
11.8 9.2 6.4 10.3 4.7 2.5 6.7 9.3 6.2 5.8 7.5 9.0 7.6 8.9 19.4 3.1 12.9 9.2 10.2 -1.7
8.6 6.7 6.9 9.6 3.4 4.5 6.9 8.9 5.8 5.2 4.4 5.3 5.1 7.3 10.5 2.7 10.7 6.6 5.3 -0.2
Unemployment ratec Argentina Brazil Chile Colombia Ecuador Hong Kong SARb Israel Korea, Republic of Malaysia Mexico Philippines Singapore South Africa Taiwan Province of China Thailand Turkey Uruguay Venezuela, Bolivarian Republic of
8.4 8.6 8.6 12.9 8.6 5.2 7.1 3.8 4.0 5.0 7.7 3.3 23.6 5.6 2.1 15.8 7.5 8.2
8.8 8.6 11.3 11.7 8.3 5.4 7.7 3.8 3.5 5.2 7.5 3.2 23.6 5.8 1.7 13.8 8.0 7.7
9.1 7.9 11.5 12.2 9.1 5.3 7.8 3.6 3.5 6.3 7.6 3.3 24.4 6.1 1.2 13.2 7.1 7.4
8.4 7.2 10.4 11.3 7.9 5.1 7.5 3.3 3.4 5.3 7.1 2.3 24.2 5.9 1.0 13.2 6.6 7.3
8.3 7.4 9.3 12.7 9.1 4.4 7.0 4.7 3.6 5.3 7.3 2.2 25.2 5.7 1.1 14.2 7.4 9.2
7.9 7.3 8.6 12.0 7.7 4.6 5.9 3.5 3.4 5.3 8.0 2.2 25.2 5.2 1.3 11.2 7.4 8.2
7.5 6.6 8.2 11.3 7.4 4.4 7.2 3.5 3.2 5.6 6.9 2.1 25.3 5.1 0.9 11.1 6.6 8.9
158
World Economic Situation and Prospects 2012
Table A.11 (cont’d) 2009 I
II
2010 III
IV
I
II
2011 III
IV
I
II
III
11.1 5.6 2.5 4.7 2.7 3.4 2.9 9.2 6.3 2.5 3.6 2.1 4.3 2.9 4.0 3.5 1.1 2.8 7.4 27.3
10.1 6.1 2.9 5.1 3.2 3.4 4.0 9.0 6.8 4.0 4.4 2.7 3.5 4.5 5.2 3.8 1.3 3.0 4.4 29.1
9.7 6.6 3.3 5.7 3.1 4.1 5.1 8.9 5.9 4.1 4.2 3.3 3.3 5.0 4.7 4.6 1.6 4.1 5.9 24.6
9.8 7.1 3.1 6.3 3.4 4.9 6.5 9.2 4.7 3.3 4.8 3.4 3.4 4.8 5.5 5.4 1.3 4.1 6.4 26.5
Change in consumer pricesa Argentina Brazil Chile China Colombia Ecuador Hong Kong SARb India Indonesia Israel Korea, Republic of Malaysia Mexico Philippines Singapore South Africa Taiwan Province of China Thailand Turkey Venezuela, Bolivarian Republic of
6.6 5.8 4.8 -0.6 6.6 7.9 1.7 9.4 8.6 3.4 3.9 3.7 6.2 6.9 2.6 8.4 0.0 -0.2 8.4 29.5
5.5 5.2 1.8 -1.5 4.8 5.5 -0.1 8.9 4.8 3.2 2.8 1.3 6.0 3.2 0.3 7.7 -0.8 -2.8 5.7 28.2
5.9 4.4 -1.9 -1.3 3.2 3.5 -0.9 11.8 2.8 3.2 2.0 -2.3 5.1 0.3 -0.1 6.4 -1.3 -2.2 5.3 28.7
7.1 4.2 -3.0 0.7 2.4 3.9 1.3 13.3 2.6 3.6 2.4 -0.2 4.0 2.9 -0.4 6.0 -1.3 1.9 5.7 28.1
Sources: IMF, International Financial Statistics, and national sources. a Percentage change from the corresponding quarter of the previous year. b Special Administrative Region of China. c Reflects national definitions and coverage. Not comparable across economies.
9.0 4.9 -0.3 2.2 2.0 4.0 1.9 15.5 3.6 3.5 2.7 1.3 4.8 4.3 0.9 5.7 1.3 3.8 9.3 27.4
10.6 5.1 1.2 2.9 2.1 3.2 2.6 13.8 4.4 2.8 2.6 1.6 4.0 4.2 3.0 4.5 1.1 3.3 9.2 31.9
11.1 4.6 2.3 3.5 2.3 3.6 2.3 10.3 6.1 2.0 2.9 1.8 3.7 3.8 3.4 3.5 0.4 3.3 8.4 29.8
159
Annex tables
Table A.12 Major developed economies: financial indicators, 2002-2011 Percentage 2002
2003
2004
2005
2006
2007
2009
2010
2011a
3.3 4.6 4.6 4.6 0.9 5.5 3.0
0.7 1.2 1.2 1.2 0.6 1.2 0.6
0.8 0.8 0.8 0.8 0.4 0.7 0.3
1.2 1.4 1.4 1.4 0.3 0.8 0.3
3.6 4.2 4.0 4.7 1.5 4.6 3.7
3.2 3.6 3.2 4.3 1.3 3.6 3.3
3.2 3.1 2.7 4.0 1.2 3.6 3.2
3.0 3.4 2.8 5.0 1.2 3.4 3.0
-5.5 -7.5 -3.2 -5.4 -8.7 -11.5 -11.3
-5.5 -7.1 -4.3 -4.6 -8.1 -10.3 -10.6
-4.9 -5.8 -1.2 -4.0 -8.9 -7.2 -10.1
2008
Short-term interest ratesb Canada Francec Germanyc Italyc Japan United Kingdom United States
2.6 3.3 3.3 3.3 0.1 4.0 1.7
3.0 2.3 2.3 2.3 0.1 3.7 1.2
2.3 2.1 2.1 2.1 0.1 4.6 1.6
2.8 2.2 2.2 2.2 0.1 4.7 3.5
4.2 3.1 3.1 3.1 0.3 4.8 5.2
4.6 4.3 4.3 4.3 0.7 6.0 5.3
Long-term interest ratesd Canada France Germany Italy Japan United Kingdom United States
5.3 4.9 4.8 5.0 1.3 4.9 4.6
4.8 4.1 4.1 4.3 1.0 4.5 4.0
4.6 4.1 4.0 4.3 1.5 4.9 4.3
4.1 3.4 3.4 3.6 1.4 4.4 4.3
4.2 3.8 3.8 4.0 1.7 4.5 4.8
4.3 4.3 4.2 4.5 1.7 5.0 4.6
General government financial balancese Canada France Germany Italy Japan United Kingdom United States
-0.1 -3.1 -3.8 -3.1 -8.0 -2.1 -4.0
-0.1 -4.1 -4.2 -3.6 -7.9 -3.4 -5.0
0.9 -3.6 -3.8 -3.5 -6.2 -3.5 -4.4
1.5 -2.9 -3.3 -4.4 -6.7 -3.4 -3.3
1.6 -2.3 -1.6 -3.4 -1.6 -2.7 -2.2
Sources: OECD, Economic Outlook; OECD, Main Economic Indicators; and Eurostat. a Average for the first nine months. b Three-month Interbank Rate. c From January 1999 onwards, represents the three-month Euro Interbank Offered Rate (EURIBOR). d Yield on long-term government bonds. e Surplus (+) or deficit (-) as a percentage of nominal GNP or GDP. Estimates for 2011.
1.4 -2.7 0.2 -1.6 -2.4 -2.7 -2.9
0.0 -3.3 -0.1 -2.7 -2.2 -5.0 -6.3
160
World Economic Situation and Prospects 2012
Table A.13 Selected economies: real effective exchange rates, broad measurement,a 2002-2011 Index: 2000=100 2002
2003
2004
2005
2006
2007
2008
2009
2010
2011b
99.5 104.9 94.7 118.5 106.8 104.9 113.3 83.0 111.4 108.8 107.4 111.7 104.0 93.7 110.7 98.6 106.3
110.9 110.3 102.5 117.3 114.0 116.7 115.0 82.9 130.5 108.3 99.3 115.7 112.4 97.4 112.5 95.8 98.1
120.8 113.1 104.6 121.5 114.5 120.8 118.8 83.6 140.1 110.4 101.9 125.4 116.8 96.4 110.2 99.9 92.0
127.7 116.1 108.1 129.4 112.0 119.7 118.9 79.2 147.0 117.0 111.2 151.7 116.9 93.4 106.1 97.5 89.4
133.1 125.6 111.7 133.5 109.9 120.8 115.4 72.1 135.7 122.7 113.5 169.1 118.2 94.3 101.4 97.2 86.9
142.1 132.3 112.6 139.0 109.9 125.6 119.5 67.3 146.0 131.8 117.4 188.4 128.3 97.7 96.5 99.2 82.8
141.1 142.5 103.4 156.8 110.6 131.3 121.9 73.8 134.4 134.1 126.0 178.7 131.6 91.9 98.5 87.4 79.7
129.7 139.8 95.1 149.2 117.4 125.4 118.8 83.8 127.3 129.3 109.4 171.4 141.1 89.3 107.0 80.1 88.1
145.9 142.7 101.7 149.6 112.2 117.9 118.5 83.9 139.4 139.3 114.3 173.0 129.7 92.2 109.7 80.9 83.6
156.4 150.3 100.4 156.4 109.7 120.7 116.8 85.7 145.9 146.6 114.8 175.3 124.6 92.4 118.2 81.0 78.2
106.6 126.1
109.8 130.5
113.8 140.0
114.7 153.9
115.6 169.6
116.8 179.5
124.5 192.0
127.3 181.9
127.1 198.1
126.9 205.3
56.2 89.4 92.9 103.0 99.0 109.5 81.8 101.7 99.0 116.5 89.9 93.6 109.4 101.7 109.3 98.8 115.6 99.4 104.1 112.1
62.6 98.3 91.8 97.9 87.9 112.9 65.6 95.2 98.2 123.1 87.7 93.0 102.5 98.7 99.8 99.1 107.1 100.2 100.0 107.2
60.9 105.5 99.9 96.0 94.6 113.2 66.3 90.1 99.0 113.4 85.5 95.1 95.0 100.7 97.9 97.4 110.6 99.6 99.6 100.4
60.1 129.2 111.6 98.2 104.7 119.6 72.1 86.6 101.2 113.7 86.4 105.0 96.4 103.3 102.8 94.9 126.2 101.4 99.4 106.7
58.6 140.3 117.8 101.1 102.6 128.9 74.2 84.3 99.0 141.8 87.0 110.1 95.3 107.0 105.7 94.7 134.5 105.0 99.4 129.0
57.8 155.0 117.1 103.3 110.2 124.3 76.5 80.2 106.1 149.1 88.0 107.7 93.3 112.8 105.8 93.7 132.1 104.8 99.7 135.5
59.0 174.6 122.6 112.3 114.2 134.9 86.7 75.9 99.1 162.4 98.1 90.7 97.2 115.7 105.6 94.2 143.4 104.6 106.6 130.2
57.2 167.7 126.8 112.5 107.6 109.6 85.6 80.7 94.0 163.1 97.7 78.7 96.6 113.1 91.2 100.2 137.3 102.4 105.7 129.0
57.6 192.2 126.2 113.6 124.0 126.5 92.4 77.8 100.4 183.9 102.9 85.3 98.3 124.5 98.7 96.0 149.7 113.8 110.1 118.3
55.6 208.8 127.3 116.4 123.7 138.4 93.6 73.6 98.8 183.9 103.9 86.9 98.0 128.4 102.1 92.0 146.2 125.7 110.0 109.8
Developed economies Australia Bulgaria Canada Czech Republic Denmark Euro area Hungary Japan New Zealand Norway Poland Romania Slovakia Sweden Switzerland United Kingdom United States Economies in transition Croatia Russian Federation Developing economies Argentina Brazil Chile China Colombia Ecuador Egypt Hong Kong SARc India Indonesia Israel Korea, Republic of Kuwait Malaysia Mexico Morocco Nigeria Pakistan Peru Philippines
161
Annex tables
Table A.13 (cont’d) Saudi Arabia Singapore South Africa Taiwan Province of China Thailand Turkey Venezuela, Bolivarian Republic of
2002
2003
2004
2005
2006
2007
2008
2009
2010
2011b
102.5 95.9 80.4 93.9 100.9 99.9 92.2
94.5 95.5 105.5 89.6 100.1 109.8 93.1
87.8 102.2 115.0 90.8 99.8 115.1 98.4
85.1 106.8 117.3 89.2 102.4 123.1 98.8
84.2 112.1 113.1 89.0 111.3 120.3 107.4
82.0 119.5 109.0 87.8 124.5 126.8 119.1
83.4 125.3 99.8 84.6 120.7 124.6 137.9
92.2 114.4 105.2 76.6 111.9 114.0 188.6
93.3 116.4 118.9 79.7 122.6 117.0 116.8
89.5 119.7 118.3 80.0 125.8 106.0 129.9
Source: JPMorgan Chase. a Indices based on a “broad” measure currency basket of 46 currencies (including the euro). The real effective exchange rate, which adjusts the nominal index for relative price changes, gauges the effect on international price competitiveness of the country’s manufactures owing to currency changes and inflation differentials. A rise in the index implies a fall in competitiveness and vice versa. The relative price changes are based on indices most closely measuring the prices of domestically produced finished manufactured goods, excluding food and energy, at the first stage of manufacturing. The weights for currency indices are derived from 2000 bilateral trade patterns of the corresponding countries. b Average for the first ten months. c Special Administrative Region of China.
162
World Economic Situation and Prospects 2012
Table A.14 Indices of prices of primary commodities, 2002-2011 Index: 2000=100 Non-fuel commodities
Combined index
Manufac- Real prices tured of non-fuel Crude export commopetroleumb prices ditiesa
Food
Tropical beverages
Vegetable oilseeds and oils
Dollar
SDR
2002 2003 2004 2005 2006 2007 2008 2009 2010
102 104 119 127 151 164 234 220 230
89 94 100 126 134 148 178 181 213
117 137 155 141 148 226 298 213 262
95 111 125 129 147 164 198 163 226
87 98 137 173 278 313 332 232 310
97 105 126 140 183 207 256 213 251
99 99 112 126 164 178 213 182 218
99 108 117 120 123 133 139 132 134
98 97 108 117 149 155 184 161 187
88.3 101.8 130.6 183.5 221.3 250.4 342.2 221.2 280.6
2008 I II III IV
223 272 245 196
182 184 191 155
342 359 306 185
201 211 216 163
358 381 355 236
261 293 271 199
216 239 225 173
141 145 141 130
185 202 192 153
335.2 425.7 411.3 190.3
2009 I II III IV
206 213 228 233
164 175 186 201
188 226 215 224
146 150 164 193
182 214 252 278
188 203 223 237
167 177 188 197
126 129 134 137
149 158 166 173
155.5 212.0 245.3 269.3
2010 I II III IV
232 205 225 257
198 201 220 233
234 233 258 322
210 209 216 268
299 296 301 344
245 231 246 284
210 205 214 242
134 130 133 139
183 178 185 204
273.2 277.5 267.3 303.5
2011 I II III
274 261 270
278 283 274
364 345 324
315 303 290
376 363 352
312 300 298
264 249 248
142 148 ..
220 203 ..
365.9 407.1 393.2
Agricultural raw materials
Minerals and metals
Sources: UNCTAD, Monthly Commodity Price Bulletin; United Nations, Monthly Bulletin of Statistics; and data from the Organization of the Petroleum Exporting Countries (OPEC) website, available from http://www.opec.org. a Combined index of non-fuel commodity prices in dollars, deflated by manufactured export price index. b The new OPEC reference basket, introduced on 16 June 2005, currently has 12 crudes.
163
Annex tables
Table A.15 World oil supply and demand, 2003-2012 2003
2004
2005
2006
2007
2008
2009
2010
2011a 2012b
World oil supplyc, d (millions of barrels per day)
79.8
83.3
84.3
85.0
84.7
86.7
85.6
87.4
88.5
89.7
Developed economies Economies in transition Developing economies OPECe Non-OPEC Processing gainsf
17.8 10.5 49.7 30.8 18.9 1.8
17.4 11.6 52.5 33.1 19.4 1.9
16.5 12.0 54.0 34.2 19.8 1.9
16.3 12.4 54.4 34.3 20.1 1.9
16.0 12.9 53.6 34.6 19.0 2.2
16.7 12.9 55.1 36.2 18.9 2.0
16.9 13.4 53.3 34.1 19.2 2.0
17.2 13.7 54.5 34.8 19.7 2.1
17.1 13.8 55.4 35.7 19.7 2.2
17.5 13.9 56.1 36.0 20.1 2.3
79.3
82.5
83.8
85.1
86.5
86.5
85.5
88.3
89.2
90.6
28.1 28.9
36.1 38.3
50.6 54.4
61.1 65.4
69.1 72.7
94.5 97.6
61.1 61.9
77.5 79.6
107.2 107.0
98.0 100.0
World total demandg Oil prices (dollars per barrel) OPEC basketh Brent oil
Sources: United Nations, World Bank, International Energy Agency, U.S. Energy Information Administration and OPEC. a Partly estimated. b Baseline scenario forecasts. c Including global biofuels, crude oil, condensates, natural gas liquids (NGLs), oil from non-conventional sources and other sources of supply. d Totals may not add up because of rounding. e Includes Angola and Ecuador as of January 2007 and December 2007, respectively. f Net volume gains and losses in the refining process (excluding net gain/loss in the economies in transition and China) and marine transportation losses. g Including deliveries from refineries/primary stocks and marine bunkers, and refinery fuel and non-conventional oils. h The new OPEC reference basket, introduced on 16 June 2005, currently has 12 crudes.
164
World Economic Situation and Prospects 2012
Table A.16 World tradea: changes in value and volume of exports and imports, by major country group, 2003-2013 Annual percentage change 2003
2004
2005
2006
2007
2008
2009
2010b 2011c
2012c
2013c
Dollar value of exports World Developed economies North America EU plus other Europe Developed Asia Economies in transition South-Eastern Europe Commonwealth of Independent States Developing economies Latin America and the Caribbean Africa Western Asia East and South Asia
16.1 15.3 4.8 19.3 13.8 25.5 34.1 24.6 17.2 8.0 22.2 22.7 18.0
21.4 18.7 13.9 19.9 21.0 34.6 23.5 35.8 26.0 22.9 24.8 31.4 25.9
13.7 9.5 11.0 9.2 8.5 26.9 12.3 28.4 21.2 20.3 28.8 31.2 18.6
15.2 12.6 11.5 13.6 8.5 24.3 18.5 24.8 19.2 18.6 23.7 19.0 18.8
16.3 15.6 11.7 17.4 11.1 21.6 23.9 21.4 17.0 12.9 14.6 15.4 18.6
14.1 11.4 10.0 11.5 14.0 30.9 18.8 32.0 17.0 15.5 27.2 28.3 13.7
-19.9 -20.1 -17.1 -20.5 -23.4 -32.0 -21.2 -32.8 -18.1 -21.0 -22.1 -26.7 -14.8
17.1 13.6 17.1 10.4 30.5 27.1 10.0 28.7 21.8 31.2 14.3 15.1 22.2
13.9 12.4 9.7 13.8 8.9 17.6 11.8 18.1 15.9 10.3 8.3 20.2 17.2
9.2 4.8 4.6 4.6 7.2 11.9 8.3 12.2 15.2 11.5 10.9 9.7 17.5
10.6 7.4 8.1 7.5 5.4 11.2 9.4 11.3 14.7 8.2 15.9 10.2 16.7
17.5 14.2 19.7 10.9 23.2 21.3 0.3 24.6 22.9 29.0 7.5 13.1 25.7
13.9 13.6 9.2 15.0 16.6 20.4 17.4 20.7 13.8 9.7 16.9 13.7 14.4
9.2 5.9 4.2 5.8 10.9 14.8 7.1 15.8 13.9 13.5 12.0 17.4 13.7
10.6 7.7 5.5 8.5 7.9 13.5 9.8 13.9 14.7 12.9 14.6 12.5 15.5
12.3 11.0 10.3 10.3 18.2 4.2 13.7 3.5 15.3 11.1 3.7 4.8 20.1
6.4 6.1 6.0 6.7 2.1 5.2 5.0 5.2 7.0 6.4 -2.2 5.3 8.6
4.5 3.3 3.3 3.0 6.3 1.9 5.7 1.6 6.4 5.1 8.6 3.7 7.0
5.8 5.0 6.8 4.5 5.5 3.3 5.8 3.1 7.0 4.9 9.1 4.1 7.7
Dollar value of imports World Developed economies North America EU plus other Europe Developed Asia Economies in transition South-Eastern Europe Commonwealth of Independent States Developing economies Latin America and the Caribbean Africa Western Asia East and South Asia
16.0 16.0 8.2 20.2 13.4 24.7 29.6 23.7 15.4 3.5 19.4 18.4 17.7
21.2 19.0 16.0 20.1 20.5 29.2 24.8 30.2 26.1 20.4 20.2 30.4 27.5
13.4 11.4 13.0 10.5 12.7 19.7 8.1 22.1 17.4 18.7 20.4 21.3 16.2
14.5 13.0 10.6 14.5 9.6 23.8 15.4 25.4 17.2 18.1 18.2 19.9 16.4
World Developed economies North America EU plus other Europe Developed Asia Economies in transition South-Eastern Europe Commonwealth of Independent States Developing economies Latin America and the Caribbean Africa Western Asia East and South Asia
5.1 1.9 0.5 1.8 6.0 11.4 9.4 11.6 11.0 3.8 7.0 15.1 12.8
10.6 8.2 8.2 7.8 11.2 12.9 7.3 13.3 15.0 12.5 7.0 13.5 17.6
7.8 5.8 5.4 5.9 5.7 4.0 8.9 3.6 12.0 7.7 9.4 10.2 14.1
9.4 8.5 6.7 9.2 7.7 7.0 10.3 6.8 11.2 6.5 12.1 6.2 13.7
16.0 13.6 6.5 17.1 10.5 33.7 30.9 34.2 19.4 19.5 26.9 28.8 16.8
14.4 11.3 7.6 11.6 20.8 28.6 22.2 29.7 19.3 20.7 26.0 22.4 17.5
-20.6 -22.5 -22.2 -22.3 -24.8 -30.2 -28.4 -30.5 -15.8 -20.5 -13.4 -17.5 -14.6
Volume of exports 7.0 6.1 7.2 5.7 7.0 7.4 6.2 7.5 8.4 4.8 4.4 5.6 10.7
2.7 1.9 3.5 1.5 2.1 2.0 3.9 1.8 4.2 1.8 9.2 2.4 4.6
-9.2 -12.2 -10.4 -12.0 -17.5 -6.9 -14.0 -6.4 -4.4 -10.1 -5.9 -5.9 -2.5
165
Annex tables
Table A.16 (cont’d) 2003
2004
2005
2006
5.8 3.8 4.4 3.3 5.1 12.5 6.6 13.8 10.5 1.1 8.9 15.1 12.4
11.2 8.8 10.6 7.9 9.5 18.2 12.1 19.5 16.8 14.4 5.7 20.3 18.4
8.3 6.4 6.3 6.4 6.3 10.5 4.2 11.8 12.5 11.1 11.5 15.4 12.4
9.5 8.1 5.9 9.5 4.5 15.7 8.5 17.0 12.2 14.4 11.5 10.7 12.0
2007
2008
2009
2010b 2011c
2012c
2013c
4.3 2.6 2.0 2.3 6.3 7.0 5.3 7.3 6.8 6.7 7.5 5.5 7.0
5.7 4.2 3.7 4.4 4.3 8.4 5.7 8.8 7.8 8.0 7.7 4.2 8.4
Volume of imports World Developed economies North America EU plus other Europe Developed Asia Economies in transition South-Eastern Europe Commonwealth of Independent States Developing economies Latin America and the Caribbean Africa Western Asia East and South Asia
Source: UN/DESA. a Includes goods and non-factor services. b Partly estimated. c Baseline scenario forecasts, based in part on Project LINK.
7.5 5.0 2.9 6.0 3.9 21.8 12.7 23.4 11.7 13.5 16.5 19.7 9.2
2.7 0.3 -2.0 0.8 2.6 11.5 6.1 12.3 6.6 8.5 10.7 8.0 5.3
-10.7 -13.0 -13.6 -12.7 -14.0 -26.1 -19.3 -27.1 -4.5 -15.6 -4.2 -10.6 -0.5
13.4 10.4 12.6 9.6 10.6 11.0 3.9 12.2 18.7 23.5 4.2 11.0 21.1
6.7 5.3 4.8 5.4 6.2 6.4 4.1 6.7 9.0 11.0 7.9 10.4 8.5
166
World Economic Situation and Prospects 2012
Table A.17 Balance of payments on current accounts, by country or country group, summary table, 2002-2010 Billions of dollars
Developed economies Japan United States Europea EU-15 New EU member States Economies in transitionb South-Eastern Europe Commonwealth of Independent Statesc Developing economies Net fuel exporters Net fuel importers Latin America and the Caribbean Net fuel exporters Net fuel importers Africa Net fuel exporters Net fuel importers Western Asia Net fuel exportersd Net fuel importers East and South Asia Net fuel exporters Net fuel importers World residuale
2002
2003
2004
2005
2006
2007
2008
2009
2010
-286.0
-321.0
-339.4
-528.5
-606.4
-561.9
-673.6
-231.0
-253.1
112.6 -457.2 63.5 35.2 -20.5
136.2 -519.1 82.8 40.9 -28.5
172.1 -628.5 139.3 104.9 -45.8
165.7 -745.8 80.7 22.3 -40.6
170.4 -800.6 56.2 5.7 -61.4
211.0 -710.3 -4.9 7.6 -102.7
157.1 -677.1 -99.7 -75.0 -111.5
141.8 -376.6 88.6 21.1 -35.2
195.9 -470.9 110.2 12.9 -36.3
25.4
30.1
56.4
80.3
87.5
56.2
83.8
30.9
69.2
-5.0 30.6
-5.7 36.2
-7.1 63.9
-7.3 88.2
-8.5 97.2
-15.3 73.5
-24.7 111.4
-10.7 42.9
-7.0 77.4
127.1
222.2
283.1
450.0
710.5
795.1
784.5
422.3
520.8
38.4 88.7 -14.9 5.1 -20.0 -7.3 -5.1 -2.3 20.0 24.9 -4.9 129.3 13.5 115.9
77.8 144.4 10.6 11.5 -0.8 0.0 5.2 -5.2 39.6 50.8 -11.2 172.0 10.3 161.6
127.6 155.5 22.4 16.1 6.3 12.1 24.1 -12.0 68.7 84.9 -16.2 179.9 2.6 177.3
260.2 189.8 37.9 28.2 9.7 35.0 51.5 -16.6 139.8 163.6 -23.8 237.4 16.9 220.5
388.2 322.3 52.5 34.6 17.9 85.0 105.7 -20.7 182.9 210.2 -27.2 390.1 37.8 352.4
349.3 445.9 17.4 22.6 -5.2 69.0 102.1 -33.1 144.1 182.2 -38.1 564.5 42.4 522.2
446.8 337.8 -27.9 42.3 -70.3 61.7 112.6 -50.9 225.8 271.7 -45.9 524.9 20.1 504.9
92.3 330.0 -22.1 5.7 -27.8 -28.5 10.3 -38.8 40.3 53.6 -13.3 432.7 22.7 410.0
233.9 286.9 -55.0 8.3 -63.3 -3.6 34.6 -38.3 109.4 159.3 -49.9 470.0 31.7 438.3
-133.5
-68.7
0.2
1.8
191.7
289.4
194.7
222.3
336.9
Sources: IMF, World Economic Outlook, September 2011; and IMF, Balance of Payments Statistics. a Europe consists of the EU-15, the new EU member States and Iceland, Norway and Switzerland. b Includes Georgia. c Excludes Georgia, which left the Commonwealth of Independent States on 18 August 2009. d Data for Iraq not available prior to 2005. e Statistical discrepancy.
167
Annex tables
Table A.18 Balance of payments on current accounts, by country or country group, 2002-2010 Billions of dollars 2002
2003
2004
2005
2006
2007
2008
2009
2010
-255.5 92.5 17.8 -140.7 -286.0
-307.5 108.9 48.0 -170.4 -321.0
-421.5 163.9 123.0 -204.8 -339.4
-636.9 201.3 151.1 -244.0 -528.5
-780.7 269.1 145.9 -240.7 -606.4
-778.3 378.2 136.8 -298.6 -561.9
-886.0 420.0 123.7 -331.3 -673.6
-444.3 351.7 174.0 -312.3 -231.0
-548.9 392.0 243.2 -339.4 -253.1
92.5 -40.7 65.8 -4.9 112.6
104.0 -31.4 71.2 -7.5 136.2
128.5 -34.3 85.7 -7.9 172.1
93.8 -24.1 103.5 -7.6 165.7
81.1 -18.2 118.2 -10.7 170.4
105.1 -21.2 138.6 -11.6 211.0
38.4 -20.8 152.6 -13.1 157.1
43.4 -20.4 131.0 -12.3 141.8
91.0 -16.1 133.3 -12.4 195.9
-474.5 57.1 25.2 -65.0 -457.2
-540.4 49.4 43.7 -71.8 -519.1
-663.5 58.2 65.1 -88.2 -628.5
-780.7 72.1 68.6 -105.7 -745.8
-835.7 82.4 44.2 -91.5 -800.6
-818.9 122.2 101.5 -115.1 -710.3
-830.1 131.8 147.1 -125.9 -677.1
-505.9 124.6 128.0 -123.3 -376.6
-645.9 145.8 165.2 -136.1 -470.9
94.9 79.2 -39.3 -71.2 63.5
104.0 96.7 -26.6 -91.4 82.8
82.2 147.5 18.1 -108.4 139.3
14.8 162.9 32.4 -129.3 80.7
-58.1 216.7 34.7 -137.2 56.2
-89.6 295.0 -40.0 -170.4 -4.9
-131.8 334.1 -110.2 -191.8 -99.7
23.5 267.2 -28.5 -173.6 88.6
-5.9 287.9 14.8 -186.7 110.2
93.7 50.3 -39.2 -69.5 35.2
103.1 65.1 -36.6 -90.8 40.9
79.6 111.2 21.1 -106.9 104.9
3.0 120.3 23.4 -124.4 22.3
-63.9 165.7 38.8 -134.9 5.7
-71.9 229.8 17.6 -167.9 7.6
-125.7 253.8 -15.8 -187.2 -75.0
-12.6 196.2 5.3 -167.9 21.1
-50.1 210.2 36.7 -183.8 12.9
-25.5 8.5 -9.8 6.4 -20.5
-29.1 8.0 -15.4 8.0 -28.5
-34.7 9.5 -28.2 7.7 -45.8
-36.0 13.1 -26.5 8.8 -40.6
-51.9 15.4 -35.0 10.1 -61.4
-77.3 21.8 -57.7 10.6 -102.7
-97.0 27.1 -53.7 12.1 -111.5
-24.4 22.7 -44.2 10.7 -35.2
-25.9 25.7 -50.2 14.1 -36.3
34.3 -8.3 -8.7 8.1 25.4
43.1 -7.0 -16.4 10.5 30.1
71.2 -10.4 -17.0 12.7 56.4
106.5 -12.1 -28.2 14.2 80.3
128.5 -11.8 -44.3 15.1 87.5
110.0 -18.4 -51.1 15.6 56.2
163.9 -22.0 -77.7 19.6 83.8
94.0 -18.9 -62.2 18.1 30.9
152.5 -25.3 -75.3 17.3 69.2
Developed economies Trade balance Services, net Income, net Current transfers, net Current-account balance Japan Trade balance Services, net Income, net Current transfers, net Current-account balance United States Trade balance Services, net Income, net Current transfers, net Current-account balance Europea Trade balance Services, net Income, net Current transfers, net Current-account balance EU-15 Trade balance Services, net Income, net Current transfers, net Current-account balance New EU member States Trade balance Services, net Income, net Current transfers, net Current-account balance Economies in transitionb Trade balance Services, net Income, net Current transfers, net Current-account balance
168
World Economic Situation and Prospects 2012
Table A.18 (cont’d) 2002
2003
2004
2005
2006
2007
2008
2009
2010
-14.1 3.5 0.0 5.6 -5.0
-18.6 6.2 -0.6 7.3 -5.7
-22.6 6.7 -0.3 9.1 -7.1
-23.1 7.3 -1.0 9.5 -7.3
-25.5 8.1 -1.2 10.2 -8.5
-34.3 9.9 -1.9 11.0 -15.3
-44.6 11.8 -3.0 11.2 -24.7
-29.4 9.6 -2.7 11.8 -10.7
-25.0 9.4 -2.7 11.3 -7.0
48.9 -11.8 -8.8 2.2 30.6
62.3 -13.3 -15.8 2.9 36.2
94.7 -17.2 -16.8 3.1 63.9
130.8 -19.5 -27.3 4.3 88.2
156.0 -20.0 -43.2 4.5 97.2
147.2 -28.4 -49.2 3.9 73.5
212.4 -33.8 -74.5 7.4 111.4
125.7 -28.8 -59.4 5.4 42.9
180.0 -35.3 -72.3 5.0 77.4
222.0 -55.4 -118.6 79.6 127.1
295.2 -55.5 -118.8 102.2 222.2
358.1 -50.1 -140.6 117.1 283.1
550.6 -57.0 -192.0 149.5 450.0
753.5 -64.0 -163.9 186.5 710.5
817.4 -69.8 -158.8 208.0 795.1
844.1 -114.4 -177.2 234.1 784.5
507.5 -121.6 -171.6 209.3 422.3
643.8 -130.6 -212.3 221.9 520.8
137.6 -62.3 -27.2 -10.2 38.4
185.5 -68.2 -31.7 -8.4 77.8
257.1 -75.7 -48.1 -7.3 127.6
407.1 -90.3 -64.8 5.3 260.2
526.0 -110.6 -43.4 13.3 388.2
532.9 -148.5 -45.5 6.0 349.3
711.8 -209.9 -62.6 2.6 446.8
347.9 -193.0 -55.7 -8.9 92.3
539.1 -207.3 -89.2 -11.9 233.9
84.4 6.9 -91.4 89.8 88.7
109.7 12.8 -87.1 110.6 144.4
101.0 25.5 -92.4 124.4 155.5
143.5 33.4 -127.2 144.2 189.8
227.4 46.7 -120.6 173.2 322.3
284.5 78.7 -113.3 202.0 445.9
132.3 95.5 -114.5 231.5 337.8
159.6 71.3 -115.9 218.2 330.0
104.8 76.7 -123.1 233.9 286.9
22.1 -12.6 -54.1 29.8 -14.9
43.8 -12.8 -58.2 37.9 10.6
59.2 -13.5 -68.1 44.8 22.4
82.4 -16.8 -80.9 53.1 37.9
101.5 -17.9 -95.2 64.0 52.5
72.6 -23.0 -98.8 66.7 17.4
46.6 -31.3 -110.1 66.9 -27.9
54.7 -32.0 -102.4 57.6 -22.1
48.7 -48.0 -116.8 61.0 -55.0
7.1 -9.2 -23.0 18.5 -7.3
15.9 -8.9 -27.0 20.9 0.0
33.9 -11.6 -34.1 25.3 12.1
65.2 -15.8 -44.5 31.2 35.0
95.3 -17.7 -40.4 49.4 85.0
96.5 -30.8 -51.5 56.5 69.0
115.4 -54.9 -60.7 64.1 61.7
3.9 -48.4 -43.7 61.0 -28.5
48.2 -53.6 -59.9 63.6 -3.6
South-Eastern Europe Trade balance Services, net Income, net Current transfers, net Current-account balance Commonwealth of Independent Statesc Trade balance Services, net Income, net Current transfers, net Current-account balance Developing economies Trade balance Services, net Income, net Current transfers, net Current-account balance Net fuel exporters Trade balance Services, net Income, net Current transfers, net Current-account balance Net fuel importers Trade balance Services, net Income, net Current transfers, net Current-account balance Latin America and the Caribbean Trade balance Services, net Income, net Current transfers, net Current-account balance Africa Trade balance Services, net Income, net Current transfers, net Current-account balance
169
Annex tables
Table A.18 (cont’d) 2002
2003
2004
2005
2006
2007
2008
2009
2010
61.2 -23.4 -6.8 -11.0 20.0
83.0 -21.8 -10.2 -11.4 39.6
113.2 -24.4 -8.7 -11.4 68.7
184.7 -28.0 -8.1 -8.8 139.8
237.4 -45.6 5.2 -14.1 182.9
223.2 -63.8 10.8 -26.0 144.1
343.2 -90.9 3.5 -30.0 225.8
166.3 -83.6 -3.6 -38.8 40.3
259.7 -92.5 -12.2 -45.5 109.4
139.4 -10.9 -27.3 14.5 115.7
168.1 -13.9 -15.7 19.6 158.1
182.1 -7.2 -22.5 24.7 177.1
255.7 -6.7 -47.9 33.2 234.2
370.7 0.7 -24.9 37.8 384.4
483.4 24.0 -10.5 50.6 547.5
448.5 30.0 1.7 62.5 542.7
403.7 16.9 -7.8 50.4 463.3
404.3 35.1 -5.0 57.4 491.8
-7.7 0.8 -7.3 27.9 13.6
-15.5 1.9 -7.7 35.2 13.9
-30.3 6.6 -7.2 33.7 2.9
-37.4 10.3 -10.6 40.8 3.1
-51.4 16.5 -8.7 49.4 5.8
-58.2 23.7 -8.7 60.2 17.1
-109.7 32.7 -11.5 70.6 -17.8
-121.1 25.3 -14.0 79.2 -30.7
-117.1 28.3 -18.4 85.4 -21.8
0.8 28.8 -109.5 -53.0 -133.5
30.8 46.4 -87.3 -57.7 -68.7
7.7 103.4 -34.5 -75.0 0.2
20.2 132.2 -69.1 -80.3 1.8
101.3 193.3 -62.4 -39.1 191.7
149.1 290.0 -73.1 -74.9 289.4
122.0 283.6 -131.1 -77.6 194.7
157.1 211.1 -59.9 -84.8 222.3
247.4 236.0 -44.4 -100.1 336.9
Western Asiad Trade balance Services, net Income, net Current transfers, net Current-account balance East Asia Trade balance Services, net Income, net Current transfers, net Current-account balance South Asia Trade balance Services, net Income, net Current transfers, net Current-account balance World residuale Trade balance Services, net Income, net Current transfers, net Current-account balance
Sources: IMF, World Economic Outlook, September 2011; and IMF, Balance of Payments Statistics. a Europe consists of EU-15, new EU member States plus Iceland, Norway and Switzerland. b Includes Georgia. c Excludes Georgia, which left the Commonwealth of Independent States on 18 August 2009. d Data for Iraq not available prior to 2005. e Statistical discrepancy.
170
World Economic Situation and Prospects 2012
Table A.19 Net ODA from major sources, by type, 1990-2010 Percentage distribution ODA as a Total ODA of ODA by type, 2010 percent- (millions age of GNI of dollars) Bilateral Multilateral
Growth rate of ODA (2009 prices and exchange rates)
Donor group or country Total DAC countries
Total (United Nations and United Other) Nations
19902000
20002007
2008
2009
2010
2010
2010
Total
-0.6
4.6
11.3
1.0
6.5
0.32
128 728
71.1
28.9
4.6
24.3
Other
Total EU
-0.2
5.4
9.7
-0.5
6.7
0.46
70 150
63.0
37.0
4.8
32.1
Austria Belgium Denmark Finland Francea Germany Greece Ireland Italy Luxembourg Netherlands Portugal Spain Sweden United Kingdom
11.1 0.0 4.5 -4.8 -4.2 -1.1 … 14.9 -6.9 17.3 2.6 5.4 3.9 0.9 4.2
13.7 4.7 -1.7 7.3 4.9 6.2 2.8 15.6 7.1 7.0 1.6 -0.7 11.9 6.8 4.6
-11.4 13.9 0.2 10.7 2.1 6.9 28.7 7.2 13.1 0.6 4.2 22.7 23.8 4.2 25.4
-31.7 12.0 3.3 13.5 19.0 -11.7 -11.7 -18.3 -31.2 3.9 -4.7 -14.6 -1.3 7.8 12.1
8.8 19.1 4.3 6.9 7.3 9.9 -16.2 -4.9 -1.5 -0.3 2.2 31.5 -5.9 -7.1 19.4
0.32 0.64 0.90 0.55 0.50 0.38 0.17 0.53 0.15 1.09 0.81 0.29 0.43 0.97 0.56
1 199 3 000 2 867 1 335 12 916 12 723 500 895 3 111 399 6 351 648 5 917 4 527 13 763
50.8 67.9 70.8 62.1 59.8 63.0 41.4 66.6 30.1 66.0 75.4 61.0 67.6 64.5 64.4
49.2 32.1 29.2 37.9 40.2 37.0 58.6 33.4 69.9 34.0 24.6 39.0 32.4 35.5 35.6
4.2 4.9 9.9 10.9 1.8 2.5 2.0 8.6 3.2 14.1 8.9 2.1 4.2 13.9 3.6
45.0 27.2 19.3 27.0 38.4 34.5 56.6 24.8 66.8 19.9 15.7 36.9 28.1 21.7 32.0
Australia Canada Japan New Zealand Norway Switzerland United States
1.8 -2.8 0.9 3.0 0.5 2.3 -3.3
5.3 5.1 -5.4 5.3 6.0 3.2 9.0
5.6 13.1 10.5 11.6 -5.0 7.9 18.7
-1.7 -9.6 -10.3 -3.2 16.9 11.7 8.1
12.1 12.7 11.8 -3.9 3.6 -4.5 3.5
0.32 0.33 0.20 0.26 1.10 0.41 0.21
3 849 5 132 11 045 353 4 582 2 295 30 154
90.1 75.2 66.3 78.4 79.2 75.0 86.6
9.9 24.8 33.7 21.6 20.8 25.0 13.4
1.8 5.4 5.0 9.9 11.2 7.1 2.9
8.1 19.5 28.7 11.6 9.6 17.9 10.4
Source: UN/DESA, based on OECD/DAC online database, available from http://www.oecd.org/dac/stats/idsonline. a Excluding flows from France to the Overseas Departments, namely Guadeloupe, French Guiana, Martinique and Réunion.
171
Annex tables
Table A.20 Total net ODA flows from OECD Development Assistance Committee countries, by type, 2001-2010 2001
2002
2003
2004
2005
2006
2007
2008
2009
2010
Net disbursements at current prices and exchange rates (billions of dollars) Official Development Assistance Bilateral official development assistance of which: Technical cooperation Humanitarian aid Debt forgiveness Bilateral loans Contributions to multilateral institutionsa
52.7
58.6
69.4
79.9
107.8
104.8
104.2
122.0
119.8
128.7
35.3
41.0
50.0
54.6
82.9
77.3
73.4
87.0
83.5
91.5
13.6 2.0 2.5 1.7
15.5 2.8 5.3 1.1
18.4 4.4 8.4 -1.1
18.7 5.2 7.1 -2.8
20.8 7.1 25.0 -0.9
22.4 6.7 18.6 -2.4
15.0 6.5 9.6 -2.3
17.2 8.8 11.1 -1.2
17.5 8.6 2.1 2.5
.. 9.5 .. ..
17.4
17.6
19.5
25.2
24.9
27.5
30.8
35.0
36.3
37.2
Source: UN/DESA, based on OECD/DAC online database, available from http://www.oecd.org/dac/stats/idsonline. a Grants and capital subscriptions. Does not include concessional lending to multilateral agencies.
172
World Economic Situation and Prospects 2012
Table A.21 Commitments and net flows of financial resources, by selected multilateral institutions, 2001-2010 Billions of dollars 2001
2002
2003
2004
2005
2006
2007
2008
2009
2010
Resource commitmentsa
72.2
95.3
67.6
55.9
71.7
64.7
74.5
135.2
193.7
245.4
Financial institutions, excluding IMF Regional development banksb World Bank Groupc International Bank for Reconstruction and Development (IBRD) International Development Association (IDA) International Financial Corporation (IFC) International Fund for Agricultural Development (IFAD) International Monetary Fund United Nations operational agenciesd
41.8 19.3 22.0
38.5 16.8 21.4
43.1 20.4 22.2
45.7 21.5 23.7
51.4 23.0 27.7
55.7 23.1 31.9
66.6 31.3 34.7
76.1 36.1 39.4
114.5 54.4 59.4
119.6 45.4 73.4
11.7
10.2
10.6
10.8
13.6
14.2
12.8
13.5
32.9
44.2
6.9
8.0
7.6
8.4
8.7
9.5
11.9
11.2
14.0
14.6
3.4
3.2
4.1
4.6
5.4
8.2
10.0
14.6
12.4
14.6
0.4 25.7 4.7
0.4 52.2 4.6
0.4 17.8 6.7
0.5 2.6 7.6
0.7 12.6 7.7
0.7 1.0 8.3
0.6 2.0 6.3
0.6 48.7 10.5
0.7 68.2 11.0
0.8 114.1 11.6
Net flows
14.9
2.0
-11.7
-20.2
-39.6
-25.9
-6.8
40.7
52.3
62.5
Financial institutions, excluding IMF Regional development banksb World Bank Groupc International Bank for Reconstruction and Development (IBRD) International Development Association (IDA) International Monetary Fund
1.4 1.7 -0.3
-11.2 -3.9 -7.3
-14.8 -8.0 -6.7
-10.2 -6.6 -3.7
0.8 -1.7 2.5
5.2 3.0 2.2
-11.4 5.9 5.5
21.8 21.2 0.7
20.4 15.5 4.9
25.1 9.8 15.4
-4.6
-12.1
-11.2
-8.9
-2.9
-5.1
-1.8
-6.2
-2.1
8.3
4.4 13.5
4.8 13.2
4.5 3.1
5.3 -10.0
5.4 -40.4
7.3 -31.0
7.2 -18.0
6.8 18.9
7.0 32.0
7.0 37.4
97.2 2.0
62.6 -10.8
47.8 -17.3
59.8 -33.0
54.9 -21.9
56.0 -5.1
97.3 29.3
146.7 39.6
183.1 46.6
Memorandum items (in 2000 purchasing power units)e Resource commitments Net flows
73.7 15.2
Sources: Annual reports of the relevant multilateral institutions, various issues. a Loans, grants, technical assistance and equity participation, as appropriate; all data are on a calendar year basis. b African Development Bank (AfDB), Asian Development Bank (ADB), Caribbean Development Bank (CDB), European Bank for Reconstruction and Development (EBRD), Inter-American Development Bank (IaDB) (including Inter-American Investment Corporation (IaIC)) and the International Fund for Agricultural Development (IFAD). c Data is for the fiscal year. d United Nations Development Programme (UNDP), United Nations Population Fund (UNFPA), United Nations Children's Fund (UNICEF) and the World Food Programme (WFP). e Totals deflated by the United Nations index of manufactured export prices (in dollars) of developed economies: 2000=100.
173
Annex tables
Table A.22 Greenhouse gas emissionsa of Annex I Parties to the United Nations Framework Convention on Climate Change, 1990-2013 Teragram CO2 equivalent
Australia
1990
2000
2006
2007
2008
2009
2010b
2011b
2012c
2013c
418
496
533
542
551
546
539
537
540
540
Cumulative Annual change growth rate between 1990 1990-2013 and 2013 1.1
29.1
Austria
78
80
90
87
87
80
83
83
85
85
0.4
9.1
Belarus
139
79
88
87
91
88
80
69
58
49
-4.4
-64.7
Belgium
143
145
138
133
135
124
125
122
117
114
-1.0
-20.5
Bulgaria
111
63
68
72
69
59
57
52
49
46
-3.7
-58.3
Canada
591
718
721
750
734
692
696
697
693
692
0.7
17.1
Croatia
31
26
31
32
31
29
28
28
28
28
-0.5
-10.9
196
148
147
148
142
134
127
126
119
113
-2.4
-42.3
Denmark
Czech Republic
69
69
73
68
65
62
57
55
52
50
-1.4
-27.7
Estonia
41
18
19
22
20
17
18
19
19
18
-3.6
-56.8
Finland
70
69
80
78
70
66
66
66
65
64
-0.4
-9.2
France
566
571
558
550
544
522
519
515
504
498
-0.6
-12.0
1 248
1 042
1 002
980
981
920
911
893
864
838
-1.7
--32.9
Germany
105
126
131
134
129
123
117
108
101
99
-0.2
-5.1
Hungary
Greece
97
77
78
75
73
67
62
60
57
55
-2.5
-43.7
Iceland
3
4
4
5
5
5
4
4
4
4
1.2
30.1
Ireland
55
68
69
68
68
62
58
58
57
54
-0.1
-2.1
519
552
564
555
542
491
509
504
507
507
-0.1
-2.3
Japan
Italy
1 267
1 342
1 333
1 365
1 281
1 209
1 235
1 231
1 240
1251
-0.1
-1.2
Latvia
27
10
12
12
12
11
8
5
3
2
-11.3
-93.6
-
-
-
-
-
-
-
-
-
-
0.4
10.3
Lithuania
Liechtenstein
50
20
24
26
25
20
19
18
17
15
-5.0
-69.0
Luxembourg
13
10
13
12
12
12
11
11
12
11
-0.7
-14.8
Malta
2
3
3
3
3
3
3
3
3
3
0.9
24.1
Monaco
-
-
-
-
-
-
-
-
-
-
-1.1
-21.1
212
213
207
205
205
199
195
195
186
179
-0.7
-15.6
Netherlands New Zealand
59
68
75
73
73
71
70
70
70
70
0.7
18.1
Norway
50
53
53
55
54
51
50
50
50
50
0.0
-0.4
Poland
453
390
405
404
400
383
367
349
328
305
-1.7
-32.7
Portugal
59
81
81
79
78
75
73
68
64
62
0.2
4.3
Romania
256
144
159
155
150
129
114
106
97
88
-4.5
-65.5
3 369
2 055
2 201
2 206
2 243
2 127
1 895
2 051
2 084
2060
-2.1
--38.9
74
49
50
48
48
43
41
37
33
29
-4.0
-60.6
Russian Federation Slovakia Slovenia Spain
18
19
21
21
21
19
19
19
19
18
0.0
-0.5
283
380
426
437
405
368
357
343
336
334
0.7
17.8
174
World Economic Situation and Prospects 2012
Table A.22 (cont’d)
1990 Sweden Switzerland
73
2000 69
2006 67
2007 66
2008 64
2009 60
Cumulative Annual change growth rate between 1990 1990-2013 and 2013
2010b
2011b
2012c
2013c
62
64
63
63
--0.6
-13.5
53
52
54
52
53
52
52
52
50
50
-0.3
-6.4
Turkey
187
297
350
380
367
370
398
428
443
467
4.1
149.6
Ukraine
933
400
447
445
432
374
371
378
399
411
-3.5
-56.0
United Kingdom United States All Annex I Parties
779
673
648
638
624
570
557
518
490
467
-2.2
-40.0
6 167
7 076
7 117
7 216
7 028
6 608
6 479
6 401
6 288
6 209
0.0
0.7
18 868 17 757 18140 18 284 17 914 16 841 16 431 16 391 16 189 15 999
-0.7
-15.2
Source: UN/DESA, based on data of the United Nations Framework Convention on Climate Change (UNFCCC) online database, available from http://unfccc.int/ghg_data/ghg_data_unfccc/time_series_annex_i/items/3814.php (accessed 10 November 2011). Note: Based on the historical data provided by the UNFCCC for the GHG emissions of the Annex 1 Parties up to 2009, DESA/DPAD extrapolated the data to 2013. The extrapolation is based on the following procedure: yy GHG/GDP intensity for each country is modelled using time-series regression techniques, to reflect the historical trend of GHG/GDP. While the trend for each individual country would usually be a complex function of such factors as change in structure of the economy, technology change, emission mitigation measures, as well as other economic and environmental policies, the time-series modelling could be considered a reduced form of a more complex structural modelling for the relations between economic output and GHG emissions. yy GHG/GDP intensity for each country is extrapolated for the out-of-sample period (2010-2013), using parameters derived from the time-series regression model. yy In some cases, the extrapolated GHG/GDP intensity for individual countries was adjusted to take account of announced emission control measures taken by Governments. yy The projected GHG emissions were arrived at using GDP estimates in accordance with the World Economic Situation and Prospects 2012 baseline forecast and the extrapolated GHG/GDP intensity. a Without land use, land-use change and forestry. b Estimated. c Baseline scenario forecasts.
United Nations publication Sales No. E.12.II.C.2 ISBN 978-92-1-109164-9 eISBN 978-92-1-055103-8
Copyright © United Nations, 2012 All rights reserved Printed at the United Nations, New York 11-55997