GENERAL
ARTICLE
What can we Learn from the Electromagnetic Spectrum? A W Joshi and Alok Kumar A W Joshi was at the Department of Physics, University of Pune, Pune. Alok Kumar is at the Department of Physics, State University of New York, USA.
Electromagnetic radiation is all around us, and essential for the survival of all lifeforms. It provides valuable information about the physical world around us, feeds us by providing energy to plants, allows us to maintain human metabolism, and cures us of various diseases. This article deals with the various properties of electromagnetic radiation, its sources and detectors, its nature, and its uses. A brief discussion on the absorption spectrum of the Earth’s atmosphere and the atmospheric windows, and celestial objects seen through optical and radio telescopes is also provided. Introduction Our perception of the physical world around us is largely based on our interaction with the range of the electromagnetic radiation (EMR) that is called visible light. Most objects scatter visible light that enters through the irises of our eyes, falls on our retina, interacts with the retinal pigment that eventually causes an electrical pulse that is transmitted to our brain through optic nerves. We feel warm in front of a fire partly because of a type of electromagnetic radiation that is called infrared radiation. Similarly, our skin gets tanned when exposed to sunlight because of certain electromagnetic radiation called ultraviolet. However, we cannot see, feel, or detect X-rays using our sense organs. This radiation does penetrate and affect our body. What is the electromagnetic radiation? What are the various ways it affects our lives? How can we produce different kinds of electromagnetic radiation? This article will provide answers to these questions.
Keywords Electromagnetic radiation, electromagnetic spectrum, atmospheric windows.
8
A Brief History Hans Christian Oersted (1777–1851), during a class demonstration in 1819, noticed that a compass needle near a wire experi-
RESONANCE March 2003
GENERAL
ARTICLE
enced deflection when current passed through the wire. Later, in 1821, Michael Faraday (1791–1867) observed current in a coil when a magnet was moved in the direction or away from the coil that was connected to a galvanometer (Figure 1). If the magnet was held stationary near the coil, no current in the coil was observed. Faraday speculated that the changing magnetic field in a coil generated a current in the coil. This phenomenon was later called electromagnetic induction. This connected the fields of electricity and magnetism. James Clark Maxwell (1831–1879), a Scottish physicist, provided a mathematical form to Faraday’s speculations and gave four equations that are popularly known as Maxwell equations. Maxwell hypothesized that since a changing magnetic field produces an electric field, a changing electric field should similarly produce a magnetic field. He also predicted that oscillations of an electric charge produce an electromagnetic field that radiates outward at a constant speed. He theoretically calculated this speed to be 300,000 kilometre per second – a speed that can allow an electromagnetic wave to move around the Earth about 7.5 times in one second. Maxwell predicted a very long range of wavelengths for this radiation – an impressive feat without much experimentation.
Figure 1. Electromagnetic induction of current in a coil.
The experimental generation and detection of the electromagnetic waves came later in 1884 when Heinrich Rudolf Hertz (1857–1894), a German physicist, used an electrical circuit with oscillating electric field. Today, a fairly large range for the electromagnetic radiation that covers from radiowaves, microwaves, infrared, visible, ultraviolet, X-rays, to g-rays are observed. Marchese Guglielmo Marconi (1874–1937), an Italian physicist, found a practical use of electromagnetic waves for communication. He used these waves, later called radio waves, for communication between two cities across the Atlantic Ocean. The high speed of these waves came very handy for long distance communication. This system was first patented in 1896 and Marconi
RESONANCE March 2003
9
GENERAL
ARTICLE
Figure 2. The spread of the electromagnetic spectrum and its seven parts, along with photon energy and wavelength.
shared the Nobel Prize in Physics in 1909 with Carl Ferdinand Braun for developing wireless telegraphy. Recently, a controversy is evolving which indicates that J C Bose of India was perhaps the inventor of the receiver device that captured the first wireless message sent across the Atlantic Ocean by Marconi. It is known that both Marconi and Bose were in London in 1896–97 and knew each other.
The Electromagnetic Spectrum The electromagnetic radiation (radiant energy) ranges in wavelength from almost zero to infinity, and the classification of the electromagnetic radiation with respect to wavelength (also energy or frequency) is referred to as the electromagnetic spectrum. Figure 2 shows the electromagnetic spectrum (EMS), which is essentially divided into seven parts for the sake of convenience. We shall see that this classification is actually related to the sources that produce these radiations. The seven parts, in a certain order, are: g-rays, X-rays, ultraviolet (UV), visible rays, infrared rays (IR), microwaves and radio waves. It is also interesting to see that the visible part lies at the centre of the spectrum, and is in fact, much too small as compared to the total spread of EMS. Though the speed of electromagnetic waves is constant in vacuum (=3 ´ 108 m/s), they propagate through material mediums at slower speeds. The speeds of propagation and wavelengths of electromagnetic waves change when they move from one medium to another. Their frequencies do not experience any change. This dependence of speed and wavelength on the medium and
10
RESONANCE March 2003
GENERAL
ARTICLE
constancy of frequency causes the separation of white light into its constituent colours when it moves via a prism. This phenomenon is known as dispersion of light. Dispersion of the visible light was known right from the days of Issac Newton (1642–1727), and in fact, in those days, this dispersion of light into seven colours was known as the spectrum of light. Later measurement techniques showed that the violet end of visible spectrum occurred at about 4000 Å (400 nm) while the red end at about 7500 Å (750 nm). This means that our eyes are sensitive only to EMR in this wavelength region. To make very rough order of magnitude estimates, one can assume that the red end occurs at 8000 Å (800 nm), which bears a simple ratio of 2 to the wavelength of the violet photon. The energy, wavelength and frequency of an EM photon are related through the equations E=hn=
hc º ,
(1)
where n and l are the frequency and wavelength of the photon, respectively, h is the Planck’s constant, and c the speed of EMR in vacuum. The frequency and wavelength of a 1eV photon (with h = 6.6 10–34 Js, and E = 1 eV = 1.6 10–19 J) are:
ν=
E 1.6 × 10 −19 J = = 2.4 × 10¹⁴ s −1 = 2.4 × 10¹⁴ Hz, − 34 h 6.6 × 10 Js
c 3 × 10 8 m/s λ= = = 1.25 × 10 − 6 m. ν 2.4 × 10¹⁴ Hz
(2)
If one uses more accurate values of all the constants, one finds that a 1 eV photon has a wavelength of l =1.240 ´ 10–6 m, or 1240 nm, and a frequency of 2.418 ´ 1014 Hz, that lies in the infrared region of the spectrum. As an easy aid to memory, one may as well take it to be 1234 nm, or 12345 Å, with less than half a percent of error, or even a round figure like 1200 nm or 12000 Å with about 3% error, which is quite tolerable when we make order of magnitude estimates.
RESONANCE March 2003
11
GENERAL
Region
ARTICLE
Wavelength Range
Energy Range
Ratio
Gamma rays
1 fm – 1 pm
1200 – 1.2 MeV
10 3
X-rays
1 pm – 10 nm
1.2 MeV – 120 eV
10 4
Ultraviolet rays
10 – 400 nm
120 – 3 eV
40
Visible light
400 – 800 nm
3 – 1.5 eV
2
Infrared rays
800 nm – 1 cm
1.5 eV – 12 meV
10 4
Microwaves
1 cm – 10 m
12 meV – 12 meV
10 3
Radio waves
10 m – 1 km
12 meV – 120 neV
10 2
Table 1. The spectrum of electromagnetic radiation, with its seven main parts and their wavelength and energy limits, and ratio of limiting values. The boundaries between successive regions are fuzzy, and not sharp as shown here.
Using this information, one can get the limiting energies of the visible region. Remember that the energy of a photon is inversely related to its wavelength. Since a 1200 nm photon has an energy of 1 eV, the violet photon and the red photon with wavelengths of 400 nm and 800 nm will have energies of 3 eV and 1.5 eV, respectively. The seven parts of the EMS are listed in Table 1, along with their approximate wavelength and energy ranges (although in principle the EMS extends to infinity, here we only discuss the measurable part of A). The ratio between the largest and the smallest wavelength, or energy, at the two extremes of each range is also shown in the last column. One can notice that the measurable part of EMS spans about 18 orders of magnitude (wavelength ratio 1 km/1 fm = 1018). Also, the visible region is very narrow in comparison to the total spread of the EMS. It covers less than a quarter order of magnitude, a pitiable limit on what our eyes can see in this Universe! Next comes the ultraviolet region with a ratio of 40 between the highest and the lowest wavelengths. The other regions have ratios of 100, 1000, or 10000. The dividing lines between various regions are fuzzy, and not sharp. When we talk of frequency, the frequency of the highly energetic gamma ray photon with l =1 fm comes out to be n = 3 ´ 1023 Hz, while that corresponding to the other end of the spectrum with l =1 km is n = 3 ´ 105 Hz or 300 kHz. The violet photon at one end of the visible region with l = 400 nm has a
12
RESONANCE March 2003
GENERAL
ARTICLE
frequency of 7.5 ´ 1014 Hz. Microwaves span the frequency range of 30 MHz to 30 GHz, while the radio waves span the range of 300 kHz to 30 MHz. It is well known that visible light passing through a refracting medium disperses into seven major colours. In increasing order of wavelength and decreasing order of energy, these are: violet, indigo, blue, green, yellow, orange, red. For example, some of the hydrogen spectrum lines fall at the following prominent wavelengths: red at 656 nm (n = 3 to n = 2), blue-green (cyan) at 486 nm (n = 4 to n = 2), and two violets at 410 (n = 6 to n = 2) and 434 nm (n = 5 to n = 2). Mercury gives prominent blue, green, and two yellow lines at 436 nm, 546 nm, 577 nm, and 579 nm, respectively. The yellow D lines of sodium lie at about 589 nm, while the He-Ne laser emits a red radiation at 633 nm.
More on the Electromagnetic Spectrum The entire length scale, from microscopic particles to the entire Universe, is shown in Figure 3. Man provides the reference point on this scale, with a height of about 1.5 to 2 m, which lies slightly above 100 m (= 1 m) on the logarithmic scale. It extends from 10–18 m to 1026 m. We have superposed the EMS on this length scale once again for comparison and a better understanding of the interaction between different phenomena. As seen in Table 1, the EMS goes from 10–15 m (1 fm) to 103 m (1 km). When light falls on the leaves of a tree, the photons are captured by molecules called chlorophylls, where the photons carry out an excitation process similar to the photoelectric effect in plants. Mostly photons around 650 nm (red) and 400 nm (violet) are absorbed. The remaining light is reflected. Thus plants reflect EM radiation in the range of 500 to 600 nm. This wavelength region falls in green colour. No wonder the tree leaves mostly appear green when exposed to sunlight, and show an amazing variety of green depending on the exact wavelength which they reflect. A change in absorption or reflection causes leaves to change their colours. This absorbed energy triggers photosyn-
RESONANCE March 2003
13
GENERAL
Figure 3. The entire range of scale from the microscopic electron to the Universe, with man at the centre.
14
ARTICLE
thesis in plants. Thus, plants gain energy to survive when exposed to sunlight and die in its absence. In humans, vitamin A, when oxidized yields retinal – a pigment used in our vision. This retinal absorbs visible light from 380 nm to 750 nm, the resulting electron excitation causes a conformational change in the membrane-associated pigment, which triggers a nerve impulse. This is how we see various objects around us. Some insects have eye pigments that absorb at lower wavelengths than humans do. As a result, bees can ‘see’ ultravio-
RESONANCE March 2003
GENERAL
ARTICLE
let light but are blind to red light while humans are blind to ultraviolet light. Cats, owls and many smaller insects can ‘see’ in the dark. This is due to the fact that their eyes are sensitive to IR radiation, which is constantly emitted by all objects such as the surface of the Earth, trees, walls, furniture and everything, because of their ambient temperature. It is known as thermal radiation. The ‘night goggles’ that collect infrared radiation and convert them to visible light work on the same principle. Infrared cameras are used to detect enemy movement at night. Such instruments essentially use IR detectors or sensors, which convert IR rays emitted by objects in to visible rays. Most remote controls use IR radiation which is detected by sensors in a television or an air conditioner. IR radiation has a very limited range in air and therefore these instruments operate only at small distances. Walkie-talkie instruments used by police, shore guards, ships, aircraft, and mobile telephones etc., work with microwaves. IR radiation can be stopped by placing a palm or even a sheet of paper in its path, while microwave radiation, which has a longer wavelength than IR, bends around such objects. Ultraviolet radiation tans the skin, activates the synthesis of vitamin D in skin, and causes sunburn, a dermatological condition, as well as skin cancer. It also inhibits the body’s immune system. This explains the occurrence of many viral diseases during summer in India. Ultraviolet radiation also destroys protein and nucleic acids in human body. For wavelengths around 290 nm, UV is germicidal and is used for the purification of water. For countries like India, it has enormous potential for producing potable water. X-rays have short wavelengths with high energies (a few hundred eV to a few MeV). They ionize air, break molecules, destroy skin cells and mutate them. It is this mutated ill-conceived growth that can easily cause cancer. For this reason, doctors avoid taking X-rays of pregnant women. On the positive side, Xrays are used to examine luggage at airports, bone conditions in
RESONANCE March 2003
15
GENERAL
Table 2. Sources and detectors of different sections of the electromagnetic spectrum.
Region
ARTICLE
Sources/Detectors
Gamma rays
Nuclear transitions; Particle decays
X-rays
Nuclei; High-Z atoms
UV
Atoms
Visible
Atoms; Molecules
IR
Molecules – electronic and vibrational transitions
Microwaves
Molecules – vibrational and rotational transitions Charged particles in magnetic fields
Radio waves
Molecules – rotational transitions; Currents in metallic structures; Charged particles in magnetic fields
humans, and locate bullets and foreign objects in humans. Gamma rays are high energy electromagnetic waves and their energy range overlaps with X-rays. The main difference is that X-rays originate from atomic electrons while g-rays originate from nuclei. Their main use is in cancer treatment by destroying localized malignant tissues in human body.
Sources and Detectors The classification of EMS into seven broad regions is based on which bodies produce EMR of that particular wavelength. It is a general principle that a body that produces electromagnetic radiation of a certain wavelength is also capable of detecting that radiation. Therefore there is not much distinction really between sources and detectors of EMR. Thus gamma rays are produced in nuclear transitions and in decays of subnuclear particles. X-rays are produced from low-energy nuclear transitions and from deeper electronic levels of high-Z atoms, and so on. Table 2 lists the sources and detectors of different parts of the EMR. We notice that the wavelength of EMR increases with the size of the source. Visible light is produced by transitions of an electron between two suitable energy levels and high-energy electronic transitions of molecules. Notice that the ground state energy level of the electron in a hydrogen atom is –13.6 eV. You can release the
16
RESONANCE March 2003
GENERAL
ARTICLE
400 nm Violet
800 nm Indigo
Blue
3 eV
Green Yellow
Orange
Red 1.5 eV
Figure 4. Energy levels of the hydrogen atom and various radiant transition series.
electron from the hydrogen atom by giving it 13.6 eV energy. This is accomplished by bombarding it by a photon. This photon will have a maximum wavelength of 1234 nm/13.6 = 90 nm. This lies in the UV region as can be seen from Table 1. Conversely, when an electron jumps from a higher orbit to a lower orbit, a photon is released. The energy or the wavelength of the photon depends on the initial and the final energy levels of the electron. For example, when an electron falls from higher levels to n = 1 level in hydrogen atom, it produces Lyman series that is in the far-UV region. For the visible region, the electron must fall from the higher level to n = 2 level, producing lines of Balmer series (Figure 4), which have an energy range from 1.89 eV (initial state, n =3) to 3.40 eV (initial state, n ® infinity). Similarly the transitions to the n = 3 level give spectral lines of the Paschen series. Since the energy of the n = 3 state is –1.51 eV, its ionization energy is just in the beginning of the IR region. Thus even the highest energy of this series is in the IR region. All the other series lines have smaller energies and therefore would be further in the IR region. The energy levels of an atom with a single electron vary as Z2/n2, which means that the energy level becomes deeper as Z increases and shallower as n increases. For example, the binding energy of a singly ionized helium atom (He+, Z = 2, n = 1) would be 54.4 eV, which would be well in the UV region. Some of the high-n transitions of this ion would lie in the visible region. In the Sun and other hot stars, highly ionized high-Z atoms have been found by the study of Sun’s spectra. All objects above zero Kelvin emit electromagnetic radiation. The peak wavelength (wavelength at maximum intensity) of the radiated EM waves is given by Wien Displacement Law. According to this law, the wavelength (lp, subscript p for peak) at
RESONANCE March 2003
17
GENERAL
ARTICLE
Figure 5. Intensity versus wavelength curve of a blackbody at different temperatures.
peak energy follows the mathematical relationship:
lpT = constant.
(3)
For a black body, the constant is found to be 2.898 10–3 mK. The peak wavelength is inversely proportional to the temperature. At higher temperature, the peak energy moves to shorter wavelengths (see Figure 5). This explains why coal, iron, and other hot objects glow at high temperatures. The average ambient temperature in the tropics is taken to be 27 °C or 300 K. Using Wien’s displacement law, the wavelength at peak-energy for this temperature comes out to be 9.66 mm. This falls in the infrared region. Using Wien’s formula and the fact that the maximum intensity of the solar radiation occurs at about 560 nm, we can calculate that the Sun’s surface temperature is about 5175 K. The visible surface of the Sun is the gaseous photosphere from which radiation escapes. It is not a thin shell, but has a thickness of a few hundred km. We know from other experimental techniques that the temperature is about 4500 K at the top of the photosphere and is about 6800 K at a depth of 260 km, the average photosphere temperature being taken as 5800 K. This also indicates that Wien’s displacement law is really applicable to a very small and perfectly black body, which the photosphere is not.
18
RESONANCE March 2003
GENERAL
ARTICLE
Molecules have three kinds of energy levels – electronic, vibrational and rotational. Electronic transitions rarely lie in the visible region, and mostly extend to the IR region. Vibrational and rotational transitions lie in IR, far-IR, microwave, and even radio wave regions. This principle is exploited in a microwave oven. This oven generates microwaves of a suitable frequency of 2.4 ´ 109 Hz (wavelength 12.2 cm), which matches with the rotational frequency of a water molecule. Water molecules absorb this radiation and start rotating with more vigour, a thermodynamic state which represents higher temperature, while no other molecule can absorb it and remains at the same temperature. All food contains water, while porcelain or steel does not, so that the food can be heated without heating the container. This selective internal heating saves a lot of time and energy too. In crystalline solids, it is found that all the atoms get coupled and vibrate together. These are known as lattice vibrations or phonons. Since a small piece of solid may contain as many as 1018–1023 atoms, the vibrational energies become too small. The maximum phonon energies are seen to be 30 meV (millielectronvolt) which corresponds to a wavelength lying in the far-IR. Thus IR radiation can excite lattice vibrations (phonons), causing the material to heat up. The n = 2 level of a hydrogen atom contains two sublevels, 2s and 2p, each being further split into 2 and 6 levels, respectively, which have slightly different energies, due to various interactions. The 2p3/2–2p1/2 transition of the electron gives out a photon with a wavelength of 21 cm, or an energy of a few hundreds of microelectron-volts. Since hydrogen is found in abundance in the Universe, it gives out this 21 cm line which is used to detect the presence of hydrogen in stars, galaxies, and other regions of the Universe. This is the famous 21 cm line of hydrogen. These lines, called the characteristic radiation (or lines), are like the fingerprints of atoms. Once the spectrum is observed, scien-
RESONANCE March 2003
19
GENERAL
ARTICLE
tists can figure out the elemental constitution of the sample. This allows us to know about the distant objects. For example, using this method, we know that the Sun has mostly hydrogen and helium. Based on the constant shift of wavelengths observed from distant astronomical objects, called red-shift, one can infer that we live in an expanding Universe – a profound conclusion from simple observations. Similar to oscillating charged particles, an accelerated charged particle also emits EMR. When a charged particle enters a magnetic field, it follows a circular or helical path, and experiences acceleration due to the Lorentz force exerted by the magnetic field. The radiation thus emitted is known as the synchrotron radiation. For magnetic fields that occur in the Sun, planets, and cosmos, calculations show that the radiation emitted lies in the microwave and radio regions of the EMS. A sudden deceleration of an electron emits radiation. A popular way to produce X-rays is to strike high-speed electrons on a dense target. Due to the impact, the electrons decelerate and produce electromagnetic radiation. Since the sudden slowdown, or ‘breaking’, is the cause of radiation, it is called bremsstrahlung, the German word for ‘breaking radiation’. These wavelengths cover a wide range of wavelengths, and are therefore called continuous X-rays. In the household radio sets, we have short wave, medium wave, and long wave bands. What do these phrases signify, and what is the reference for comparison? Since we want radio waves to propagate from the transmitting antennas to our homes, the standard for length comparison is buildings, trees, and hillocks. Therefore wavelengths of 10 to 25m are called short waves, those around 100 m are called medium waves, and those above 100 m are called long waves.
Waves or Particles? It is well known that photons show both wave and particle properties. Thus interference and diffraction can be explained
20
RESONANCE March 2003
GENERAL
ARTICLE
by wave hypothesis, while photoelectric effect and Compton effect can be explained by the particle hypothesis. The phrase wave-particle duality signifies that every photon or particle, in any experiment, has intrinsically both the properties. However, it shows only one kind of behavior in a given experiment. For example, the photoelectric effect or the Compton effect show the particle nature of a photon while an electron diffraction experiment demonstrates wave nature of an electron. In the EMS, it is seen that particle properties dominate for highenergy photons while wave properties dominate for low-energy photons. Optical region is roughly the dividing line. This is evident even in the nomenclature of the seven regions of EMS. For example, we use the terms g-rays, X-rays, ultraviolet rays, but microwaves, radio waves, etc. It is customary to use frequency or wavelength of EMR in the context of radiation on the low-energy side of visible region, and energy of the photon on the high-energy side involving UV, X-rays and g-rays. It must be understood that this picture is not entirely correct. As said earlier, all photons show both particle and wave properties. Consider the simple case of diffraction of a wave from a grating. The earliest known case is that of diffraction of visible rays from an optical grating. Visible rays have a wavelength of about half a micrometre. If the grating has a d-spacing of the same order (but slightly larger), then the rays/waves show diffraction pattern with alternating maxima and minima of intensity. On the other hand, if we allow X-rays to be incident on a crystal, this will also result in a diffraction pattern, since the X-ray wavelength is again of the same order of magnitude as the d-spacing of the crystal (d ³ l). But what happens if X-rays are incident on an optical grating, or visible rays are incident on a crystal? In the first case, we have l > d. Since l< d is the right condition for diffraction, in the case of X-rays incident on the optical grating, there is a possibility of getting a diffraction pattern. But the difficulty is that the angular resolution between the different orders is proportional to l/d, and this would be extremely small in this case. Therefore,
RESONANCE March 2003
21
GENERAL
ARTICLE
the effect is as if X-rays pass through the crystal almost undeviated. On the other hand, when visible light is incident on a crystal, we have l >> d; the wavelength is much larger than atomic spacing. The result is that the wave is not able to see atoms separately, and the effect is as if the wave has encountered a continuous wall. Large dish antennas are used to collect radio waves and microwaves, coming either from the cosmos or from artificial terrestrial sources. These receiving antennas contain a wire mesh with a spacing of a few millimetres. Since the wavelength of the waves to be detected is more than 10 cm, the wire mesh appears to them as a continuous wall or mirror, from which they are reflected and are collected at the focus. This effect is also seen in acoustic waves. The wavelength of our speech is about 10-50 cm. If these waves come across a mesh with spacing of that order, they can show diffraction. If the spacing is smaller, it will appear to the waves as a wall, and if the spacing is larger, the waves will pass through it undeflected. Another difference that can be said about radiation on the two sides of the visible region is that the radiation on the lower energy side consists more of continuous radiation and less of characteristic radiation, while on the higher energy side, the opposite is true.
Figure 6. The transmission spectrum of the Earth’s atmosphere, showing the optical and radio windows.
22
RESONANCE March 2003
GENERAL
ARTICLE
Atmospheric Window Our Earth has an atmosphere extending to over 500 km above the surface of the Earth, though almost 98% of the air mass lies within the first 35 km. All the radiation, including that from the Sun, which comes to us from the cosmos is filtered through this atmosphere. Various atoms, molecules and ions in the atmosphere absorb various characteristic radiations (fingerprint of elements). It is interesting to see the absorption or transmission spectrum of the atmosphere, which means the absorption/transmission versus wavelength of the electromagnetic radiation, throughout the EMS. This spectrum is shown in Figure 6. It is seen from here that our atmosphere has a high degree of absorption for g-rays, X-rays, UV, IR and radio waves. Gamma rays and X-rays are absorbed by nuclei and deeper electronic states in high-Z atoms. It is well known that ozone plays a major role in the absorption of UV radiation. Infrared rays are absorbed by molecules, and radio waves are absorbed by the charged particles in the ionosphere. This leaves us with the two windows as mentioned above. Figure 7 shows that transmission of EMR by atmosphere rises sharply in the region 350-1200 nm, which includes the entire visible region, and also in almost the entire microwave region
Figure 7. Transmittance of EMR by earth’s atmosphere is shown for various wavelengths.
RESONANCE March 2003
23
GENERAL
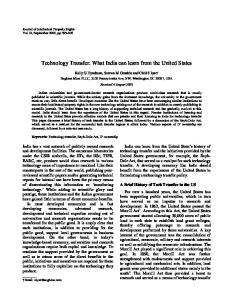
Figure 8. (a) Jupiter as seen in visible light through an optical telescope; (b) Jupiter seen through a radio telescope.
ARTICLE
(6 cm–10 m). Thus the radiation that we get on the Earth from the cosmos mainly consists of visible light and microwaves. These are called our windows to the Universe and, for historical reasons, they are known as the optical window and the radio window. The optical window has played an important role in human evolution. In the process of evolution, we evolved eyes to detect visible radiation and to see the world around us, skin for infrared radiation to maintain our body temperature, skin colour to protect ourselves from ultraviolet radiation. For this reason, only optical telescopes and radio telescopes are used on the surface of the Earth, and not of any other kind. An optical telescope shows the picture of an object as would be visible to our eyes, except that it is magnified and has a fair degree of resolution. How would a radio telescopic picture of the same object appear? To answer this, we have to go back to the sources of microwaves. These are emitted by charged particles encircling in magnetic fields. Therefore a radiophoto of a planet or a galaxy would show the structure of its magnetic field. Figure 8a shows Jupiter in visible light, while Figure 8b is a picture of Jupiter as seen by a radio telescope. It must be understood that Figure 8b doesn’t show the planet as we know it; it shows the magnetic field around it due to the charged particles encircling in it. Astro-
24
RESONANCE March 2003
GENERAL
ARTICLE
physicists like to study any celestial object through optical as well as radio telescopes. Thus they have an optical photograph and a radiophoto of the same galaxy or quasar or neutron star, etc. Obviously, the two pictures give us complementary information and are extremely useful. Similarly, a radiophoto of the Earth taken from the outer space would show its magnetic field, its distortion due to the solar wind, its tail on the side opposite the Sun, and its ionosphere. Since focusing of X-rays was a difficult task that has been mastered with better efficiency only in the last decade, scientists are now scanning the Universe in X-ray region. A high-resolution powerful X-ray telescope, known as Chandra X-ray Observatory, has been placed in Earth’s orbit to observe the world around us. It is circling the Earth in a highly elliptical orbit with an apogee of about 140,000 km and a perigee of about 10,000 km. This way, about 85% of its orbit lies above the Van Allen belts, a belt of charged particles around the Earth. This facilitates uninterrupted observations for about 55 hours in each orbit, which takes a little over 64 hours. It was put in to this orbit to examine exploding stars, black holes, colliding galaxies and high-energy cosmic phenomena. Incidentally, the Chandra Xray Observatory was named in honour of the late Nobel Laureate Subramanyan Chandrasekhar (1910-1995), an Indian–American physicist.
Suggested Reading [1] Garber Elizabeth, James Clerk Maxwell and thermodynamics, American Journal of Physics, Vol.37, pp.146-155, 1969. [2] P M Harman, The Natural Philosophy of James Clerk Maxwell, Cambridge University Press, Cambridge, 1998. [3] Se-yuen Mak, From electromagnetic induction to electromagnetic radiation, The Physics Teacher, Vol. 38, No. 7, pp. 428-9, Oct. 2000. [4] Joseph F Mulligan, Heinrich Hertz and the development of physics, Physics Today, Vol. 42, no. 3, pp. 50-7, March 1989. [5] Graeme Stephens, Remote sensing of the lower atmosphere, Oxford University Press, 1994.
RESONANCE March 2003
Address for Correspondence A W Joshi D-2 Ayodhyanagari Bhau Patil Road, Bopodi Pune 411 020, India. Alok Kumar Department of Physics State University of New York Oswego, NY 13126, USA.
25