Pain catastrophizing and back muscle endurance
1
Title: Poor back muscle endurance is related to pain catastrophizing in patients with chronic low back pain. Authors and affiliations: Christian Larivière, Ph.D. 1,4, Martin Bilodeau, PT, Ph.D.2, Robert Forget, PT, Ph.D. Vadeboncoeur, MD 4, Hakim Mecheri, Eng., M.Sc. 4
3,4
, Roger
1
Occupational Health and Safety Research Institute Robert-Sauvé, Montreal, Quebec, Canada, H3A 3C2 2 Élisabeth Bruyère Research Institute and School of Rehabilitation Sciences, University of Ottawa, 451 Smyth, Ottawa (Ontario), Canada, K1H 8M5 3 School of Rehabilitation, Université de Montreal, C.P. 6128, Succursale Centre-Ville, Montreal, Quebec, Canada, H3C 3J7 4 CRIR - Montreal Rehabilitation Institute, Montreal, Canada Address for correspondence and reprints: Christian Larivière, Ph.D. Institut de recherche Robert-Sauvé en santé et en sécurité du travail (IRSST) 505, boul. De Maisonneuve Ouest Montréal (Québec) H3A 3C2 Phone: (514) 288-1551 #217 Fax: (514) 288-6097 E-mail:
[email protected] Acknowledgements: The present research project was funded by the Occupational Health and Safety Research Institute Robert-Sauvé (IRSST) of Quebec (Canada) and the Quebec Rehabilitation Research Network (REPAR). Special thanks to Flavia Dell’Oso and Marielle Trottier for data collection and to David McFadden and Jean-François Pilon for engineering assistance. Disclosure statement: This work has not been funded by any of the following organizations: National Institutes of Health (NIH), Wellcome Trust; Howard Hughes Medical Institute (HHMI).
Pain catastrophizing and back muscle endurance
2
ABSTRACT Study Design. An experimental and comparative study of chronic low back pain (CLBP) patients and healthy controls. Objective. To use a motivation-independent electromyographic(EMG)-based test of back muscle capacity to determine whether back muscle deconditioning is present in CLBP patients and whether it is related to pain-related psychological variables. Summary of Background Data. The verification of the deconditioning syndrome in CLBP patients might be biased by the use of performance-based measures to assess physical fitness, especially in patients having fear of injury. Also, the use of lumbar-specific measures of physical fitness, such as back muscle strength and endurance, might be more sensitive to physical deconditioning than more general assessments such as aerobic capacity. Methods. A time-limited submaximal fatigue test was performed by 27 non-specific CLBP subjects (14 men) who had not had any surgery, and 31 healthy controls (17 men) while surface EMG signals were collected from back muscles. Motivation-independent EMG indices, that are sensitive to muscle fatigue or to activation patterns, were then computed and entered as input into previously developed regression equations to predict endurance (PTend) and Strength (PStrength). Between-group comparisons were completed with patients divided in subgroups based on a median split of pain intensity, fear of movement, or pain catastrophizing scores. Results. Differences between healthy and CLBP subgroups were mainly observed when patients were divided using pain catastrophizing scores (PCS). High-PCS patients showed significantly lower PTend than low-PCS patients. Various EMG indices showed comparable results to PTend. However, some of them also pointed out that the PCS-low patients were more fatigue-resistant and showed different activation patterns comparatively to healthy subjects. Conclusions. These results suggest that physical deconditioning that is specific to back muscle capacity was present in a subgroup of patients while the opposite was observed in another subgroup, pain catastrophizing being related to this outcome. These findings support previous theoretical models of pain/disability. Key Words: (1) strength, (2) fatigue, (3) physical deconditioning, (4) surface electromyography, (5) objective measures, (6) fear of movement, (7) lumbar impairment Key Points: 1. Predicted back muscle endurance was lower in CLBP patients showing high catastrophizing thoughts than in patients showing low catastrophizing 2. Various EMG variables further supported this finding 3. Some EMG variables also pointed out that the PCS-low patients had higher back muscle endurance and different activation patterns than healthy subjects. 4. These findings have physiological meanings and can support previous theoretical models of pain/disability for CLBP patients.
Pain catastrophizing and back muscle endurance
3
Mini Abstract/Précis (max 50 words ; presently 53 words) A time-limited submaximal fatigue test was performed by back pain subjects and healthy controls while back muscles EMG signals were collected. Physical deconditioning that is specific to back muscle capacity was present in a subgroup of patients while the opposite was observed in another subgroup, pain catastrophizing being related to these findings. INTRODUCTION Physical deconditioning, the end-result of the so-called deconditioning syndrome, has been suspected to result from chronic low back pain (CLBP) as well as being a cause of perpetuating pain 1. This phenomenon would result from physical inactivity and is expected to be substantiated through the different domains of physical fitness including: aerobic capacity (VO2max), different muscle characteristics (strength, endurance, power, fiber-type composition and flexibility), motor control and body composition. However, to date, studies that attempted to verify these hypotheses are somewhat conflicting 2-8. This heterogeneity of findings can be partly explained by three factors: (1) the characteristic of CLBP subjects recruited in the study, (2) the choice of the domain of physical fitness assessed and (3) the degree of objectivity of selected outcome measures. Individuals with CLBP are heterogeneous. Consequently, subgrouping CLBP subjects according to variables that are expected to influence the presence of physical deconditioning would help to highlight the deconditioning syndrome. According to the fear-avoidance model 9, pain-related psychological characteristics such as pain catastrophizing, fear of movement/(re)injury (or kinesiophobia) or fear-avoidance beliefs would represent credible factors. In line with this reasoning, low levels of physical activity have been associated with high levels of fear-avoidance beliefs and pain catastrophizing 10. Although the role of these potential factors has not been supported to explain the lower aerobic capacity of CLBP subjects 4;11, this might be different for other outcomes of physical fitness. In this specific literature, while aerobic capacity has been favored as the domain of physical fitness that should be more related to physical activity, not all types of physical activity enhance cardiovascular fitness. In fact, many work or leisure activities only challenge the cardio-vascular system to a minor extent. Consequently, aerobic capacity might not be sensitive enough to detect differences in populations for whom physical activity is primarily performed at work and during leisure activities. We propose that measures such as back muscle strength and endurance, that evaluate more specifically the lumbar area, might be more relevant if CLBP subjects actually try to limit more specifically the use of their back. Common measures of back muscle strength or relative endurance rely on the maximal performance of the patient. Unfortunately, the fact that some CLBP subjects are afraid to perform maximally during such assessments 12-14 represents a serious treat to their validity. Even electromyography (EMG)-based measures of back muscle fatigue are likely biased when the
Pain catastrophizing and back muscle endurance
4
submaximal load is determined as a proportion of the patient’s maximal strength 6;15;16. Testing the physical-deconditioning hypothesis under the fear-avoidance model requires to take into consideration that subjects who would present with lower physical activity and physical deconditioning, namely those that have fear of movement/(re)injury and catastrophizing thoughts, may also under-perform during assessments of physical fitness, which would affect the validity of the corresponding outcome measures. To bypass the detrimental effect of these pain-related psychological characteristics on the outcome measures, the superimposed electrical stimulation technique has been applied during the strength assessment of quadriceps 14. This allowed to elegantly substantiated the presence of physical deconditioning that is not necessarily specific to the lumbar area 14. Still, physical deconditioning could possibly be more apparent in back muscles but unfortunately, this technique is not realistically applicable to this muscle group. More recently, our group has developed an EMG-based assessment of back muscle capacity with the use of surface EMG of eight back muscles, namely the functional endurance test (FET). The test is time-limited (5 and 10 min in women and men, respectively) and the submaximal load is absolute (90-Nm L5/S1 extension moment) rather than relative to strength (further details in the methods section), thus not requiring measuring a given patient/individual’s strength. So far, our work on healthy adults shows that the construct validity of the task (moderate intermittent contractions) is substantiated by showing that both strength and relative endurance have a complementary impact on the performance of the test, showing that this test measures back muscle capacity as a whole 17. This task also allowed to show the expected lower back muscle endurance of men relative to women, when the 90-Nm absolute load was translated to a relative load (40% of strength), which added to its construct validity 18. EMG indices of back muscles neuromuscular activation patterns 19 and fatigue 20 have been proposed and selected (criterion validity study 19;20) based on their significant correlations with strength (r reaching up to -0.72 to -0.81) and absolute endurance (r = -0.33 to 0.69) measures. Also, the day-to-day reliability of these EMG indices ranged from moderate to excellent (intraclass correlation coefficients ranging from 0.40 to 0.83) 19;20. Finally, gender specific predictive equations of back muscle strength (men: R2 = 0.72; Error = 9 %; women: R2 = 0.25, Error = 13 %) and absolute endurance (men: R2 = 0.76, Error = 9 %; women: R2 = 0.70, Error = 17 %) have been derived using body composition (body mass index, fat free mass or percent fat) and EMG indices as input variables 21 . These predictions represent truly objective estimations of back muscle capacity. The purpose of the present study was to determine whether pain-related psychological characteristics such as pain catastrophizing and kinesiophobia are related to physical deconditioning in CLBP subjects, relative to controls, as assessed with back muscle strength and endurance. It was hypothesized that only CLBP subjects showing more fear of movement and/or more pain catastrophizing would have lower back muscle strength and decreased endurance compared with control subjects.
Pain catastrophizing and back muscle endurance
5
METHODS Subjects Thirty-two individuals with CLBP (15 women) and 32 healthy controls (17 women) aged between 18 to 55 and having a body mass index (BMI) less than 31.5 kg/m2 (women) or 33 kg/m2 (men), were recruited. However, two subjects (1 healthy women, 1 men with CLBP) were excluded due to technical problems during the data collection and four women with CLBP were excluded because unable to reach the 90-Nm plateau during the FET. The remaining subjects are described in (Table 1). Inclusion criteria for the CLBP subjects were: lumbar or lumbosacral pain with or without proximal radicular pain (limited distally to the knees); and presence of chronic pain defined as a daily or almost daily pain for at least three months. Exclusion criteria for the healthy subjects were: back pain in the preceding year or exceeding one week; surgery of the pelvis or spinal column; pregnancy. Exclusion criteria for the CLBP subjects were: surgery of the pelvis or spinal column; scoliosis; systemic or degenerative disease; one positive response to the Physical Activity Readiness Questionnaire (Thomas et al. 1992). Ten out of the 27 CLBP subjects were not at work at the time of testing (7 because of the back pain problem). The ethics committee of the Centre for Interdisciplinary Research in Rehabilitation of Greater Montreal (CRIR) approved the study and consent form. Questionnaires Three pain-related psychological variables were assessed in CLBP subjects: (1) pain intensity with a 10-cm visual analog scale (VAS), (2) fear of movement or injury with the Tampa scale of kinesiophobia (TSK) 22 and (3) pain catastrophizing with the Pain catastrophizing scale (PCS) 23. Tasks The MVCs and FET were carried out with the use of a static triaxial trunk dynamometer (Figure 1B). Firstly, two to four submaximal trunk extension contractions were performed to warm-up and to familiarize with the apparatus and the visual feedback. Then, three MVCs that consisted of 7-s progressive ramp extension efforts were performed with verbal encouragement and with the use of a visual feedback (Figure 1C). The peak MVC represented the Strength criterion. The FET consists of repeating an 8-s duration cycle comprising a 90-Nm (L5/S1 torque) static extension exertion (1.5 s ramp to reach 90 Nm + 5 s plateau at 90 Nm + 1.5 s rest; Figure 1D), again with the use of the visual feedback system (Figure 1C). Each 8-s cycle was repeated until exhaustion in healthy subjects from whom obtaining the mechanical criterion of absolute endurance (Tend = 8 s × number of cycles) was possible with the use of verbal encouragement. In CLBP subjects, the FET was time-limited to 5 min. (38 cycles) in females and 10 min. (75 cycles) in males.
Pain catastrophizing and back muscle endurance
6
Table 1. Demographic, anthropometric and clinical characteristics of the participants
Variable *
Healthy controls
CLBP patients
P values *
Men (n = 17)
Women (n = 14)
Men (n = 14)
Women (n = 13)
Pain Status
Gender
39 (10)
39 (10)
43 (10)
35 (9)
0.714
0.089
Height (m)
1.74 (0.06)
1.65 (0.09)
1.74 (0.06)
1.63 (0.09)
0.698
0.000
Mass (kg)
78 (8)
63 (7)
78 (13)
70 (14)
0.254
0.000
BMI (kg/m2)
26 (3)
23 (3)
26 (4)
26 (5)
0.128
0.247
% fat
18 (5)
24 (6)
19 (6)
27 (6)
0.325
0.000
FFM (kg)
63 (6)
48 (6)
63 (10)
50 (7)
0.471
0.000
VAS pain (cm)
/
/
3.6 (2.1)
3.1 (2.8)
/
0.561
RDQ (%)
/
/
31 (19)
23 (24)
/
0.577
TSK (score/68)
/
/
48 (8)
37 (10)
/
0.004
PCS (score/52)
/
/
26 (10)
15 (13)
/
0.017
Age (yrs)
* Probability values corresponding to the two-way ANOVAs used to assess the differences between healthy and CLBP subjects (PAIN-STATUS factor) and between sexes. T-tests were performed for the clinical variables (VAS, RDQ, TSK, PCS). BMI: Body Mass Index; % fat: percentage of body fat using skinfold measures 40; FFM: fat free mass; VAS: Visual Analog Scale of pain intensity ; RDQ: Rolland-Morris Disability Questionnaire; TSK: Tampa Scale of Kinesiophobia; PCS: Pain Catastrophizing Scale.
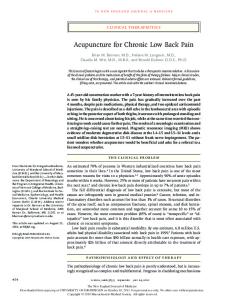
Figure 1. Experimental setup (details in the methods – measurement techniques). (A) Position of the surface electrodes at the different vertebral levels, over the multifidus at the L5 level, iliocostalis lumborum at L3 and longissimus at L1 and T10. The difficulty in capturing the multifidus muscle with surface electrodes 41 is acknowledged and therefore the validity of the electromyographic signal was assigned to the landmarked location rather than to the multifidus muscle itself; (B) The triaxial dynamometer; (C) Visual feedback displayed to the subject. For the purpose of this picture, the subject, represented by a small square, is positioned outside of the target; (D) Description of one work-rest cycle (8 s) of the functional endurance test (only 2 cycles are represented).
Pain catastrophizing and back muscle endurance
7
Surface electromyography and data processing The EMG signals from four pairs of back muscles were collected (bandpass filter: 20-450 Hz; preamplification gain: 1000; sampling rate: 1024 Hz) with active surface electrodes (Delsys Inc., MA), as detailed elsewhere 24 and depicted in Figure 1A. Briefly, from the EMG signals corresponding to the first 38 cycles (5-min. test) in women and to the first 75 cycles (10-min. test) in men, three types of EMG parameters were computed for each electrode site for each 5-s plateau: (1) the instantaneous median frequency (IMNF), (2) the signal intensity (power) contained in eight frequency bands (WINT3 to WINT10 covering the 27-364 Hz bandwidth) as calculated with the use of a wavelet filter bank, and (3) root mean square (RMS) amplitude values. Hereafter, the more generic term WINTn will be used to represent WINT3 to WINT10, n representing the wavelet number that ranged from 3 to 10. Then, EMG indices sensitive to muscle fatigue and to variable load sharing between back muscles synergists were calculated. These EMG indices are briefly described below but the reader is referred to previous papers 19;20 for a more thorough description. EMG indices of fatigue are simply the slope values of linear regressions applied to IMNF and WINTn time-series (NIMNFslp and NWINTnslp), all being sensitive to the progressive compression of the EMG frequency spectrum to lower frequencies, which is mainly attributed to the decrease in motor unit action potential conduction velocity reflecting the accumulation of metabolic products on the surface area of the recruited muscle fibers 25. Lower NIMNFslp values indicate more fatigue. NWINTnslp is computed for each wavelet (n = 3, 4, 8, 9, 10), higher NWINT3slp and NWINT4slp values (representing lower frequencies of the power spectrum) and lower NWINT8slp, NWINT9slp and NWINT10slp values (representing higher frequencies of the power spectrum) indicating more fatigue. Three types of EMG load-sharing indices were computed from the RMS time-series, as detailed elsewhere 18;19. EMGVAR basically reflects the modulation in EMG level across samples and is assumed to be sensitive to load sharing between all synergist muscles. EMGALT quantifies alternating EMG activity between two muscles with the consideration of the proportion of total time (PALT) and amplitude of alternating activation. PALT was retained as the third index. Although all EMG indices were initially computed for the different muscles (electrode sites) individually, data from certain muscles/sites were combined to reduce the number of variables and increase their reliability. More specifically, NIMNFslp comprises four indices (X-L5, X-L1, X4, M4), the letters “X” and “M” representing the mean and maximum across the electrode sites considered (n = 4 in the present case: L5 and L1 bilaterally). EMGVAR and EMGALT and PALT have indices calculated from six electrode sites (L5, L3 et L1 bilaterally). For example, PALT – L5L1 is the percentage of alternating activity between electrode sites L5 and L1. Finally, gender-specific multiple regression equations 21 were applied, using the above-described EMG indices as input, to predict Tend (PTend) and Strength (PStrength) for all healthy and CLBP subjects. In the remaining of the paper, Strength, Tend, PStrength, PTend will be called “mechanical variables” while purely EMG-based variables will be called “EMG variables”
Pain catastrophizing and back muscle endurance
8
Statistical analyses For each sex separately, the CLBP subjects were first subdivided in two subgroups according to the score of the three questionnaires, using the median as thresholds values (for men and women respectively, VAS : 2.9 and 1.9 cm, TSK : 48 and 37/68, PCS : 27 and 14/52). The use of different threshold values between sexes was mandatory because the FET involves a 90-Nm load that represents a higher relative load in women (relative to their strength), which in turn speed up neuromuscular fatigue relative to men. Consequently, subgroups not matched for sex would have biased between-group comparisons. Some of the variables were not normally distributed and thus were transformed before any statistical analyses (ANOVAs, ANCOVAs, Pearson correlations) were carried out. All analyses were done with NCSS statistical software (version 6.0 for Windows), using a significance level (alpha) of 0.05. Preliminary correlation analyses were carried out to investigate whether potential confounding variables (age, percent fat) would be associated with the mechanical and EMG variables. Only EMGVAR and age were significantly correlated (r = -0.31 to -0.42; P = 0.031 to 0.003 across the different muscles), which was accounted for using ANCOVAs, as described next. For each of the mechanical variable (Strength, PStrength, PTend), two-way ANOVAs (3 PAIN-STATUS × 2 SEX) were carried out to assess differences between the three above-defined groups (PAIN-STATUS factor). The SEX effect (but not the PAIN-STATUS×SEX interaction) was of interest here to substantiate the construct validity of the FET regression equations used to calculate PStrength and PTend. Effectively, the FET is expected leading to higher PStrength and PTend scores in men comparatively to women. For each EMG variable (NIMNFslp, NWINTnslp, EMGALT and PALT) except EMGVAR,, one-way ANOVAs were first carried out to test the PAINSTATUS factor. For EMGVAR, ANCOVAs were used to adjust for age (used as covariate), which was significant (P♀
/
/
0.003
/
♂>♀
6.1 (4.9)
0.059
0.011
0.991
♂>♀
Subgrouping according to TSK scores 301 (60)
198 (64)
231 (74)
224 (37)
271 (76)
152 (36)
0.180
0.000
0.009
♂>♀
PStrength 251 (127)
205 (14)
336 (115)
206 (23)
325 (45)
207 (27)
0.398
0.001
0.326
♂>♀
Tend
16.1 (10.5)
7.6 (4.8)
/
/
/
/
/
0.003
/
♂>♀
PTend
12.3 (8.1)
6.8 (4.3)
11.9 (6.8)
10.6 (11.5)
12.8 (6.6)
8.1 (6.9)
0.903
0.013
0.920
♂>♀
Strength
Subgrouping according to PCS scores 301 (60)
198 (64)
265 (78)
202 (59)
236 (74)
171 (43)
0.157
0.000
0.638
♂>♀
PStrength 251 (127)
205 (14)
339 (101)
228 (19)
320 (74)
188 (6)
0.174
0.001
0.262
♂>♀
Tend
16.1 (10.5)
7.6 (4.8)
/
/
/
/
/
0.003
/
♂>♀
PTend ‡
12.3 (8.1)
6.8 (4.3)
15.7 (6.8)
15.2 (10.1)
8.4 (3.0)
4.1 (3.0)
0.002
0.012
Strength
0.261 ♂>♀; 2>3
Statistically significant differences (P 3
0.011
0.004
1,2 > 3
NWINT9slp (242-301 Hz)
PCS
ANCOVA approach
Post-hoc Tests † 1,2 > 3
(27-49 Hz) VAS
ANOVA approach
NWINT9slp (242-301 Hz)
STATUS
Strength
Post-hoc Tests †
< 0.001
0.008
2>1>3
VAS
EMGVAR ‡
X6
0.014
1>3
< 0.001
0.301
1>3
TSK
EMGVAR ‡
X6
0.009
1>2
0.007
0.364
1>2
PCS
EMGVAR ‡
X6
< 0.001
2 < 1,3
< 0.001
0.540
2 < 1,3
PCS
PALT
L5-L1
0.026
1