European Journal of Orthodontics 30 (2008) 153–162 doi:10.1093/ejo/cjm101 Advance Access publication 28 February 2008
© The Author 2008. Published by Oxford University Press on behalf of the European Orthodontic Society. All rights reserved. For permissions, please email:
[email protected].
Timing effects of growth hormone supplementation on rat craniofacial growth Glen C. Bills*, Peter H. Buschang**, R. Ceen** and Robert J. Hinton*** *Private Practice, Meridian, Idaho, USA Departments of **Orthodontics and***Biomedical Sciences, Baylor College of Dentistry, Texas A&M University System Health Sciences Center, USA
Growth hormone (GH) supplementation has become a popular treatment approach for GH normal children with short stature. To investigate how the timing of GH supplementation affects the growth of the craniofacial region, three groups of GH-normal, 28-day-old female Wistar rats were examined over 4 weeks: the early group (n = 10) received two daily injections of rhGH (2 mg/kg/day) from days 1 to 28, the late group (n = 10) received two daily saline injections from days 1 to 14 (Phase I) followed by two daily injections of rhGH from days 14 to 28 (Phase II), and the control group (n = 12) received two daily saline injections from days 1 to 28. Lateral cephalometric, forelimb and hindlimb radiographs obtained weekly were scanned, standardized points digitized, and distances were measured using the Viewbox® software. Growth curves between groups were compared using multilevel iterative generalized least squares curve fitting procedures. Supplementation during Phase I in the early group produced significant treatment effects in cranial and cranial base, midface, posterior corpus, and limb lengths which varied inversely with relative maturity (percentage growth completed at the start of the study). During Phase II, GH supplementation in the early and late groups showed treatment effects as above and additional viscerocranial and mandibular measurements, but these effects were unrelated to the relative maturity of the variables. These latter results are at variance with earlier findings in GH-deficient rats, raising the possibility that that GH-normal rats may not respond to GH supplementation in a similar fashion to GH-deficient rats.
SUMMARY
Introduction Although growth hormone (GH) supplementation in growing children to augment their stature has become relatively common (Finkelstein et al., 2002), the effects of this practice on the growth of the craniofacial complex are not well understood. Craniofacial growth differs from long bone growth because it involves the interaction of a variety of tissues, each with a unique pattern and timing of growth. A ‘maturity gradient’ is a characteristic of the growth of the human craniofacial complex (Buschang et al., 1983), and implies that structures maturing more rapidly are more susceptible to the influence of external factors than the more slowly maturing structures. Craniofacial growth in GHdeficient human patients supports this concept, as certain regions of the head are affected more severely by the deficiency and respond more strongly to GH supplementation (Cantu et al., 1997; van Erum et al., 1997). Recent studies in rats, which exhibit a craniofacial maturity gradient similar to humans (VandeBerg et al., 2004a), have demonstrated that craniofacial growth retardation in GH-deficient rats is significantly correlated with the structure’s maturational status (VandeBerg et al., 2004b). Supplementation of these rats with GH produces increases in size and growth rate that co-vary with the relative maturity of each measurement (Singleton et al., 2006).
Because the age at which GH supplementation is initiated in humans varies considerably (Finkelstein et al., 2002), the interplay of this supplementation with the craniofacial maturity gradient is of interest. Because a greater proportion of structures should be ‘mature’ at later ages, the craniofacial effects of GH supplementation at an early age may differ significantly from the effects at a later age. However, highdose GH supplementation has also been demonstrated to accelerate skeletal maturation (Cantu et al., 1997; Kamp et al., 2002) and the onset of puberty (Kamp et al., 2002) in humans. The likely interaction of GH-induced maturation with the growth stimulatory effect of the supplementation is not well understood in the limbs, and may be even more complicated in the craniofacial region. The purpose of this study was to examine the effects of late versus early GH supplementation on growth of the craniofacial complex. The effects of supplementation were studied in GH-normal, female Wistar rats, which have been shown in previous studies to respond to GH supplementation (Rol de Lama et al., 2000). This model has particular relevance in the light of the growing use of GH supplementation to augment stature in children with normal levels of GH (de Zegher and Hokken-Koelega, 2005; Wit et al., 2005). The hypothesis tested was that more mature areas of the craniofacial complex will be less affected by GH supplementation during later
154 stages of development. Moreover, it was the expectation that late GH supplementation would produce effects in fewer regions and that these effects would be less in magnitude than supplementation initiated earlier in development. Materials and methods The experimental protocol was approved by the Institutional Animal Care and Use Committee of Baylor College of Dentistry. Animal model Thirty-two female Wistar rats were supplied at approximately 25 days of age and initially weighed an average of 67 g. They were individually housed in a constant environment of 21°C with a light/dark cycle of 12:12 hours, with lights on at 07:00, given water and Teklad 7002, 6 per cent mouse/rat diet (Harlan, Madison, Wisconsin) ad libitum, and allowed to acclimatize for 3 days. The animals were then randomly assigned to one of the following groups: ‘early’ (n = 10), ‘late’ (n = 10), and ‘control’ (n = 12). The ages chosen for evaluation spanned the period prior to puberty (28 days) to early puberty (38 days) to late puberty (50 days), as assessed by changes in GH pulse amplitudes and duration (Gabriel et al., 1992). This period in development coincides with the interval over which GH supplementation typically occurs in humans. GH and vehicle administration The early group was given subcutaneous injections of rhGH in vehicle, donated by Genentech (San Francisco, California, USA), from day 1 through to day 28 of the experiment. The late group was given subcutaneous injections of saline from day 1 through to day 14 followed by subcutaneous injections of rhGH from days 15 to 28. The control group received saline injections from day 1 through to day 28 of the experiment. The rhGH was administered twice daily (07:00 and 16:30 hours) in equal doses (Jansson et al., 1982; Clark et al., 1985; Isgaard et al., 1988) for a total dose of 2 mg/kg/ day body weight subcutaneously (Cittadini et al., 1997; Tei et al., 2000) in order to simulate pulsatile release that occurs in vivo. The control animals received twice-daily saline injections in weight-based volumes equivalent to those received by the animals supplemented with rhGH. The dose of rhGH ranged from 0.12 mg/day at the beginning of the experiment to 0.51 mg/day at the end of the experiment based on daily monitoring of body weight. Following conclusion of the experiment, the animals were euthanized via intraperitoneal injection of Nembutal (Abbott Laboratories, Chicago, Illinois, USA).
G. C. BILLS ET AL.
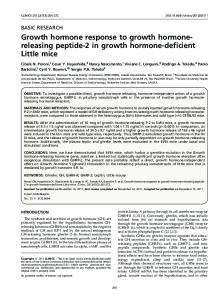
Baseline radiographs were obtained (T0), followed by four additional sets taken at days 7 (T1), 14 (T2), 21 (T3), and 28 (T4). In order to facilitate the taking of radiographs, the animals were anaesthetized with intramuscular injections of 1 ml/kg of 1:10 xylazine:ketamine. All radiographs were taken with the same standard dental unit, with machine settings at 10 mA, and 55 kV for 18/60 seconds at a distance of 10 cm from the film for the lateral cephalometric films with reductions to 8/60 seconds and 7.5 cm for the limb films. For calibration purposes, a 10-mm steel rod was embedded in the clear acrylic table on which the animals were positioned during radiographic exposure. A customized, three-point positioner was utilized to stabilize the skull while taking the lateral films. A fixed holder and midlimb rubber bands were utilized when taking the limb films to ensure complete film contact, as well as consistent positioning and orientation of the animal. Kodak ultra-speed DF-50 occlusal film was used for all radiographs. All radiographs were developed in the same automatic processor, labelled and scanned at a high resolution (600 dpi) utilizing an Epson 1600 scanner (Seiko Epson Corporation, Suwa City, Nagano Prefecture, Japan). All steps for obtaining, processing, and digitizing the radiographic films were completed by the same operator (GCB) in order to minimize error. The computer software used for digitization and measurement was Viewbox® (dHAL Software, Kifissia, Greece). This software package allows for the creation of customized analyses and also can adjust for magnification of the radiograph. Three such custom analyses created by Singleton et al. (2006) were utilized for this experiment, namely a lateral cephalometric and forelimb and hindlimb analyses. Based in part on previous studies on rodents (Kiliaridis et al., 1985; Engström et al., 1988; VandeBerg et al., 2004a; Singleton et al., 2006), cephalometric landmarks and measurements were selected (Figure 1a–c, Table 1). All radiographs were digitized twice (A and B) at intervals a minimum of 3 days apart, and the average measurement value was used for data analysis in order to ensure measurement reliability and replicability. In addition, 10 random films were selected from each film type (i.e. lateral, forelimb and hindlimb) and digitized twice to be used to calculate the method error. These last digitizations (C and D) were averaged and compared with the average value of digitizations A and B. The method error was calculated using the following formula: å(deviation) 2 / 2n . Based on replicate measurement of 12 sets of radiographs, the method errors ranged from 0.49 to 0.02 mm, with Go_Mn-Po and humerus length showing the largest errors.
Records The records consisted of body weight, and lateral head, upper limb, and lower limb radiographs. Body weight was measured daily to the nearest gram using a digital scale.
Statistical analysis Using the MLwiN® software (Centre for Multilevelling Modelling, Institute of Education, University of Bristol,
155
GROWTH HORMONE SUPPLEMENTATION
Figure 1 Location of cephalometric points on the sagittal (a), forelimb (b), and hindlimb (c) radiographs.
UK), multilevel statistical models were used to describe longitudinal absolute growth changes and to statistically evaluate group differences (Strenio et al., 1983; Goldstein, 1986, 1987). The multilevel models were composed of two parts: a fixed and a random part. The fixed part of the model estimated the polynomial parameters describing the growth curves of the various craniofacial measurements. The second, random, part of the model estimated variation at two hierarchical levels, with one level nested within the preceding level. The two levels pertained to random variation between animals and between repeats (between ages) within animals. Iterative generalized least squares methods were used to estimate the parameters. The interval from T0 to T2 was labelled ‘Phase I’ and the interval from T2 to T4 as ‘Phase II’. Separate models for each phase were fitted for each measurement in order to evaluate the effects of early and late rhGH supplementation. In order to evaluate differences in relative maturity among measurements at the start of the experiment, relative growth curves were created for each measurement by calculating the percentage of ‘adult’ status attained at each time interval. Adult status was defined as the size of the control measurement at the final (≈56 day) time interval. The relative maturity of each measurement at T0 was defined as (T0control/T4control) × 100, i.e. the percentage of T4control growth completed by the start of the experiment (T0) and at T2 (T2control/T4control) × 100, i.e. the percentage of T4control growth completed by the start of Phase II (T2).
Measurements with high relative growth for the experiment had a low maturity index and vice versa. In order to evaluate the growth response of the animals in each group, a regression of percentage growth of each measurement relative to adult control measurements was performed against the relative maturity of the structures at the beginning of each phase. Separate regressions were performed for Phase I and Phase II. Growth response during Phase I was calculated using the following formula for measurements in each group: T2early/T4control − T0early/ T4control. Likewise, growth response during Phase II was calculated using the following formula for measurements in each group: T4early/T4control − T2early/T4control. Results Absolute growth changes Control group. Weight gain continually increased during both phases, but declined in rate during Phase II. The control animals demonstrated a weight gain of 75.4 g during Phase I, 38.7 g during Phase II, and a total of 114.1 g during the course of the experiment (Figure 2 and Table 2). Limb length also increased significantly during both phases of the experiment. Absolute limb increases ranged from a low of 5.34 mm (radial length) to a high of 9.10 mm (tibial length). Although absolute growth varied, all limb measurements showed greater growth rates during Phase I than Phase II (Figure 3). Among the craniofacial measurements, absolute growth over the 28 days ranged from a low of 0.91 mm (Po–Ba,
156 posterior neurocranium height) to a high of 7.39 mm (Po–A, total skull length). The majority (87 per cent) of the growth curves (Tables 3 and 4) showed less growth during Phase II than during Phase I. For two of the 15 craniofacial measurements (E–A and Ba–Cb1), the growth rate remained the same from Phase I to Phase II. Early group versus control group. Weight gain in the early group was significantly greater during both phases than that seen in the control animals (42.6 per cent greater than the controls in Phase I, 53.8 per cent greater in Phase II; Figure 2 and Table 2). Limb measurements in the early group also demonstrated greater growth rates than controls during both Phases I and II (Tables 3 and 4). During Phase I, eight of the 15 craniofacial measurements in the early group demonstrated significantly greater growth rates than the controls following GH supplementation Table 1 Cephalometric and limb point definitions. On the sagittal radiograph A: E:
The most anterior point on the nasal bone The most inferior point of the frontal bone at the location of the frontal sinus Po: The most posterior and superior point on the skull Ba: The most posterior and inferior point on the occipital condyle Co: The most posterior and superior point on the mandibular condyle Go: The most posterior point on the mandibular ramus Mn: The junction of the mandibular ramus and corpus Gn: The most inferior point on the ramus that lies on a perpendicular bisector of the line Go–Mn B1: The most anterior and superior point on the mandibular corpus superior to the mandibular incisors So: The intersection of the most anterior tympanic bulla and the superior border of the sphenoid bone Cb1: The most anterior point on the occipital bone at the sphenooccipital synchondrosis Cb1′: The most posterior point on the sphenoid bone at the sphenooccipital synchondrosis Cb2: The most anterior point on the sphenoid bone at the sphenobasispheno synchondrosis Cb2′: The most posterior point on the basisphenoid bone at the spheno-basispheno synchondrosis Mu2: The junction of the alveolar bone and the distal surface of the third maxillary molar Mu1: The junction of the alveolar bone and the mesial surface of the first maxillary molar Bu: The most anterior-inferior point on the maxilla posterior to the maxillary incisors On the tibia Tp: The most proximal point on the tibial epiphysis Td: The midpoint of the width on the distal surface of the tibia On the femur Fp: The deepest midpoint of the proximal head and lesser trochanter Fd: The most distal point of the femur On the humerus Hp: The most proximal point on the humeral epiphysis Hd: The midpoint of the width on the distal surface of the humerus On the radius Rp: The midpoint of the width on the medial head Rd: The midpoint of the styloid process On the ulna Up: The most prominent point of the olecranon Ud: The midpoint of the styloid process
G. C. BILLS ET AL.
(Table 3). Differences in growth rates (linear) between the control and early animals ranged from 0.08 mm/7 days (Cb1′–Cb2, sphenoid bone length) to 0.60 mm/7 days (Go–Mn, posterior corpus length). During Phase II, 11 of the 15 craniofacial measurements in the early group demonstrated a significantly greater growth rate than the controls (Table 4). In contrast to Phase I, three of the four viscerocranium measurements and two of three mandibular measurements showed increased growth rates. Neurocranial measurements continued to exhibit increased rates of growth in response to GH supplementation. Only two measurements were not significantly affected by GH supplementation during either phase: occipital bone length (Ba–Cb1) and nasal length (E–A). Late group versus control group. Weight gain in the late group during Phase I (no supplementation) was slightly (0.73 g/7 days) but significantly less than in the control group. After GH supplementation during Phase II, animals in the late group demonstrated a significantly greater weight gain than the controls (Figure 2 and Table 2). Limb measurements in the late group demonstrated no differences in growth rate from the controls during Phase I. Following GH supplementation in Phase II, however, significant increases in growth rate compared with the controls were observed for all but one of the late group limb measurements. During Phase I, growth rates of the late and control groups were similar for all craniofacial variables except anterior cranial base length (So–E) and posterior corpus length (Go–Mn) (Table 3). Following GH supplementation in Phase II, significant increases in growth rate compared with the controls were demonstrated for 12 of 15 late group measurements (Table 4). Differences in craniofacial growth rates during Phase II ranged from 0.07 mm/7 days (Cb1′– Cb2, sphenoid bone length) to 0.79 mm/7 days (Po–A, total skull length). Unaffected variables included posterior neurocranium height (Po–Ba), palatal length (Mu2–Bu), and posterior corpus length (Go–Mn). Early group versus late group. Weight gain differences between the early and late groups during Phase I (Figure 2 and Table 2) were nearly identical to those observed in the early group and controls during the same interval. When
Figure 2 Weight gain (grams) over the course of the experiment (day 0 = start) for the control, early, and late-supplemented groups.
157
GROWTH HORMONE SUPPLEMENTATION
Table 2 Estimate and differences of body weight changes (grams) during Phase I (T0–T2) and Phase II (T2–T4)*. Estimates
Group differences
Constant
Linear
Quadratic
Constant
Linear
Quadratic
Phase I Early versus late Early versus control Late versus control
66.952 (2.658) 67.611 (3.833) 67.614 (4.270)
8.300 (0.250) 6.600 (0.189) 6.601 (0.217)
−0.072 (0.017) −0.092 (0.013) −0.092 (0.015)
−3.933 (3.862) −0.659 (5.810) −4.595 (6.673)
−2.469 (0.363) 1.700 (0.278) −0.729 (0.329)
0.007 (0.025) 0.210 (0.019) 0.028 (0.023)
Phase II Early versus late Early versus control Late versus control
171.104 (4.555) 144.149 (3.905) 144.150 (4.925)
3.422 (0.358) 2.418 (0.306) 2.418 (0.306)
0.129 (0.025) 0.019 (0.022) 0.019 (0.021)
−38.864 (6.618) 26.955 (5.661) −11.919 (7.344)
2.752 (0.521) 1.005 (0.478) 3.745 (0.466)
−0.111 (0.036) 0.111 (0.033) 0.000 (0.032)
Early versus late: Weightearly (Phase I) = 66.952 + (8.300 × time) + (−0.072 × time2), Weightlate (Phase I) = (66.952 + −3.933) + ((8.300 + −2.429) × time) + ((−0.72 + 0.007) × time2), time during Phase I: T0 = 0, T1 = 1, T2 = 2, time during Phase II: T2 = 0, T3 = 1, T4 = 2. *Significant differences at P < 0.05 in bold; standard error in parentheses.
Figure 3 Example of limb growth (femur length) over the course of the experiment.
both groups were receiving GH supplementation during Phase II, however, weight gain in the late group was greater than that in the early group. During Phase I, the early group demonstrated significantly higher growth rates compared with the late (unsupplemented) group for two of the five limb measurements. During Phase II, only femur length demonstrated a higher growth rate in the late group. During Phase I, differences in craniofacial growth between the early and late groups approximated a pattern seen in the early versus control group comparisons. Greater growth rates were observed in the early group animals for eight of 15 craniofacial measurements (Table 3). Following GH supplementation in both groups during Phase II, only three differences in craniofacial growth rates were evident between groups (Table 4). Occipital bone (Ba–Cb1) and posterior cranial base (Ba–So) length showed higher growth rates in the late group; palatal length (Mu2–Bu) demonstrated a higher growth rate in the early group. Relative growth changes Relative maturity of control measures. Relative maturities at T0 graded from a low of 27 per cent (weight) to a high of 90.7 per cent (Po–Ba, posterior neurocranial height), a range of 67.7
per cent (Figure 4). By the beginning of Phase II, this range had decreased to 17.7 per cent with weight remaining the most immature measurement (78.7 per cent) and anterior cranial base (So–E) being the most mature measurement (96.4 per cent). Limb measurements were less mature than craniofacial measurements at T0 with an average relative maturity of 71.2 per cent (range of 67.4–72.3 per cent). By the beginning of Phase II, the average of limb maturities had increased significantly to 88.9 per cent (range of 87.7–89.5 per cent). In the craniofacial complex, maturities reflected a gradient at T0 which ranged from 71.7 per cent (Go–Mn, posterior corpus length) to 90.7 per cent (Po–Ba, posterior neurocranial height). Craniofacial structures had an average maturity of 82 per cent but with regional differences (neurocranial 86.4 per cent; viscerocranial 80.5 per cent; mandibular 77.8 per cent). By the beginning of Phase II (T2), the range in relative maturity values had narrowed considerably. Relative growth differences between groups. Figure 5a shows the relationship between the measurements’ percentage growth response during the first 14 days (Phase I) versus their relative maturity at T0. The regression lines for the control and late groups demonstrated essentially no differences in slope and superimpose almost completely. Both display significant negative correlations (control r = −0.97, late r = −0.80) between the percentage growth response of the measurements and their relative maturity at T0. Measurements that were least mature demonstrated the greatest growth response whereas the more mature variables grew to a lesser degree. A treatment effect was evident in the early group during Phase I as demonstrated by the spread between the regression lines of the early, control, and late groups. During this phase, the regression line of the early-supplemented group (r = −0.84) and that of the unsupplemented groups exhibited a convergent pattern, indicating less response of the more mature measurements. During Phase II, following the initiation of GH supplementation in the late animals, the slope of the regression lines of the early (r = −0.85) and late (r = −0.89)
158
G. C. BILLS ET AL.
Table 3 Estimate and differences (with standard errors of estimates) of growth changes (mm) between the control, early, and late groups for Phase I (T0–T2)*. Control values
Limb measurements Radius Ulna Humerus Tibia Femur Neurocranium Po–A Po–E Ba–E So–E Ba–Cbl Cbl′–Cb2 Ba–So Po–Ba Viscerocranium E–A Mu2–Bu Cb2–Bu E–Mu1 Mandible Go–Mn Co–Gn Co–Bl
Early group differences
Late group differences
Constant
Linear
Constant
Linear
Constant
Estimate (SE)
Estimate (SE)
Estimate (SE)
Estimate (SE)
Estimate (SE)
Estimate (SE)
13.691 (0.139) 16.839 (0.168) 15.853 (0.205) 23.472 (0.345) 16.379 (0.246)
1.601 (0.092) 1.852 (0.101) 1.848 (0.068) 2.937 (0.072) 2.436 (0.064)
−0.105 (0.209) −0.219 (0.254) −0.565 (0.311) −0.086 (0.524) −0.162 (0.373)
0.209 (0.136) 0.348 (0.149) 0.367 (0.099) 0.271 (0.105) 0.307 (0.093)
−0.207 (0.225) −0.180 (0.249) −0.461 (0.339) −0.226 (0.585) −0.339 (0.416)
0.129 (0.148) 0.190 (0.170) 0.157 (0.117) 0.008 (0.118) 0.096 (0.122)
37.611 (0.321) 25.035 (0.163) 25.817 (0.189) 12.475 (0.089) 7.556 (0.089) 5.644 (0.059) 9.547 (0.104) 8.850 (0.108)
1.856 (0.101) 0.718 (0.070) 1.178 (0.068) 0.387 (0.049) 0.472 (0.043) 0.412 (0.017) 0.529 (0.063) 0.287 (0.054)
−0.071 (0.486) −0.321 (0.246) −0.288 (0.287) −0.056 (0.134) −0.089 (0.135) −0.153 (0.090) −0.479 (0.157) 0.027 (0.163)
0.524 (0.147) 0.372 (0.102) 0.324 (0.099) 0.198 (0.071) 0.105 (0.063) 0.078 (0.025) 0.339 (0.092) −0.055 (0.080)
−0.360 (0.566) −0.407 (0.289) −0.435 (0.320) −0.172 (0.146) −0.106 (0.152) −0.097 (0.107) −0.290 (0.180) −0.011 (0.161)
−0.014 (0.149) 0.189 (0.094) 0.106 (0.097) 0.137 (0.064) −0.005 (0.054) 0.024 (0.027) −0.008 (0.087) −0.102 (0.070)
13.092 (0.214) 17.017 (0.205) 19.654 (0.176) 8.354 (0.084)
1.186 (0.084) 1.020 (0.110) 1.010 (0.054) 0.517 (0.033)
0.229 (0.324) 0.191 (0.309) 0.082 (0.266) 0.026 (0.127)
0.171 (0.122) −0.3 (0.161) 0.163 (0.079) 0.066 (0.049)
−0.007 (0.345) −0.276 (0.338) −0.189 (0.295) −0.083 (0.136)
−0.218 (0.120) −0.062 (0.151) 0.026 (0.067) −0.022 (0.051)
6.643 (0.158) 8.350 (0.241) 19.071 (0.215)
0.790 (0.099) 0.796 (0.159) 0.898 (0.115)
−0.449 (239) −0.231 (0.363) 0.225 (0.324)
0.603 (0.145) 0.201 (0.235) 0.039 (0.168)
−0.145 (0.234) −0.026 (0.349) −0.105 (0.156)
0.266 (0.117) −0.152 (0.235) −0.105 (0.156)
groups were nearly identical (Figure 5b). As was the case during Phase I, a treatment effect was evidenced by the spread between the regression lines of the supplemented and unsupplemented groups. However, in contrast to Phase I, the slopes of the regression lines in the supplemented groups and the control group were essentially parallel as opposed to convergent. Discussion The findings of this study support previous reports that a growth maturity gradient exists in the craniofacial complex of rats (VandeBerg et al., 2004a,b; Singleton et al., 2006) mimicking the gradient found in humans (Buschang et al., 1983). In general, neurocranial measurements were more mature than those in the viscerocranium and mandible. Effects of GH supplementation during Phase I The early-supplemented group demonstrated a significant treatment effect during Phase I that was influenced by the relative maturity of each measurement. For more mature measurements, the spread between the regression lines of the supplemented and unsupplemented groups narrowed, suggesting that relative maturity had an inverse relationship with treatment effect. This observation is consistent with the hypothesis.
Linear
The findings during Phase I for weight gain and limb growth in the early-supplemented group were similar to those reported in other studies of GH-normal rats and mice. The weight data are comparable with the study of Miura et al. (1969) in which GH-normal, 21-day-male Wistar mice demonstrated increased weight gain following 9 days of GH supplementation. Weight gain patterns and tibial growth were also comparable between the present supplemented groups and the observations made by Rol de Lama et al. (2000) in supplemented, GH-normal Wistar rats. Singleton et al. (2006) found that supplementation in GH-deficient rats produced differences in virtually all craniofacial measurements, and that the magnitude of this effect varied inversely with the relative maturity of the measurement. In the present study, differences were detected in somewhat fewer variables, but the magnitude of the effect was also inversely proportional to relatively maturity (Figure 5a). Data from GH-supplemented Snell dwarf mice (Rice et al., 1997) showed a similar relationship (Figure 3, see Buschang and Hinton, 2005). Effects of GH supplementation during Phase II A treatment effect was observed for the majority of measurements in both the early- and late-supplemented groups during Phase II. However, the magnitude of those effects did not appear to be related to relative maturity. In addition, treatment effects in supplemented rats during Phase
159
GROWTH HORMONE SUPPLEMENTATION
Table 4 Estimate and differences (with standard errors of estimates) of growth changes (mm) between the control, early, and late groups for Phase II (T2–T4)*. Control values
Limb measurements Radius Ulna Humerus Tibia Femur Neurocranium Po–A Po–E Ba–E So–E Ba–Cbl Cbl′–Cb2 Ba–So Po–Ba Viscerocranium E–A Mu2–Bu Cb2–Bu E–Mu1 Mandible Go–Mn Co–Gn Co–Bl
Early group differences
Late group differences
Constant
Linear
Constant
Linear
Constant
Linear
Estimate (SE)
Estimate (SE)
Estimate (SE)
Estimate (SE)
Estimate (SE)
Estimate (SE)
16.976 (0.149) 20.613 (0.186) 19.592 (0.192) 29.402 (0.303) 21.344 (0.200)
0.976 (0.084) 1.362 (0.097) 1.192 (0.081) 1.585 (0.071) 1.477 (0.060)
0.290 (0.216) 0.448 (0.270) 0.149 (0.278) 0.374 (0.439) 0.266 (0.290)
0.282 (0.122) 0.190 (0.141) 0.302 (0.118) 0.391 (0.103) 0.340 (0.088)
−0.070 (0.245) 0.107 (0.314) −0.247 (0.319) −0.330 (0.514) −0.404 (0.351)
0.275 (0.130) 0.193 (0.148) 0.291 (0.125) 0.389 (0.105) 0.530 (0.074)
41.586 (0.268) 26.561 (0.188) 28.237 (0.195) 13.300 (0.119) 8.519 (0.084) 6.511 (0.065) 10.626 (0.087) 9.384 (0.089)
1.705 (0.078) 0.541 (0.061) 0.671 (0.079) 0.235 (0.053) 0.203 (0.041) 0.371 (0.020) 0.245 (0.057) 0.189 (0.053)
0.429 (0.389) 0.299 (0.276) 0.294 (0.284) 0.324 (0.173) 0.109 (0.122) −0.023 (0.094) −0.107 (0.126) −0.102 (0.129)
0.705 (0.113) 0.524 (0.089) 0.427 (0.115) 0.269 (0.078) 0.037 (0.059) 0.072 (0.029) −0.011 (0.082) 0.204 (0.077)
−0.812 (0.488) −0.255 (0.294) −0.400 (0.291) 0.002 (0.144) 0.002 (0.144) −0.113 (0.115) −0.362 (0.156) −0.154 (0.131)
0.792 (0.104) 0.398 (0.093) 0.530 (0.107) 0.159 (0.072) 0.233 (0.058) 0.070 (0.029) 0.305 (0.073) 0.150 (0.076)
15.635 (0.169) 19.253 (0.215) 21.756 (0.153) 9.470 (0.081)
1.171 (0.083) 0.506 (0.122) 1.012 (0.052) 0.321 (0.045)
0.142 (0.246) −0.761 (0.312) 0.199 (0.222) 0.079 (0.118)
0.232 (0.121) 0.685 (0.178) 0.377 (0.076) 0.166 (0.065)
−0.658 (0.266) −0.670 (0.386) −0.261 (0.248) −0.251 (0.119)
−0.448 (0.109) −0.320 (0.208) 0.395 (0.070) 0.198 (0.068)
8.421 (0.158) 10.000 (0.180) 21.112 (0.180)
0.418 (0.0116) 0.427 (0.143) 0.718 (0.117)
0.654 (0.265) −0.142 (0.262) −0.076 (0.261)
0.245 (0.169) 0.481 (0.207) 0.604 (0.169)
0.237 (0.237) −0.540 (0.271) −0.621 (0.289)
0.221 (0.164) 0.456 (0.205) 0.672 (0.156)
Po–Acontrol (Phase I) = 37.610 + (1.853 × time), Po–Alate (Phase I) = (37.610 + −0.360) + ((1.853 + −0.014) × time), time during Phase I: T0 = 0, T1 = 1, T2 = 2, time during Phase II: T2 = 0, T3 = 1, T4 = 2. *Significant differences at P < 0.05 in bold. *Significant differences at P < 0.05 in bold.
II were often of a greater magnitude than during Phase I; both of these observations are contrary to the hypothesis. The parallel slopes of the regression lines of the supplemented and control groups (Figure 5b) suggest that although a treatment effect was observed during Phase II, all measurements were affected in a similar manner by GH supplementation, regardless of maturational status. This is an unexpected result that contrasts with the findings of Singleton et al. (2006). One possible explanation for this may be that the range of variation in the maturities of the measurements was much narrower during Phase II (range = 9.9 per cent at T2) than during Phase I (range = 23.3 per cent at T0). As one would expect variables with a similar maturity to demonstrate similar treatment effects, this narrower range, combined with a small sample size, could have made the detection of small treatment effects difficult. Another possible explanation may relate to the characteristics of the present sample. The experiment followed the animals from 28 to 56 days of age, whereas the animals used by Singleton et al. (2006) were followed from 21 to 42 days of age. Consequently, the findings of the present research that most closely support results of Singleton et al. (2006) are those that occurred during the overlapping interval from 28 to 42 days of age (Phase I of this study). A third possibility is that
GH supplementation accelerated the relative maturity of the more immature variables, resulting in a more parallel relationship of the regression lines of the supplemented and unsupplemented groups. High-dose GH supplementation in GH-normal, short stature children has been shown to accelerate bone maturation and result in the early onset of puberty (Kamp et al., 2002). Unfortunately, no data are available regarding maturational changes following GH supplementation in the present samples. It was expected that late GH supplementation would produce effects in fewer regions and that these effects would be lower in magnitude than if supplementation had been initiated earlier. Both of the Phase II-treated groups showed persistent treatment effects in neurocranial variables, and pronounced treatment effects in viscerocranial and mandibular measurements not evident in Phase I-treated animals. It may be significant that the animals in this study were GH-normal as opposed to the GH-deficient animals in the study of Singleton et al. (2006), which raises the possibility that GHnormal animals respond differently to GH supplementation than animals with a GH deficiency. GH-normal male Wistar rats exhibit no treatment effect for weight or tibial length following GH supplementation, perhaps because their growth
160
G. C. BILLS ET AL.
Figure 4 Relative growth curves for craniofacial variables and limb lengths in the control animals. Percentage maturity was calculated as (value at T0 divided by value at T4) × 100.
Figure 5 (a) Relationships between relative maturity at T0 (based on mature controls) and percentage growth response relative to mature controls: Phase I. (b) Relationships between relative maturity at T2 (based on mature controls) and percentage growth response relative to mature controls: Phase II.
rate is so rapid as to be insensitive to exogenous GH (Rol de Lama et al., 2000). Although Rol de Lama et al. (2000) observed a treatment effect in GH-normal females, as also found in the present investigation, it is possible that the
viscerocranial and mandibular measurements in the female rats were growing so rapidly during Phase I as to be insensitive to GH stimulation, but that their somewhat slower growth rate in Phase II rendered them susceptible to the stimulatory
161
GROWTH HORMONE SUPPLEMENTATION
effects of GH. Under this scenario, the slower growing neurocranial variables, as well as all measurements in GHdeficient animals, would presumably be able to respond to GH supplementation during both periods. It is also possible that secretion of GH was reduced by negative feedback in normal animals once additional GH was administered by injection, an effect that may not have occurred in GHdeficient level animals with much lower basal secretion rates. Although GH levels were not measured in the current study, Rol de Lama et al. (2000) found a significant reduction in circulating GH levels following exogenous GH administration; however, their females were still responsive but their males were not. This mechanism may partly explain the variant responses to GH administration observed between the GHnormal and GH-deficient groups. A final point of interest concerns the greater heterogeneity of growth responses in the craniofacial measurements compared with the limbs. All limb variables, as well as craniofacial measurements in the controls, demonstrated a similar pattern in stimulated animals: a reduction in growth rate in Phase II compared with Phase I (Figure 3). In contrast to this consistent pattern of growth response, craniofacial measurements demonstrated a variable pattern in growth rate change between Phases I and II. For some craniofacial measurements (posterior corpus length, Go–Mn; total cranial base length, Ba–E; anterior cranial base length, So– E; occipital bone length, Ba–Cb1, and posterior cranial base length, Ba–So), absolute growth rates decreased during Phase II as in the limbs and body weight. For other variables, however, absolute growth rates increased during Phase II: total skull length (Po–A), posterior neurocranial height (Po–Ba), nasal length (E–A), palate length (Mu2–Bu), midface length (Cb2–Bu), and total mandibular length (Co– B1). For the remaining measurements, no appreciable change in absolute growth rate was observed between Phases I and II: ramus height (Co–Gn), cranial vault length (Po–E), sphenoid bone length (Cb1–Cb2), and viscerocranial height (E–Mu1). This diversity in Phase II responses to GH supplementation is intriguing, and may reflect the varied nature of the growth sites (synchondrosis, secondary cartilage, sutures, etc.) in the craniofacial region.
Figure 6 Change in relative size of a very mature variable compared with a very immature variable from T0 to T4.
GH-supplemented group than in the control animals. As a result, Po–Ba was relatively larger in the early group prior to treatment and relatively smaller after treatment. Although many studies support early supplementation of GH, the age at which treatment begins varies in the literature: 5.1 years (van Erum et al., 1997), 8.6 years (Cantu et al., 1997), and 10 years (Poole et al., 1982). This is of significance since early supplementation could result in treatment effects which are graded based on the various maturities of the craniofacial structures resulting in disproportionate growth. In contrast, later supplementation may be less effective in terms of its influence on limb growth. The possible maturational effect of GH certainly warrants further study as this effect could work as an antagonist to the desired goals of treatment. A recent study has suggested that due to this effect, GH therapy may not be beneficial to GH-normal children (Kamp et al., 2002), while another investigation has suggested that GH supplementation of GH-normal children may actually be detrimental, resulting in shorter statures than may have been attained naturally (Kawai et al., 1997). Other studies of GH therapy for idiopathic short stature question whether the more modest effects and higher required doses/costs are justified by the unpredictable psychological benefits and possible sideeffects (Allen, 2006; Hindmarsh and Dattani, 2006). The present data suggest that the effect of GH supplementation on craniofacial structures may differ depending on whether the child is GH-deficient or GH-normal.
Clinical implications Several studies have speculated that GH supplementation might produce iatrogenic disproportions in the growing craniofacial complex (Cantu et al., 1997; Singleton et al., 2006). The possibility of disproportionate growth in this sample is demonstrated by looking at the ratios of a very mature (Po–Ba) and very immature (Go–Mn) measurement at T0 compared with T4 in the supplemented and unsupplemented groups (Figure 6). Because the lines intersected and cross around T2, this suggests that either the more mature measurements grew disproportionately slower or that the immature measurements grew disproportionately faster in the
Conclusions 1. The early-supplemented group demonstrated a significant treatment effect during the pre-pubertal period (Phase I) that covaried inversely with each variable’s relative maturity. 2. Few differences between growth rates of the late group compared with the early group existed during the postpubertal period (Phase II). 3. A treatment effect was present in supplemented animals during Phase II, but this effect did not appear to be related to relative maturity as in Phase I.
162 4. During Phase II, craniofacial growth rates were more variable in the supplemented animals than in the control animals. 5. These data suggest that growing GH-normal rats may not respond to GH supplementation in a similar fashion to GH-deficient rats. Address for correspondence Robert J. Hinton Department of Biomedical Sciences Baylor College of Dentistry 3302 Gaston Avenue Dallas TX 75246 USA E-mail:
[email protected] Funding American Association of Orthodontists Foundation (to RJH) and Baylor College of Dentistry intramural research funds (to GCB). Also by intramural funds from Baylor College of Dentistry and the Department of Orthodontics. Acknowledgements The authors would like to thank Christopher King and Gerald Hill for their technical assistance and Genentech (San Francisco, California, USA) for their donation of the rhGH used in the study. References Allen D B 2006 Growth hormone therapy for short stature: is the benefit worth the burden? Pediatrics 118: 343–348 Buschang P H, Hinton R J 2005 A gradient of potential for modifying craniofacial growth. Seminars in Orthodontics 11: 219–228 Buschang P H, Baume R, Nass G G 1983 A craniofacial growth maturity gradient for males and females between 4 and 16 years of age. American Journal of Physical Anthropology 61: 373–381 Cantu G, Buschang P H, Gonzalez J L 1997 Differential growth and maturation in idiopathic growth-hormone-deficient children. European Journal of Orthodontics 19: 131–139 Cittadini A et al. 1997 Consequences of growth hormone deficiency on cardiac structure, function, and beta-adrenergic pathways: studies in mutant dwarf rats. Endocrinology 138: 5161–5169 Clark R G, Jansson J-O, Isaksson O, Robinson I C A F 1985 Intravenous growth hormone: growth responses to patterned infusions in hypophysectomized rats. Journal of Endocrinology 104: 53–61 de Zegher F, Hokken-Koelega A 2005 Growth hormone therapy for children born small for gestational age: height gain is less dose dependent over the long term than over the short term. Pediatrics 115: 458–462 Engström C, Jennings J, Lundy M, Baylink D J 1988 Effect of bone matrixderived growth factors on skull and tibia in the growing rat. Journal of Oral Pathology 17: 334–340 Finkelstein B S, Imperiale T F, Speroff T, Marrero U, Radcliffe D J, Cuttler L 2002 Effect of growth hormone therapy on height in children with idiopathic short stature: a meta-analysis. Archives of Pediatric and Adolescent Medicine 156: 230–240
G. C. BILLS ET AL.
Gabriel S M, Roncancio J R, Ruiz N S 1992 Growth hormone pulsatility and the endocrine milieu during sexual maturation in male and female rats. Neuroendocrinology 56: 619–625 Goldstein H 1986 Multilevel mixed linear model analysis using iterative generalized least squares. Biometrika 73: 43–56 Goldstein H 1987 Multilevel methods in educational and social research. Oxford University Press, New York Hindmarsh P C, Dattani M T 2006 Use of growth hormone in children. Nature Clinical Practice, Endocrinology & Metabolism 3: 260–268 Isgaard J, Carlsson L, Isaksson O G P, Jansson J-O 1988 Pulsatile intravenous growth hormone (GH) infusion to hypophysectomized rats increases insulin-like growth factor I messenger ribonucleic acid in skeletal tissues more effectively than continuous GH infusion. Endocrinology 123: 2605–2610 Jansson J-O, Albertsson-Wikland K, Eden S, Thorngren K G, Isaksson O 1982 Effect of frequency of growth hormone administration on longitudinal bone growth and body weight in hypophysectomized rats. Acta Physiologica Scandinavica 114: 261–265 Kamp G A et al. 2002 High dose growth hormone treatment induces acceleration of skeletal maturation and an earlier onset of puberty in children with idiopathic short stature. Archives of Diseases in Childhood 87: 215–220 Kawai M, Momoi T, Yorifuji T, Ymanaka C, Sasaki H, Furusho K 1997 Unfavorable effects of growth hormone therapy on the final height of boys with short stature not caused by growth hormone deficiency. Journal of Pediatrics 130: 205–209 Kiliaridis S, Engström C, Thilander B 1985 The relationship between masticatory function and craniofacial morphology. I. A cephalometric longitudinal analysis in the growing rat fed a soft diet. European Journal of Orthodontics 7: 273–283 Miura F, Nunota E, Hanada K, Ohyama K, Noguchi K 1969 Effect of growth hormone on growth and development of the dentofacial complex in the young rat. A study by means of longitudinal roentgenographic cephalometrics. Bulletin of the Tokyo Medical and Dental University 16: 109–122 Poole A E, Greene I M, Buschang P H 1982 The effect of growth hormone therapy on longitudinal growth of the oral facial structures in children Dixon A D, Sarnat B G (eds).Factors and mechanisms influencing bone growth. Alan R. Liss, New York, pp. 499–516. Rice D P C, Roberts G J, Thomas M L 1997 Catch-up growth induced by growth hormone in the craniofacial skeleton of the Snell strain of the hypopituitary dwarf mouse. European Journal of Orthodontics 19: 141–150 Rol de Lama M A, Perez-Romero A, Tresguerras J A F, Hermanussen M, Ariznavarreta C 2000 Recombinant human growth hormone enhances tibial growth in peripubertal female rats but not in males. European Journal of Endocrinology 142: 517–523 Singleton D A, Buschang P, Behrents R, Hinton R J 2006 Craniofacial growth in growth hormone-deficient rats following growth hormone supplementation. American Journal of Orthodontics and Dentofacial Orthopedics 130: 69–82 Strenio J, Weisberg H I, Bryk A S 1983 Empirical Bayes and estimation of individual growth-curve parameters and their relationship to covariates. Biometrics 39: 71–86 Tei T M, Kissmeyer-Nielsen P, Christensen H, Flyvbjerg A 2000 Growth hormone treatment increases transmural colonic growth in GH-deficient dwarf rats. Growth Hormone and IGF Research 10: 85–92 VandeBerg J R, Buschang P H, Hinton R J 2004a Absolute and relative growth of the rat craniofacial skeleton. Archives of Oral Biology 49: 477–484 VandeBerg J R, Buschang P, Hinton R J 2004b Craniofacial growth in growth hormone-deficient rats. Anatomical Record 278: 561–570 van Erum R, Mulier M, Carels C, Verbeke G, de Zegher F 1997 Craniofacial growth in short children born small for gestational age: effect of growth hormone treatment. Journal of Dental Research 76: 1579–1586 Wit J M et al. 2005 Growth hormone (GH) treatment to final height in children with idiopathic short stature: evidence for a dose effect. Journal of Pediatrics 146: 45–53