LU TP 03-06 March 2003
TIME-DEPENDENT TRANSCRIPTIONAL CHANGES IN A BREAST CANCER CELL LINE CAUSED BY HYPOXIA
Naomi Glarner Master Thesis in Bioinformatics
Thesis Advisors: Ingrid Hedenfalk and Markus Ringnér Division of Pathology Department of Laboratory Medicine Malmö University Hospital Complex Systems Division Department of Theoretical Physics Lund University
Breast cancer is the most common form of malignant disease affecting women in the Western World. Nearly 50% of locally advanced breast cancers exhibit areas of hypoxia which is associated with poor prognosis. The aim of this project was to investigate the time dependency of transcriptional changes due to in vitro hypoxia treatment of a breast cancer cell line. cDNA microarrays containing 27,000 clones were used to analyze gene expression patterns at different time points of hypoxia treatment. A time series analysis of the microarray data was performed to reveal genes exhibiting specific patterns of expression. Hypoxia treatment affected the expression of genes involved in glucose metabolism, apoptosis, cell cycle progression and angiogenesis. Notably, the genes involved in glucose metabolism were induced earlier than cell cycle regulatory genes. Furthermore, Lysyl Oxidase-like 2, a gene recently implicated in breast cancer invasion, was strongly upregulated by the hypoxic treatment. This may be one of the several mechanisms by which hypoxia affects the malignant progression of tumors.
Populärvetenskaplig sammanfattning: Hur undviker en tumör att kväva sig själv? Cellerna är kroppens byggstenar. Olika celler har olika funktioner och cellerna samarbetar i balans med varandra för att vi ska få en fungerande kropp. Vid cancer har den normala funktionen hos celler rubbats och cancercellerna fungerar inte längre i balans med resten av kroppens celler utan blir fler och fler tills de bildar en tumör. Efter hand kan vissa cancerceller lämna tumören och vandra iväg till andra områden i kroppen där de bildar en ny tumör, en s k metastas. Om en tumör bildar metastaser är det mycket svårt att bota sjukdomen som då ofta blir dödlig. När en tumör blir större och större bildas områden i tumörmassan med brist på syre eftersom blodkärlen runt tumören inte räcker till för att ge alla celler syre. Många tumörceller slutar då att växa och dör, men vissa anpassar sig till den låga syrehalten och blir tyvärr farligare för kroppen än de celler som inte har syrebrist. Dessa celler signalerar till sin omgivning att de vill ha mer syre och får omgivningen att bilda nya blodkärl. Dessutom försöker dessa tumörceller rymma från tumören till en annan plats i kroppen där de kan bilda metastaser. Därför är det viktigt att hitta en behandling som hejdar de förändringar som sker vid syrebrist i en tumör. Jag ville undersöka vad som mer exakt händer med tumörceller när vi utsätter dem för syrebrist. När förändras cellerna och hur blir de farligare? Sker vissa förändringar tidigare än andra? Den cancerform jag undersökte var bröstcancer. Det är en av de vanligaste cancerformer som drabbar kvinnor och ungefär en av tio svenskor kommer att drabbas av bröstcancer under sin livstid. För att undersöka hur bröst cancer-celler påverkas av låg syrehalt utsatte vi våra celler för syrebrist under olika tidslängder. Det visade sig att vissa förändringar sker tidigare än andra, till exempel förändras cellens sätt att bilda energi tidigt medan cellens kontroll av sin egen tillväxt förändras senare. Dessutom såg vi förändringar som pekar på att cellerna lättare kan vandra iväg och bilda nya tumörer. Resultaten har ökat vår förståelse för vad som får tumörceller att anpassa sig till syrebrist och kan kanske hjälpa oss att hitta nya, bättre behandlingsmetoder mot cancer i framtiden.
1
INTRODUCTION Cancer cells suffer from defects in their regulation of cell proliferation and homeostasis. Tumorigenesis is considered to be a multistep process and each step represents genetic alterations that drive the transformation of normal cells into highly malignant derivatives. Hanahan and Weinberg [1] have proposed six essential alterations in cell physiology that control malignant growth; - Self-sufficiency in growth signals - Insensitivity to antigrowth signals - Evasion of apoptosis - Limitless replicative potential - Sustained angiogenesis - Tissue invasion and metastasis Several of these alterations involve control of the cell cycle. The cell cycle is the fundamental means by which cells duplicate their contents and then divide into two. The cell cycle is divided into four phases: G1 phase (integrating mitogenic and growth inhibitory signals and making the decision to proceed, pause or exit the cell cycle) S phase (DNA synthesis) G2 phase (preparing for the division process) M (mitosis, cell division) The cell cycle is regulated by the synthesis and destruction of cyclins that associate with and activate cyclin-dependent kinases (CDKs) [2]. To control the passage through the cell cycle there are different checkpoints which may inhibit the cell cycle progression due to e.g. a lack of growth factors, or if the cell contains damaged DNA. The control over proliferation is disturbed in cancer cells and several genes which are mutated in cancer cells are involved in the progression of the cell cycle. For a summary of the cell cycle, see Figure 1.
Figure 1. A schematic figure of the cell cycle phases. During Gap 1 phase the cell receives signals to make the decision to proceed, pause or exit the cell cycle. During S phase, the cell replicates its DNA, In Gap 2 phase, the cell is increasing its volume and making a second copy of all organelles for the new cell. During Mitosis (M) the cell is divided into 2 daughter cells. S: S phase, G2: Gap 2 phase, M: Mitosis, G1: Gap 1 phase.
The traditional approach to improve understanding of the molecular basis of cancer has been to study the behavior of individual genes. It is however well known that multiple interconnected pathways are involved. The development of large-scale gene expression profiling tools has made it possible to investigate the global variation in transcriptional expression profiles, thus providing a more comprehensive overview of the complex network of underlying genetic defects leading to the development of cancer.
2
BREAST CANCER Breast cancer is the most common form of cancer affecting women in Europe, North America and other Western countries. Women in the Western world are estimated to have a lifetime risk of approximately 10% to develop breast cancer (described by Hedenfalk, 2002 [3]). As with other solid tumors, breast cancer development is considered to be a multi-step process, accumulating genetic and epigenetic alterations which lead to increased aggressiveness. Risk factors for breast cancer Approximately 5-10% of all breast cancer cases exhibit a familial pattern of incidence. BRCA1 and BRCA2 are two major breast cancer susceptibility genes, and germ line mutations in these genes account for 15-20% of breast cancer that clusters in families and less than 5% of overall breast cancer [4]. Female mutation carriers of BRCA1 have a lifetime breast cancer risk of 60-80%. The corresponding lifetime risk for BRCA2 mutation carriers is estimated to be 60-85% (reviewed by Nathanson et al., 2001 [4]) . Most breast cancers are however sporadic in origin and little is known about the underlying genetic defects. Other risk factors for breast cancer reported in the literature include early menarche, late menopause, late first birth, nulliparity, obesity, alcohol consumption, hormone replacement therapy and excessive radiation exposure [5]. Estrogen, progesterone and breast cancer Estrogen and progesterone and their receptors (ER and PR) play an important role in the development and function of the mammary gland and appear to also play a significant role in the development, progression, treatment and outcome of breast cancer [6]. One-third of all breast cancers lack ER and PR expression and this is associated with less differentiated tumors and poorer clinical outcome. ER is a target for endocrine therapy by e.g. tamoxifen (an anti-estrogen). However, only ~50% of patients with ER-positive (ER+) tumors and ~75% of patients with ER+ and PR+ tumors will respond to endocrine therapy [7]. There are many possible mechanisms for this lack of response to endocrine therapy. As an example, there are indications that ER may be heterogeneously expressed in ER+ tumors and that the expression may be downregulated by e.g. hypoxia which interferes with the activity of tamoxifen, as discussed below.
HYPOXIA Tissue hypoxia results from deregulated proliferation of malignant cells and an insufficient supply of oxygen (O2) due to structurally and functionally disturbed microcirculation. Solid human tumors frequently contain regions that are deficient in oxygen. Nearly 50% of locally advanced breast cancers exhibit hypoxic and/or anoxic areas [8].
HYPOXIA AS A PROGNOSTIC FACTOR Tumor hypoxia does not depend on clinical tumor size, clinical stage, histological type, grade or extent of necrosis, and is therefore considered to be an independent prognostic factor for overall and disease-free survival for e.g. squamos cell carcinomas of the uterine cervix and of the head and neck [9]. Hypoxia is associated with a poor prognosis as it has been shown to reduce sensitivity to conventional treatment and increase malignant progression [10].
3
Treatment resistance There are multiple mechanisms by which hypoxia may confer treatment resistance, such as a reduced generation of free radicals (due to lack of oxygen) and inhibition of cell proliferation. The drug delivery to hypoxic areas may also be challenged since tumor hypoxia itself arises from insufficient vasculature. Furthermore, hypoxia may downregulate the expression of the estrogen receptor [11] and may therefore contribute to the acquired resistance to hormonal therapy in breast cancer. - The radiation dose required to achieve the same biological effect is 2.8-3 times higher in the absence of oxygen than in the presence of normal levels of oxygen [9]. - Several cytotoxic drugs have been shown to be oxygen dependent [9]. Malignant progression The progression of many types of cancer can be divided into distinct stages in which tumors gradually develop aggressive phenotypic traits. The final stage of the progression is the development of cell variants showing invasive growth in surrounding normal tissues and metastatic spread to distant organs [12]. Figure 2 illustrates the role of hypoxia in malignant progression. Hypoxia has been implicated in promoting metastasis in several studies [13]. Hypoxia may promote metastasis in different ways, not only by inducing the expression of genes involved in metastasis but also by providing selection pressure for a more aggressive phenotype. Hypoxia has also been shown to induce point mutations, deletions and gene amplifications which can have an impact on the clonal selection of more aggressive cells [12].
Figure 2. The importance of hypoxia in malignant progression. Hypoxia is a result of the deregulated proliferation and the insufficient circulation. Hypoxia causes genomic instability and an increased selection pressure which leads to the clonal selection of more aggressive cells. Reprinted from Höckel and Vaupel (2001) [14].
To illustrate hypoxia-mediated selection of tumor cells with a reduced apoptotic potential Graeber and colleagues performed an experiment where embryonic fibroblasts derived from wild-type and p53-deficient mice were investigated. They mixed p53+/+ (wt) cells with p53-/- cells in a 1000:1 ratio. After submitting the cells to multiple rounds of hypoxia and aerobic recovery the p53-/- cells had overtaken the p53+/+ cells [15].
4
THE CELLULAR RESPONSE TO HYPOXIA Cellular responses to hypoxia provide the essential compensatory mechanisms to increase the delivery of oxygen and nutrients, while removing the waste products of metabolism. HYPOXIA-INDUCIBLE FACTOR 1 (HIF-1) HIF-1 (Hypoxia-inducible factor 1) is the master regulator of oxygen homeostasis [16]. HIF-1 is a transcription factor composed of a 120 kDa HIF-1α and a 91-94 kDa HIF-1β (also known as aryl hydrocarbon receptor nuclear translocator: ARNT) subunit. Both subunits contain a basic helix-loop-helix (bHLH) DNA binding domain and a Per/ARNT/Sim (PAS) domain (Figure 3). HIF-1β is a constitutive nuclear protein while HIF-1α is inducibly expressed. HIF-1α epression is mainly regulated at the level of protein synthesis and degradation. Hypoxia has been shown to only have a transient effect on HIF-1α mRNA levels [17], increasing mRNA levels after 30-60 minutes of hypoxic treatment but returning to baseline levels after 4 hours. Under normoxic conditions the oxygen-dependent degradation (ODD) domain of the HIF-1α protein is hydroxylated on proline residues 402 and 564 by HIF-1α prolyl-hydroxylases which require oxygen, ferrous iron and 2-oxoglutarate for activity [18]. This hydroxylation allows HIF-1α binding to the tumor suppressor Von Hippel-Lindau (VHL) which causes HIF-1α to be ubiquitinated and degraded by the proteasome. The carboxy-terminal trans-activation (TA) domain is hydroxylated by an oxygen-dependent asparaginyl hydroxylase which blocks the interaction with the CBP/p300 coactivator (Figure 3).
bHLH
PAS
ODD/TA
TA
Figure 3. Schematic illustration of HIF-1α's functional domains. HIF-1α contains a basic helix-loop-helix (bHLH) domain for DNA binding and a Per/ARNT/Sim (PAS) domain for interaction with HIF-1β. The oxygen-dependent degradation (ODD) domain is hydroxylated during normoxic conditions at two proline residues yielding binding to VHL and subsequent degradation. The carboxy-terminal transactivation (TA) domain interacts with coactivator CBP/p300 during hypoxic conditions. During normoxic conditions it is subjected to asparaginyl hydroxylation which blocks the interaction with CBP/p300.
Under hypoxic conditions HIF-1α is not hydroxylated and therefore escapes the recognition by VHL and subsequent proteasome degradation. Stabilized HIF-1α is translocated to the nucleus where it interacts with HIF-1β (ARNT) and other co-factors such as CBP/300 and the DNA polymerase II (Pol II) complex. HIF-1, together with its cofactors, binds to genes containing hypoxia responsive element (HREs) and activates transcription (for a summary see Figure 4). HIF1α is not only regulated by the O2 concentration of the cell but has also been shown to be stabilized during normoxic conditions by many growth factors and cytokines [19], e.g. insulin, insulin-like 5
growth factors 1 and 2 (IGF-1, IGF-2), interleukin-1β (IL-1β), epidermal growth factor (EGF), fibroblast growth factor 2 (FGF-2), tumor necrosis factor α (TNF-α), platelet-derived growth factor (PDGF) and transforming growth factor β (TGF-β). Most of these growth factors might stabilize HIF-1α via common cellular kinase pathways (Figure 4). Figure 4. Schematic model of oxygen sensing and HIF-1 regulation. Under hypoxic conditions HIF-1α is stabilized, enters the nucleus and activates gene expression. Under normoxic conditions HIF-1α is hydroxylated, targeting HIF-1α for pVHL-mediated proteolytic destruction. bHLH; basic helix-loop-helix, HBS; HIF-1 binding site, HRE; hypoxia response element, ODD; oxygendependent degradation, PAS;PerAhR/ARNT-SIM, TA; transactivation, UB; ubiquitin. Reprinted from Wenger 2002 [19].
HIF-1 TARGET GENES Over 40 HIF-1 target genes have been identified [16] which encode proteins that play key roles in several biological processes, including angiogenesis/vascular remodeling, glucose transport, glycolysis, pH regulation, cell adhesion, coagulation, iron transport, cell proliferation and apoptosis (Box 1).
Box 1. Examples of HIF-1 target genes (See ref. [16]). Angiogenesis and vascular remodeling Adrenomedullin | Endothelin-1 | Vascular endothelial growth factor (VEGF) Glycolysis and glucose uptake Aldolase A and C | Enolase 1 | Glucose transporter 1 and 3 (GLUT-1 and -3) | Hexokinase 1 and 2 | Lactate dehydrogenase A | Glyceraldehyde 3- phsophate dehydrogenase (G3PD)| Phosphofruktokinase L (PFKL) | Phosphoglycerate kinase 1 | Pyruvate Kinase M (PKM) Iron transport and pH regulation Transferrin | Transferrin receptor | Carbonic anhydrase 9 (CA IX) Cell proliferation and apoptosis Insulin-like growth factor 2 (IGF-2) | NIP3/NIX Cell adhesion and coagulation Collagen type V, α1 | prolyl-4 hydroxylase α(I)
6
Glucose metabolism The primary pathway for generation of ATP in eukaryotic cells under normoxic conditions involves the oxygen-dependent tricarboxylic acid (TCA) cycle. Tumor cells are characterized by an increase in the oxygen-independent glycolytic metabolism, even in the presence of high O2 concentrations, a phenomenon known as ”the Warburg effect” [20]. Glucose transport into tumor cells is also increased. Hypoxia has been shown to increase the glycolytic pathway and glucose transport into the cells, as HIF-1 has been shown to mediate transcriptional activation of several steps in the glycolysis, and also the uptake of glucose (Box 1). The end product of glycolysis is lactate. A correlation between lactate production and metastasis has been reported for uterine cervix and head and neck tumors [21]. Angiogenesis Tumor growth beyond a volume of 1-2 mm3 has been shown to require neovascularization [22]. Angiogenesis is the development of new blood vessels from the existing vasculature. Tumor angiogenesis occurs as a result of increased expression of angiogenic factors and decreased expression of anti-angiogenic factors. Vascular endothelial growth factor (VEGF) is a major inducer of angiogenesis and is known to be upregulated by hypoxia (Box 1). There is a strong correlation between VEGF expression and blood vessel density and clinical outcome in several tumor types [23]. Other angiogenic factors are also induced by hypoxia, e.g. platelet derived growth factor (PDGF), endothelin, insulin-like growth factor 2 (IGF-2) and epidermal growth factor (EGF) [24]. Apoptosis Apoptosis, or programmed cell death, is induced by hypoxia by several different pathways; -
HIF-1 activates Bcl-2 and nineteen-kilodalton interacting protein-3 (BNIP3) and Nip3-like protein X (NIX) expression (two pro-apoptotic proteins) in many tumor types, as well as in endothelial cells and macrophages [25].
-
HIF-1 promotes p53-dependent apoptosis [26]. Dephosphorylated HIF-1 directly interacts with p53 and may promote apoptosis by stabilizing the p53 protein. p53 induces the expression of for example the pro-apoptotic protein Bax.
THE cDNA MICROARRAY TECHNOLOGY The cDNA microarray technology allows for parallel analysis of the expression of thousands of genes, hence it is possible to investigate the global variation in transcriptional expression profiles [27]. Figure 5 schematically illustrates the main principle for the cDNA microarray technology. cDNA arrays are produced by robotic spotting of PCR products of approximately 0.6-2.4 kb [28], representing specific genes, onto a matrix (typically a glass microscope slide). Total RNA is extracted from the samples of interest, reverse transcribed into cDNA and labeled with fluorochromes. Typically, a reference sample is labeled with a certain fluorochrome and an experimental sample with another. The labeled cDNA is pooled and allowed to co-hybridize to the microarray. The slide is then scanned at different wavelengths and the ratio of the two fluorescence intensities at each spot is calculated and represents the relative expression of that gene in the experimental sample compared to the reference.
7
Figure 5. Overview of the cDNA microarray technology. Control (reference) and experimental RNA is reversibly transcribed and differentially labeled with fluorochromes and co-hybridized onto a matrix containing robotically printed cDNA clones representing individual genes. The slides are scanned at two different wavelengths and the images are superimposed, yielding an image of the ratio of the intensities where genes upregulated in the experimental sample compared to the reference sample appear red and genes down-regulated appear green. Reprinted from Hedenfalk et al., 2002 [29].
The goal of a microarray experiment is to measure the mRNA expression of thousands of genes in a sample. Further on, the expression profile of a certain experimental sample should be comparable to another experimental sample yielding the relative expression between for example a treated sample and an untreated sample. However, there are many sources of variation in a microarray experiment which need to be acknowledged and reduced if possible. To produce good quality microarray data there are many considerations [30]. Some of these are presented here: Probes The ideal microarray for global expression profiling contains a large number of sequence-validated probes in which each sequence shows minimal cross-hybridization to related sequences and therefore represents the expression of a certain gene and not its homologues. The arrangement of spots on the slide can impact the analysis of microarray data [31]. For example groups of spots printed by the same pins may lead to correlations among those spots. The position of the spots should be randomized to minimize correlations due to for example differences in background intensity. Printing substrates Spotted arrays are typically printed on glass slides. There are several different commercial slides available with different coating material, affecting the durability and the degree of background and signal intensity. RNA labeling Initial labeling protocols were based on “direct labeling” where the reverse transcription reaction incorporated fluorescently labeled nucleotides. The labeled nucleotides are difficult to incorporate using regular enzymes and there may be “dye biases” when rates of incorporation differ between dyes. To avoid these problems one may use an “indirect labeling” where an amino-allyl modified dUTP is used in the reverse transcription reaction. The dyes are coupled to the free amine group on the amino-allyl dUTP after the reverse transcription.
8
Reference RNA cDNA arrays are generally used as a two-label system in which two RNA samples are separately labeled, mixed, and hybridized together to each array. A ratio of the intensity of hybridization of the two samples is calculated for each probe. The use of the same standard reference RNA for all arrays results in a standardization of the hybridization intensity with regard to variation in size and shape of corresponding spots on different arrays [32]. Therefore, more than two experimental samples are comparable. Data analysis The measured intensity for each spot represents the sample's expression level for that given gene. For this to be true different transformations need to be carried out [33]. A filtering step may be performed to eliminate questionable or low-quality measurements due to for example low spot intensity in comparison to the surrounding background (signal-to-noise ratio). Normalization of the data adjusts the individual hybridization intensities such that comparisons can be made. Normalization adjusts differences due to e.g. unequal amounts of starting RNA, differences in labeling efficiency and systematic biases in the measured expression levels. An example of a systematic bias is the indications that low intensity spots (weak hybridization) show greater variance in their measured ratios than high intensity spots. Locally weighted linear regression (lowess) analysis is a normalization method that may reduce some intensity-dependent effects. Interpreting the data Microarrays may generate tens of thousands of data points for each performed experiment. To make sense of the data, systematic methods are needed. There are several different tools available for the analysis and organization of large-scale expression data. The selection of an adequate method for analyzing the data depends on the nature of the performed experiment and which questions are to be answered. Grouping together genes with similar patterns of expression is a natural interest in several experiments. This is frequently performed by using agglomerative hierarchical clustering methods where all data instances start in their own clusters, and the two most similar clusters are merged. This process of merging is repeated until a single cluster remains. Relationships among genes are frequently represented by a tree whose branch lengths reflect the degree of similarity between the objects.
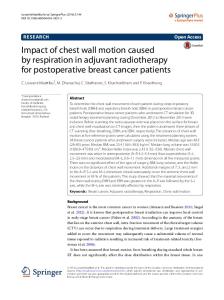
FLOW CYTOMETRY Flow cytometry allows for the measurement of physical and chemical characteristics of cells as they travel in suspension, one by one, past a sensing point. Most modern cytometers use a laser as a light source and collection lenses placed in front of the light source and at right angles of the light source. By computerized translation of the signals to data one may measure for example cell size, shape and any cell component that can be detected by a fluorescent compound [34]. CELL CYCLE ANALYSIS To measure the abundance of cells in the different stages of the cell cycle one may stain the DNA of the cells with propidium iodide (PI). PI intercalates double-stranded DNA and upon binding the 9
fluorescence is enhanced ~20- to ~30-fold and its fluorescence maximum is shifted ~30-40 nm to the red. Since PI also binds to RNA one needs to treat the cells with RNase together with PI to distinguish between RNA- and DNA-binding. One important aspect of DNA analysis is to exclude cell doublets since these may interfere with the analysis of single cells. In order to analyze the different stages of the cell cycle it is general praxis to create a DNA histogram (see Figure 6) and gate the features corresponding to the cell cycle stages (either subjectively or mathematically), yielding a percentage of cells in each phase. Figure 6. A DNA histogram. The highest peak corresponds to the G1/G0 phase and the second peak to G2/M. In between the peaks is the S phase. Since cell doublets are excluded before this analysis, the cells in G2, which have 2 x the normal amount of DNA are not confused with cell doublets.
AIMS OF THIS STUDY The aims of this study were to investigate the changes of global expression profiles and cell cycle progression due to in vitro hypoxia treatment of a breast cancer cell line. We wanted to investigate the time dependency of different responses to reveal which responses occur early due to the hypoxic treatment and which occur after a longer time.
10
MATERIALS AND METHODS For a detailed description of the methods used see Appendix B.
CELL LINE The breast carcinoma cell line MDA-MB-468 was obtained from ATCC (Rockville, MD) and derives from a pleural effusion from a 51-year-old black female patient with metastatic adenocarcinoma of the breast. MDA-MB-468 is estrogen receptor (ER) negative with a point mutation in codon 273 of the p53 gene resulting in an Arg -> His substitution.
CELL CULTURE The cell line was cultured in RPMI 1640 medium, supplemented with 1mM NaPyr, 1.5 g/L NaBic, 10% FCS, 50 µg/ml streptomycin and 50 IU/ml penicillin.The cells were subcultured once a week and the medium was renewed twice between subculturing. The cultures were incubated at 37oC in a water-saturated atmosphere containing 5% CO2 in the air.
HYPOXIA TREATMENT 0.8 x 10⁵ cells were seeded per cm2 in 150-cm2 and 25-cm2 cell culture flasks the day before the treatment started such that they were logarithmically growing at the start of the experiment. At time point 0 the medium was renewed. The hypoxic cells were renewed with medium submitted to hypoxia for ~15 hrs and the control cells were renewed with regular medium. Hypoxic cells were placed in a humid hypoxic chamber containing 1% O2, and 5% CO2 at 37oC and control cells were cultured with 20% O2, 5% CO2 at 37oC. In the first experiment hypoxic and control cells were harvested after 0, 6 and 24 hrs by trypsinization. In the second experiment the cells were harvested after 0, 12 and 48 hrs. All harvested cells were washed twice in PBS and the cells used for RNA extraction were fixed in TRIzol, a mono-phasic solution of phenol and guanidine isothiocyanate (Life Technologies, Inc., Rockville, MD). The cells used for the flow cytometry experiment were fixed in 70% ethanol. All samples were stored at -20oC until analysis.
FLOW CYTOMETRY The cells were pelleted and resuspended in 800 µl Vindelov's propidium iodide solution (see Appendix B) for labeling the DNA, and incubated for 30 minutes at 4oC. Immediately before the FCM analysis, the samples were suctioned through a cannula 3 times. The analysis was performed in a FACSCalibur flowcytometer (Becton Dickinson Immunocytometry Systems, San Jose, CA). A minimum of 10,000 cells per sample was collected and doublets were excluded by gating on FL2 width and FL2 area scatter. The fraction of G0/G1, S, G2-cells and dead cells were determined using manual gating based on the DNA content of the cells.
RNA ISOLATION, PURIFICATION AND LABELING Total RNA was extracted from the cells previously fixed from the different time points and treatments. The RNA isolation and purification was performed by phenol-chloroform extraction and a subsequent purification using the RNeasy kit (Qiagen, Valencia, CA) according to the manufacturers’ recommendations. The RNA was reversibly transcribed and coupled to Cy5 and Cy3 fluorochromes by indirect labeling using CyScribe Post-Labeling Kit from Amersham Pharmacia Biotech. 11
Cy5 was used to label the “reference cDNA” from time point 0 and Cy3 was used to label the “experimental cDNA” from the other time points. The labeled cDNA was subsequently purified by using the CyScribe GFX Purification Kit (Amersham Pharmacia Biotech).
MICROARRAY HYBRIDIZATION MICROARRAY SLIDES The arrays had previously been produced by using DNA targets amplified from Research Genetics Clones (ResGen, Invitrogen Corporation) by PCR. Amino-silane coated glass slides (GAPS II, Corning) printed with ~27 000 clones, by a MicroGridII robot (BioRobotics) equipped with MicroSpot2500 pins, were used for all hybridizations. HYBRIDIZATION The hybridization solutions were prepared by pooling the differentially labeled cDNAs and adding a blocking solution containing Cot-1 DNA, Poly dA and yeast tRNA. The samples were dried into pellets and resuspended in DIG-Easy/1% BSA. 8 hybridizations were performed; hypoxia 6 hours vs reference (time point 0) hypoxia 12 hours vs reference (time point 0) hypoxia 24 hours vs reference (time point 0) hypoxia 48 hours vs reference (time point 0) normal 6 hours vs reference (time point 0) normal 12 hours vs reference (time point 0) normal 24 hours vs reference (time point 0) normal 48 hours vs reference (time point 0) The hybridization solution was added to a prehybridized, and rinsed microarray slide and incubated at 42oC for 18 hours. After the hybridization the slides were washed with 2 x SSC and 0.1 % SDS, 1 x SSC, 0.1 x SSC and 0.06 x SSC and dried by centrifugation. To reduce the background, the prehybridization was performed by using the The Pronto!™ Universal Pre-Soak treatment followed by Pre-Hybridization (Corning Lifesciences). SCANNING THE SLIDES AND IMAGE ANALYSIS The arrays were scanned with an Agilent DNA Microarray Scanner (Agilent Technologies, Palo Alto, CA) and image analysis and data extraction was performed using the GenePix Pro 3.0.6.86 software (Axon Instruments).
12
DATA ANALYSIS The quantified data was loaded into the BioArray Software Environment (BASE) [35] where filtering and normalization were carried out. QUALITY FILTER To ensure that the spots of the array were true signals and not confused with noise a standard filtering of the data was performed as described: Signal-to-Noise Ratio (SNR) median >= 3 for both channels (Cy3 and Cy5) Spot diameter >= 60 pixels where median SNR = (median(I)spot - median(I)background ) / σ(I)background (I=intensity) and Spot diameter = the amount of pixels containing signal for both channels (overlapping). NORMALIZATION The measured ratio for each spot is supposed to represent its relative expression level due to hypoxic or normal conditions, as compared to the reference. To balance the differences of the intensity ratios due to for example unequal quantities of starting RNA, differences in labeling or detection efficiencies between Cy3 and Cy5 or other systematic biases in the measured expression levels, a locally weighted linear regression (Lowess) normalization of the intensity ratios was performed [33]. PATTERN ANALYSIS A selection filter was applied to ensure that each gene to be analyzed was of good quality in at least 7 of the 8 hybridizations (>=7). The transformed ratios (experiment/reference) were exported from BASE. Two different analyses were performed. In Analysis 1, we wanted to distinguish the changes in gene expression caused by hypoxia treatment. Ratios of expression levels were calculated for all genes between the samples: 6H ratio / 6N ratio 12H ratio / 12N ratio 24H ratio / 24N ratio 48H ratio / 48N ratio Each gene is then represented by four ratios (Hypoxia / Normal) corresponding to the different time points. This step ensures that a gene of interest is not interpreted as upregulated by hypoxia treatment if it also is upregulated to the same degree after the same amount of time during normal conditions. In Analysis 2 we wanted to observe genes that fluctuate with time, not necessarily due to the hypoxia treatment. Here we used the ratios of the individual hybridizations directly, hence each gene is represented by eight ratios (6H, 6N, 12H, 12N, 24H, 24N, 48H, 48N). All ratios were transformed to logarithm base 2 in order to treat up- and downregulated genes in a symmetrical fashion, a gene upregulated by a factor 2 has a log2(ratio) of 1 and a gene downregulated by a factor 2 has a log2(ratio) of -1. A gene may be considered to be up/downregulated or unchanged by different criteria.Instead of using a certain fixed value as a determinant of the gene state we used the following model. 13
From the log2(ratio) of a gene, we assigned a value for that gene to be in a upregulated (+), downregulated (-) or unchanged (0) state, as follows. P'g(+)= exp [ -(xg-τ*σ)2 / σ2 ] P'g(+)= 1
; xg < τ*σ ; xg >= τ*σ
P'g(0)= exp [ -xg2 / σ2 ] P'g(-)= exp [ -(xg+τ*σ)2 / σ2 ] P'g(-)= 1
; xg > -τ*σ ; xg