Tampa Downtown Circulator Study Final Report
November 2007
Hillsborough County Metropolitan Planning Organization P.O. Box 1110, 18th Floor Tampa, Florida 33601-1110 813/272-5940 FAX No. 813/272-6258 www.hillsboroughmpo.org
Hillsborough County Metropolitan Planning Organization Mayor Joe Affronti, Sr., City of Temple Terrace Chairman Commissioner Ken Hagan, Hillsborough County Vice-Chairman Councilman Joseph Caetano, City of Tampa Commissioner Brian Blair, Hillsborough County John Dingfelder, City of Tampa (HART Representative) Commissioner Rose Ferlita, Hillsborough County Stephen L. Reich, Tampa-Hillsborough Expressway Authority Commissioner Rick A. Lott, City of Plant City Louis E. Miller, Hillsborough County Aviation Authority Councilwoman Mary Mulhern, City of Tampa Councilman Tom Scott, City of Tampa Commissioner Mark Sharpe, Hillsborough County Richard Wainio, Tampa Port Authority Commissioner Seth Boots, The Planning Commission* District Seven Secretary Donald Skelton, Florida Department of Transportation*
Linda M. Ferraro MPO Administrative Assistant Lucilla L. Ayer, AICP MPO Executive Director *Ex-Officio Members
Tampa Downtown Circulator Study Project Team and Agency Group List Channelside Restaurants Hyde Park Village City of Tampa Prida, Guida and Co Florida Aquarium St. Pete Times Forum Florida Department of Transportation Dist. 7 Tampa Downtown Partnership HART Tampa Housing Authority Hillsborough County Tampa Lighthouse Hillsborough MPO Tampa Port Authority Hooters Channelside The Dohring Group Hooters Corporate University of Tampa Ybor Chamber
TABLE OF CONTENTS Section
Page
EXECUTIVE SUMMARY ...................................................................................................... ES-1 1.0 INTRODUCTION ........................................................................................................... 1-1 1.1 Purpose................................................................................................................. 1-1 1.2 Study Area ........................................................................................................... 1-1 2.0 EXISTING CONDITIONS ANALYSIS......................................................................... 2-1 2.1 Introduction.......................................................................................................... 2-1 2.2 Existing Downtown Transit Service .................................................................... 2-1 2.2.1 In-Town Trolley Routes........................................................................... 2-2 2.2.2 Service Frequencies ................................................................................. 2-2 2.2.3 Vehicles.................................................................................................... 2-2 2.2.4 Fares......................................................................................................... 2-2 2.3 Other In-Town Transit Services........................................................................... 2-3 2.3.1 Hooters Channelside Lunchtime Express ................................................ 2-3 2.3.2 TECO Line Streetcar System................................................................... 2-3 2.3.3 Private Shuttles ........................................................................................ 2-4 2.3.4 Regional HART Service to Downtown ................................................... 2-4 2.4 Evaluation of the In-Town Trolley Routes .......................................................... 2-5 2.5 Operational Characteristics and Markets Served................................................. 2-5 2.5.1 Route 96 – In-Town Trolley Downtown ................................................. 2-5 2.5.2 Route 98 – In-Town Trolley Hyde Park .................................................. 2-6 2.5.3 Monthly Operating Statistics and Route Performance........................... 2-10 2.5.4 Route 96 – In-Town Trolley Downtown ............................................... 2-10 2.5.5 Route 98 – In-Town Trolley Hyde Park ................................................ 2-11 2.6 Ridecheck Survey Results.................................................................................. 2-12 2.6.1 Route 96 – In-Town Trolley Downtown ............................................... 2-12 2.6.2 Route 98 – In-Town Trolley Hyde Park ................................................ 2-14 2.7 Conclusions and Observations: Existing Conditions......................................... 2-19 2.7.1 Route 96 – In-Town Trolley Downtown ............................................... 2-20 2.7.2 Route 98 – In-Town Trolley Hyde Park ................................................ 2-21 3.0 DOWNTOWN TAMPA ENVIRONMENT.................................................................... 3-1 3.1 Existing Downtown Conditions........................................................................... 3-1 3.2 Entertainment and Events .................................................................................... 3-3 3.2.1 St. Pete Times Forum............................................................................... 3-3 3.2.2 Channelside.............................................................................................. 3-3 3.2.3 Tampa Bay Performing Arts Center ........................................................ 3-4 3.2.4 Tampa Convention Center ....................................................................... 3-4 3.2.5 Parks......................................................................................................... 3-5 3.2.6 Employment............................................................................................. 3-6 3.2.7 Educational Institutions ........................................................................... 3-7
i
Table of Contents
Section
4.0
5.0
Page
3.2.8 Parking Inventory..................................................................................... 3-8 3.2.9 Monthly/Hourly Parking.......................................................................... 3-8 3.2.10 On-Street Parking..................................................................................... 3-8 3.3 Residential............................................................................................................ 3-8 3.3.1 Existing Residential Development........................................................... 3-8 3.3.2 Projected Residential Development Activity......................................... 3-13 PEER CITY REVIEW..................................................................................................... 4-1 4.1 Methodology ........................................................................................................ 4-1 4.2 Chattanooga’s Downtown Electric Shuttle.......................................................... 4-2 4.2.1 Ridership .................................................................................................. 4-2 4.2.2 Funding .................................................................................................... 4-3 4.2.3 Supporting Policies and Strategies........................................................... 4-3 4.3 Norfolk Electric Transit ....................................................................................... 4-4 4.3.1 Ridership .................................................................................................. 4-4 4.3.2 Funding .................................................................................................... 4-5 4.3.3 Supporting Policies and Strategies........................................................... 4-5 4.4 Orlando LYMMO ................................................................................................ 4-6 4.4.1 Ridership .................................................................................................. 4-7 4.4.2 Funding .................................................................................................... 4-8 4.4.3 Supporting Policies and Strategies........................................................... 4-8 4.4.4 Additional Supporting Information.......................................................... 4-9 4.5 Strategies for Tampa Circulator......................................................................... 4-10 4.5.1 Chattanooga ........................................................................................... 4-12 4.5.2 Norfolk................................................................................................... 4-12 4.5.3 Orlando .................................................................................................. 4-12 MARKET ANALYSIS.................................................................................................... 5-1 5.1 Introduction.......................................................................................................... 5-1 5.2 Venue Attendance and UT Enrollment Statistics ................................................ 5-2 5.3 Downtown Travel Patterns .................................................................................. 5-2 5.4 Methodology ........................................................................................................ 5-2 5.4.1 HBW Travel............................................................................................. 5-5 5.4.2 Summary of HBW Productions and Attractions...................................... 5-5 5.4.3 HBSHOP Travel ...................................................................................... 5-7 5.4.4 Summary of HBSHOP Productions and Attractions ............................... 5-8 5.4.5 HBS&R Travel......................................................................................... 5-9 5.4.6 Summary of HBS&R Productions and Attractions ............................... 5-10 5.4.7 HBMISC Travel..................................................................................... 5-11 5.4.8 Summary of HBMISC Productions and Attractions.............................. 5-13 5.4.9 NHB Travel............................................................................................ 5-13 5.4.10 Summary of NHB Productions and Attractions..................................... 5-15 5.5 Downtown Trip Attractions ............................................................................... 5-15 5.6 Findings.............................................................................................................. 5-19
ii
Table of Contents
Section 6.0
7.0
Page
PUBLIC OUTREACH..................................................................................................... 6-1 6.1 Introduction.......................................................................................................... 6-1 6.2 Stakeholder Group ............................................................................................... 6-1 6.3 Focus Groups ....................................................................................................... 6-4 6.4 Focus Group Format ............................................................................................ 6-4 RECOMMENDATIONS................................................................................................. 7-1 7.1 Short-Term Operational ....................................................................................... 7-1 7.1.1 To be implemented by 2008 .................................................................... 7-1 7.2 Long-Term Operational ....................................................................................... 7-2 7.2.1 To be implemented by 2012 .................................................................... 7-2 7.3 General Recommendations .................................................................................. 7-5 7.3.1 To be implemented by 2008 .................................................................... 7-5 7.3.2 To be implemented by 2012 .................................................................... 7-6 7.4 Policy Recommendations..................................................................................... 7-7 7.5 Coordination with Citywide Efforts..................................................................... 7-9 7.5.1 South Central Business District Special Events: Maintenance of Traffic and Parking Evaluation .......................................................................... 7-10 7.5.2 Downtown Tampa Transportation Vision ............................................. 7-10 7.5.3 Additional Efforts .................................................................................. 7-11 7.6 Funding Scenarios.............................................................................................. 7-11 7.6.1 Long-Term Funding Strategy ................................................................ 7-16 7.6.2 Additional Funding Options .................................................................. 7-16 7.6.3 Circulator Operating Plan ...................................................................... 7-19
APPENDICES Appendix A: HART Profile Reports for Route 96 and Route 98 Appendix B: Market Analysis Technical Memorandum Appendix C: Public Outreach Materials Stakeholder Group Member List Stakeholder Group Meeting Notes (including agenda, notes, sign-in sheet) PowerPoint Presentations to Stakeholders Focus Group Member List Focus Group Meeting Notes Focus Group Questions Focus Group Summary of Results (including Excel spreadsheet) Appendix D: Comments from Final Review
iii
Table of Contents LIST OF TABLES Table
Page
2.0 2.1 2.2 2.3 2.4 2.5 2.6 2.7 2.8 2.9 2.10 2.11
Route 96 Operating Characteristics ................................................................................. 2-6 Route 98 Operating Characteristics ............................................................................... 2-10 Route 96 Monthly Operating Statistics and Route Performance ................................... 2-11 Route 98 Monthly Operating Statistics and Route Performance ................................... 2-11 Route 96 Ridecheck Survey Results by Time Period - Weekday Service..................... 2-12 Route 96 Ridecheck Survey Summary - Weekday Service........................................... 2-13 Route 98 Ridecheck Survey Results by Time Period - Weekday Service..................... 2-14 Route 98 Ridecheck Survey Results by Time Period - Saturday Service...................... 2-15 Route 98 Ridecheck Survey Results by Time Period - Sunday Service........................ 2-15 Route 98 Ridecheck Survey Summary - Weekday Service........................................... 2-16 Route 98 Ridecheck Survey Summary - Saturday Service............................................ 2-17 Route 98 Ridecheck Survey Summary - Sunday Service.............................................. 2-18
3.0 3.1 3.2 3.3 3.4 3.5
Office Development in Downtown Tampa...................................................................... 3-6 Educational Institutions in Downtown Tampa ................................................................ 3-7 Tampa’s Downtown Parking Inventory......................................................................... 3-10 Existing Downtown Tampa Residential Development.................................................. 3-13 Residential Development Expected To Be Complete by 2008...................................... 3-14 Residential Development Expected To Be Complete by 2012...................................... 3-15
4.0 4.1 4.2 4.3
Downtown Electric Shuttle - Monthly and Daily Ridership, 2006 (Chattanooga).......... 4-3 Norfolk Electric Transit System - Daily Ridership, 2006................................................ 4-5 LYMMO Yearly Ridership.............................................................................................. 4-7 Average Travel Time by Purpose for Visitors (Orlando) .............................................. 4-10
5.1
Market Growth Projections, 2008-2012 ........................................................................ 5-19
6.0
Stakeholder Agency/Group List ...................................................................................... 6-2
7.0
Potential Funding Scenarios .......................................................................................... 7-11
iv
Table of Contents LIST OF FIGURES Figure
Page
ES.0
Recommended Routes ...................................................................................................ES-5
1.0
Circulator Base Map ........................................................................................................ 1-2
2.0 2.1 2.2 2.3 2.4 2.5
Route 96 In-Town Trolley Downtown ............................................................................ 2-7 Route 98 In-Town Trolley Hyde Park ............................................................................. 2-8 Ridership at Stop and Segment Level............................................................................ 2-13 Route 98 Ridership at Stop and Segment Level - Weekday Service............................. 2-17 Route 98 Ridership at Stop and Segment Level - Saturday Service.............................. 2-18 Route 98 Ridership at Stop and Segment Level - Sunday Service ................................ 2-19
3.0 3.1
General Market Areas ...................................................................................................... 3-2 Existing Parking Areas .................................................................................................... 3-9
5.0 5.1 5.2 5.3 5.4 5.5 5.6 5.7 5.8 5.9 5.10 5.11 5.12 5.13 5.14 5.15 5.16 5.17 5.18 5.19 5.20 5.21 5.22 5.23 5.24 5.25 5.26
Downtown Venues and the University of Tampa............................................................ 5-3 Representative Traffic Analysis Zones............................................................................ 5-4 HBW Person-Trip Productions - Change from 2008 to 2012.......................................... 5-6 HBW Person-Trip Attractions - Change from 2008 to 2012........................................... 5-6 Summary of HBW Person-Trip Productions and Attractions.......................................... 5-7 Summary of HBW Person-Trip Productions and Attractions.......................................... 5-7 HBSHOP Person-Trip Productions - Change from 2008 to 2012 ................................... 5-7 HBSHOP Person-Trip Attractions - Change from 2008 to 2012 .................................... 5-8 Summary of HBSHOP Person-Trip Productions and Attractions ................................... 5-9 Summary of HBSHOP Person-Trip Productions and Attractions ................................... 5-9 HBS&R Person-Trip Productions - Change from 2008 to 2012 ..................................... 5-9 HBS&R Person-Trip Productions - Change from 2008 to 2012 ................................... 5-10 Summary of HBS&R Person-Trip Productions and Attractions ................................... 5-11 Summary of HBS&R Person-Trip Productions and Attractions ................................... 5-11 HBMISC Person-Trip Productions - Change from 2008 to 2012.................................. 5-12 HBMISC Person-Trip Productions - Change from 2008 to 2012.................................. 5-12 Summary of HBMISC Person-Trip Productions and Attractions.................................. 5-13 Summary of HBMISC Person-Trip Productions and Attractions.................................. 5-13 NHB Person-Trip Productions - Change from 2008 to 2012 ........................................ 5-14 NHB Person-Trip Attractions - Change from 2008 to 2012.......................................... 5-14 Summary of NHB Person-Trip Productions and Attractions ........................................ 5-15 Summary of NHB Person-Trip Productions and Attractions ........................................ 5-15 HBW External to Internal Work Trip Attractions ......................................................... 5-16 HBSHOP External to Internal Work Trip Attractions................................................... 5-17 HBS&R External to Internal Work Trip Attractions ..................................................... 5-17 HBMISC External to Internal Work Trip Attractions ................................................... 5-18 NHB External to Internal Work Trip Attractions .......................................................... 5-18
7.0 7.1 7.2
Recommended Routes ..................................................................................................... 7-3 Recommended Routes with Current HART Service ....................................................... 7-4 Existing Parking Areas .................................................................................................... 7-8
v
EXECUTIVE SUMMARY PURPOSE The purpose of this study is to increase efficiency of the downtown circulator. As new development and activities occur, changes to existing service and additional service will be needed to provide mobility options for people living, working, and visiting Downtown Tampa. The task will assess the immediate need for service changes (2008) and the additional needs for 2012 and beyond given projected growth.
METHOD OF ANALYSIS The existing conditions in Downtown Tampa were assessed by surveying the current transit system and the current downtown environment. A series of peer city reviews served to identify strategies that were successful in other similar projects. A market analysis identified travel patterns and locations of high patronage. Public outreach was conducted which identified stakeholders and incorporated their interests into the project. The results of the analysis were used to formulate recommended operational and policy changes to enhance the existing system.
CURRENT TRANSIT CONDITIONS HART operates a network of transit services for Downtown Tampa and the surrounding in-town areas, including the Channel District, Hyde Park, and Ybor City. These transit services include two In-Town Trolleys (Routes 96 and 98), the Hooters Channelside Lunchtime Express, and the TECO Line Streetcar. In addition, HART provides significant local and express service into downtown. The primary focus of this analysis deals with the In-Town Trolley which is comprised of HART Routes 96 and 98. Route 96 has been operational since 1999, serving the north-south core of Downtown Tampa, including office buildings, hotels, the convention center, and the cultural arts district. It connects to regional HART bus services at the Marion Transit Center (MTC) on the north end and to the TECO Line Streetcar and Route 98 at the Southern Transportation Plaza. It also provides a connection to the residential development on Harbour Island. A series of factors that limit the effectiveness and performance of Route 96 were identified including the complexity of the route, insufficient run time, and infrequent service.
ES-1
Executive Summary Route 98 forms a downtown circulator which has been operating since November 2004 and has the lowest ridership numbers in the HART system. It provides an east-west connection weekdays between Downtown Tampa; and the shopping, entertainment, and residential areas of Hyde Park; and connects to the TECO Line Streetcar and Route 96 at the Southern Transportation Plaza. The following factors were identified that limit the effectiveness and performance of the route including infrequent service, short span of service, duplication of existing fixed route service, and a one way pair alignment with limited pedestrian access. HART is considering changes to Route 98 separate and independent of the results and recommendations of this study.
DOWNTOWN ENVIRONMENT The environs examined in this report include office space, educational institutions, recreational and entertainment activities, parking space, and residential development. The results show that the activity centers in Downtown Tampa are dominated by office space with a relatively small, but growing, contingent of residential and retail use while Ybor City, Channelside, and the St. Pete Times Forum also draw substantial numbers of visitors near downtown. Over the next decade, the balance of office to residential use is expected to shift significantly particularly in Channelside, Ybor, and along Franklin Street.
PEER CITY REVIEW To aid in the creation of a more successful program, established circulator systems in cities of similar size and make up were examined in a peer city analysis. The three cities selected for the peer review were Chattanooga, Norfolk, and Orlando. The peer reviews consisted of a description of service, summary of ridership, identification of funding, and summary of supporting policies. The peer analysis identified a number of activities that may be appropriate for implementation in Tampa. Free Fare Zone Ridership of the Tampa Downtown Circulator dropped by 20 percent when fares were implemented in 2004. Simplified Routing Extensive routes that visit all parts of downtown require riders to travel longer periods to cover short distances relative to the origin of their trip. Simple east-west and north-south routes would allow riders a shorter bus trip to move a longer relative distance. Frequent Headways A high percentage of circulator users will be those individuals utilizing the service during the workday.
ES-2
Executive Summary Peripheral Parking/Commuter Lots Off site parking was used in all three of the peer cities to help anchor the downtown circulator. The provision of peripheral parking is the key to the implementation of a free fare zone. Revenues from the parking lots would subsidize the loss of revenue from the bus fares. Distinct Facilities and Signage Advertise the presence of the circulator. For example, the Orlando LYMMO is a prominent part of the downtown streetscape. Providing a high level of visibility announcing the presence of the circulator is critical in capturing riders.
MARKET ANALYSIS The results of the analysis identified that the most dramatic growth in person-trips is related to social and special events. This is of particular importance when compounded with 2006 attendance estimates of approximately eight million downtown venue visitors. Additionally, analysis of the Traffic Analysis Zone (TAZ) data indicates that those areas projected to experience the highest rates of growth are: •
Southern Central Business District,
•
Channelside (Entertainment area),
•
Channelside (Residential area),
•
North Franklin/Arts District,
•
Ybor City, and
•
The Heights.
PUBLIC OUTREACH Public outreach was primarily in the form of stakeholder and focus group meetings that served as a conduit for information exchange. The stakeholders consisted of members from various local, state agencies and interest groups that identified the following elements as critical in creating a safe, efficient, and practical circulator service. •
Frequent Service,
•
Free Fares,
•
Simple Schedules,
•
Convenient Routes, and
ES-3
Executive Summary •
Nearby Parking
Focus group members were sought from three primary interest groups: residential, employer/employee, and potential partner. The focus groups provided input through a series of surveys. The surveys identified opinions regarding quality of life, transit use, success factors, and willingness to pay.
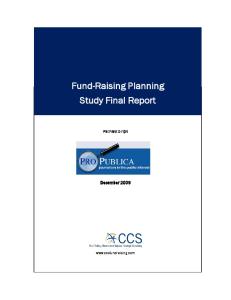
RECOMMENDATIONS SHORT AND LONG-TERM OPERATIONAL The short-term operational recommendations are measures that predominantly use existing resources and are expected to be implemented by 2008. These recommendations include route changes, facilities upgrades, and route coordination. The creation of a north-south circulator that provides weekday service from Harbour Island to I-275. Both the northbound and southbound travel patterns serve the Southern Transportation Center and the existing end-of-line for the TECO Line Streetcar System. In addition, create an Event Circulator. The Event Circulator provides Friday and Saturday evening service as well as service on other event days, between the Channelside District and the Tampa Bay Performing Arts Center. Figure ES.0 shows the recommended course of the new downtown circulator routes. Additional recommendations for the short-term include improvements to the pedestrian environment to include adequate sidewalks, lighting, and connectivity to the transit stops. The integration of the proposed circulator routes with existing street car and HART service completes the short-term operational recommendations. The Long-Term Operational recommendations for the Downtown Circulator are expected to be implemented by 2012 and will likely require additional study and funding. These recommendations include: •
The extension of the north/south route or incorporation of an east/west route that reaches Ybor City.
•
Separating routes for weekdays and weeknights, and investigating the feasibility of implementing a singular “postage stamp” route.
•
Connect the circulator to a planned parking garage located under I-275. There is currently no specific timeframe for construction of this parking facility which is an amenity associated with the Tampa downtown regional intermodal center. However, when the facility is completed, Circulator patrons could park at that location and walk to the Marion Transit Center (MTC), then ride into downtown. A similar commuter lot set up could be located and used in Ybor City.
ES-4
4
Map Not To Scale PALM AVE
PALM AVE
VISITORS CENTER
9TH AVE OAK AVE
CENTRO
275
8TH AVE YBOR
7TH AVE
7TH AVE
HENDERSON AVE
DOYL
ASHLEY PLAZA
NS
IO MAR
BRO
PA TAMIOTT R MARERSIDE WAT
D
GA
MERIDIAN ST
CRUISE TERMINAL 2
D BLV IAL
22ND ST
21ST ST
20TH ST
19TH ST
A&E Venue, Educational Center Parking Structure Transportation Center
EFIC
NN CHA
Hotel
Park
L
NNE
CHA
BEN
E
OBE NCH COTA ARK P
IDE
ELS
TIMES FORUM
ON RRIS
Day Time Circulator Event Circulator
BLV
AM D NDH AN WY UR ISL O TEL B R HA HO
S HA
BA Y GH
OU
SB LL HI
TAMPA GENERAL HOSPITAL
RN TION THE A SOU NSPORT TRA ZA PLA
ERW ALK
FLORIDA AQUARIUM
Government Building
ND
LV D EB OR BA YS H
OR
PLANT AVE
BAY ST
RIV
ASS EMBITES SU
ISLA
BAYSHORE BLVD. LINEAR PARK
AZEELE ST
CUMBERLAND AVE
ST. PETE
TH SOUIONAL REGARAGE G
Y
TAMPA CONVENTION CENTER
PLATT ST
CRUISE TERMINAL 3
BALL ST BA
UR RBO
TAMPA BAY HISTORY CENTER
CAESAR ST
CUMBERLAND CUM AVE
EUNICE ST
T POS ICE OFF
BROREIN ST CLEVELAND ST
12TH ST
T SH S
EL
MO
WALTON ST
S REIN
TAMPA TRIBUNE
PORT AUTHORITY PARKING GARAGE
Residential Development Existing Complete by 2008 Complete by 2012 Office/Employment Center
CHANNELSIDE DR
WA Y NE XP RE
SS
FINLEY ST
T
ECONOMY INN
18TH ST
KW AY PA R O CC I
ENO
T ST EAS
JEFF
P
BRU
ST
ON
ERS
T ES IERC
GOV
EAS
R ST
T ST
GRAND CENTRAL AVE
HYDE PARK AVE
WHITING ST
LE
FALK THEATER
KE OO T BR FORRAGE T A G GS ITIN WH RAGE GA CA L ST YM BEL
WASHINGTON ST
G ST
ITIN WH
OY S
TT HYA NCY E REG PA TAM
WN NTOOL DOW HO LLOSHIP SC E P R RAM N ST TNE GTO PAR HIN WAS
ER
RADISSON RIVERWALK
CRUISE TAMPA TERMINAL 6 PORT AUTHORITY HEADQUARTERS 11TH ST
Y KWA PAR NSITT TRA
ET TRE
MO D
BLV
KE
N BOULEVARD
E A AV RID FLO
T
IN S
N BOULEVARD
HENRY B. PLANT PARK DY NNE
NKL
RGA
R
ARTISTS UNLIMITED
OOL SCH RD BOA
NTY COU AGE GAR N ST KSO JAC
N ST
VE
N ST ISO JOE A MAD HILLUR USE C RTHORE A COUSQU LVD E OLIC RS DY B NNE NTY PA PUARTE M E M K A U T ADQ SEU CO TER HE ND MU ES CEN LYK IGHT A L GAS UARE L L A H SQ Y IT C ZA PLA FRA
ST PA TAM
DR LEY
RI
KENNEDY BLVD
ST
TAMPA MUSEUM OF ART G KIN PAR RAGE GA
Text
Text
K
GH
Text Text
R YO
OU
ASH
OR
ST
SB
OR
LL
MADISON ST
ST
WILLIAM POE GARAGE IS RT RK CU N PA O X I H
TWIGGS ST
AY
UNIVERSITY OF TAMPA
S ST UND CAS YHO RS GRE ATION HTE FIG M ST S FIREUSEU N T BO AL S M B MB IB K G DER E ECO E POL LAKE DING FE HOUS EDG THOUS ER UIL R RT IMBERAL B U U T O O S ST C C IGG E FED T W ARAG K ST E G ZAC S U A O P SE RTH TAM ER HOU COU EUSE AT NTY SE COURT X T NTY E R THE COUTHOU GS S COUDAPTIV NNE IG A R W A T COU
CK
LK
CASS ST
ARY
UNION STATION/ AMTRAK
M
RWA
RIVE
LIBR
T
ER S
TYL
T POSICE OFF
INN NCE TT IDE RES ARRIO BY M ARD RTY OTT COU ARRIO Y B M
TAMPA BAY PERFORMING G ARTS CENTER
HI
LEE ROY SELMON EXPRESSWAY
RB
N MA HERASSEY M ARK P
Recommended Routes
HA
N ST
RISO
TAMPA PREPARATORY SCHOOL
ADAMO DR
CENTRAL PARK VILLAGE (Proposed Boundaries)
ROYAL ST HAR
2ND AVE
NU
FORTUNE ST
TAMPA WATERSPORTS CENTER
PERRY HARVEY SR. PARK
NEBRASKA AVE
RIVERFRONT PARK
MARION TRANSIT CENTER
ORANGE ST
PARK TRAMMELL BUILDING
ST
JEFFERSON ST
REL
LAU
LAURELL ST
3RD AVE
SCOTT ST INDIA ST
LAUREL ST
17TH ST
KAY ST
4TH AVE
YBOR CHANNEL
LTON AV
E
KAY ST
E CAR
BLAKE HIGH SCHOOL GREEN ST
GOVERNOR ST
3RD AVE
Figure ES.0
5TH AVE
16TH ST
STETSON UNIVERSITY COLLEGE OF LAW
ESTELLE ST ESTELLE ST
15TH ST
ESTELLE ST
AVENIDA REPUBLICA DE CUBA
PIERCE ST
6TH AVE
TECO Streetcar
August 2007
Executive Summary
GENERAL RECOMMENDATIONS The following general recommendation address issues not directly tied to the daily operation of the circulator, but include aspects of the program that should receive attention in creating a viable downtown circulator. The following short-term recommendations address the issues of ridership, bus stops/shelters, and marketing. •
Initiate new marketing strategy for improved circulator service
•
Inventory parking and promote it in the newspaper, magazines and website
•
Improve the visibility and use of circulator service through signage and prominent posting of route numbers and schedules
•
Overall “look” of the Circulator should be unique
The following long-term recommendations address ridership, urban design, and parking. •
Research implications of providing “Wide Area Service” vs. “Focused Area Service”
•
Improve downtown pedestrian experience along circulator routes
•
Design circulator service in support of downtown retail
•
Convert existing ConAgra lot at (Whiting St. and Nebraska Ave) to a parking garage
•
Convert existing parking garages to incorporate retail on 1st floor
•
Connect to parking under I-275
•
Locate potential park-and-ride locations
•
Utilize potential peripheral parking areas to address employee and visitor parking demands in the Channel District during weekends and special events
POLICY RECOMMENDATIONS The following policy changes are recommended to develop a more efficient and functional downtown circulator system. •
Establish a fare free zone that encompasses the area serviced by the circulator.
ES-6
Executive Summary − Encourage partnerships between private lots and the city to generate revenue. •
Establish an Advisory board to assist HART with implementation of the route modifications.
•
Examine city practices and policies regarding the use of parking garages.
•
Revise land development regulations for the Central Business District to be more transit and pedestrian friendly.
•
Discuss the FDOT Commitment for a 2800-space parking garage with the City of Tampa.
•
Examine the efficacy of distributing City Parking Permits and how this might affect user convenience associated with circulator use.
•
Work with the City of Tampa and Hillsborough County to create new transit-oriented land use categories, such as a Transit-Oriented Development designation and a Transit-Oriented Corridor designation as part of their Comprehensive Plan, Future Land Use Map Series. This will promote redevelopment along the City and County’s major transportation corridors and help spur mixed-use urban centers and mixed-use corridors.
COORDINATION EFFORT A focused coordination must accompany any policy or operational changes. The coordination recommendations include the following efforts: •
Encourage the use of the circulator system by downtown employees during events, particularly those employees working at the events.
•
Develop remote employee parking lots with the use of shuttles to the event core area (St. Pete Times Forum/Marriott/Convention Center) during capacity events.
•
This would become a significant issue as surface lots are redeveloped and parking supply is reduced.
•
Consider ways to promote transit to event patrons, such as vouchers or shuttle services from remote sites, or use of the TECOline Streetcar.
ES-7
Section 1.0 INTRODUCTION 1.1
PURPOSE
The objective of this study is to explore strategies to enhance the current downtown/in-town circulators. As new development and activities occur, changes to existing service and additional service will be needed to provide mobility options for people living, working, and visiting Downtown Tampa. The task will assess the immediate need for service changes (2008) and the need for service in 2012 given projected growth. The potential market for expanded circulator services in the core of downtown, areas where circulator service already exists and in adjacent neighborhoods, including the Channel District, Ybor City, and the area west of the Hillsborough River, will be assessed for service in place in 2008. The need for additional service to meet the transportation needs of projected residential and commercial development activity with a focus on the effect of service demand created by The Heights, the Central Park Village redevelopment, and growth in the Central Business District, Ybor City, the Channel District, and areas immediately west of the Hillsborough River will also be assessed for 2012 service improvements.
1.2
STUDY AREA
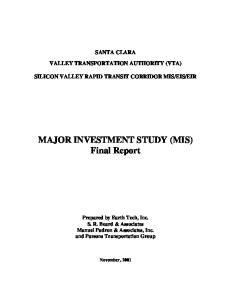
The planning area for the Circulator Study consists of the Downtown Tampa area including, the Channel District, Ybor City, the area west of the Hillsborough River, The Heights, Central Park Village, and the Central Business District. The study area is defined by the following boundaries (reflected in Figure 1.0): •
North Boulevard on the west,
•
Palm Avenue on the north,
•
22nd Street on the east, and
•
Harbour Island on the south.
1-1
4
Map Not To Scale PALM AVE
PALM AVE
VISITORS CENTER
9TH AVE OAK AVE
CENTRO
275
8TH AVE YBOR
7TH AVE
7TH AVE
HENDERSON AVE
DOYL
ASHLEY PLAZA
WAY K PAR
NS
IO MAR
CUMBERLAND AVE
S REIN
BRO
MERIDIAN ST
12TH ST
CHANNELSIDE DR
FLORIDA AQUARIUM
GA
D BLV
22ND ST
21ST ST
20TH ST
19TH ST
Hotel A&E Venue, Educational Center Parking Structure Transportation Center
EFIC
IAL
L
NNE
CHA
BEN
E
OBE NCH COTA ARK P
E
LSID
NNE
CHA
Government Building
Park In-Town Trolley - Hyde Park In-Town Trolley - Downtown Hooters Trolley
S HA
AM D NDH AN WY UR ISL O TEL B R HA HO
CRUISE TERMINAL 2
TIMES FORUM
ON RRIS
D
ERW ALK
PA TAMIOTT R MARERSIDE WAT
BLV
BA Y GH
OU
SB LL HI
TAMPA GENERAL HOSPITAL
RN TION THE A SOU NSPORT TRA ZA PLA
ND
LV D EB OR BA YS H
OR
PLANT AVE
BAY ST
RIV
ASS EMBITES SU
ISLA
BAYSHORE BLVD. LINEAR PARK
AZEELE ST
CUMBERLAND AVE
ST. PETE
TH SOUIONAL REGARAGE G
Y
TAMPA CONVENTION CENTER
PLATT ST
CRUISE TERMINAL 3
BALL ST
UR RBO
TAMPA BAY HISTORY CENTER
Residential Development Existing Complete by 2008 Complete by 2012 Office/Employment Center
EUNICE ST
T POS ICE OFF
BROREIN ST
CAESAR ST
BE
CLEVELAND ST
11TH ST
T SH S BRU
T ST EAS WA Y RE
MO
WALTON ST
OY S
T LL S
TAMPA TRIBUNE
PORT AUTHORITY PARKING GARAGE
XP NE
T GS ITIN WH RAGE GA
T
ECONOMY INN
18TH ST
KW AY PA R O
ENO GOV
EAS ST
ON
SS
FINLEY ST
LE
FALK THEATER
R ST
T ST
CA YM
JEFF
P
OKE
WASHINGTON ST
WHITING ST
EL
O T BR FORRAGE GA
CRUISE TAMPA TERMINAL 6 PORT AUTHORITY HEADQUARTERS
G ST
ITIN WH
ER
TT HYA NCY E REG PA TAM
WN NTOOL DOW HO LLOSHIP SC E P R RAM N ST TNE GTO PAR HIN WAS
ERS
T ES IERC
MO
RADISSON RIVERWALK
GRAND CENTRAL AVE
HYDE PARK AVE
CC I
NSIT
TRA
ET TRE
E
D
BLV
KE
N BOULEVARD
A AV RID FLO
T
IN S
N BOULEVARD
HENRY B. PLANT PARK DY NNE
NKL
RGA
R
ARTISTS UNLIMITED
OOL SCH RD BOA
NTY COU AGE GAR N ST KSO JAC
N ST
VE
N ST ISO JOE A MAD HILLUR USE C RTHORE A COUSQU LVD E OLIC RS DY B NNE NTY PA PUARTE M E M K A U T ADQ SEU CO TER HE ND MU ES CEN LYK IGHT A L GAS UARE L L A H SQ Y IT C ZA PLA FRA
ST PA TAM
DR
TAMPA MUSEUM OF ART G KIN PAR RAGE GA
KENNEDY BLVD
ST
RI
Text
Text
K
GH
MADISON ST
Text Text
R YO
OU
LEY
OR
ASH
SB
ST
LL
TWIGGS ST
ST
WILLIAM POE GARAGE IS RT RK CU N PA O X I H
OR
S ST UND CAS YHO RS GRE ATION HTE FIG M ST S FIREUSEU N T BO AL S M MB IB K G DER E ECO E POL LAKE DING FE HOUS EDG THOUS ER UIL R RT IMBERAL B U U T O O S ST C C IGG E FED T W ARAG K ST E G ZAC S U A O P SE RTH TAM ER HOU COU EUSE AT NTY SE COURT X T NTY E R THE COUTHOU GS S COUDAPTIV NNE IG A R W A T COU
AY
UNIVERSITY OF TAMPA
UNION STATION/ AMTRAK
CK
LK
CASS ST
ARY
T
ER S
TYL
M
RWA
RIVE
LIBR
T POSICE OFF
INN NCE TT IDE RES ARRIO BY M ARD RT Y T T COU ARRIO Y B M
TAMPA BAY PERFORMING ARTS CENTER
HI
LEE ROY SELMON EXPRESSWAY
RB
N MA HERASSEY M ARK P
Circulator Base Map
HA
N ST
RISO
TAMPA PREPARATORY SCHOOL
ADAMO DR
CENTRAL PARK VILLAGE (Proposed Boundaries)
ROYAL ST HAR
2ND AVE
NU
FORTUNE ST
TAMPA WATERSPORTS CENTER
PERRY HARVEY SR. PARK
NEBRASKA AVE
RIVERFRONT PARK
MARION TRANSIT CENTER
ORANGE ST
PARK TRAMMELL BUILDING
ST
JEFFERSON ST
REL
LAU
LAUREL ST
3RD AVE
SCOTT ST INDIA ST
LAUREL ST
17TH ST
KAY ST
4TH AVE
YBOR CHANNEL
LTON AV
E
KAY ST
E CAR
BLAKE HIGH SCHOOL GREEN ST
GOVERNOR ST
3RD AVE
Figure 1.0
5TH AVE
16TH ST
STETSON UNIVERSITY COLLEGE OF LAW
ESTELLE ST ESTELLE ST
15TH ST
ESTELLE ST
AVENIDA REPUBLICA DE CUBA
PIERCE ST
6TH AVE
TECO Streetcar HART Bus Route
March 2007
Section 2.0 EXISTING CONDITIONS ANALYSIS 2.1
INTRODUCTION
The existing conditions analysis provides an assessment of the current downtown circulator services. It begins with a brief description of the network of transit services currently operated in Downtown Tampa. A detailed evaluation of the In-Town Trolley routes (Route 96 and Route 98) is then presented. The evaluation focuses on the operational and ridership characteristics of the routes. It identifies the key destinations, trip purposes, and ridership markets served by each route. Route-level ridership data collected by time period and stop, as well as FY 2006 ridership and operating statistics by month provided by the Hillsborough Area Regional Transit Agency (HART), served as a key data source for the evaluation. Ridership patterns for each route by day, time period, and route segment are evaluated, with possible causes for variations assessed. Other studies and data reviewed and used to complete the analysis included:
2.2
•
Results of the Uptown-Downtown Connector (Route 96) Survey of riders and nonriders, conducted by the Tampa Downtown Partnership in 2003;
•
Results of the Route 96 and Route 98 On-Board Survey, conducted by HART in May 2005;
•
Data from the Tampa Downtown Partnership, including residential developments and parking facilities;
•
The Downtown Tampa Access Study (URS for Hillsborough County MPO);
•
The Downtown Tampa Transportation Vision Plan (Hillsborough County MPO); and
•
Strategies for an Intra-Urban Circulator System (CUTR).
EXISTING DOWNTOWN TRANSIT SERVICE
HART operates a network of transit services for Downtown Tampa and the surrounding in-town areas, including the Channel District, Hyde Park, and Ybor City. These transit services include two In-Town Trolleys (Routes 96 and 98), the Hooters Channelside Lunchtime Express, and the TECO Line Streetcar. In addition, HART provides significant local and express service into downtown. This chapter provides an overview of these existing services.
2-1
Section 2.0 2.2.1
IN-TOWN TROLLEY ROUTES
Downtown Tampa is served by two HART circulator routes. The In-Town Trolley Downtown (Route 96) has been in operation since 1999. This weekday-only route provides north-south service through the heart of Downtown Tampa, operating between the MTC and Harbour Island. In November 2004, the In-Town Trolley Hyde Park (Route 98) was established. This route connects Downtown Tampa to the Hyde Park area west of downtown, operating between Harbour Island and Hyde Park. On weekends, the route also provides circulator service through downtown north to the Tampa Performing Arts Center, essentially merging the Route 96 and Route 98 into one route. Both routes serve the Wyndham Harbour Hotel and Harbour Place development across the channel from downtown. Transfers between the two routes and the Tampa Electric Company (TECO) Line streetcar can be made at the Southern Transportation Plaza, the current terminus for the streetcar line. Route 96 terminates at the MTC on the north end of downtown, facilitating connections with the many HART local and express routes serving downtown. 2.2.2
SERVICE FREQUENCIES
Each of the routes operates at 15-minute headways during the day. This provides a consistent frequency for both the routes, and is also consistent with the headway of the TECO Streetcar Line. Night and Sunday service on Route 98 is operated every 30 minutes. Service spans vary considerably by route and by day. 2.2.3
VEHICLES
To create a distinctly different look for the vehicles operating circulator service, HART utilizes rubber-tired replica trolley buses to operate the in-town trolley routes. These trolley buses, manufactured by Trolley Enterprises, are easy to spot and are intended to make the riding experience different and fun. Each trolley bus is painted with the same paint scheme as the TECO Line Streetcars. With the fleet of seven trolley buses being used for the two in-town trolley routes, as well as the Hooters Channelside Lunchtime Express, HART has found it necessary to occasionally run a standard local bus on the in-town trolley routes. 2.2.4
FARES
For the first several years, Route 96 was operated fare-free to encourage ridership. A $0.50 fare for the in-town trolley service was instituted in April 2004. The fare is consistent with other circulator routes operated by HART in areas outside of downtown. Ridership on Route 96 dropped predictably, but quickly recovered. All HARTride Fare Cards are accepted on the trolley routes, allowing customers using other HART services to ride the circulators at no extra fare. A $10.00 monthly circulator pass providing unlimited rides is also available, providing a significant cost savings.
2-2
Section 2.0
2.3
OTHER IN-TOWN TRANSIT SERVICES
2.3.1
HOOTERS CHANNELSIDE LUNCHTIME EXPRESS
HART operates one other circulator route using replica trolley buses, the Hooters Channelside Lunchtime Express. This service is fully funded by Hooters Restaurant, and operates free of charge to passengers. The trolley bus is easy to identify, with Hooter advertising on the side of the trolley. The lunchtime shuttle operates every 10 minutes on weekdays from 11:30 a.m. to 2:30 p.m. It provides service from several stops in downtown at major office buildings to the Channelside Shops just east of Meridian Avenue near the Florida Aquarium. There are approximately 11 places to eat at the Channelside Shops, including Hooters. The shuttle serves four stops in downtown along Kennedy Boulevard and the Marion Street Transitway: at Lykes Square, City Hall, Washington Street, and Whiting Street. From the Marion Street Transitway, it operates via Whiting Street, Morgan Street, and Channelside Drive. Returning to downtown, it operates via Channelside Drive, Brorein Street, Jefferson Street, and Whiting Street. 2.3.2
TECO LINE STREETCAR SYSTEM
The TECO Line Streetcar System is an electric streetcar line connecting Downtown Tampa with the Channel District and historic Ybor City 2.4 miles to the north. It currently terminates at the Southern Transportation Plaza, where connections to the Route 96 and 98 in-town trolleys can be made. A second phase of construction will extend the streetcar line 1/3 mile to the north along Franklin Street to Whiting Street and the Fort Brooke parking garage. While managed by a not-for-profit corporation, it is operated by HART. The City of Tampa established a special assessment district to raise funding to operate the streetcar system. The standard vehicles operated are replica streetcars. In addition to the Southern Transportation Plaza station, the streetcar line has five stations in the Channel District along St. Pete Times Forum Drive and Channelside Drive in Downtown Tampa, and continues to Ybor City via 13th Street and 8th Street, where there are four additional stations. In the Channel District, the streetcar line serves the St. Pete Times Forum, Channelside Shops,
2-3
Section 2.0 the Florida Aquarium, the American Victory Museum, cruise ship terminals, and the Tampa Port Authority. The streetcar line also provides walking distance access to the rapidly developing Channel District residential area. Nearly 1,800 housing units have been completed or are under construction in this area, with another 2,600 units in the planning stages. The TECO Line Streetcar is operated every 15 to 20 minutes, seven days a week, generally beginning at 11:00 a.m. and ending between 10:00 p.m. and 1:00 a.m., depending on the day of the week. Thirty-minute service is operated from 9:00 a.m. to 11:00 a.m. on Saturday mornings and from 1 a.m. to 2 a.m. Fridays and Saturdays. The regular one-way streetcar cash fare is $2.00, but HARTride Fare Cards are accepted and multi-ride streetcar fare cards are also available. 2.3.3
PRIVATE SHUTTLES
The following privately run shuttles operate in Downtown Tampa. Some are for hotel guests, while two are solely for office building tenants. Hotels
Office Buildings
Wyndham Harbour Island Marriott Waterside Radisson Riverwalk Hyatt Regency Tampa Courtyard by the Marriott Residence Inn by Marriott Holiday Inn City Center *These shuttles are for hotel guests only.
SP Times (employees only) One Harbour Place (tenants only)
2.3.4
REGIONAL HART SERVICE TO DOWNTOWN Downtown Tampa is the focal point of the HART transit service, with 17 local routes in addition to the InTown Trolleys and 12 express routes coming into downtown. Most routes operate to or from the Marion Transit Center (MTC) located at the corner of Marion and Laurel Streets. The MTC, completed in 2003, replaced an older transit center located under I-275, bringing the transit center closer to downtown.
Another key component facilitating downtown transit is the Marion Street Transitway. From Whiting Street to Tyler Street, Marion Street is operated as a bus-only fare-free zone from 6:00 a.m. to 7:00 p.m. Monday through Friday. The transitway is only one block from the northbound alignment of Route 96. With the exception of the In-Town
2-4
Section 2.0 Trolleys, all routes traveling north-south through downtown utilize the transitway. Only eight local routes, excluding Route 96, terminate at the MTC and do not utilize the transitway. The express routes coming into downtown currently utilize the transitway to provide walking distance access to employment locations. Two HART local fixed route bus routes currently operate along similar alignments as the InTown Trolley Hyde Park (Route 98). Route 4 operates between MacDill Air Force Base and Downtown Tampa, with a connection from Hyde Park/SoHo to downtown. Route 4 duplicates the Route 98 alignment between South Howard Avenue and Fanklin Street (Downtown Tampa). However, Route 4 service operates early service but ends earlier in the evening. Route 19 operates between Port Tampa and Downtown Tampa via Tampa General Hospital. Route 19 duplicates the Route 98 along one-way pair streets of Cleveland Street and Platt Street, between South Boulevard and Tampa Street. Like the Route 4, Route 19 operates earlier morning service than the Route 98, and ends service approximately the same time as Route 98 (exception Friday and Saturday evenings in which the Route 98 operates later).
2.4
EVALUATION OF THE IN-TOWN TROLLEY ROUTES
This chapter provides a detailed evaluation of Route 96 and Route 98. It begins with detailed descriptions of the routes, including operational characteristics and market served. It then presents an evaluation of the routes, including route performance and results of ridecheck surveys.
2.5
OPERATIONAL CHARACTERISTICS AND MARKETS SERVED
2.5.1
ROUTE 96 – IN-TOWN TROLLEY DOWNTOWN
This weekday trolley route operates primarily north-south between the MTC and Harbour Island. On the north end, Route 96 begins at the MTC, providing for connections with HART local and express routes while the trolleys layover between trips. From the MTC, the route operates west on Tyler Street to the Main Library and Tampa Performing Arts Center. Between Cass Street and Whiting Street, the route operates on one-way streets, traveling southbound on Tampa Street and northbound on Florida Avenue. This section of the route serves several hotels along Tampa Street, major office buildings, parking facilities (surface lots and garages), and government buildings (City Hall and the Federal Courthouse). South of Whiting Street and the Franklin Street pedestrian mall, the route operates two-way service on Franklin Street, serving the Tampa Convention Center and nearby hotels. It also stops at the current terminus of the TECO Line streetcar at the Southern Transportation Plaza, where passengers can transfer to the streetcar to continue east and north to Ybor City. Continuing
2-5
Section 2.0 south, the route crosses the channel to Harbour Island to the Westin Harbour Island Hotel. From 6:00 a.m. to 6:00 p.m., Route 96 terminates with a loop that circulates through the non-gated portion of the medium to high residential development on Harbour Island. The existing Route 96 alignment is shown in the figure that follows. Route 96 operating characteristics are summarized in Table 2.0 below. TABLE 2.0 ROUTE 96 OPERATING CHARACTERISTICS
Operating Characteristics Service Frequencies: Base (until 6:00 p.m.) Evening (6:00 - 9:00 p.m.) Late (after 9:00 p.m.) Maximum Busses Required Span of Service
Monday Thursday
Friday
15 15 N/A 3 6:00 a.m. 9:00 p.m.
15 15 15 3 6:00 a.m. 10:00 p.m.
Saturday Sunday N/A N/A N/A N/A
N/A N/A N/A N/A
N/A
N/A
Trolley buses on Route 96 currently operate every 15 minutes from 6:00 a.m. to 9:00 p.m., Monday through Thursday. On Fridays, the route operates until 10:00 p.m. No weekend service is provided on Route 96; Route 98 operates in the same general alignment on weekends (shown in Figure 2.0 below). 2.5.2
ROUTE 98 – IN-TOWN TROLLEY HYDE PARK
This trolley route operates primarily east-west between the Southern Transportation Plaza and Harbour Island in Downtown Tampa and the nearby Hyde Park area west of downtown, seven days a week. Hyde Park is a popular shopping, dining, and entertainment area. It is also an established close-in residential neighborhood, undergoing some redevelopment to add higher density housing. On weekends, the route also operates north-south along a modified version of the Route 96 alignment between Harbour Island, the Southern Transportation Plaza, and the Tampa Performing Arts Center. The existing Route 98 alignment is shown in Figure 2.1 below.
2-6
Section 2.0 FIGURE 2.0 ROUTE 96 IN-TOWN TROLLEY DOWNTOWN
2-7
Section 2.0 FIGURE 2.1 ROUTE 98 IN-TOWN TROLLEY HYDE PARK
The weekday Route 98 alignment begins at the Southern Transportation Plaza, where connections can be made from Route 96 and the TECO Line Streetcar. From there, it travels north on Franklin Street a short distance before heading east to Hyde Park. It operates between Franklin Street to South Boulevard via a one-way pair of streets, traveling westbound on Brorein/Cleveland Streets and returning in the eastbound direction via Platt Street. Just west of the Hillsborough River, this section of the route serves the Tampa Tribune westbound and a Publix and Parkside at One Bayshore condominiums eastbound. At South Boulevard, the route turns south and then travels west to serve Hyde Park. It passes by the Old Hyde Park Village at Dakota Avenue, where Route 98 terminated at one time, to an area just west of the Crosstown Expressway where residential and commercial revitalization and development is occurring. At Albany Avenue, the route turns south to operate in a terminal loop around a supermarket commercial development via Albany Avenue, Bristol Avenue, and South Howard Avenue.
2-8
Section 2.0 Eastbound, the route returns to Downtown Tampa and stops at the Southern Transportation Plaza before crossing the channel south to Harbour Island. It turns around at the Westin Harbour Island Hotel and ends its trip at the Southern Transportation Plaza, where the route lays over. On weekends, the routing is more complex. From the Southern Transportation Plaza, Route 98 operates north-south through downtown to the Tampa Performing Arts Center, primarily via Ashley Street. The route operates north on Franklin Street past the Tampa Convention Center and nearby hotels to Whiting Street where the pedestrian mall begins. At the Franklin Street pedestrian mall, the route operates northbound on Florida Avenue and westbound on Kennedy Boulevard. Route 98 then turns north on Ashley Drive, which is a wide 4-lane roadway with landscaped medians north of Kennedy Boulevard. This section of the route serves the Tampa Museum of Art, Curtis Hixon Park, and the Main Library. At Tyler Street, the route loops west to serve the Tampa Performing Arts Center. Returning southbound, Route 98 operates on Ashley Street to Whiting Street, serving the Sheraton Tampa Riverwalk Hotel and the Hyatt Regency Hotel one block away. It returns to the Southern Transportation Plaza via Franklin Street. Some clarification on how Route 98 operates on weekends as it transitions from its east-west leg to the north-south leg is needed. After analysis and discussion of the ridecheck data provided by HART service planning staff, it is our understanding that Route 98 operates as one continuous route, serving both the east-west and north-south sections of the route. The ridecheck data also indicates that the route operates between the east-west leg and north-south leg without an intermediate stop at the Southern Transportation Plaza. If this is the case, the route is traveling the north-south leg twice in the course of one round-trip cycle between Hyde Park and the Southern Transportation Plaza. In addition, the ridecheck data indicates some stops downtown are skipped, depending on the direction of travel. While this provides the benefit of providing service directly between Hyde Park and the Performing Arts Center without an intermediate deviation to the Southern Transportation Plaza, it is not without negative consequences. First and foremost, the routing could be very confusing to the public. It also creates the possibility of significant out-of-direction travel for some riders, as well as significant extra travel time. To illustrate, assume a visitor staying at the Embassy Suites Hotel wishes to take Route 98 to Hyde Park and boards the trolley at the Southern Transportation Plaza. Rather than going directly to Hyde Park, he/she would have to ride the trolley up to the Performing Arts Center and back to Brorein Street before the route turns westward to go to Hyde Park. However, further discussion with HART scheduling staff indicated that Route 98 has been modified from the alignment described above to operate as two separate routes, both laying over at the Southern Transportation Plaza. One route provides east-west service between the Southern Transportation Plaza and Hyde Park, while the other provides north-south service between Harbour Island and the Performing Arts Center. While this is much simpler and direct, as well
2-9
Section 2.0 as easy to explain to the public, it does have the drawback of requiring a transfer to get from Hyde Park to the Cultural District of downtown. Route 98 operating characteristics are summarized in Table 2.1 below. TABLE 2.1 ROUTE 98 OPERATING CHARACTERISTICS
Operating Characteristics Service Frequencies: Base (until 6:00 p.m.) Evening (6:00 - 9:00 p.m.) Late (after 9:00 p.m.) Maximum Busses Required Span of Service
Monday Thursday
Friday
Saturday
Sunday
15 30 N/A 1 11:30 a.m. 9:00 p.m.
15 15 30 1 11:30 a.m. 11:00 p.m.
15 15 30 4 11:30 a.m. 11:00 p.m.
30 30 N/A 2 12:00 p.m. 8:30 p.m.
Trolley buses on Route 98 currently operate every 15 minutes from 11:30 a.m. to 6:00 p.m., and every 30 minutes from 6:00 p.m. to 9:00 p.m., Monday through Thursday. On Fridays and Saturdays, the route operates every 15 minutes until 9:00 p.m., and every 30 minutes thereafter until 11:00 p.m. Sunday service is provided from noon to 8:30 p.m. every 30 minutes. 2.5.3
MONTHLY OPERATING STATISTICS AND ROUTE PERFORMANCE
This section presents monthly operating statistics and route performance for the two In-Town Trolley routes. Three key route productivity measures are presented: riders per trip, riders per revenue hour, and riders per revenue mile. Based on Fiscal Year (FY) 2006 monthly data provided by HART, January 2006 was selected to most closely reflect an average month in terms of ridership and operations. 2.5.4
ROUTE 96 – IN-TOWN TROLLEY DOWNTOWN
Monthly ridership on Route 96 was 6,842 weekday riders. The route averaged 7.4 riders per revenue hour, and 1.3 riders per revenue mile (shown in Table 2.2).
2-10
Section 2.0 TABLE 2.2 ROUTE 96 MONTHLY OPERATING STATISTICS AND ROUTE PERFORMANCE
Monthly Ridership Days of Service Daily Trips Monthly Trips Daily Revenue Hours Monthly Revenue Hours Daily Revenue Miles Monthly Revenue Miles Route Productivity: Riders Per Trip Riders per Revenue Hour Riders per Revenue Mile
2.5.5
Weekday 6,842 21 65 1,365 44 925 254 5,335
Saturday N/A N/A N/A N/A N/A N/A N/A N/A
Sunday N/A N/A N/A N/A N/A N/A N/A N/A
Total 6,842 21 65 1,365 44 925 254 5,335
5.0 7.4 1.3
N/A N/A N/A
N/A N/A N/A
5.0 7.4 1.3
ROUTE 98 – IN-TOWN TROLLEY HYDE PARK
Total monthly ridership on Route 98 was 4,080 riders, with weekday ridership of 2,326. Route productivities for this route are best on Saturdays, with 8.4 riders per revenue hour, and 1.2 riders per revenue mile. On weekdays, the route averaged 6.4 riders per revenue hour, but only 0.7 riders per revenue mile on weekdays (shown in Table 2.3 below). Like the Route 96, this route also averages very low numbers with regards to riders per trip, with weekdays averaging 1.6, Saturdays 1.7, and Sundays 1.3. Essentially, many empty buses traveling around this route alignment. Significant route changes (e.g., alignment, service levels, etc) are required to improve service performance to acceptable levels (typically 20 times or better than that exhibited). TABLE 2.3 ROUTE 98 MONTHLY OPERATING STATISTICS AND ROUTE PERFORMANCE
Monthly Ridership Days of Service Daily Trips Monthly Trips Daily Revenue Hours Monthly Revenue Hours Daily Revenue Miles Monthly Revenue Miles Route Productivity: Riders Per Trip Riders per Revenue Hour Riders per Revenue Mile
Weekday 2,326 21 70 1,462 17 362 156 3,275
Saturday 1,384 5 166 830 33 165 235 1,173
Sunday 370 4 72 288 22 89 162 650
Total 4,080 30 308 2,580 72 615 553 5,098
1.6 6.4 0.7
1.7 8.4 1.2
1.3 4.2 0.6
1.6 6.6 0.8
2-11
Section 2.0
2.6
RIDECHECK SURVEY RESULTS
Integral to the analysis of existing service is the analysis of existing route ridership. This analysis places particular focus on differences in existing transit trip patterns by time of day and by stop. Representative sample stop level data for different times of day was provided by HART, covering FY 2006 (October 1, 2005 through September 30, 2006). The data was collected through the use of Automated Passenger Counters (APCs) and National Transit Database (NTD) manual surveys. This section summarizes the data by time of day, by stop, and by segment for each day the routes operate. Full detailed ridecheck data provided by HART is included as Appendix A. It is important to note that due to the lack of multiple small buses with APCs, as well as primary use for NTD reporting, the sample sizes are fairly small and should not be considered as representative samples. 2.6.1
ROUTE 96 – IN-TOWN TROLLEY DOWNTOWN
Table 2.4 below summarizes the Route 96 ridecheck data by time period. The cumulative totals for all trips surveyed are presented, as well as averages for each trip to allow for comparisons across each time period. The trips were surveyed over the route’s span of service from 6:00 a.m. to 9:00 p.m. Inconsistent with monthly ridership data, these surveys record higher ridership performance. As noted earlier, these ridership samples are minimal and generally reflect those trips with higher than average ridership volumes. Based on monthly ridership data (identified above), there are equally as many trips with lower than average riders per trip, as the average monthly riders per trip is around five. TABLE 2.4 ROUTE 96 RIDECHECK SURVEY RESULTS BY TIME PERIOD WEEKDAY SERVICE
Time Period Loop AM Peak (5:30 a.m. - 9:00 a.m.) Mid Peak (9:00 a.m. - 3:30 p.m.) PM Peak (3:30 p.m. - 6:30 p.m.) Off Peak (6:30 p.m. 0 5:30 a.m.) Total
Trips Surveyed 2 8 5 1 16
Cumulative Average Trip Maximum Maximum Ons Offs Load Ons Offs Load 20 91 52 6 169
20 89 52 6 167
10 52 30 5 81
10 11 10 6 11
10 11 10 6 10
5 7 6 5 5
The results reveal quite consistent levels of ridership per trip across the AM Peak, Mid Peak, and PM Peak periods, at 10 to 11 boardings and alightings per trip. After 6:30 p.m., ridership per trip drops off by approximately 40 percent. Maximum line loads are consistent throughout the entire day, never exceeding seven passengers on-board at any stop along the route.
2-12
Section 2.0 Table 2.5 and Figure 2.2 below summarize Route 96 ridership for the entire day at the stop and segment level. By far, the highest ridership stops are at the two points where transfers to other routes and services are possible: the MTC and the Southern Transportation Plaza. Maximum passenger loads of 5.1 occurred at Franklin and Whiting Streets. The lowest ridership occurs along the northern segments of Florida Avenue and Tampa Street, areas where there is currently significantly less development than south of Kennedy Boulevard. TABLE 2.5 ROUTE 96 RIDECHECK SURVEY SUMMARY WEEKDAY SERVICE
Highest Ridership Stops MTC Southern Transportation Plaza Tyler Street at Ashley Drive Maximum Load Point Westbound Franklin Street and Whiting Street
% of Trips 37% 21% 6% Load/Trip 5.1
FIGURE 2.2 RIDERSHIP AT STOP AND SEGMENT LEVEL
E-F, 7% F-A, 1% D-E, 9%
A , 37%
D, 21%
C-D, 9%
A A-B B-C C-D D D-E E-F F-A
A-B, 7% B-C, 3%
Marion Transit Ctr. Marion Transit Ctr. to Performing Arts Ctr. Performing Arts Ctr. to Tampa St @ Kennedy Blvd. Tampa St. @ Kennedy Blvd. to S. Transportation Ctr. S. Transportation Plaza S. Transportation Plaza to Harbour Island S. Transportation Plaza to Florida Ave. @ Jackson St. Florida Ave. @ Madison St. to Marion Transit Ctr.
2-13
Section 2.0 2.6.2
ROUTE 98 – IN-TOWN TROLLEY HYDE PARK
Tables 2.6 through 2.8 below summarize the Route 98 ridecheck data by day and time period. The cumulative totals for all trips surveyed are presented, as well as averages for each trip to allow for comparisons across each time period. The trips were surveyed over the route’s span of service. Like Route 96 above, trips surveyed on the Route 98 are only a small sample of daily trips provided. Thus, average riders per trip from this survey average higher than the average monthly numbers, indicating a sample of higher ridership trips Ridership levels per trip range from one to eight, which is significantly lower than the Route 96 ridership levels. The highest ridership levels occurred on Saturdays in the Mid Peak period eastbound. Maximum line loads are also low, consistent with ridership levels.
TABLE 2.6 ROUTE 98 RIDECHECK SURVEY RESULTS BY TIME PERIOD WEEKDAY SERVICE
Time Period Westbound AM Peak (5:30 a.m. - 9:00 a.m.) Mid Peak (9:00 a.m. - 3:30 p.m.) PM Peak (3:30 p.m. - 6:30 p.m.) Off Peak (6:30 p.m. 0 5:30 a.m.) Total Eastbound AM Peak (5:30 a.m. - 9:00 a.m.) Mid Peak (9:00 a.m. - 3:30 p.m.) PM Peak (3:30 p.m. - 6:30 p.m.) Off Peak (6:30 p.m. 0 5:30 a.m.) Total
Trips Surveyed
Cumulative Average Trip Maximum Maximum Ons Offs Load Ons Offs Load
N/A 7 5 1 13
N/A N/A 16 17 6 7 2 3 24 27
N/A 16 6 2 24
N/A 2 1 2 2
N/A 2 1 3 2
N/A 2 1 2 2
N/A 6 3 2 11
N/A N/A 19 18 11 11 8 8 38 37
N/A 17 11 8 36
N/A 3 4 4 3
N/A 3 4 4 3
N/A 3 4 4 3
2-14
Section 2.0 TABLE 2.7 ROUTE 98 RIDECHECK SURVEY RESULTS BY TIME PERIOD SATURDAY SERVICE
Time Period Westbound AM Peak (5:30 a.m. - 9:00 a.m.) Mid Peak (9:00 a.m. - 3:30 p.m.) PM Peak (3:30 p.m. - 6:30 p.m.) Off Peak (6:30 p.m. 0 5:30 a.m.) Total Eastbound AM Peak (5:30 a.m. - 9:00 a.m.) Mid Peak (9:00 a.m. - 3:30 p.m.) PM Peak (3:30 p.m. - 6:30 p.m.) Off Peak (6:30 p.m. 0 5:30 a.m.) Total
Trips Surveyed
Cumulative Average Trip Maximum Maximum Ons Offs Load Ons Offs Load
N/A 9 8 3 20
N/A N/A 36 36 17 16 5 5 58 57
N/A 23 14 5 24
N/A 4 2 2 3
N/A 4 2 2 3
N/A 3 2 2 1
N/A 8 7 4 19
N/A N/A 62 62 11 8 8 8 81 78
N/A 60 11 8 78
N/A 8 2 2 4
N/A 8 1 2 4
N/A 8 2 2 4
TABLE 2.8 ROUTE 98 RIDECHECK SURVEY RESULTS BY TIME PERIOD SUNDAY SERVICE
Time Period Westbound AM Peak (5:30 a.m. - 9:00 a.m.) Mid Peak (9:00 a.m. - 3:30 p.m.) PM Peak (3:30 p.m. - 6:30 p.m.) Off Peak (6:30 p.m. 0 5:30 a.m.) Total Eastbound AM Peak (5:30 a.m. - 9:00 a.m.) Mid Peak (9:00 a.m. - 3:30 p.m.) PM Peak (3:30 p.m. - 6:30 p.m.) Off Peak (6:30 p.m. 0 5:30 a.m.) Total
Trips Surveyed
Cumulative Average Trip Maximum Maximum Ons Offs Load Ons Offs Load
N/A 1 3 1 5
N/A N/A 2 2 6 6 1 1 9 9
N/A 2 6 1 9
N/A 2 2 1 2
N/A 2 2 1 2
N/A 2 2 1 2
N/A 1 4 1 6
N/A N/A 3 3 6 6 1 1 10 10
N/A 3 5 1 8
N/A 3 2 1 2
N/A 3 2 1 2
N/A 3 1 1 1
2-15
Section 2.0 The tables and charts below (Tables 2.9 through 2.11 and Figures 2.3 through 2.5) summarize Route 98 ridership for weekdays, Saturdays, and Sundays at the stop and segment level. By far, the highest ridership stop each day was at the Southern Transportation Plaza, where transfers to Route 96 and the TECO Line Streetcar are possible. On weekdays, the other highest ridership stops were in Hyde Park, at the end-of-line at Albany Avenue, as well as Old Hyde Park Village at Dakota Street. The lowest ridership occurs between Downtown Tampa and Hyde Park. On Saturdays and Sundays, the busiest stops were in Old Hyde Park Village and the Performing Arts Center, reflecting the use of the route by area residents for entertainment and shopping purposes, both downtown for exhibitions and performances in the Cultural Arts District and in Old Hyde Park Village. There was virtually no ridership activity on the segments between Downtown Tampa and Hyde Park. Figures 2.3 through 2.5 identify ridership distribution along the route alignment. Although the highest rider boardings occur at the Southern Transportation Plaza, higher boarding volumes also occur along Swann Avenue at Albany Avenue and at Dakota Avenue. These three stops account for 96 percent of the westbound boardings and 86 percent of the eastbound boardings. This indicates point-to-point travel to destinations versus ridership turnover typical of local fixed route transit service.
TABLE 2.9 ROUTE 98 RIDECHECK SURVEY SUMMARY WEEKDAY SERVICE
Westbound Southern Transportation Plaza Albany Avenue at Swann Avenue Swann Avenue at Dakota Avenue Westbound Southern Transportation Plaza
Highest Ridership Stops % of Trips Eastbound 47% Southern Transportation Plaza 25% Swann Avenue at Dakota Avenue 24% Albany Avenue at Swann Avenue Maximum Load Point Load/Trip Eastbound 2.0 Platt Street at Plant Avenue
% of Trips 52% 21% 13% Load/Trip 3.3
2-16
Section 2.0 FIGURE 2.3 ROUTE 98 RIDERSHIP AT STOP AND SEGMENT LEVEL WEEKDAY SERVICE
A-F, 0% D-E, 18%
A, 50%
C-D, 24%
B-C, 2% A-B, 6%
A A-B B-C C-D D-E A-F
S. Transportation Plaza S. Transportation Ctr. to S. Boulevard @ Platt St. S. Boulevard @ Platt St. to Swann Ave. @ Edison Ave. Swann Ave. @ Edison Ave. to Swan Ave. @ Platt St. Swann Ave. @ Platt St. to Swann Ave. @ Dakota St. S. Transportation Ctr. to Harbour Island
TABLE 2.10 ROUTE 98 RIDECHECK SURVEY SUMMARY SATURDAY SERVICE
Westbound Southern Transportation Plaza Swann Avenue at Dakota Avenue Macinnes Place at Fortune Street Westbound Southern Transportation Plaza
Highest Ridership Stops % of Trips Eastbound 37% Southern Transportation Plaza 23% Swann Avenue at Dakota Avenue 16% Ashley Drive at Tyler Street Maximum Load Point Load/Trip Eastbound 2.1 Franklin Street at Whiting Street
% of Trips 45% 20% 13% Load/Trip 4.0
2-17
Section 2.0 FIGURE 2.4 ROUTE 98 RIDERSHIP AT STOP AND SEGMENT LEVEL SATURDAY SERVICE
G-H, 19%
A, 41%
A-G, 4% A-F, 2%
D-E, 16%
A-B, 0% C-D, 18%
A A-B B-C C-D D-E A-F A-G G-H
B-C, 0%
S. Transportation Ctr. S. Transportation Ctr. to S. Boulevard @ Platt St. S. Boulevard @ Platt St. to Swann Ave. @ Edison Ave. Swann Ave. @ Edison Ave. to Swan Ave. @ Platt St. Swann Ave. @ Platt St. to Swann Ave. @ Dakota St. S. Transportation Ctr. to Harbour Island S. Transportation Ctr. to Ashley Dr. @ Zack St. Ashley Dr. @ Zack St. to Performing Arts Ctr.
TABLE 2.11 ROUTE 98 RIDECHECK SURVEY SUMMARY SUNDAY SERVICE
Westbound Southern Transportation Plaza Macinnes Place at Fortune Street Swann Avenue at Dakota Avenue Swann Avenue at Rome Avenue Albany Avenue at Swann Avenue Westbound Franklin Street at Whiting Street
Highest Ridership Stops % of Trips Eastbound 44% Southern Transportation Plaza 17% Albany Avenue at Swann Avenue 11% Swann Avenue at Dakota Street 11% Ashley Drive at Tyler Street 11% Maximum Load Point Load/Trip Eastbound 1.8 Ashley Drive at Tyler Street
% of Trips 40% 25% 10% 10%
Load/Trip 1.3
2-18
Section 2.0 FIGURE 2.5 ROUTE 98 RIDERSHIP AT STOP AND SEGMENT LEVEL SUNDAY SERVICE
G-H, 13%
A-G, 5% A-F, 3% A, 42%
D-E, 24%
A-B, 0% * Does not include S. Transportation Plaza (STP). STP activity totals 16. C-D, 11%
A A-B B-C C-D D-E A-F A-G G-H
2.7
B-C, 3%
S. Transportation Ctr. S. Transportation Ctr. to S. Boulevard @ Platt St. S. Boulevard @ Platt St. to Swann Ave. @ Edison Ave. Swann Ave. @ Edison Ave. to Swan Ave. @ Platt St. Swann Ave. @ Platt St. to Swann Ave. @ Dakota St. S. Transportation Ctr. to Harbour Island S. Transportation Ctr. to Ashley Dr. @ Zack St. Ashley Dr. @ Zack St. to Performing Arts Ctr.
CONCLUSIONS AND OBSERVATIONS: EXISTING CONDITIONS
The existing In-Town Trolleys serve multiple purposes reflective of Downtown Tampa’s character and mix of land uses. In concert with the TECO Line Streetcar, the Hooters Channelside shuttle, and regional HART local and express route, Tampa has successfully created a network of downtown transit services. However, these services tend to operate independent of one another. These services provide access and connections within the core area of downtown and to surrounding in-town attractions and residential areas. The following key findings from the evaluation of the In-Town Trolleys were drawn from a review of existing data and studies, field observations, and an analysis of route operations, performance, and ridership characteristics.
2-19
Section 2.0 2.7.1
ROUTE 96 – IN-TOWN TROLLEY DOWNTOWN
Route 96 has been in operation since 1999, and serves the north-south core of Downtown Tampa, including major office buildings, downtown hotels, the convention center, and the cultural arts district. It is anchored to the north by the MTC, providing connections to regional HART bus services, and to the south by the Southern Transportation Plaza, providing connections to the TECO Line Streetcar and Route 98. It also provides a connection to the medium to high density residential development on Harbour Island. The Route 96 service exhibits the following characteristics which inhibit its effectiveness and performance: •
Complexity - Because a portion of Franklin Street is pedestrian-only, the route splits north of Whiting Street and operates in a one-way pair to Tyler Street. Two short loops on the northern end provide service to the MTC and the Tampa Performing Arts Center, creating alignment complexities that may be confusing to passengers.
•
Insufficient Run Time – Service on Route 96 is currently provided every 15 minutes with three trolley buses. Bus operators sometimes have difficulty maintaining this headway, shortening their 10-minute recovery time at the MTC and possibly causing missed connections with other HART bus routes.
•
Infrequent Service - Service every 15 minutes is not attractive for workers going to lunch or for traveling just a few blocks away, and headways should be improved to 10-minutes, preferably five minutes or less. A potential drawback to such a change would be headways that are inconsistent with the TECO Line Streetcar and Route 98. Although improved service frequencies can create miss timed transfer, it is still a better level of service than previously provided.
Ridecheck data for the route indicates fairly consistent ridership over the course of each weekday, with reduced ridership only in the evenings. Ridership levels in the midday equal to the AM and PM peaks seem to indicate the route is serving multiple transit markets over the course of the day. It is apparent from the high ridership activity at the MTC and responses to onboard survey questions that a significant portion of Route 96 passengers are regional HART bus customers who use the route to complete their trip into downtown to work. The second highest ridership activity takes place at the Southern Transportation Plaza. Some of the riders getting on or off at this location may be transferring to the TECO Line Streetcar or Route 98, while others may be going to or from the two adjacent hotels or the Convention Center. Consistent with the existing land uses and densities, ridership activity drops off significantly along Florida Avenue and Tampa Street north of Kennedy Boulevard. Ridership in this portion of the route can be expected to grow as residential and mixed-use developments planned in the North Franklin District are completed. Existing ridership levels between Harbour Island and downtown are fairly significant. However, the route only provides service to the island’s residential developments until 6:00 p.m. Continuing this service at night has the potential to boost this ridership.
2-20
Section 2.0 Based on this analysis, a list of primary ridership markets served by Route 96 includes: •
HART local and express passengers, particularly those who live north of downtown, who are able to transfer to Route 96 at the MTC to reach their final downtown destination;
•
Downtown workers living in the rapidly developing Channel District, via transfers from the TECO Line Streetcar;
•
Commuters to downtown who can opt to park in less expensive remote parking lots and ride the trolley to their destination, rather than in downtown parking garages;
•
Downtown workers patronizing lunch venues throughout downtown;
•
Harbour Island residents who work downtown and do not need a car throughout the day;
•
Business travelers, conventioneers, and other visitors, particularly those staying in Downtown Tampa hotels; and
•
Area residents and visitors attending weekday functions at the Performing Arts Center or Tampa Museum of Art.
2.7.2
ROUTE 98 – IN-TOWN TROLLEY HYDE PARK
The trolley bus route has only been in operation since November 2004. On weekdays, it provides an east-west connection between Downtown Tampa and the shopping, entertainment, and residential areas of Hyde Park. It provides connections at the Southern Transportation Plaza to both the TECO Line Streetcar and Route 96 for riders to complete trips to the Channel District or the core area of downtown to the north and also provides a connection to Harbour Island. The Route 98 service exhibits the following characteristics which inhibit its effectiveness and performance: •
Infrequent Service - Like the Route 96, weekday service is provided every 15 minutes and every 30 minutes in the evening.
•
Short Span of Service - Because the initial intent of the route was to provide lunchtime and evening access to the shopping, dining, and entertainment venues in Hyde Park, service on this route does not begin until 11:30 a.m.
•
Duplication of Existing Fixed Route Service – The existing Route 4 and parts of Route 19 serve the same alignment as the Route 98. These local fixed route services also provide earlier morning service.
2-21
Section 2.0 •
One-Way Pair Alignments with Limited Pedestrian Access – The Route 98 operates along Cleveland Street westbound and Platt Street eastbound between downtown and South Boulevard. One-way alignments generally inhibit transit ridership and cause passenger confusion. The alignment along the Cleveland/Platt Streets one-way pair between Downtown Tampa and Hyde Park is almost completely unproductive. If service on Route 98 is to continue in the future, this segment should be re-evaluated to identify a more productive alignment.
On weekends, the route serves two functions. In addition to the east-west alignment, Route 98 also operates in a north-south alignment very similar to weekday Route 96, primarily to serve the Cultural Arts District. Clarification is needed regarding the alignment weekend pattern, as there are two understandings of how this service is currently operating. On Saturdays, service is operated every 15 minutes during the day, and every 30 minutes from 9:00 p.m. to 11:00 p.m. Sunday service is only operated every 30 minutes until 8:30 p.m. By far, the highest ridership activity on this route takes place at the Southern Transportation Plaza, seven days a week. Some of the riders getting on or off at this location may be transferring to the TECO Line Streetcar or Route 96, while others may be going to or from the two adjacent hotels or the Convention Center. Ridership on Route 98 is significantly lower than Route 96, and is particularly apparent when examining the number of riders per trip on weekdays. However, the data also indicates that Saturday is a much more productive day for the route. It has been suggested that this is due both to people going to weekend events at the Cultural Arts District and people going from downtown to Hyde Park to eat and shop. The ridecheck data seems to support this conclusion, given the higher ridership activity at both the Performing Arts Center and Old Hyde Park Village. Based on this analysis, a list of primary ridership markets served by Route 98 include: •
Area residents and visitors wishing to go downtown on the weekends for dining or attending weekend functions at the St. Pete Times Forum, Tampa Convention Center, Performing Arts Center, or Tampa Museum of Art;
•
Business travelers, conventioneers, and other visitors who wish to go to Hyde Park to eat or shop;
•
Hyde Park residents who work downtown and do not need a car throughout the day; and
•
Downtown workers patronizing lunch venues in Hyde Park.
2-22
Section 3.0 DOWNTOWN TAMPA ENVIRONMENT 3.1
EXISTING DOWNTOWN CONDITIONS
In order to evaluate the future market potential for an improved circulator service, it is necessary to identify the existing downtown environs, including office space, educational institutions, recreational and entertainment activities, inventory of parking, and residential development. These facilities and activities comprise the General Market Areas known as: Entertainment/Event, Employment, and Residential (see Figure 3.0). Additionally, the expected number of new residents by the year 2008 and 2012 will aid in the identification of new routes. Existing residential development and development that is expected to be completed by 2008 or 2012 has been identified and the general location of these developments, along with the existing residential development is shown previously on Figure 1.0. The planning area for the Tampa Downtown Circulator Study is bounded by North Boulevard on the west, Palm Avenue on the north, 22nd Street on the east and Harbour Island on the south. Downtown Tampa is approximately 760 acres in size and some of the basic city services include: •
Total Retail Space – 764,617 square feet
•
Number of grocery stores – 1
•
Number of drug stores – 2
•
Number of movie theaters – 2
•
Number of bookstores – 3
•
Number of banks – 18
•
Number of churches – 8
•
Number of schools – 7
•
Number of medical offices – 8
•
Number of hotels – 9
•
Number of hotel rooms – 2,673
(Source: Tampa Downtown Partnership, April 2006)
3-1
4
Map Not To Scale PALM AVE P AV
PALM AVE
VISITORS VISIT CENT TER CENTER
9TH AVEE OAK AVE
CENTRO CE ENTRO
275
8TH 8 TH AVE YBO OR YBOR
7TH AVE
7TH H AVE
HENDERSON AVE
ASHLEY PLAZA
AY RKW ITT PA ANS T TR E E STR IO I N MAR
BRO
LV D
BA Y
EB OR
OU
GH
BA YS H
OR
PLANT AVE
HI
LL
SB
BAY ST
TAMPA GENERAL HOSPITAL
RIV ERW ALK
RN TION THE A SOU NSPORT TRA ZA PLA PA T TAMIO R OT MARERSIDE WAT
12TH ST 12
DIA ST MERIDIAN
ST. PETE ST PETE ST.
IAL
BLV D
TIMES FORUM M FORUM
E OBE NCH COTA ARK P
L NNE CHA N O S RI GAR
AM D NDH AN WY UR ISL O TEL B R HA HO
CRUIS SE CRUISE TER TERMIN T AL TERMINAL 2
EFIC
TH SOUIONAL REGARAGE G
D BLV ND ISSLA
BAYSHORE BLVD. LINEAR PARK
AZEELE ST
FLORID FLORIDA DA AQUARIUM AQUAR A RIUM M
E LSID NNE CHA
22ND ST
21ST ST
20TH ST
19TH ST
Hotel A&E Venue, Educational Center Parking Structure Transportation Center Park
BEN
TAMPA AMPA CONVEN NTION CONVENTION CENTER C R
PLATT ST
Y ASS EMBITES SU
CRUISE C I CRUISE TERMINAL TERM MINAL I 3
BALL ST BA
UR RBO S HA
TAMPA A BAY BA HISTORY HISTOR RY CENTER CENTE ER
Office/Employment Center Government Building
CUMBERLAND AVE C CUMBE VE
EUNICE ICE ST
T POS IIC CE OFF
BROREIN ST CLEVELAND ST
CAESAR ST
OY S
S REIN
TAMPA TRIBUNE
H ST 11TH 11
T SH S BRU
EL
MO
WALTON ST
CUMBERLAND CUM AVE
ER
BE
PO PORT P ORT OR ORT AUTHORITY AUTH HORITY R PARKING PARK P A K ARK KING ING GARAGE GARA AR A RAG A E
CHANNELSIDE CH CHA NELSIDE DR
WA Y SS NE XP RE
FINLEY ST
T
ECONOMY INN
18TH ST
KW AY PA R O CC I
ST R ENO GOV
T ST EAS
ST ON ERS JEFF
T CE S PIER
T LL S
WASHINGTON WASH WA H NGT HINGTON ST
Residential Development Existing Complete by 2008 Complete by 2012
WHITTING ST WHITING
LE
FALK THEATER
CRUISE TAMPA T TAM MPA TERMINAL 6 PORT POR P RT AUTHORITY A AUT UT TH HO HEADQUARTERS H HEADQ DQ Q
G ST
ITIN
T GS ITIN WH RAGE GA
GRAND CENTRAL AVE
HYDE PARK AVE
T ST EAS
E A AV RID FLO
CA YM
WN NTOOL DOW HO LLOSHIP SC E P R RAM N ST TNE GTO PAR HIN WAS
WH
KE OO T BR FORRAGE A G
ARTISTS ART TIST T TS S UNLIMITED U UN NLIMIT TED
OOL SCH RD BOA
NT Y COU AGE GAR N ST KSO JAC
N ST RGA MO
RADISSON SO ON RIVERWALK ALK K
KE
N BOULEVARD OULEVA VA ARD RD
T IN S NKL FRA
ST PA TAM
DR LEY ASH
D
BLV
ST
N ST ISO JOE A MAD HILLLUR USE C RTHORE A COUSQU LVD E OLIC RS DY B NNE NTY PA PUARTE M E M K A U T ADQ SEU CO TER HE ND MU ES CEN LYK IGHT A L GAS UARE L L A H SQ Y IT C ZA P LA
TT HYA NCY E REG PA TAM
KENNEDY NNED BLVD B
ST
DY NNE
Text Te
Text
K
HENRY B. PLANT PARK
MADISON ST ST
Ttext Te Text Text Te Text
R YO
RI VE R
TAM TAMPA T MPA PA A M MUSEUM M OF O F ART
OR
IS RT RK CU N PA O X I H
TWIGGS ST
ST
WILLIAM W POE PO OE E GARAGE GARAGE
HI LL SB OR OU GH
RB
S ST UND CAS YHO ERS GRE ATION GHTM FIG ST S I EU FIR N SEU T BO AL S M B MB IB I K G DER E ECO E POL LAKE DIIN NG FE HOUS EDG THOUS ER UIL R RT IMBERAL B U U T O O S ST C C IGG E FED T W ARAG K ST E G ZAC S U A O P SE RTH TAM ER HOU COU EUSE AT NTY SE COURT X T NTY I E R THE COUTHOU GS S COUDAPTIV NNE G IG A R W A T COU
AY
ARY
UNION STATION/ AMTRAK
CK
LIBR
T ER S TYL
M
LK RWA
RIVE
TAM TAMPA AMPA BA BAY AY A Y PERFORMING P PERFORM MIIING NG ARTS A RTS CENTER C CENTE TE ER
CASS ST
UNIVERSITY UNIVERSITY OF TAMPA
LEE ROY SELMON EXPRESSWAY
T POSIC I E OFF
NN CE IN DEN TT IID RES ARRIIO BY M ARD RTY OTT COU ARRIO Y B M
General Market Areas
HA
N MA HERASSEY M ARK P
TAMPA PA PREPARATORY PREP REPAR PAR RATOR RATO R ORY SCHOOL SCHOO OLL O
ADAMO DR
CENTRAL CEN CE NTRAL NTRA TRAL TRAL ALL PARK PARK K VILLA VILLAGE LLAGE GE G E ((Proposed Proposed Propose Pr po oseed d Bou Bound Boundaries) und dari daries) a
R RO ROYAL YAL ST N ST RISSO HAR
2ND AVE
NU
FO FORTUNE O TUNE ST
TAMPA WATERSPORTS CENTER
PERRY P ERRY Y HARVEY ARVEY EY SR. SR R.. PARK P ARK
NEBRASKA AS AVE
MARION MAR AR RIO IO TRANSIT TR RAN RANS R A SIT S CENTER CEN C ENTE ER E
ORANGE ST ORAN O S
RIVERFRONT PARK
NB BOULEV BOULEVARD O
PA PARK TRAMMELL AM A MMELL MM BUILDING BUI LLDIING I G
ST
JJEF EFFE F FFERSON ST JEFFERSON
REL
LAU
LAURELL ST
3RD AVE
SCO SCOT SCOTT OTTT ST ST IN INDIA NDIA ST
LAUREL ST
17TH ST
KAY ST
4TH AVE VE
YBOR CHANNEL
E C AR LTTON AVE
KA KAY AY Y ST
DOYL
BLAKE HIGH SCHOOL GREEN ST
GOVERNOR ST GO GOVER G
3RD AVE
Figure 3.0
5TH AVE VE
16TH ST
STETSON UNIVERSITY O UNI ON IVERSI V R Y VER COLLEGE COLLLE EGE OF LA EGE LLAW AW
ESTELLE ST ESTELLE ST
15TH ST
ESTELL ESTELLE STE ST
D CUBA C DE BLICA B AVENIDA REPUBLICA
PIERCE ST
6TH AVE A
Day Time Circulator Event Circulator Entertainment/Event Employment Residential
June 2007
Section 3.0
3.2
ENTERTAINMENT AND EVENTS
Downtown Tampa provides various entertainment venues and recreational opportunities, attracting not only downtown residents, but also people from surrounding communities and cities and regionally. The number of attendees to a downtown attraction, concert, exhibit or cultural venue in 2005 exceeded 2.4 million. The following venues and attractions are represented previously on Figure 1.0. 3.2.1
ST. PETE TIMES FORUM The St. Pete Times Forum is located in the South Central Business District and is home to the Tampa Bay Lightning, ranking as the number two arena in the country. The Forum holds concerts, sporting events, and spiritual conferences that attract event-goers from the Tampa Bay area and regionally. About 200 events per year are held at the Forum, with the peak event times from September to May. The Forum has approximately 1,500 employees.
3.2.2
CHANNELSIDE
Channelside, located in the southeast portion of Downtown Tampa, offers a wide array of activities for the downtown resident or visitor, including dining, movies, shopping, or bowling. The restaurants/venues listed below are some of the entertainment options Channelside has to offer.
3-3
Section 3.0 Bennigans Tinatapas Grille 29 Gallagher’s Steak House Hooters Banana Joes Joffrey’s Coffee and Tea Company Howl at the Moon N.Y.P.D. Pizza Delicatessen Margarita Mamas Stumps Supper Club Sling Shots Thai Thani Ciaras Cold Stone Creamery Splitsville White House Gear Wine Design Surf Down Under Paintings of the World Qachbal’s Chocolatier Channelside Cinemas and Imax Pirate’s Cove Bar and Market (Coming in 2007) 3.2.3
TAMPA BAY PERFORMING ARTS CENTER The Tampa Bay Performing Arts Center, a 290,000 square foot state-of-the-art complex is located on the east bank of the Hillsborough River. The Center boasts more than 600 performances, classes, and events and saw over 600,000 patrons last year.
3.2.4
TAMPA CONVENTION CENTER
The 600,000 square foot convention center sits on Tampa’s waterfront, hosting a variety of conventions, tradeshows, and other special events. The number of convention attendees topped 300,000 in 2005. The convention center is located within walking distance of hotels, restaurants, clubs and the Florida Aquarium. Some additional entertainment options and cultural amenities Downtown Tampa has to offer include museums and art galleries, and the following:
3-4
Section 3.0
Florida Aquarium Tampa Theater Centro Ybor
Falk Theater Artists Unlimited YMCA Tampa Watersports Center
In addition to the various entertainment activities Downtown Tampa has to offer, the natural amenities and recreational opportunities abound. The Hillsborough River is the greatest natural benefit Downtown Tampa provides for its residents and visitors and currently there are approximately 12,675 feet of riverwalk to enjoy and about 1.5 miles of waterfront trails/parks in downtown. In addition, the downtown area boasts several parks and open spaces and the following lists some of the major ones (shown previously on Figure 1.0).
3.2.5
PARKS •
Bayshore Boulevard Linear Park
•
Cotanchobee Park
•
Curtis Hixon Park
•
Henry B. Plant Park
•
Joe Chillura Courthouse Square
•
Lykes Gaslight Square
•
Perry Harvey Sr. Park
•
Riverfront Park
3-5
Section 3.0 3.2.6
EMPLOYMENT The number of downtown employees is estimated at 66,475 and the total square feet of office space is over 6 million. The percentage of the County’s workforce in downtown is 11 percent and the total government office space is about 2.4 million square feet. Table 3.0 lists the major office buildings in Downtown Tampa, along with their total square footage and parking ratio. The general location of these office buildings are depicted previously on Figure 1.0.
TABLE 3.0 OFFICE DEVELOPMENT IN DOWNTOWN TAMPA
Office Space 100 North Tampa Street 102 W. Whiting Street 220 Madison Avenue Rivergate Tower 501 E. Kennedy Boulevard Bank of America Plaza Franklin Exchange M&I Bank Plaza One Harbour Place Park Tower Fifth Third Center SunTrust Financial Centre Tampa City Center Times Building Wachovia Center World Trade Center Tampa Bay Hillsborough River Tower Two Harbour Place
Total Square Feet (estimate) 552,080 55,110 Unknown 512,851 295,107 766,136 211,244 61,260 199,120 472,462 281,072 702,000 735,030 178,000 110,000 12,500 1,055,895 180,000
Parking Ratio 1.0:1000 2.5:1000 Unknown 1.5:1000 1.3:1000 1.5:1000 2.0:1000 2.0:1000 3.5:1000 1.6:1000 1.0:1000 1.0:1000 1.0:1000 4.0:1000 1.3:1000 Free unlimited parking 4.0:1000 5.5:1000
Source: Tampa Downtown Partnership, 2006
3-6
Section 3.0
3.2.7
EDUCATIONAL INSTITUTIONS
The following educational institutions (see Table 3.1), which serve primarily as places of employment exist within the planning area for the Downtown Circulator Study. The universities can also be considered as places of residence, thus the multi-colored designation on Figure 3.0. TABLE 3.1 EDUCATIONAL INSTITUTIONS IN DOWNTOWN TAMPA
School/University University of Tampa University of South Florida Downtown Center Stetson University College of Law Blake High School Sam Rampello Downtown Partnership School Tampa Preparatory School
Enrollment 5,367 400 185 1,200 900 625
The following information was obtained during the course of several stakeholder meetings with representation from the University of Tampa (UT). The university has a full-time undergraduate enrollment of 4,297 (as of Fall 2006), with approximately 2,683 students living on campus and 122 living off-campus (in hotels). The total enrollment including commuters, evening college, and full-time undergraduates is approximately 5,367. The University has a privately contracted shuttle for students living in downtown hotels. Additionally, the total number of full and part-time staff at the University is 316, with 230 fulltime faculty and 217 part-time faculty/adjunct professors. Though some students use the Route 98 circulator service, most are not aware the circulator service is available for them. Many of the students (residents and commuters) drive to campus, though there appears to be a need for public transportation for some of the student population. Many of the students have part-time jobs at Channelside and the St. Pete Times Forum, in which an improved circulator service could be beneficial. The campus covers approximately 100 acres and has two parking garages, both of which are at 100 percent capacity. In addition to the parking garages, the campus has on-street parking and surface lots. There are a total of 3,323 spaces generally designated for faculty-staff, commuters and residents. Faculty lots are shared after 5:00 p.m. on Fridays and available for students on weekends and for special events.
3-7
Section 3.0 3.2.8
PARKING INVENTORY
Much of the parking in Downtown Tampa is utilized by downtown employees. Downtown Tampa has approximately 22,000 parking spaces, either paid monthly or hourly. Most of the spaces are provided in lots and garages, while about 2,000 are on-street spaces. The on-street spaces are often sought out by visitors and entertainment/event seekers, as well as residents to a lesser degree. Refer to Figure 3.1. 3.2.9
MONTHLY/HOURLY PARKING
Table 3.2 shows the parking lots and garages in Downtown Tampa, as well as the total number of spaces and whether or not it is serviced by a circulator trolley route; either Route 96 or Route 98. 3.2.10
ON-STREET PARKING
Downtown Tampa has more than 2,000 on-street, metered parking spaces. Those spaces north of Kennedy Boulevard are free on weekends and weeknights after 6:00 p.m.
3.3
RESIDENTIAL 3.3.1
EXISTING RESIDENTIAL DEVELOPMENT
Approximately 600 people are living in downtown today and this number is expected to increase substantially in the next five years. Table 3.3 lists the existing residential development and where information is available, the number of units for those developments, as well as the parking ratios. Figure 1.0 shows the general location of these developments, designated by a green dot.
3-8
4
Map Not To Scale PALM AVE
PALM AVE
VISITORS CENTER
9TH AVE OAK AVE
CENTRO
275
8TH AVE YBOR
7TH AVE
7TH AVE
HENDERSON AVE
DOYL
ASHLEY HLEY PLAZA ZA
AY RKW ITT PA ANS T TR E E TR
NS
IO MAR
R ENO GOV
LV D
BA Y
EB OR
OU
GH
BA YS H
OR
PLANT AVE
HI
LL
SB
BAY ST
TAMPA GENERAL HOSPITAL
RIV
ERW ALK
MERIDIAN ST
12TH ST
CHANNELSIDE CH CHANN CHANNELSID EELSID S DR
FLORIDA AQUARIUM
GA
AM D NDH AN WY UR ISL O TEL B R HA HO
CRUISE TERMINAL 2
D BLV IAL
22ND ST
21ST ST
20TH ST
19TH ST
Hotel A&E Venue, Educational Center Parking Structure Transportation Center
EFIC
NN CHA
Government Building
Park
L
NNE
CHA
BEN
E
OBE NCH COTA ARK P
IDE
ELS
TIMES FORUM
ON RRIS
D BLV ND ISLA
BAYSHORE BLVD. LINEAR PARK
RN TION THE A SOU NSPORT TRA ZA PLA PA TAMIOTT R MARERSIDE WAT
Day Time Circulator Event Circulator
SH
TAMPA CONVENTION CENTER
PLATT ST
Y ASS EMBITES SU
CRUI CRUISE TERMINAL TERM 3
CUMBERLAND AV CUMBE AVE V VE
ST. PETE
TH SOUIONAL REGARAGE G
Residential Development Existing Complete by 2008 Complete by 2012 Office/Employment Center
BALL ST BA B
OUR ARB
TAMPA BAY HISTORY CENTER
CAESAR ST
MO
CUMBERLAND CUM AVE
EEUNICE ST
T POS IIC CE OFF
BROREIN ST
PO PORT P O ORT AUTHORITY UTHOR HO H ORITY R PARKING PARK A KING ARK K GARAGE GARA AR A RAGE A
WALTON ST
EL OY S
BRO
CLEVELAND ST
11TH ST
T SH S BRU
T ST EAS
NE XP RE SS WA Y
FINLEY ST
S REIN
TAMPA TRIBUNE
AZEELE ST
18TH ST
KW AY PA R O CC I
ST
T ST
ST ON ERS
JEFF
P
WHITING ST
T
ECONOMY INN
WASHINGTON ST
G ST
ITIN WH
KE OO T BR FORRAGE T A G GS ITIN WH RAGE GA CA L ST YM BEL
CRUISE TAMPA TERMINAL 6 PORT AUTHORITY HEADQUARTERS
LE
FALK THEATER
WN NTOOL DOW CHO LLOSHIP IP S E P R RAM N ST TNE GTO PAR HIN WAS
ER
TT HYA NCY E REG PA TAM
ARTISTS UNLIMITED
OOL SCH RD BOA
NT Y COU AGE GAR N ST KSO JAC
N ST RGA MO
RADISSON RIVERWALK
GRAND CENTRAL AVE
HYDE PARK AVE
EAS
E A AV RID FLO
T
NKL
IN S
D
BLV
KE
N BOULEVARD
FRA
ST PA TAM
DR LEY ASH
R
HENRY B. PLANT PARK DY NNE
N ST ISO JOE A MAD HILLUR USE C RTHORE A COUSQU LVD E OLIC RS DY B NNE NTY PA PUARTE M E M K A U T ADQ SEU CO TER HE ND MU ES CEN LYK IGHT A L GAS UARE L L A H SQ Y IT C ZA PLA
E ST IERC
VE
KENNEDY BLVD
ST
RI
TAMPA T PA A MUSEUM M OF O F ART
Text Te
Text
K
GH
MADISON ST
Ttext Te Text Text Te Text
R YO
OU
ST
OR
TWIGGS ST
ST
SB
OR
S ST UND CAS YHO RS GRE ATION HTE FIG M ST S FIREUSEU N T BO AL S M B MB IB K G DER E ECO E POL LAKE DIIN NG FE HOUS EDG THOUS IL R R RT MBERAL BU IM U U T O O S ST C E C IGG E FED T W ARAG K ST E G ZAC S U A O P SE RTH TAM ER HOU COU EUSE AT NTY SE COURT X T NTY E R THE COUTHOU GS S COUDAPTIV NNE IG A R W A T COU
AY
LL
RB
T POSICE OFF
WILLIAM POE E GARAGE IS RT RK CU N PA O X I H
UNION STATION/ AMTRAK
CK
UNIVERSITY OF TAMPA
ARY
T
ER S
TYL
M
LK
CASS ST
HI
LEE ROY SELMON EXPRESSWAY
Existing Parking Areas
HA
RWA
LIBR
N ST RISO HAR
INN NCE TT IDE RES ARRIO BY M ARD RTY OTT COU ARRIO Y B M
TAMPA BAY PERFORMING G ARTS CENTER
RIVE
TAMPA PREPARATORY SCHOOL
ADAMO DR
CENTRAL PARK VILLAGE (Proposed Boundaries)
ROYAL ST
N MA HERASSEY M ARK P
2ND AVE
NU
FORTUNE ST
TAMPA WATERSPORTS CENTER
PERRY HARVEY SR. PARK
NEBRASKA AVE
MARION TRANSIT CENTER
ORANGE ST
RIVERFRONT PARK
N BOULEVARD
PARK K TRAMMELL TRAM TRA MM M MELL BUILDING BUI LLDING I
ST
JEFFERSON ST
REL
LAU
LAURELL STT
3RD AVE
SCOTT ST INDIA ST
LAUREL ST
17TH ST
KAY ST
4TH AVE
YBOR CHANNEL
LTON AV
E
KAY ST
E CAR
BLAKE HIGH SCHOOL GREEN ST
GOVERNOR ST
3RD AVE
Figure 3.1
5TH AVE
16TH ST
STETSON UNIVERSITY COLLEGE OF LAW
ESTELLE ST ESTELLE ST
15TH ST
ESTELLE ST
AVENIDA REPUBLICA DE CUBA
PIERCE ST
6TH AVE
TECO Streetcar Parking Areas
June 2007
Section 3.0 TABLE 3.2 TAMPA’S DOWNTOWN PARKING INVENTORY
Name/Location Knights Point One Harbour Place Two Harbour Place Post Harbour Apartments Embassy Suites Garage Channelside Lot VIP West Lot South Regional Port Authority/Channelside Florida Aquarium Parking Tampa Convention Center Crosstown Lot L-1 (Franklin St.) Crosstown Lot L-2 (Convention Ctr.) Brorein St. Lot (Jefferson) Kappus Lot (Jefferson and Eunice) Cumberland Lots (NE of St. Pete Forum) Crosstown Lot L-3 (Morgan and Brorein) 801 Cumberland (Brorein and Jefferson) Crosstown Lot L-4 (Under Crosstown) Crosstown Lot L-4A (Jefferson) Whiting Parking Lot (Nebraska) Crosstown Lot L-4B (Whiting St.) Crosstown Lot L-4C (Washington) Crosstown Lot L-4D (Jackson) Crosstown Lot L-4E (Kennedy) Crosstown Lot L-4F (Nebraska) Crosstown Lot L-4G (Union Station) Wachovia Garage Capitano Lot HART Lot (Florida and Bell) 130 S. Florida Lot South Side of Bell Street (130 N. Florida) Morgan and Bell - SW corner (130 N. Florida) Booker Lot (Morgan) Florida and Bell - NW corner (130 N. Florida) Whiting St. Morgan and Bell - NW corner (130 N. Florida) 601 Whiting St. Boker Lot Crosstown Lot (Jefferson and Whiting)
Type of Lot Garage Garage Garage Garage Paved Paved unpaved Garage Garage Paved Garage Metered Paved paved Unpaved Unpaved Paved Paved Paved Paved Unpaved Paved Paved Paved Paved Paved Paved Garage paved Paved paved Paved Unpaved Unpaved Unpaved Garage Unpaved Paved Unpaved Unpaved
Total Spaces 296 538 1,150 180 240 120 450 1,039 2,000 600 465 171 200 200 200 545 43 100 31 96 100 105 69 49 103 34 88 509 94 140 125 80 37 250 100 503 250 54 101 50
Along Trolley Route Route 96 Route 96 Route 96 Route 96 Route 96/98 Route 96/98 Route 96/98
Route 96/98 Route 96/98 Route 96/98
Route 96 Route 96 Route 96 Route 96 Route 96 Route 96 Route 96 Route 96 Route 96
3-10
Section 3.0 TABLE 3.2 (CONTINUED) TAMPA’S DOWNTOWN PARKING INVENTORY
Name/Location 100 North Tampa Hyatt Lot Ft. Brooke Ferman Private Lot Morgan Street (601) Lot East Whiting Lot Jefferson and Washington Lot East St. Lot Sheraton Riverwalk Hotel Bank of America Plaza SunTrust Financial Centre Marion Lot (at Washington) Morgan St. Lot (Wash. and Jackson) 707 E. Jackson St. Lot Fifth Third Center City Hall Lot 501 E. Kennedy Garage County Center Garage Pierce St. County Center Garage Courthouse Lot Merchant's Lot Jefferson Street Lot (Kennedy) Park Tower (Kennedy and Tampa) Marion and Kennedy Lot Cochran Lot (Kennedy and East St) 400 North Ashley Garage Florida and Twiggs St. Lot Madison Bldg.Garage at Florida Ave. St. Andrews Church Lot (Twiggs) Twiggs St. Garage (East St. and Nebraska) Curtis-Hixon Garage (Ashley and Zack) M&I Bank Plaza (Ashley and Zack) Franklin Exchange Building B&B Lot #2 (Zack-Pierce and Morgan) B&B Lot #1 (Zack-Jefferson and Pierce) Twiggs Street Garage Zack St. Lot (Nebraska) 445 Falk Lot at Twiggs St. Zack St. Lot (Twiggs and Nebraska)
Type of Lot Garage Paved Garage Garage Paved paved Paved paved Garage Garage Garage paved Unpaved Paved Garage paved Garage Garage Garage Paved Paved Paved Garage Paved Paved Garage Paved Garage paved Garage Garage Paved Garage Paved Paved Garage Unpaved Paved Unpaved
Total Spaces 600 61 2,523 168 200 19 43 16 66 1,263 540 28 35 77 244 133 403 454 580 64 25 31 407 82 200 746 63 347 40 890 169 95 427 59 80 417 150 116 200
Along Trolley Route Route 96 Route 96 Route 96 Route 96
Route 96/98 Route 96/98 Route 96 Route 96
Route 96 Route 96 Route 96
Route 96/98 Route 96 Route 96/98 Route 96 Route 96 Route 96 Route 96/98 Route 96/98 Route 96
3-11
Section 3.0 TABLE 3.2 (CONTINUED) TAMPA’S DOWNTOWN PARKING INVENTORY
Name/Location Colonial Bank Lot on Zack St. Zack Street Lot (Jefferson) William F. Poe Garage 111 E. Cass St. Lot Pierce and Polk St. Lot Cass and Jefferson Lot Courtyard by Marriott Cass Lot Cass St. Lot (at Marion) Morgan and Cass Corner Lot (Morgan-Tyler and Cass) Polston Lot (Jefferson and Cass) East Cass Lot (Cass at Nebraska) Tyler and Marion The Times Bldg. - Phase I Lot Courtyard Lot Sisters Lot (Harrison and Franklin) Morgan and Harrison (SW) Lot School Board garage Pierce St. Lot (at Harrison) Tampa St. Parking Lot 440 Franklin Lot (Franklin and Harrison) St. Paul AME Parking Badcock Lot (Fortune and Franklin) MTC lot The Times - Phase III Lot Royal Regional Lot Franklin and Fortune - SW corner UT Centro Ybor Fernando Noriega Jr./Palm Ave Garage Washington Street Lot Goody/Goody Lot Newks Lot (Channelside and Nebraska) Morgan and Harrison (SW) Lot
Type of Lot paved Unpaved Garage Paved Paved paved paved Paved Paved Paved paved paved Unpaved Paved Paved Paved Unpaved Garage Paved Paved Unpaved Paved Unpaved Paved Paved Paved Unpaved Paved Garage Garage Paved Paved Unpaved Unpaved
Total Spaces 55 40 932 150 135 480 Valet 40 57 100 195 75 140 47 202 Valet 30 46 56 60 30
Along Trolley Route Route 96 Route 96/98 Route 96/98
Route 96/98 Route 96 Route 96 Route 96 Route 96
Route 96 Route 96/98 Route 96/98 Route 96 Route 96 Route 96
Route 96 50 200 430 295 30 1,200 1,240 175 150 95 126
Route 96 Route 96/98 Route 96/98 Route 96
Route 96
Route 96
Source: Tampa Downtown Partnership, January 2007
3-12
Section 3.0 TABLE 3.3 EXISTING DOWNTOWN TAMPA RESIDENTIAL DEVELOPMENT
Development Art Center Lofts Baptist Manor Channelside 212 Lofts Fourteen Townhomes Grand View Condos Las Ybor City Homes Meridian
District Cultural Arts District Downtown Channel District Ybor City Harbour Island Ybor City Channel District
Methodist Place
N. Franklin Street
One Laurel Place ParkCrest Harbour Island Parkside at One Bayshore Post Harbour Island Apartments
Cultural Arts District Harbour Island West Bank District
Spain Lofts Three Townhomes Two Casitas Victory Lofts Ybor City Lofts
Number of Units 42 240 (Elderly) 28 14 Unknown 12 37 Unknown (Elderly) 97 336 104
Harbour Island Central Business District Ybor City Ybor City Channel District Ybor City
Parking Ratio 1.0/bedroom Unknown 1.0/unit Unknown Unknown Unknown 1.5/unit Unknown Unknown 1.87/unit 1.5/unit
206
Unknown
6
TBD
3 2 89 5
Unknown Unknown Unknown Unknown
Source: Tampa Downtown Partnership and City of Tampa, 2006
3.3.2
PROJECTED RESIDENTIAL DEVELOPMENT ACTIVITY
As previously mentioned, the number of residents in downtown is expected to substantially increase in the next five years. As a major part of this study, the potential market for expanded circulator services in the core of downtown, areas where circulator service already exists and in adjacent neighborhoods, including the Channel District, Ybor City, and the area west of the Hillsborough River will be assessed for service in place in 2008. The need for additional service to meet the transportation needs of projected residential and commercial development activity with a focus on the effect of service demand created by The Heights, the Central Park Village redevelopment, and growth in the Central Business District, Ybor City, the Channel District, and areas immediately west of the Hillsborough River will also be assessed for 2012 service improvements. The following tables, Tables 3.4 and 3.5, show the residential development expected to be complete by 2008 and by 2012, respectively. Previously, Figure 1.0 showed the general location of these developments, designated by a yellow dot for 2008 and a red dot for 2012.
3-13
Section 3.0 TABLE 3.4 RESIDENTIAL DEVELOPMENT EXPECTED TO BE COMPLETE BY 2008
Development Seaport Channelside Towers at Channelside Ventana Blu Channelside Crescent Heights 1000 Channelside Grand Central at Kennedy Place at Channelside, Phase I Place at Channelside, Phase II Seasons Residence Boulevard Plaza at Harbour Island SkyPoint Franklin Street Lofts Kress Square Project Arlington Carriage House Residences of Franklin Street Ybor Village Lofts Residential Lofts
District Channel District Channel District Channel District Channel District Channel District Channel District Channel District Channel District
Number of Units 422 257 84 250 820 15 392 245
Parking Ratio 1.7/bedroom 2.0/unit 2.0/unit 2.0/unit 1.0/bedroom 1.0/unit 1.0/unit 2.0/unit
Channel District
225
2.0/unit
410
1.5/unit
346 138 380 4 401 21 12
1.0/bedroom 1.0-2.0/unit 1.0/bedroom 2.0/unit 1.0/unit 1.0/unit TBD
N. Franklin Street
40
1.0/bedroom
Ybor City Ybor City
8 49
TBD TBD
Downtown Non-Core Downtown West Harbour Island N. Franklin Street N. Franklin Street N. Franklin Street N. Franklin Street N. Franklin Street
3-14
Section 3.0 TABLE 3.5 RESIDENTIAL DEVELOPMENT EXPECTED TO BE COMPLETE BY 2012
Development Trump Tower Tampa Venu
District Central Business District Central Business District
Number of Units
Parking Ratio
190
2.0/unit
215
TBD
Channel District
274
1.0/bedroom
Channel District Channel District Channel District Channel District
30 321 425 212
1.0/bedroom 1.0/unit TBD 2.0/unit
Channel District
725
1.3/unit
280 400 395 474 134 182 250 ~2000 (apt/condo)
1.0/unit 1.0/bedroom 1.0/bedroom 1.0/bedroom TBD 1.5/unit 1.0/bedroom
N. Franklin Street
393
1.0/unit
Downtown Core Tampa Heights
472 TBD
TBD TBD
Kennedy Residences of Channelside Lafayette Lofts The Martin at Meridian Navio The Plaza at Channelside Seaboard Square, Phase I and II Slade at Channelside Ashley Tower Element Tower Six Ten Franklin C The Royal Tampa City Lofts
Channel District Cultural Arts District Cultural Arts District Cultural Arts District Downtown Core N. Franklin Street N. Franklin Street
Central Park Village
Central Park Village
Denholtz Residential Towers Tampa Condo II The Heights
Unknown
3-15
Section 4.0 PEER CITY REVIEW 4.1
METHODOLOGY
A discussion was held at the first project team meeting regarding the identification of three transit systems that provide successful circulator service to a downtown area that is similar in size to Downtown Tampa. Suggestions were made by all of the project team members and included the following cities:
Chattanooga Ann Arbor Boulder Orlando
San Antonio Portland Coral Gables Norfolk
The MPO and HART made the final decision in identifying the three transit systems that provide successful circulator service to a downtown area that is similar in size to Downtown Tampa. The peer reviews seek to address the following main components: •
Description of Service − Hours of Service − Route − Passenger Fares/Transfer Policies
•
Ridership
•
Funding
•
Supporting Policies and Strategies
•
Additional Supporting Information
The three cities selected for peer review are Chattanooga, Norfolk, and Orlando. The reasons for selecting each of these cities will be made apparent in the individual descriptions below.
4-1
Section 4.0
4.2
CHATTANOOGA’S DOWNTOWN ELECTRIC SHUTTLE
Description The Downtown Electric Shuttle, operated by the Chattanooga Area Regional Transportation Authority (CARTA) was an initiative to help revitalize downtown Chattanooga. Initially, the shuttle was proposed to connect the Tennessee Aquarium, built in 1989, to major landmarks within the downtown. The Mayor pushed for the shuttle service and stipulated that diesel buses should not be used, which led to the creation of the electric buses. The electric buses are wheelchair accessible and environmentally friendly. The shuttle service began in 1992 with federal funding from the Federal Transit Administration. Details of initial funding can be found in the “Funding” section below. The Electric Shuttle is a free ride and provides no transfers. Since its inception, the electric shuttle allows for easy access to hotels, shopping, employment centers, and entertainment/recreational venues. Hours of Service Monday – Friday: 6:30 a.m. to 7:30 p.m. Saturday and Sunday: 9:00 a.m. to 7:30 p.m. * The Downtown Shuttle runs daily except New Year's Day, Thanksgiving Day, and Christmas Day. The Shuttle runs on a holiday schedule on Martin Luther King, Jr. Day, Memorial Day, Independence Day, and Labor Day. Route The Electric Shuttle runs along a north-south route, mainly along Market and Broad Streets, from the Shuttle Park South parking garage to the Shuttle Park North parking garage (shown on route map, following description of service). The route intercepts the three major highway arterials that enter downtown. The shuttle runs daily, about every five minutes from the Chattanooga Choo Choo to the Tennessee Aquarium, with stops at every block in between. 4.2.1
RIDERSHIP
The Electric Shuttle averages one million riders per year and is comprised mostly of commuters and visitors. Since service began in 1992, an estimated 11.3 million passengers have used the Downtown Electric Shuttle. Annual ridership started at approximately 400,000 and steadily increased to the current average of one million annual riders. Table 4.0 shows a sample monthly and daily ridership for the Downtown Electric Shuttle.
4-2
Section 4.0 TABLE 4.0 DOWNTOWN ELECTRIC SHUTTLE MONTHLY AND DAILY RIDERSHIP, 2006
Monthly Weekday Saturday Sunday Daily Weekday Saturday Sunday
59,077 10,633 5,614 2,685 2,658 1,403
Source: CARTA, 2006
4.2.2
FUNDING
CARTA received a $16 million grant from the Federal Transit Administration to construct three parking garages and purchase 12 buses to initiate the shuttle service. In 1994, the first garage (South Garage) was completed with 550 parking spaces, retail area on the ground floor and a vehicle recharging station. In 1996, the North Garage opened with 650 parking spaces and retail on the ground floor. The third garage was not built due to funding constraints. CARTA receives $50,000 in rent per year, from the Bijou Cinema in the North Garage, as well as a percentage of the concession sales. In addition, CARTA receives revenue from Ruginas and Holiday Inn through leases at the South Garage. The majority of the funding for operating the Electric Shuttle is derived from parking revenues (about 2/3 of the operating costs). The remainder is funded through CARTA’s General Operating Fund and the annual operating cost is $900,000 per year. 4.2.3
SUPPORTING POLICIES AND STRATEGIES
Parking and revitalization strategies provide much of the policy support for the operation of the Electric Shuttle system. The construction of the two parking garages not only provided parking spaces, it allowed for greater connectivity between the north and south ends of downtown and funding sources for operating costs. The Electric Shuttle has proven successful over the years in the revitalization of downtown. CARTA is planning to build a new parking garage on the north shore of the Tennessee River, which would allow commuters and visitors to park even further out and use the Electric Shuttle for traveling through downtown. CARTA expects that their current fleet of 12 buses will be sufficient to accommodate the trips to and from the new parking garage. Since the Central Garage was not constructed, CARTA uses only six to eight of the original 12 buses, at peak times.
4-3
Section 4.0
4.3
NORFOLK ELECTRIC TRANSIT
Description Norfolk’s Route 17 Norfolk Electric Transit (NET) Downtown Norfolk Shuttle, established in 1999, is operated by Hampton Roads Transit (HRT) and is directed by the City of Norfolk. An electric shuttle service was developed to link parking facilities with employment, retail, and activity centers throughout Norfolk. The NET service also helped to revitalize Norfolk and plays a major role in the City’s convention business. In addition to reduced automobile traffic downtown, a future use of the shuttle may be to supplant fixed-route buses circulating downtown to get them off the street, as well. Each of the 15 Hybrid-type electric buses is air-conditioned and holds up to 22 passengers. The service is free and provides a connection between parking facilities and downtown attractions. Hours of Service Monday – Friday: 6:30 a.m. to 11:00 p.m. Saturday: Noon to Midnight Sunday: Noon to 8:00 p.m. Route The shuttle route is approximately 2.2 miles and runs on two separate routes for weekdays and weekends (route maps following description of service). NET buses run every six to 18 minutes, with additional buses running at peak hours. Each stop attracts riders from various parking locations, employment buildings, and/or recreational facilities. 4.3.1
RIDERSHIP
The 2006 monthly average ridership is approximately 30,000. The ridership is typically the downtown employee who parks in one of the three major satellite parking lots (Cedar Grove, Harbour Park, and Harrison Opera House). Thus, the weekday passengers are predominantly commuters, while the weekend riders are mostly tourists. There are very few residential users. The results of a survey conducted by the City of Norfolk and HRT, portrayed the following travel characteristics associated with the NET: •
Seventy-four percent of riders use the NET to travel to work
•
Major work-related users include: − Bank of America
4-4
Section 4.0 − United States Coast Guard − City and School Board Employees •
Sixty-four percent ride the NET from Cedar Grove or Harbour Park
•
Thirteen percent of riders use the NET to go to Tidewater Community College
•
Seven and half percent of riders are tourists or shoppers
Table 4.1 provides a breakdown of daily ridership. TABLE 4.1 NORFOLK ELECTRIC TRANSIT SYSTEM DAILY RIDERSHIP, 2006
Day of the Week Monday – Friday Saturday Sunday
Passengers Per Day 1,500 250 175
Passengers Per Hour 23 10.4 10.9
Source: HRT, 2006
4.3.2
FUNDING
Through the use of Federal and state grants, eight buses were purchased, bringing the total capital cost to $2,607,840. The annual operating and maintenance costs for the NET shuttle are approximately $1 million. The City of Norfolk’s Parking Enterprise Fund provides 50 percent of the support for the NET. The remaining 50 percent of funding comes from Federal and state sources. It varies yearly, but it is approximately 30 percent Federal and 20 percent state. 4.3.3
SUPPORTING POLICIES AND STRATEGIES
The NET system is an important economic development tool in that it strengthens the City’s tourist and convention industries, by providing a connection between convention centers, hotels, retail, and other attractions. Some of the biggest regional facilities include the SCOPE Coliseum, Chrysler Hall, Harbour Park AAA Baseball Stadium, Harrison Opera House, and the Norfolk Waterside Conference Center. Additionally, the NET service provides connection to the Main Street Financial District (two million square feet of office), Waterside Festival Marketplace and the MacArthur Center complex. Additionally, the service is supported by the Tidewater Community College and the increasing annual enrollment of students who use the NET.
4-5
Section 4.0
4.4
ORLANDO LYMMO
Description LYMMO was created by LYNX and the City of Orlando’s Downtown Development Board and Community Redevelopment Agency and commenced service in August 1997. One of the major purposes of LYMMO is to connect remote parking lots at the outskirts of downtown with major employers located in the downtown core. This allows downtown travelers to park once and make the rest of their trips on the bus circulator. LYMMO got its start in 1997, after previous attempts at providing downtown circulation were made through the Meter Eater and FreeBee services. Major factors in the success of the LYMMO service are its frequency, ease of use, and attractiveness. Fares are free with no transfers. Other distinguishable features include: •
Dedicated lane with signal priority;
•
Extensive signage and pavement markings;
•
Specialized paving and hardscape;
•
Landscaping features;
•
Unique paint scheme, shelters and separate logo for signs at stops;
•
Ten low-floor, compressed natural gas vehicles with special ramp for disabled/wheel chaired passengers; and
•
Transponders to track bus location and pinpoint timing for next arrival at bus stop.
Hours of Service Monday- Friday: 6:30 a.m. - 11:00 p.m. Saturday: Noon - Midnight Sunday: Noon - 8:00 p.m. Route The 3-mile loop service around Downtown Orlando (route map following text description) has 13 stations (with shelters and other amenities) and eight stops to and from major destinations such as the Orlando Centroplex and City Hall. The service is currently operating at a 4-minute peak frequency (including midday lunch period) during the weekdays, 10-minute off-peak frequency after-hours and on weekends, and 15-minute frequency on Sundays after 6:00 p.m. and on holidays.
4-6
Section 4.0 4.4.1
RIDERSHIP
The LYMMO service averages 4,154 riders per day during the weekdays, 1,276 riders per day on Saturdays, and 785 riders per day on Sundays (2006). For FY 2006, the ridership for the year was approximately 1.2 million. The numbers show that the majority of riders are using the service during the weekdays, which perhaps indicates a greater usage by downtown residents and employees. Table 4.2 illustrates the total year ridership for the LYMMO service from August 1997 to September 2006. LYMMO has consistently carried over one million passengers per year since its first full year of operation in 1998. TABLE 4.2 LYMMO YEARLY RIDERSHIP
Fiscal Year FY 1997 FY 1998 FY 1999 FY 2000 FY 2001 FY 2002 FY 2003 FY 2004 FY 2005 FY 2006
Total Ridership 122,534 1,097,821 1,145,740 1,137,950 1,072,923 1,042,417 1,121,799 1,035,617 1,185,880 1,195,655
Source: LYNX, 2006
The Downtown Orlando Traveler Survey, conducted in 2005 for LYNX, utilized phone interviews to assess the travel characteristics of a sample population consisting of downtown residents, commuters, and visitors. For downtown residents, the LYMMO service is used mostly for shopping trips (5.4 percent), work-related business trips (3.7 percent), or recreation/entertainment (1.9 percent), but is not a vastly used mode of travel for this group. The LYMMO service was not identified separately from the LYNX system as a whole, as a mode of travel for commuters and visitors. However, data pertaining to the travel behavior and characteristics associated with commuters and visitors is provided in Section 4.4.4. This information provides some insight into trip purposes and modes of travel, including transit. A major component of the survey was to assess the respondents’ awareness, usage, and propensity for usage of the downtown circulator or LYMMO service. Overall, two-thirds of respondents are aware of the LYMMO service, the majority of which are downtown residents (80.3 percent are aware).
4-7
Section 4.0 In trying to determine the interest in using an expanded LYMMO service, most of the respondents indicated that they would never or rarely use the expanded service. As expected, downtown residents expressed a greater interest in using the expanded service compared to commuters or visitors. Residents are most likely to use the service during morning (6:00 a.m. 10:00 a.m.) or midday hours (10:00 a.m. – 3:00 p.m.), while commuters and visitors are more likely to use the service only during midday hours. All three groups expressed little interest in using the service during afternoon hours (3:00 p.m. – 7:00 p.m.). Regarding reasonable fares for the expanded service, downtown residents (market most interested in the service) gave an average of $0.69, while visitors (market least interested in the service) were willing to pay on average $1.00. The final question in the survey asked whether or not the expanded LYMMO service would make respondents more or less interested in living in Downtown Orlando. Current residents comprised the greatest percentage (41.8 percent) of respondents who would be more interested in remaining in downtown, as a result of the expanded service. This may be important for retention of current residents. However, in attracting new residents to the downtown, expansion of the LYMMO service is not likely to be a huge factor, considering only 28.6 percent of commuters and 35.8 percent of visitors said they would be more interested in living downtown. 4.4.2
FUNDING
At a project cost of $21 million, the installation of LYMMO was funded by Federal (50 percent), state (25 percent), and local (25 percent) monies. Annual operating expenses amount to approximately $1.2 million, funded largely by the City’s downtown parking revenues, General Fund, and the Community Redevelopment Area (CRA)-Downtown District. During 2003-2004, the LYMMO system received $724,043 from the CRA and $50,000 from Centroplex. The City, in conjunction with the Federal Transit Administration constructed two parking garages to serve the Centroplex facility activities, as well as the rest of Downtown Orlando through its connection to the LYMMO system. In addition to connecting these parking garages to the southern half of the downtown area, the revenues from the operation of the parking facilities are used to offset costs of operating LYMMO. In 2004, the parking revenue contribution amounted to $403,206. 4.4.3
SUPPORTING POLICIES AND STRATEGIES
Eighty percent of all public parking facilities in Downtown Orlando are located within one block of the LYMMO system. The Downtown Orlando Traveler Survey indicated a majority of travelers were able to park for free. In fact, of those surveyed, 63 percent of visitors and 64 percent of residents parked for free. Interestingly, of those who did pay for parking, visitors paid higher parking fees on average than did residents ($4.45 compared to $2.25). Though some of the funding for the LYMMO system stems from parking revenues, the majority comes from the CRA.
4-8
Section 4.0 Two major parking facilities, located within the City’s Centroplex area, provide evening and weekend support to the arena (17,000 seats), performing arts center (75,000 square feet), and exhibit hall facility. The LYMMO system provides connection to and from the Centroplex, including the parking facilities. More specifically, the system connects 5,486 structured spaces in the southern half of Downtown Orlando to Centroplex and 1,116 city parking spaces to connect to more than 5 million square feet of office space. In addition to parking strategies in support of the downtown circulator, the City of Orlando’s land development regulations indicate an overall support of a transportation system in which all modes are accommodated. This includes support of transit, as well as development and hardscape that is sensitive to transit needs. Additionally, Section 68.403 states that transit should create sustainable vehicles and comfortable passenger facilities, as well as designing roadways to accommodate transit. Section 61.404 refers to the Downtown Parking Program, consisting of two main components: (1) “the provision of on-site parking spaces in City-owned Parking Facilities for land uses located in the Downtown Parking Area; and (2) The Downtown Public Transit System” (Orlando Land Development Regulations). A primary goal of the program is to connect peripheral parking facilities to downtown uses with a transit system (i.e. LYMMO). 4.4.4
ADDITIONAL SUPPORTING INFORMATION
As previously mentioned the Downtown Orlando Traveler Survey aimed to assess the travel behavior of downtown travelers and categorized these groups as residents, commuters, and visitors. The survey respondents are predominantly downtown residents (44.6 percent), whose primary purposes for traveling downtown are for recreation/entertainment (26.5 percent), personal business (24.1 percent), or work/work-related business (23.6 percent). The average travel time for residents is greatest for downtown shopping at 27 minutes. However, work related business and recreational activities only comprise about nine minutes travel time. Downtown residents’ most popular mode of travel (except for school or university trips) is driving alone. Interestingly, of the transit users, 51 percent are transit-dependent (no personal vehicle), which indicates that the majority of transit users are not choosing to use the services. The two other types of survey respondents, commuters, and visitors comprise 16.2 percent and 39.2 percent, respectively. A majority of commuters (62 percent) drive alone or carpool and arrive between the hours of 7:00 a.m. and 8:30 a.m. The average travel time is 33.4 minutes and only 7.3 percent of commuters used LYNX. Of the visitor population, most go to Downtown Orlando for personal business (46.9 percent) or recreation/entertainment (34.2 percent). The average travel time for visitors is greatest for work-related business trips (accounting for only 9.5 percent of total trips) at 33 minutes; the rest of the trips average anywhere from 16 to 31 minutes (times shown in Table 4.3).
4-9
Section 4.0 TABLE 4.3 AVERAGE TRAVEL TIME BY PURPOSE FOR VISITORS
Purpose of Trip Work or Work-Related Business Personal Business Shopping Recreation or Entertainment School/University
Travel Time (minutes) 33.03 31.55 29.55 27.76 16.5
Source: Downtown Orlando Traveler Survey, 2006
Similar to downtown residents, visitors’ primary mode of choice for all trip purposes is driving alone, followed by carpooling. LYNX trips only accounted for 3.9 percent of the trips made for personal business and 0.8 percent of recreational trips. The LYMMO service was not identified as a trip mode for visitors. Of the transit users, 87 percent used transit due to lack of a personal vehicle, which indicates a need for the service, rather than a preference.
4.5
STRATEGIES FOR TAMPA CIRCULATOR
The three circulator systems, Chattanooga, Norfolk, and Orlando showcase key elements and strategies that can be applied to Tampa’s Downtown Circulator system. Some of the common themes running throughout each of these peer reviews include: •
Free fares / free fare zones.
•
As shown in all three cities, free fares encourage use of the transit system.
•
Ridership of the Tampa Downtown Circulator dropped by 20 percent when fares were implemented in 2004. It seems reasonable to expect a similar increase in ridership once fares are again eliminated.
•
Simplified routing.
•
Extensive routes that visit all parts of downtown require riders to travel longer periods to cover short distances relative to the origin of their trip. Simple east-west and north-south routes will allow riders a shorter bus trip to move a longer relative distance.
•
Survey results identified a walking tolerance of three to four blocks for circulator users (Appendix A).
•
Simplified routes allow for greater operational efficiencies.
•
Frequent headways.
4-10
Section 4.0 •
A high percentage of circulator users will be those individuals utilizing the service during the workday. Scheduling should match demand during peak periods.
•
Four- to six-minute headways should be achieved during peak times.
•
Reduced developer-required parking.
•
Business could support the number of spaces required in the Land Development Regulation by purchasing or leasing space in the larger centralized commuter lots, or by contributing to a parking bank fund.
•
Peripheral parking.
•
The provision of peripheral parking is the key to the implementation of a free fare zone. Revenues from the parking lots will subsidize the loss of revenue from the bus fares.
•
A number of secondary benefits will be created by the capture of vehicles at the periphery of the downtown district. These benefits include greater pedestrian mobility, reduced bus headways, and reduced levels of pollution.
•
Facilities and signage.
•
The Orlando LYMMO is a prominent part of the downtown streetscape. Much of the success of the bus system is created by the infrastructure and signage supporting the routes.
•
Providing a high level of visibility announcing the presence of the circulator is critical in capturing riders, particularly tourist ridership.
•
Highly visible and identifiable transit stops are also critical to encouraging ridership.
•
Connection between parking and major attractions/employment centers.
•
The creation of a park once destination, connecting commuter lots to the major attractions and employment centers downtown should be the primary focus of the circulator.
•
Providing visitors free movement around downtown will encourage patronage to downtown. Parking revenues will be critical in supporting the new free fare routes.
•
Most of the vehicles in the case study are energy efficient (e.g. hybrid electric, compressed natural gas (CNG)).
More specifically, the following peer city achievements are provided as suggestions for improving Tampa’s Downtown Circulator System:
4-11
Section 4.0
4.5.1
4.5.2
4.5.3
CHATTANOOGA •
Utilize fringe parking, such as garages at north and south end of downtown.
•
Redirect parking revenues to help fund shuttle.
NORFOLK •
Secure a connection between convention center, retail, hotels, and other attractions.
•
Garner support from student population and encourage student use of shuttle.
ORLANDO •
Ensure that public parking is located within a comfortable walking distance of shuttle stops.
•
Modify Land Development Regulations to support transit and peripheral parking .
4-12
Section 5.0 MARKET ANALYSIS 5.1
INTRODUCTION
The purpose of the Tampa Downtown Circulator Study is to explore strategies to enhance the current downtown/in-town circulators. This section provides statistics for downtown venues and the UT, as well as an assessment of travel markets in downtown. It merits some mention that these analyses, as scoped, were to examine the following travel markets: •
Persons who live and work downtown,
•
Persons who live downtown and want to use transit to get around,
•
Persons who work downtown and seek daytime services,
•
Persons who work downtown and utilize satellite parking,
•
Persons who come to events downtown,
•
Persons who ride transit into downtown,
•
Persons with evening work shifts,
•
Convention participants,
•
Students, and
•
Event participants and tourists.
However, most of the bulleted items above involve unique travel markets. To fully assess the travel characteristics of these markets as they pertain to public transportation (e.g. income, trip origins, destinations, trip lengths, volumes, modal choices, parking, costs, etc.), survey data is essential. Recent survey data is either non-existent or unavailable. As such, this section provides an overview of the analysis, based on travel patterns from the Hillsborough Metropolitan Planning Organization’s (MPO’s) travel demand model (the entire Market Analysis Technical Memorandum is located in Appendix B). Sub-sections present the model-based analyses by the model’s trip purposes including: •
Home-Based Work (HBW)
•
Home-Based Shopping (HBSHOP)
5-1
Section 5.0
5.2
•
Home-Based Social and Recreational (HBS&R)
•
Home-Based Miscellaneous (HBMSC)
•
Non-Home-Based (NHB)
VENUE ATTENDANCE AND UT ENROLLMENT STATISTICS
Figure 5.0 shows the location of eight special venues in and around Downtown Tampa, including the UT. The attendance statistics for these seven of these venues were obtained from the Tampa Chamber of Commerce website, while UT statistics were obtained from the UT website. By far, the greatest annual attendance is generated by Ybor City, which attracts some three million visitors. The St. Pete Times Forum attracts about 1.5 million persons annually from in and around the Tampa Bay region. As of fall of 2006 the UT had an enrollment of 4,297 full time students, of which 2,683 where on-campus residents and 122 where housed in an off-campus hotel. Additionally, UT employs 230 full-time faculty, 316 full- and part-time staff, and 217 part-time faculty/adjunct professors. The UT campus does also have on-street and surface parking lots in addition to the parking garages; a total of 3,323 spaces generally designed for faculty-staff, commuters, residents, etc. Faculty lots are shared after 5:00 p.m. on Fridays, and are available for students and special events on weekends. Attendance and enrollment statistics for UT appear in the Figure 5.0 legend below.
5.3
DOWNTOWN TRAVEL PATTERNS
This section offers a review of potential travel patterns in Downtown Tampa. The analysis examines travel desire in Downtown Tampa, based in part on interpolated distribution patterns from the Hillsborough MPO’s travel demand model. The section begins with a brief discussion of the methods used to carryout the analysis. Trailing subsections correspond to the model’s five trip purposes in the presentation of results.
5.4
METHODOLOGY
The initial step was to define a set of traffic analysis zones (TAZs) that best fit the study area for the Tampa Downtown Circulator Study. The planning area for market analysis purposes is depicted in Figure 5.1. In general, the TAZs are bounded by Channelside areas to the south, I-4 and Columbus Drive to the north, 22nd Street to the east, and North Boulevard to the west (note: these boundaries differ slightly from the study area boundaries, due to the use of best-fitting TAZs).
5-2
Section 5.0 FIGURE 5.0 DOWNTOWN VENUES AND THE UT
Map Key 1 2 3 4 5 6 7 8
Downtown Venues Tampa Bay Performing Arts Center Tampa Museum of Art Channelside Shops Florida Aquarium Ybor City St. Pete Times Forum Convention Center Cruise Passengers UT 5,367 Students 80 percent full time 50 percent live on campus 3,323 parking spaces
Annual Attendance 634,000 81,000 1.0 million (est.) 600,000 3.0 million 1.5 million 303,000 812,000
5-3
Section 5.0 FIGURE 5.1 REPRESENTATIVE TRAFFIC ANALYSIS ZONES
Source: Hillsborough County MPO
In addition to providing shapefiles for the TAZ boundaries, the Hillsborough MPO also provided Year 2000 and 2025 person trip tables from the region’s travel demand model. These tables contain estimates of the number of persons traveling between TAZs on a typical weekday for the following trip purposes: •
HBW - trips originating from home and being attracted to a place of employment.
•
HBSHOP – trips originating from home and being attracted to a shopping opportunity.
•
HBS&R – trips originating from home and being attracted to a social, recreational, or special event opportunity.
•
HBMISC – trips originating from home and being attracted to some other opportunity.
•
NHB – trips originating from a place other than home and being attracted to any other opportunity.
5-4
Section 5.0 A couple of pre-processing steps were necessary before the trip tables could be assigned to the travel desire network. In the first step, trip values were computed to the years 2008 and 2012 by interpolation. The next step was to isolate and extract trips for the collection of TAZs used to represent downtown. Together, these steps yielded downtown tables (i.e. matrices) of daily person trips for the years 2008 and 2012. The downtown trip tables were then assigned to the travel desire networks. Single-iteration assignments and coequal link coding were used to ensure results were essentially unimpeded. More succinctly, the assignment network is a system of travel desire lines, not streets; and the aim in making these assignments was to simply to show the basis of travel desire. This differs from the typical highway assignment, which aims to determine route choices, based on travel time and available capacity. Results from the assignments were then reassembled with GIS software to illustrate travel desire in the downtown. Additionally, trip production and attraction volumes were mapped for the downtown study area. The following sections present these results in terms of the regional model’s five trip purposes (i.e. HBW, HBSHOP, HBS&R, HBMISC, and NHB). 5.4.1
HBW TRAVEL
HBW production and attraction trip volumes were determined for each of the zones within the defined downtown study area for 2008 and 2012. A comparison of 2008 and 2012 production and attraction trip volumes reflects trip growth within the study area on a zone level basis. Figures 5.2 and 5.3 identify the difference in trip volumes between year 2008 and 2012 for productions and attractions. 5.4.2
SUMMARY OF HBW PRODUCTIONS AND ATTRACTIONS
On the production or residential side (Figure 5.4), year 2008 productions total 9,926 and grow to 12,573 (+27 percent) in the year 2012. Some 4,158 (42 percent) of the year 2008 work productions are expected to both begin and end within Downtown Tampa. On the attraction or employee side (Figure 5.5), work attractions for 2008 and 2012 are estimated to be 119,423 and 132,909, respectively. This represents an 11 percent increase over the four-year period or roughly a three percent per year rate of growth. The percentage of work trips that begin and end in downtown is about four percent of the total attractions in both years.
5-5
Section 5.0 FIGURE 5.2 HBW PERSON-TRIP PRODUCTIONS CHANGE FROM 2008 TO 2012
FIGURE 5.3 HBW-TRIP ATTRACTIONS CHANGE FROM 2008 TO 2012
5-6
Section 5.0 FIGURES 5.4 AND 5.5 SUMMARY OF HBW PERSON-TRIP PRODUCTIONS AND ATTRACTIONS
Figure 5.4 Downtown Trip Productions
Figure 5.5 Downtown Trip Attractions 135,000
14,000 12,000
8,000
Downtown to Elsewhere
Within the Downtown 120,000 4,15
8
115,000
4,000 8 5,76
127,9
58
Elsewhere to the Downtown
3 7,62 110,000
0
65 115,2
105,000
Y2008
5.4.3
125,000
Within the Downtown
8 4,15
6,000
2,000
0 4,95
130,000
0 4,95
10,000
Y2012
Y2008
Y2012
HBSHOP TRAVEL
HBSHOP production and attraction trip volumes were determined for each of the zones within the defined downtown study area for 2008 and 2012. A comparison of 2008 and 2012 production and attraction trip volumes reflects trip growth within the study area on a zone level basis. Figures 5.6 and 5.7 identify the difference in trip volumes between year 2008 and 2012 for productions and attractions. FIGURE 5.6 HBSHOP PERSON-TRIP PRODUCTIONS CHANGE FROM 2008 TO 2012
5-7
Section 5.0 FIGURE 5.7 HBSHOP PERSON-TRIP ATTRACTIONS CHANGE FROM 2008 TO 2012
5.4.4
SUMMARY OF HBSHOP PRODUCTIONS AND ATTRACTIONS
Figure 5.8 summarizes productions and Figure 5.9 summarizes attractions, respectively, for HBSHOP trips in the downtown study area. On the production side (Figure 5.8), year 2008 has a total of 14,030. That value grows to 16,885 (+20 percent) in the year 2012. Some 5,215 (59 percent) of the year 2008 shopping productions are expected to both begin and end within Downtown Tampa. On the shopping attraction side (Figure 5.9), total attractions for 2008 and 2012 are estimated to be 45,834 and 52,644, respectively. This represents a 15 percent increase over the four-year period or nearly a four percent per year rate of growth. The percentage of shopping trips that begin and end in downtown is expected to be about 12 percent of the total attractions in both years.
5-8
Section 5.0 FIGURES 5.8 AND 5.9 SUMMARY OF HBSHOP PERSON-TRIP PRODUCTIONS AND ATTRACTIONS
Figure 5.8
Figure 5.9
Downtown Trip Productions
Downtown Trip Attractions 60,000
18,000 16,000
4 6,32
50,000
14,000 12,000 10,000
4 6,32 40,000
5 5,21
Within the Downtown Downtown to Elsewhere
8,000 6,000 4,000
5 8,81
62 10,5
Within the Downtown 30,000 20,000
19 40,6
20 46,3
Elsewhere to the Downtown
10,000
2,000 0
0
Y2008
5.4.5
5 5,21
Y2012
Y2008
Y2012
HBS&R TRAVEL
HBS&R production and attraction trip volumes were determined for each of the zones within the defined downtown study area for 2008 and 2012. A comparison of 2008 and 2012 production and attraction trip volumes reflects trip growth within the study area on a zone level basis. Figures 5.10 and 5.11 identify the difference in trip volumes between year 2008 and 2012 for productions and attractions. FIGURE 5.10 HBS&R PERSON-TRIP PRODUCTIONS CHANGE FROM 2008 TO 2012
5-9
Section 5.0 FIGURE 5.11 HBS&R PERSON-TRIP ATTRACTIONS CHANGE FROM 2008 TO 2012
5.4.6
SUMMARY OF HBS&R PRODUCTIONS AND ATTRACTIONS
Respectively, Figures 5.12 and 5.13 summarize the productions and attractions for HBS&R trips in the downtown study area. Year 2008 HBS&R productions (Figure 5.12) total 5,758 and grow to 7,393 in the year 2012, an increase of 28 percent. HBS&R travelers that are expected to begin and end their trips within downtown amount to 1,525. This represents some 26 percent of the HBS&R travel market on a typical day in the year 2008. On the attraction side (Figure 5.13), HBS&R attractions are estimated to be 17,421 and 21,365 for the respective years 2008 and 2012. This represents a 23 percent increase over the four-year period or nearly a six percent annual growth rate.
5-10
Section 5.0 FIGURES 5.12 AND 5.13 SUMMARY OF HBS&R PERSON-TRIP PRODUCTIONS AND ATTRACTIONS
Figure 5.12
Figure 5.13
Downtown Trip Productions
Downtown Trip Attractions 25,000
8,000 7,000 5 1,88
6,000 5,000
1,52
5
4,000 3,000 2,000
4,23
3
8 5,50
5 1,88
20,000 5 1,52
Within the Downtown
15,000
Downtown to Elsewhere
10,000
Within the Downtown
96 15,8
80 19,4
Elsewhere to the Downtown
5,000
1,000 0
0
Y2008
5.4.7
Y2012
Y2008
Y2012
HBMISC TRAVEL
HBMISC trips represent the balance of trips originating at places of residence but not related to the work, shopping or social-recreational purposes. As such, the HBMISC trip purpose is sometimes called HB Other. HBMISC production and attraction trip volumes were determined for each of the zones within the defined downtown study area for 2008 and 2012. A comparison of 2008 and 2012 production and attraction trip volumes reflects trip growth within the study area on a zone level basis. Figures 5.14 and 5.15 identify the difference in trip volumes between year 2008 and 2012 for productions and attractions.
5-11
Section 5.0 FIGURE 5.14 HBMISC PERSON-TRIP PRODUCTIONS CHANGE FROM 2008 TO 2012
FIGURE 5.15 HBMISC PERSON-TRIP ATTRACTIONS CHANGE FROM 2008 TO 2012
5-12
Section 5.0
5.4.8
SUMMARY OF HBMISC PRODUCTIONS AND ATTRACTIONS
Year 2008 and 2012 HBMISC trips are summarized respectively by Figures 5.16 and 5.17. In the downtown study area, HBMISC productions (Figure 5.16) total 15,759 for 2008 and are expected to grow approximately 20 percent to 18,931 by the year 2012. HBMISC trip makers that begin and end their trips within downtown amount to 4,236; this is roughly 27 percent of the daily HBMISC travel market in the year 2008. On the attraction side (Figure 5.17), HBMISC attractions amount to 60,677 in 2008 and 68,557 in 2012, a 13 percent increase. Over the fouryear period, this represents a four percent annual growth in HBMISC travelers. FIGURES 5.16 AND 5.17 SUMMARY OF HBMISC PERSON-TRIP PRODUCTIONS AND ATTRACTIONS
Figure 5.16
Figure 5.17
Downtown Trip Productions
Downtown Trip Attractions 80,000
20,000 18,000
70,000
5,03
16,000 14,000 12,000
4,23
8,000 4,000
11,5
Within the Downtown
23
99 13,8
6 4,23
Downtown to Elsewhere
50,000
Within the Downtown
40,000 30,000
41 56,4
26 63,5
Elsewhere to the Downtown
20,000 10,000
2,000 0
0
Y2008
5.4.9
60,000
6
10,000 6,000
2 5,03
2
Y2012
Y2008
Y2012
NHB TRAVEL
NHB production and attraction trip volumes were determined for each on the zones within the defined downtown study area for 2008 and 2012. A comparison of 2008 and 2012 production and attraction trip volumes reflects trip growth within the study area on a zone level basis. Figures 5.18 and 5.19 identify the difference in trip volumes between year 2008 and 2012 for productions and attractions.
5-13
Section 5.0 FIGURE 5.18 NHB PERSON-TRIP PRODUCTIONS CHANGE FROM 2008 TO 2012
FIGURE 5.19 NHB PERSON-TRIP ATTRACTIONS CHANGE FROM 2008 TO 2012
5-14
Section 5.0
5.4.10
SUMMARY OF NHB PRODUCTIONS AND ATTRACTIONS
It is common for NHB trips to represent the lion’s share of travel in any downtown because, by definition, NHB travel occurs between areas of employment. Summaries for Downtown Tampa’s NHB travel market (Figures 5.20 and 5.21) affirm this characteristic. In addition, NHB trip generation rates, by design, generally yield equivalent values for NHB productions and attractions. Year 2008 NHB productions (Figure 5.20) total 82,956, nearly the same amount as the 2008 attractions (Figure 5.21). NHB trips grow to about 99,000 in the year 2012, an increase of 20 percent. NHB travel within downtown is 38 percent of downtown’s total daily NHB travel market. FIGURES 5.20 AND 5.21 SUMMARY OF NHB PERSON-TRIP PRODUCTIONS AND ATTRACTIONS
Figure 5.20
Figure 5.21
Downtown Trip Productions
Downtown Trip Attractions
120,000
120,000
100,000
100,000
80,000 60,000
37,6
90
03 32,1
Downtown to Elsewhere
40,000 20,000
60,000
0 32,1
3
Within the Downtown Elsewhere to the Downtown
40,000
50,8
53
61,0
21 20,000
0
51 51,3
82 61,4
0
Y2008
5.5
90 37,6
80,000
Within the Downtown
Y2012
Y2008
Y2012
DOWNTOWN TRIP ATTRACTIONS
This section identifies external to internal trip attractions by trip purpose by traffic analysis zone within the downtown study area. This information is important from the perspective of knowing trip volumes into the downtown core that may park at periphery parking garages and traverse the downtown area using transit circulator routes. These trip volumes are illustrated for 2012 only because it is assumed that construction of new parking structures built around the perimeter of the downtown core would not be feasible by 2008 given the lead time required to locate sites, purchase property, plan and design the structure, and complete construction. This information does provide a basis to examine attraction by trip purpose and will be used in designing transit circulators to link potential parking structure areas with the highest demand zones within downtown.
5-15
Section 5.0 Figures 5.22 through 5.26 illustrate zonal trip attraction volumes for trips from zones outside of Downtown Tampa to those within the downtown study area. Trip volumes are identified for the five trip purposes in the Hillsborough MPO’s travel demand model (i.e. HBW, HBSHOP, HBS&R, HBMISC, and NHB). FIGURE 5.22 HBW EXTERNAL TO INTERNAL WORK TRIP ATTRACTIONS
As expected, the largest concentration of external to internal work trips occurs in the core of downtown. However, a higher concentration of work trips is also occurring in the Ybor City area, with moderate concentrations north of I-275 and southwest of Kennedy Boulevard and the Hillsborough River.
5-16
Section 5.0 FIGURE 5.23 HBSHOP EXTERNAL TO INTERNAL WORK TRIP ATTRACTIONS
The highest concentration of external to internal shopping trip attractions occurs in the Ybor City area. Moderate levels also appear west of the Hillsborough River along Kennedy Boulevard, north of I-275, and in the southeast portion of the downtown core. Although some of these trip volumes appear unusual when compared to existing land use conditions, the travel demand model land use designations for future years indicate differences from existing land use for these zones resulting in trip attractions different than existing conditions. FIGURE 5.24 HBS&R EXTERNAL TO INTERNAL WORK TRIP ATTRACTIONS
5-17
Section 5.0 The highest concentration of external to internal shopping trip attractions occurs in the Ybor City area. Moderate levels also appear west of the Hillsborough River and south of Kennedy Boulevard. FIGURE 5.25 HBMISC EXTERNAL TO INTERNAL WORK TRIP ATTRACTIONS
The highest concentration of external to internal miscellaneous trip attractions occur in the Ybor City area, the UT campus, and the area north of I-275. FIGURE 5.26 NHB EXTERNAL TO INTERNAL WORK TRIP ATTRACTIONS
5-18
Section 5.0 The highest concentration of external to internal NHB trip attractions occur in the Ybor City area. Moderate levels also appear west of the Hillsborough River, south of Kennedy Boulevard, north of I-275, and the southeast portion of the downtown core.
5.6
FINDINGS
Table 5.1 summarizes the Market Growth Projections between 2008 and 2012. TABLE 5.1 MARKET GROWTH PROJECTIONS, 2008-2012
Market HBW HBSHOP HBS&R HBMISC NHB
Attractor 21.1% 17.0% 12.2% 16.8% 0.6%
Producers 10.2% 13.0% 18.5% 11.5% 0.5%
Total 11.1% 14.0% 19.4% 12.7% 16.0%
The most dramatic growth in person-trips is projected to be related to social and special events. This is of particular importance when compounded with the most recent year’s (2006) attendance estimates of nearly eight million for all downtown venues. Additionally, growth in NBH and HBSHOP indicates the growth in non-peak person-trip activities. Analysis of the TAZ data indicates that those areas projected to experience this growth are: •
Southern Central Business District,
•
Channelside (Entertainment area),
•
Channelside (Residential area),
•
North Franklin/Arts District,
•
Ybor City, and
•
The Heights.
Examination of both the growth projections and the TAZ data reveals a growing desire for movement within the downtown area along the geographic periphery, especially at off-peak hours. Recommendations based on this analysis can be found in Section 7.0 of this report.
5-19
Section 6.0 PUBLIC OUTREACH 6.1
INTRODUCTION
Public outreach activities for any transportation planning efforts are key to producing effective planning documents. For the Tampa Downtown Circulator Study, public outreach was primarily in the form of stakeholder group meetings and focus group meetings. These meetings served as a conduit for information exchange, informing the groups on project status, gaining input on recommendations for improvements to the circulator service, and garnering support for future circulator activities.
6.2
STAKEHOLDER GROUP The Circulator Study Stakeholder Group consisted of members from various local agencies and interest groups, shown in Table 6.0 below. The full member list is provided in Appendix C. There were a total of four stakeholder meetings throughout the course of the study period held at the Hillsborough MPO offices on the following dates and times:
December 13, 2006 January 26, 2007 February 16, 2007 March 29, 2007
9:30 a.m. to 11:00 a.m. 1:30 p.m. to 3:30 p.m. 10:00 a.m. to 12:00 p.m. 1:30 p.m. to 2:30 p.m.
6-1
Section 6.0 TABLE 6.0 STAKEHOLDERS AND AGENCY GROUP LIST
CB Richard Ellis Channel District Council Channelside Restaurants City of Tampa, Housing and Community Development City of Tampa, Neighborhood and Community Relations City of Tampa, Parking City of Tampa, Transportation Planning CGHJ Architects Florida Aquarium Florida Department of Transportation (FDOT) Florida Department of Transportation District 7 HART Hillsborough County, ADA Hillsborough County MPO Hillsborough County Planning Commission Hillsborough County, Transportation
Hyde Park Village InTown Group InTown Properties Mechanik, Nuccio, Williams et al Prida Guida and Co, PA St. Pete Times Forum Tampa Bay Convention and Visitor’s Bureau Tampa Convention Center Tampa Downtown Partnership Tampa Housing Authority Tampa Mayor’s Alliance for Persons with Disabilities Tampa Port Authority The Dohring Group University of Tampa University of South Florida, Center for Urban Transportation Research Westshore Alliance
Ybor Chamber
The objectives for the stakeholder meetings ranged somewhat based on the progress made on the study. The initial meeting served as a kick-off to the study and introduced the stakeholders to the study purpose and scope. Each subsequent meeting provided overviews of progress made to date and facilitated discussions regarding issues surrounding the current circulator system, suggestions for improving the service, and potential policy changes. Some of the ideas that surfaced throughout the stakeholder discussions are listed below. Issues Route 96 is dead after 6:00 p.m. Lack of parking/connection to circulators Route 96 does not coincide with venue special event times Downtown pedestrian environment is lacking Funding for Route 98 will end this year
6-2
Section 6.0 Improvements Simplify routing Utilize employee parking garages at night for events Extend service hours to evening Connect parking to entertainment/events and hotels Increase frequency of service Coordinate circulator improvements with downtown pedestrian improvements, signage study, and Downtown Tampa Transportation Vision Considerations Channelside residents need connections to circulator Coordinate circulator with streetcar Segmented routes to serve different user groups Ybor City “Park N’ Ride” garages Evening/Entertainment shuttle Marketing/branding of improved service The key elements that continued to surface throughout the meetings included: •
Frequent Service,
•
Free Fares,
•
Simple Schedules,
•
Convenient Routes, and
•
Nearby Parking,
Generally, a successful circulator service should act as an incentive for traveling in and around downtown. The previously identified factors are all important in creating a successful circulator service whereby, users understand the schedules and routes, are not inconvenienced by the service, and feel safe and comfortable while riding. All materials, including agenda, meeting notes, presentation, and sign-in sheets for the Stakeholder Meetings are presented in Appendix C.
6-3
Section 6.0
6.3
FOCUS GROUPS
The focus groups were designed to solicit input from three different interest groups concerning the circulator service. The purpose of each discussion was to assess perspectives on the existing service and identify ways participants feel the service can be improved to meet current and emerging demand. The focus groups also aimed to gauge participants’ willingness to pay for the improved service. The focus group members were sought from three primary interest groups: residential, employer/employee, and potential funding partner. The residential focus group consists of downtown residents, as well as residential developers. In the interest of time and due to the fact that many of the ‘employer/employee’ members overlapped with the ‘potential funding partners’ members, only two focus group discussions were held. Thus, the second combined group included major employers, such as the St. Pete Times Forum, Channelside, and the UT all of whom can also be considered for potential funding partnerships. The meetings were held at the Hillsborough MPO on the following dates/times: February 29, 2007 February 30, 2007
6.4
12:00 p.m. – 2:00 p.m. 6:00 p.m. – 8:00 p.m.
FOCUS GROUP FORMAT
The meeting format consisted of a brief presentation providing an overview of the project status, peer review, and existing conditions analysis. Additionally, each focus group member was given two questionnaires to complete. One questionnaire was general in nature, asking questions regarding quality of life, commuting, parking, importance of a downtown circulator, willingness to pay for a downtown circulator, and funding. The second questionnaire was customized for each group based on interests. The complete questionnaires and focus group results are provided in Appendix C; however, the following tables provide a glance at some of the questions and responses obtained at these meetings.
6-4
Section 6.0 GENERAL QUESTIONNAIRE OVERVIEW
Topic Quality of Life Greatest Stressor Do members use transit? Top 3 Factors for Successful Circulator Service Willingness to Pay Funding Options
Response Public Safety Transportation/Commute Majority – “No” • Frequency • Origins/Destinations • Routes Most are WTP some amount • Federal Grants • Tax Increment Financing • Sponsorships
Willingness to Pay A couple of the questions on the general questionnaire centered on the issue of willingness to pay for each of the interest groups. The following questions and possible answers were provided: 1. How much would you or your constituents be willing to pay for a downtown circulator service? a. Not willing to pay b. $.50 or less c. $.50 to $1 d. $1 to $1.50 e. More depending on service 2. How would you or your constituents be willing to pay? a. Out-of-Pocket b. Condo Fees c. Included in Monthly HART Pass d. Convention Pass The following lists the results of these questions, categorized by interest group. Educational Institution 1. $.50 to $1.00 2. Out-of-pocket/ included in monthly HART pass
6-5
Section 6.0 Public Sector County 1. $1 or less 2. Out-of-pocket/Included in monthly HART pass HART 1. $.50 or less 2. Included in monthly HART pass City 1a. More than $1.50 depending on service 1b. $.50 or less 2a. Included in monthly HART pass 2b. Included in monthly HART pass Employers County HR 1. $.50 to $1/more depending on service 2. Special circulator passes good for entire year Private 1. $.50 or less 2.
Out-of-Pocket
Residents •
$.50 to $1; Out-of-Pocket
•
$.50 to $1; Out-of-Pocket/Included in monthly HART pass
•
More than $1.50 depending on service; Out-of-Pocket
•
$1 to $1.50; Out-of-Pocket/Included in monthly HART pass
•
More than $1.50 depending on service; Out-of-Pocket/Condo Fees
Special Event Venues Tampa Convention Center 1. $.50 to $1 2. Convention pass
6-6
Section 6.0 Tampa Bay Lightning 1. $.50 to $1 2. All options Restaurants/Evening Activities Channelside Restaurants 1. Not willing to pay; stakeholders and governments should pay for it, make free for customers 2. Condo Fees/Convention Pass/Included in monthly HART pass SPECIFIC QUESTIONNAIRE OVERVIEW
Employer/Employee Topic Response
Residential Topic •
Issues with working/having business in downtown Reasons for not using transit Average number of blocks willing to walk to/from circulator stop Top three funding scenarios
•
Lack of parking
• •
Inconvenience Inaccessibility
•
2 to 3 blocks
• •
Sponsorships Special District Tax Grants
•
Disadvantages of living/developing in downtown How many use transit? Average number of blocks willing to walk to/from circulator stop Most attractive features in a circulator system
Response Traffic, parking, lack of public transportation and lack of public services and amenities
•
Only 1 out of 7
•
1 to 3 blocks
• • • •
Convenience Free fares Accessibility Safety
The open discussion format upheld at these meetings allowed the members to freely express their opinions and ideas regarding what is lacking with the current service, what should be improved to attract more users, potential funding options, and possible impediments for consideration. All meeting materials are provided in Appendix C. In addition to the stakeholder meetings and focus group discussions, all of the study materials are posted on the Hillsborough MPO website for public use.
6-7
Section 7.0 RECOMMENDATIONS Recommendations for the Tampa Downtown Circulator Study were developed based on project team expertise, stakeholder input, case studies focus group meeting feedback and the market analysis. General recommendations, including short-term and long-term recommendations are provided and the short-term and long-term operational recommendations are based upon the available resources and funding limitations, as outlined in HART’s Circulator Work Plan. Shortterm recommendations are expected to be implemented by 2008, predominantly using existing resources. Long-term recommendations are expected to be implemented by 2012 and will likely require additional revisions as the community needs evolve. Both short-term and long-term recommendations have been sub-divided into specific sub-headings, addressing routes, ridership, marketing, urban design/pedestrian circulation, and parking. Additionally, policy recommendations, coordination with citywide efforts and funding scenarios are provided as separate components, to be considered independently of the short-term and long-term recommendations. The success of the circulator is dependent upon the opening of facilities (parking structures), funding, and coordinated policy decisions of public entities and the cooperation of public and private interests.
7.1
SHORT-TERM OPERATIONAL
7.1.1
TO BE IMPLEMENTED BY 2008
North-South Circulator The North-South Circulator provides weekday service along the Florida Avenue and Tampa Street corridor between Harbour Island and I-275 on the north side of Downtown Tampa. This route begins on Harbour Island along Knights Court providing service to Beneficial Drive and Harbour Place Drive, continuing west to Harbour Island Boulevard. Service continues north along Harbour Island Boulevard / Franklin Street, east on Channelside Drive, north on Florida Avenue, east on Cass Street and north on Marion Street to Kay Street, serving the Marion Street Transit Center along the way. This route then travel west on Kay Street, returning south along Tampa Street, east on Whiting Street, south on Franklin Street / Harbour Island Boulevard, east on Knights Court to Beneficial Drive. Both the northbound and southbound travel patterns serve the Southern Transportation Center and the existing end-of-line for the TECO Line Streetcar System. Event Circulator The Event Circulator provides Friday and Saturday evening service as well as service on other event days, between the Channelside District and the Tampa Bay Performing Arts Center. This route begins at the Shops at Channelside, travels west along Channelside Drive, northwest / north along Brorein Street and Jefferson Street, west along Whiting Street, north on Florida Avenue, west on Tyler Street and north on W.C. Mac Innes Place to the Tampa Bay Performing Arts
7-1
Section 7.0 Center. Southbound, this route proceeds east on Fortune Street, south on Ashley Drive, east on Cass Street, south on Tampa Street, east on Whiting Street, south on Morgan Street, and east along Channelside Drive returning to the Shops at Channelside (see Figure 7.0). Operational Recommendations •
Coordinate with the City of Tampa regarding improvements to the pedestrian environment. This includes ensuring there are adequate sidewalks, lighting, and connectivity. In addition, it is important to ensure the safety of pedestrians and provide ADA compliant facilities and pathways.
•
Ensure that all applicable ADA requirements are met.
•
Integrate proposed routes with the existing streetcar system and schedule to expand “capture area” of both systems
•
Create a holistic circulator system by utilizing existing transit services and planning for future expansion of transit services − Better integrate streetcar system during peak days and event times − Ensure that connections to existing HART bus service are maximized (see Figure 7.1)
•
Maximize utilization of streetcar service during high capacity St. Pete Times Forum and Convention Center events by increasing number of vehicles operational, speed, and specified stop in conjunction with circulation.
7.2
LONG-TERM OPERATIONAL
7.2.1
TO BE IMPLEMENTED BY 2012
7.2.1.1
Routes •
Extend north/south circulator route to reach Ybor City or incorporate an east/west route to reach Ybor City. − A long-term extension could travel north on Channelside Drive into Ybor City along 6th Avenue (eastbound), return along 8th Avenue (westbound), and go south again along Channelside Drive. − A future east-west connector could be made along 7th Avenue connecting the Florida Avenue/Tampa Street north-south route to the Channelside Drive/Ybor City north-south route.
•
Explore the possibility of separating routes for weekdays and weeknights
•
Investigate the feasibility of implementing a singular “postage stamp” route
7-2
4
Map Not To Scale PALM AVE
PALM AVE
VISITORS CENTER
9TH AVE OAK AVE
CENTRO
275
8TH AVE YBOR
7TH AVE
7TH AVE
HENDERSON AVE
DOYL
ASHLEY PLAZA
NS
IO MAR
BRO
PA TAMIOTT R MARERSIDE WAT
D
GA
MERIDIAN ST
CRUISE TERMINAL 2
D BLV IAL
22ND ST
21ST ST
20TH ST
19TH ST
A&E Venue, Educational Center Parking Structure Transportation Center
EFIC
NN CHA
Hotel
Park
L
NNE
CHA
BEN
E
OBE NCH COTA ARK P
IDE
ELS
TIMES FORUM
ON RRIS
Day Time Circulator Event Circulator
BLV
AM D NDH AN WY UR ISL O TEL B R HA HO
S HA
BA Y GH
OU
SB LL HI
TAMPA GENERAL HOSPITAL
RN TION THE A SOU NSPORT TRA ZA PLA
ERW ALK
FLORIDA AQUARIUM
Government Building
ND
LV D EB OR BA YS H
OR
PLANT AVE
BAY ST
RIV
ASS EMBITES SU
ISLA
BAYSHORE BLVD. LINEAR PARK
AZEELE ST
CUMBERLAND AVE
ST. PETE
TH SOUIONAL REGARAGE G
Y
TAMPA CONVENTION CENTER
PLATT ST
CRUISE TERMINAL 3
BALL ST BA
UR RBO
TAMPA BAY HISTORY CENTER
CAESAR ST
CUMBERLAND CUM AVE
EUNICE ST
T POS ICE OFF
BROREIN ST CLEVELAND ST
12TH ST
T SH S
EL
MO
WALTON ST
S REIN
TAMPA TRIBUNE
PORT AUTHORITY PARKING GARAGE
Residential Development Existing Complete by 2008 Complete by 2012 Office/Employment Center
CHANNELSIDE DR
WA Y NE XP RE
SS
FINLEY ST
T
ECONOMY INN
18TH ST
KW AY PA R O CC I
ENO
T ST EAS
JEFF
P
BRU
ST
ON
ERS
T ES IERC
GOV
EAS
R ST
T ST
GRAND CENTRAL AVE
HYDE PARK AVE
WHITING ST
LE
FALK THEATER
KE OO T BR FORRAGE T A G GS ITIN WH RAGE GA CA L ST YM BEL
WASHINGTON ST
G ST
ITIN WH
OY S
TT HYA NCY E REG PA TAM
WN NTOOL DOW HO LLOSHIP SC E P R RAM N ST TNE GTO PAR HIN WAS
ER
RADISSON RIVERWALK
CRUISE TAMPA TERMINAL 6 PORT AUTHORITY HEADQUARTERS 11TH ST
Y KWA PAR NSITT TRA
ET TRE
MO D
BLV
KE
N BOULEVARD
E A AV RID FLO
T
IN S
N BOULEVARD
HENRY B. PLANT PARK DY NNE
NKL
RGA
R
ARTISTS UNLIMITED
OOL SCH RD BOA
NTY COU AGE GAR N ST KSO JAC
N ST
VE
N ST ISO JOE A MAD HILLUR USE C RTHORE A COUSQU LVD E OLIC RS DY B NNE NTY PA PUARTE M E M K A U T ADQ SEU CO TER HE ND MU ES CEN LYK IGHT A L GAS UARE L L A H SQ Y IT C ZA PLA FRA
ST PA TAM
DR LEY
RI
KENNEDY BLVD
ST
TAMPA MUSEUM OF ART G KIN PAR RAGE GA
Text
Text
K
GH
Text Text
R YO
OU
ASH
OR
ST
SB
OR
LL
MADISON ST
ST
WILLIAM POE GARAGE IS RT RK CU N PA O X I H
TWIGGS ST
AY
UNIVERSITY OF TAMPA
S ST UND CAS YHO RS GRE ATION HTE FIG M ST S FIREUSEU N T BO AL S M B MB IB K G DER E ECO E POL LAKE DING FE HOUS EDG THOUS ER UIL R RT IMBERAL B U U T O O S ST C C IGG E FED T W ARAG K ST E G ZAC S U A O P SE RTH TAM ER HOU COU EUSE AT NTY SE COURT X T NTY E R THE COUTHOU GS S COUDAPTIV NNE IG A R W A T COU
CK
LK
CASS ST
ARY
UNION STATION/ AMTRAK
M
RWA
RIVE
LIBR
T
ER S
TYL
T POSICE OFF
INN NCE TT IDE RES ARRIO BY M ARD RTY OTT COU ARRIO Y B M
TAMPA BAY PERFORMING G ARTS CENTER
HI
LEE ROY SELMON EXPRESSWAY
RB
N MA HERASSEY M ARK P
Recommended Routes
HA
N ST
RISO
TAMPA PREPARATORY SCHOOL
ADAMO DR
CENTRAL PARK VILLAGE (Proposed Boundaries)
ROYAL ST HAR
2ND AVE
NU
FORTUNE ST
TAMPA WATERSPORTS CENTER
PERRY HARVEY SR. PARK
NEBRASKA AVE
RIVERFRONT PARK
MARION TRANSIT CENTER
ORANGE ST
PARK TRAMMELL BUILDING
ST
JEFFERSON ST
REL
LAU
LAURELL ST
3RD AVE
SCOTT ST INDIA ST
LAUREL ST
17TH ST
KAY ST
4TH AVE
YBOR CHANNEL
LTON AV
E
KAY ST
E CAR
BLAKE HIGH SCHOOL GREEN ST
GOVERNOR ST
3RD AVE
Figure 7.0
5TH AVE
16TH ST
STETSON UNIVERSITY COLLEGE OF LAW
ESTELLE ST ESTELLE ST
15TH ST
ESTELLE ST
AVENIDA REPUBLICA DE CUBA
PIERCE ST
6TH AVE
TECO Streetcar
June 2007
20X 26X 50X 51X 52LX
28X 51X
4
9
Map Not To Scale
5
6
18
PALM AVE
12 PALM AVE
VISITO VISITORS CENTER
9TH AVE OAK AVE
CENTRO
275
8TH AVE YBOR
7TH AVE
7TH AVE
HENDERSON AVE
DOYL
INDIA ST
NS
IO MAR
ENO GOV
HI
LL
SB
BAY ST
TAMPA GENERAL HOSPITAL
12TH ST
MERIDIAN ST CAESAR ST
D BLV IAL
E
OBE NCH COTA ARK P
ON RRIS
GA
22ND ST
21ST ST
20TH ST
19TH ST
Transportation Center Park
L
NNE
CHA
Day Time Circulator
D
ERW ALK
PA TAMIOTT R MARERSIDE WAT
NN CHA
EFIC
RN TION THE A SOU NSPORT TRA ZA PLA
Parking Structure
IDE
ELS
TIMES FORUM
BEN
ASS EMBITES SU
A&E Venue, Educational Center
CRUISE TERMINAL 2
Event Circulator
BLV
RIV
Hotel
FLORIDA AQUARIUM
ND
OU
GH
BA YS H
OR
BA Y
EB
LV D
BAYSHORE BLVD. LINEAR PARK
OR
PLANT AVE
46 19
CUMBERLAND AVE
ST. PETE
TH SOUIONAL REGARAGE G
Y
TAMPA CONVENTION CENTER
Government Building
CRUISE TERMINAL 3
BALL ST
AM D NDH AN WY UR ISL O TEL B R HA HO
S HA
TAMPA BAY HISTORY CENTER
Office/Employment Center
CHANNELSIDE DR
WA Y RE XP NE MO
EL OY S
CUMBERLAND AVE
Residential Development Existing Complete by 2008 Complete by 2012
ISLA
100X 25X 24X
PORT AUTHORITY PARKING GARAGE
EUNICE ST
T POS ICE OFF
BROREIN ST
11TH ST
T
T ST EAS
JEFF
SS
FINLEY ST
WALTON ST
ER
BRO
18TH ST
KW AY PA R O CC I
NU
R ST
T ST
EAS ST
ON
ERS
T P
WHITING ST
T
19
WASHINGTON ST
G ST
S REIN
TAMPA TRIBUNE
HYDE PARK AVE
AZEELE ST
KE OO T BR FORRAGE T A G GS ITIN WH RAGE GA CA L ST YM BEL
CRUISE TAMPA TERMINAL 6 PORT AUTHORITY HEADQUARTERS
LE
F HE H EA FALK THEA THEATER
PLATT ST
4
ES IERC
MO TT HYA NCY E REG PA TAM
GRAND CENTRAL AVE
ECONOMY INN
CLEVELAND ST
K PAR
WAY
RADISSON RIVERWALK
WN NTOOL HO DOW P SC LLOSHIP E P R RAM N ST TNE GTO PAR HIN WAS
ITIN WH
UR RBO
14
NSIT
TRA
ET TRE
E
D
BLV
KE
30
A AV RID FLO
T
IN S
N BOULEVARD N BOULEVARD
HENRY B. PLANT PARK DY NNE
NKL
RGA
R
ARTISTS ART TISTS T S UNLIMITED
OOL SCH RD BOA
NTY COU AGE GAR N ST KSO JAC
N ST
VE
N ST ISO JOE A MAD HILLUR USE C RTHORE A COUSQU LVD E OLIC RS DY B NNE NTY PA PUARTE M E M K A U T ADQ SEU CO TER HE ND MU ES CEN LYK IGHT A L GAS UARE L L A H SQ Y IT C ZA PLA FRA
ST PA TAM
DR
TAMPA MUSEUM OF ART G KIN PAR RAGE GA
KENNEDY BLVD
ST
RI
Text
Text
K
GH
MADISON ST
Text Text
R YO
OU
LEY
OR
ASH
SB
ST
LL
IS RT RK CU N PA O X I H
TWIGGS ST
ST
WILLIAM POE GARAGE
HI
UNIVERSITY OF TAMPA
S ST UND CAS YHO RS GRE ATION HTE FIG M ST S FIREUSEU N T BO AL S M B MB IB I K G DER E ECO E POL LAKE DING FE HOUS EDG THOUS ER UIL R RT IIMBERAL B U U T O O S ST C C IGG E FED T W ARAG K ST E G ZAC S U A O P SE RTH TAM ER HOU COU EUSE AT NTY SE COURT X T NTY I E R THE COUTHOU GS S COUDAPTIV NNE IG A R W A T COU
AY
32
UNION STATION/ AMTRAK
CK
LK
CASS ST
ARY
T
ER S
TYL
M
RWA
7
LIBR
T POSICE OFF
INN NCE TT ID IDE RES ARRIO BY M ARD RTY OTT COU ARRIO Y B M
TAMPA BAY PERFORMING G ARTS CENTER
RIVE
TAMPA PREPARATORY SCHOOL
HAR
OR
10
27X 25X 24X 23X 22X
Recommended Routes with Current HART Service
RB
RISO
N MA HERASSEY M ARK P
46
LEE ROY SELMON EXPRESSWAY
ROYAL ST N ST
2ND AVE
HA
ASHLEY PLAZA
3RD AVE
ADAMO DR
CENTRAL PARK VILLAGE (Proposed Boundaries)
SH S
FORTUNE ST
PERRY HARVEY SR. PARK
BRU
RIVERFRONT PARK
MARION M TRANSIT TR CENTER C
ORANGE ST
PARK TRAMMELLL BUILDING
ST
JEFFERSON ST
REL
LAU
LAUREL ST
NEBRASKA AVE
LAUREL ST
TAMPA WATERSPORTS CENTER
8
SCOTT ST
17TH ST
59LX 200X 300X
KAY ST
4TH AVE
16TH ST
LTON AV
E
KAY ST
E CAR
BLAKE HIGH SCHOOL GREEN ST
GOVERNOR ST
3RD AVE
Figure 7.1
5TH AVE
15TH ST
STETSON UNIVERSITY V R VER COLLEGE OF LAW AW
ESTELLE ST ESTELLE ST
YBOR CHANNEL
ESTELLE ST
AVENIDA REPUBLICA DE CUBA
PIERCE ST
6TH AVE
TECO Streetcar
XX X
Express Routes Local Routes
June 2007
Section 7.0
7.3
GENERAL RECOMMENDATIONS
7.3.1
TO BE IMPLEMENTED BY 2008
7.3.1.1
Ridership •
Target specific user groups and create services to meet the individual needs of these groups: Students, Entertainment/Event-Goers, Employees, Residents − Conduct surveys to assess the propensity for circulator use and group desires for an improved circulator service − Explore the possibility of multiple routes to serve diverse groups
7.3.1.2
Bus Stops/Shelters •
Improve bus stops/shelters along circulator routes, ensuring that provisions are made for adequate relief from the heat and/or inclement weather; proper lighting is installed; and bus passengers are comfortable while waiting for the circulator service − Coordinate with the City of Tampa for contribution of impact fees for capital costs associated with improvements.- explain feasibility of this
•
7.3.1.3
Stops should be located adjacent or proximate to existing and planned parking structures and large surface parking lots. Marketing
•
Initiate new marketing strategy for improved circulator service − Unique and identifiable branding − Advertisements in Tampa Tribune, St. Petersburg Times, Tampa Bay Times, Florida Sentinel, and La Gaceta − Incorporate into materials for Forum events, conventions, hotels, Channelside menus, Ybor City venues, and cruise tours/packages − Night Shuttle Kick-off Event − TV and radio
•
Inventory parking and promote it in the newspaper, magazines and website
•
Improve the visibility and use of circulator service through signage, stop enhancements and postings of route numbers and schedules − Create “landmark” stops and way finding signage
7-5
Section 7.0 − Discuss the placement of informational signage on commercial property, in exchange for employee circulator passes •
Overall “look” of the Circulator should be unique − Vehicles should be visually unique − Driver uniforms should be casual − As appropriate, informational narration could be incorporated functions/event goes during high visitor events
7.3.2
TO BE IMPLEMENTED BY 2012
7.3.2.1
Ridership •
Research implications of providing “Wide Area Service” vs. “Focused Area Service” − Need a balance between reaching more users or improving frequency
7.3.2.2
Urban Design/Pedestrian Circulation •
Improve downtown pedestrian experience along circulator routes − Install additional lighting − Set-up wayfinding signage − Beautify pedestrian walkways through landscaping techniques, such as: − Provide sitting areas and shade trees
•
Design circulator service in support of downtown retail − Designation of Franklin Street as a retail hub − Plaza Park to support downtown retail connections
7.3.2.3
Parking •
Convert existing ConAgra (Whiting Street and Nebraska Avenue) lot to a parking garage − Retail on first floor of garage − Integrate with future transit plans for light rail or transit-oriented development
•
Convert existing parking garages to incorporate retail on 1st floor − Use revenues from retail to support circulator service
7-6
Section 7.0 •
Connect to parking under I-275 − There is currently no specific time frame for construction of this parking facility which is an amenity associated with the Tampa downtown regional intermodal center. However, when the facility is completed Circulator patrons could park at the location and walk to Marion Transit Center (MTC), then ride into downtown. A similar commuter lot set up could be located and used in Ybor City.
•
Locate potential park-and-ride locations − Ybor City
•
7.4
Circulator routes can be coordinated with peripheral parking lots to help relieve the employee and visitor parking demands in the Channel District during weekends and special events (see Figure 7-2).
POLICY RECOMMENDATIONS •
Establish a fare free zone1 − Based on the success of the free fare zone strategy employed in the Orlando, Norfolk, and Chattanooga circulator systems, it is recommended that a free fare zone be established in Tampa to encourage ridership. − Encourage partnerships between private lots and the city to generate revenue. − Use a portion of the revenue collected from the commuter lots established in and near downtown to close gap in funding created by the elimination of the bus fares on the circulator routes. − Establish a zone that incorporates much of the Tampa central business district (CBD). A CUTR report titled, Strategies for an Intra-Urban Circulator System, discusses some political opposition to the establishment of such a zone in the CBD, but the use of a free fare zone in this section of the city would serve as a much needed economic stimulus for the downtown economy. − Establish combination trolley and designated/exclusive bus lanes − Create one pass for all bus services − Encourage local governmental entities to establish policies that support such a service.
1
A designated area within which use of the system is free of charge.
7-7
4
Map Not To Scale PALM AVE
PALM AVE
VISITORS CENTER
9TH AVE OAK AVE
CENTRO
275
8TH AVE YBOR
7TH AVE
7TH AVE
HENDERSON AVE
DOYL
ASHLEY HLEY PLAZA ZA
AY RKW ITT PA ANS T TR E E TR
NS
IO MAR
R ENO GOV
LV D
BA Y
EB OR
OU
GH
BA YS H
OR
PLANT AVE
HI
LL
SB
BAY ST
TAMPA GENERAL HOSPITAL
RIV
ERW ALK
MERIDIAN ST
12TH ST
CHANNELSIDE CH CHANN CHANNELSID EELSID S DR
FLORIDA AQUARIUM
GA
AM D NDH AN WY UR ISL O TEL B R HA HO
CRUISE TERMINAL 2
D BLV IAL
22ND ST
21ST ST
20TH ST
19TH ST
Hotel A&E Venue, Educational Center Parking Structure Transportation Center
EFIC
NN CHA
Government Building
Park
L
NNE
CHA
BEN
E
OBE NCH COTA ARK P
IDE
ELS
TIMES FORUM
ON RRIS
D BLV ND ISLA
BAYSHORE BLVD. LINEAR PARK
RN TION THE A SOU NSPORT TRA ZA PLA PA TAMIOTT R MARERSIDE WAT
Day Time Circulator Event Circulator
SH
TAMPA CONVENTION CENTER
PLATT ST
Y ASS EMBITES SU
CRUI CRUISE TERMINAL TERM 3
CUMBERLAND AV CUMBE AVE V VE
ST. PETE
TH SOUIONAL REGARAGE G
Residential Development Existing Complete by 2008 Complete by 2012 Office/Employment Center
BALL ST BA B
OUR ARB
TAMPA BAY HISTORY CENTER
CAESAR ST
MO
CUMBERLAND CUM AVE
EEUNICE ST
T POS IIC CE OFF
BROREIN ST
PO PORT P O ORT AUTHORITY UTHOR HO H ORITY R PARKING PARK A KING ARK K GARAGE GARA AR A RAGE A
WALTON ST
EL OY S
BRO
CLEVELAND ST
11TH ST
T SH S BRU
T ST EAS
NE XP RE SS WA Y
FINLEY ST
S REIN
TAMPA TRIBUNE
AZEELE ST
18TH ST
KW AY PA R O CC I
ST
T ST
ST ON ERS
JEFF
P
WHITING ST
T
ECONOMY INN
WASHINGTON ST
G ST
ITIN WH
KE OO T BR FORRAGE T A G GS ITIN WH RAGE GA CA L ST YM BEL
CRUISE TAMPA TERMINAL 6 PORT AUTHORITY HEADQUARTERS
LE
FALK THEATER
WN NTOOL DOW CHO LLOSHIP IP S E P R RAM N ST TNE GTO PAR HIN WAS
ER
TT HYA NCY E REG PA TAM
ARTISTS UNLIMITED
OOL SCH RD BOA
NT Y COU AGE GAR N ST KSO JAC
N ST RGA MO
RADISSON RIVERWALK
GRAND CENTRAL AVE
HYDE PARK AVE
EAS
E A AV RID FLO
T
NKL
IN S
D
BLV
KE
N BOULEVARD
FRA
ST PA TAM
DR LEY ASH
R
HENRY B. PLANT PARK DY NNE
N ST ISO JOE A MAD HILLUR USE C RTHORE A COUSQU LVD E OLIC RS DY B NNE NTY PA PUARTE M E M K A U T ADQ SEU CO TER HE ND MU ES CEN LYK IGHT A L GAS UARE L L A H SQ Y IT C ZA PLA
E ST IERC
VE
KENNEDY BLVD
ST
RI
TAMPA T PA A MUSEUM M OF O F ART
Text Te
Text
K
GH
MADISON ST
Ttext Te Text Text Te Text
R YO
OU
ST
OR
TWIGGS ST
ST
SB
OR
S ST UND CAS YHO RS GRE ATION HTE FIG M ST S FIREUSEU N T BO AL S M B MB IB K G DER E ECO E POL LAKE DIIN NG FE HOUS EDG THOUS IL R R RT MBERAL BU IM U U T O O S ST C E C IGG E FED T W ARAG K ST E G ZAC S U A O P SE RTH TAM ER HOU COU EUSE AT NTY SE COURT X T NTY E R THE COUTHOU GS S COUDAPTIV NNE IG A R W A T COU
AY
LL
RB
T POSICE OFF
WILLIAM POE E GARAGE IS RT RK CU N PA O X I H
UNION STATION/ AMTRAK
CK
UNIVERSITY OF TAMPA
ARY
T
ER S
TYL
M
LK
CASS ST
HI
LEE ROY SELMON EXPRESSWAY
Existing Parking Areas
HA
RWA
LIBR
N ST RISO HAR
INN NCE TT IDE RES ARRIO BY M ARD RTY OTT COU ARRIO Y B M
TAMPA BAY PERFORMING G ARTS CENTER
RIVE
TAMPA PREPARATORY SCHOOL
ADAMO DR
CENTRAL PARK VILLAGE (Proposed Boundaries)
ROYAL ST
N MA HERASSEY M ARK P
2ND AVE
NU
FORTUNE ST
TAMPA WATERSPORTS CENTER
PERRY HARVEY SR. PARK
NEBRASKA AVE
MARION TRANSIT CENTER
ORANGE ST
RIVERFRONT PARK
N BOULEVARD
PARK K TRAMMELL TRAM TRA MM M MELL BUILDING BUI LLDING I
ST
JEFFERSON ST
REL
LAU
LAURELL STT
3RD AVE
SCOTT ST INDIA ST
LAUREL ST
17TH ST
KAY ST
4TH AVE
YBOR CHANNEL
LTON AV
E
KAY ST
E CAR
BLAKE HIGH SCHOOL GREEN ST
GOVERNOR ST
3RD AVE
Figure 7.2
5TH AVE
16TH ST
STETSON UNIVERSITY COLLEGE OF LAW
ESTELLE ST ESTELLE ST
15TH ST
ESTELLE ST
AVENIDA REPUBLICA DE CUBA
PIERCE ST
6TH AVE
TECO Streetcar Parking Areas
June 2007
Section 7.0 •
Establish an Advisory Board to assist HART with implementation of route modifications
•
Use existing Circulator Study Stakeholder Group members
•
Examine the City’s practices and policies on uses of parking garages − Revise city policies to make better use of existing parking facilities − Support mixed uses of parking garages/lots during non-peak times − Utilize Twiggs Street Garage at night for events − Allow utilization of under-used city-owned garages at night for employee parking (e.g Convention Center, Forum, Channelside)
•
Revise land development regulations for the Central Business District to be more transit and pedestrian friendly − Allow exceptions for parking and vehicular access − Reduce parking requirements for new development and redevelopment
7.5
•
Discuss with the City of Tampa: FDOT Commitment for a 2800-space parking garage at the future regional intermodal center near the Marion Transit Station.
•
Examine the efficacy of distributing City Parking Permits and how this might affect user convenience associated with circulator use
•
Work with the City of Tampa to create new transit-oriented land use categories, such as a Transit-Oriented Development designation and a Transit-Oriented Corridor designation as part of their Comprehensive Plan, Future Land Use Map Series. This will promote redevelopment along the City and County’s major transportation corridors and help spur mixed-use urban centers and mixed-use corridors.
•
Coordinate with City of Tampa for pedestrian-related improvements, especially where connections to Circulator bus stops, MTC or the Southern Transportation Plaza are concerned.
•
Maintain and establish standards that include universal design and ADA Guidelines
COORDINATION WITH CITYWIDE EFFORTS
It is important that citywide efforts promoting mobility and accessibility coordinate with each other and strive to achieve similar goals and objectives. These factors are outlined in various city plans and studies. The following list of city plans and studies highlights recommendations that can be applied to Tampa’s Downtown Circulator and/or should be considered in the implementation of the improved circulator systems.
7-9
Section 7.0 7.5.1
SOUTH CENTRAL BUSINESS DISTRICT SPECIAL EVENTS: MAINTENANCE OF TRAFFIC AND PARKING EVALUATION
7.5.1.1
Recommendations •
Encourage employers to boost employee transit use during events, particularly for employees working the events.
•
Develop remote employee parking lots with the use of shuttles to the event core area (St. Pete Times Forum/Marriott/Convention Center) during capacity events. This would become a significant issue as surface lots are redeveloped and parking supply is reduced.
•
Consider ways to promote transit to event patrons, such as vouchers or shuttle services from remote sites, or use of the City’s Electric Streetcar.
•
Eight high capacity parking garage locations- immediately adjacent to Crosstown Expressway (5 minute walk to Channelside and St. Pete Times Forum);
•
BUT, the value of land is so high, the City is unable to compete with land developers in buying the land to construct parking garages
7.5.2
DOWNTOWN TAMPA TRANSPORTATION VISION
7.5.2.1
Recommendations
Rely more on transit to provide access and circulation •
Include circulator trolley pass costs with monthly parking, building leases and condo association fees
•
Provide trolley service to remote parking
•
Designate a free or single fare zone for transit services within downtown
•
Increase service hours
•
Expand service locations
•
Market service
Improve transit circulation and expand transit facilities throughout downtown •
Improve the visibility and use of underutilized transit stops, signage, stop enhancements and postings of route numbers and schedules
7-10
Section 7.0 •
Connect buses, circulators, streetcar and other transit services to major destinations and each other
•
Establish signal priority or pre-emption on transit emphasis corridors to facilitate the progression of buses or trolleys
•
Adjust traffic signal timing along major access and egress routes serving downtown parking structures and lots to facilitate peak period traffic movements
Plan for future transit investments (2012) •
Study feasibility of double tracking the streetcar route or allow the streetcar to share lanes with vehicles
•
Coordinate with the FDOT Intermodal Center Master Plan to assess the needs of transportation agencies and governments
•
Coordinate state and regional passenger rail initiatives to examine the preservation of station sites that provide seamless intermodal transfers
•
Examine the preservation of bus rapid transit, high speed rail, and light rail corridors designated for preferred alternative alignments
7.5.3
7.6
ADDITIONAL EFFORTS •
City of Tampa Parking and Transportation Study
•
City of Tampa is underwriting 2,000- 2,500 parking spaces in downtown
•
HART Bus Stop Facility and Accessibility Study
•
Tampa Downtown Partnership Signage Program
•
Wayfinding and signage program should coordinate with Circulator system, as well as all HART services
•
Downtown Tampa Pedestrian Goals and Objectives
•
Ensure that this plan is consistent with the Vision Plan set forth by the City of Tampa and Tampa Downtown Partnership
FUNDING SCENARIOS
The following potential funding sources have been identified during the course of the study, through stakeholder meetings, focus group meetings or project team research. Due to the limited amount of funding available for the existing circulators, as outlined in the Circulator Work Plan, it is imperative to identify potential funding scenarios that can be implemented in the short-term
7-11
Section 7.0 (by 2008). Alternatively, some of the funding scenarios are more likely to require garnering of additional support or policy changes through the City of Tampa. The latter funding options may be more appropriate for long term service improvements (2012). The table below (Table 7.0) shows the potential funding mechanisms, along with the downtown group it targets, ease of implementation, as well as if it could be implemented in the short-term (by 2008), mid-term (between 2008 and 2012), or long-term (by 2012).
7-12
Section 7.0 TABLE 7.0 POTENTIAL FUNDING SCENARIOS
Group
RESIDENTS – Early and late hours
EMPLOYERS – Early hours
Short, Mid, or Long Term1
Mechanism
Contact
ShortTerm
Bus Passes for Residents
Various
MidTerm
Condo Association Fees
Various
MidTerm
Impact Fee on Initial Development
City of Tampa
LongTerm
Proportionate Fair Share on Initial Development
City of Tampa
LongTerm
Special Assessment District
City of Tampa
ShortTerm
Bus Passes for Employees
Various
MidTerm
Sponsorships
Various
Notes Condo associations buy passes in bulk and sell/give to residents. Revenues accrue to HART general fund. Potential Marketing Strategy: “Free shuttle to your area if you charge $20/month/condo and convey the revenues.” Capital expenditures only are eligible (vehicles, shelters). Broward County Transit-Oriented Transportation Concurrence Ordinance Model provides operating funds for a defined time period. See Additional Funding Options for more description. Employers buy passes in bulk and sell/give to employees. Revenues accrue to HART general fund, currently. Potential Marketing Strategy: “Free shuttle between sponsor area and satellite parking.”
Ease of Implementation Could be implemented today. Requires ongoing promotion. Medium – Requires market research for new service design and a new procedure for revenue collection. Possible; impact fees are under discussion by city council. Difficult; requires new level-ofservice standards in comprehensive plan Difficult; already used for streetcar Already implemented by some employers. Requires ongoing promotion. Medium – Requires market research for new service design and a new procedure for revenue collection.
7-13
Section 7.0 TABLE 7.0 (CONTINUED) POTENTIAL FUNDING SCENARIOS
Group
TOURISM AND EVENTS – Late hours
Short, Mid, or Long Term1
Mechanism
ShortTerm
Bus Passes for Conventioneer
Contact Convention Visitor’s Bureau/ Convention Center
MidTerm
Convention Fee
Convention Center
MidTerm
Room Fee
Hotels
MidTerm
MidTerm
Parking Surcharge
Private Sponsors2
Parking Operators
Various
Notes Organizers buy passes in bulk and sell/give to attendees. Revenues accrue to HART general fund. Potential Marketing Strategy: “Free shuttle to your area if you charge 25 cents/conventioneer/day and convey the revenues.” Potential Marketing Strategy: “Free shuttle to your area if you charge 50 cents/hotel room/day and convey the revenues.” Potential Marketing Strategy: “Free shuttle to your area if you charge 25 cents/hour or $10/month on parkers and convey the revenues.” If shuttle is not free/cheap, passes would have to be issued at each sponsoring garage. Potential Marketing Strategy: “Free shuttle to your area if you sponsor it.” See below for more. (Channelside, Lightning, St. Pete Times Forum, Convention Center, Tampa Bay Performing Arts Center)
Ease of Implementation Could be implemented today. Requires ongoing promotion. Medium – Requires market research for new service design and a new procedure for revenue collection. Medium – Requires market research for new service design and a new procedure for revenue collection. Medium – Requires market research for new service design and a new procedure for revenue collection. Medium – Requires market research for new service design and a new procedure for revenue collection. Also must coordinate with or replace service of existing sponsored shuttle services.
7-14
Section 7.0 TABLE 7.0 (CONTINUED) POTENTIAL FUNDING SCENARIOS
Group
STUDENTS – Early and late hours
Other Sources
Short, Mid, or Long Term1
Mechanism
ShortTerm
Bus Passes for Students
MidTerm
Fee on Course Hours or Activity Fee
UT, University of South Florida, Stetson Law
ShortTerm
On-Board/At Shelter Advertisements
Various
LongTerm
COT Parking Fund4
City of Tampa
LongTerm
Development Contribution in Lieu of Parking3
City of Tampa
Contact UT, University of South Florida, Stetson Law
Notes Schools buy passes in bulk and sell/give to students. Revenues accrue to HART general fund. Potential Marketing Strategy: “Free shuttle to your area if you charge $2.50/student credit hour/12-week term and convey the revenues.”
Ease of Implementation Could be implemented today. Requires ongoing promotion. Medium – Requires market research for new service design and a new procedure for revenue collection. Could be implemented today. Requires ongoing promotion.
Use parking revenues to pay for transit operating costs. See below for more. Currently must be spent on parking elsewhere. Probably limited to capital expenditures. See below for more.
Would need to change city policies. Would need to change land development code.
1
Short Term = funding available with the next five years Mid Term = funding available within five to 10 years Long Term = no funding source identified Private Sponsorships • Establish a mechanism by which an agency, outside of HART, could manage the operations of and handle the collection of bills associated with private sponsorships. Discuss this recommendation with the Tampa Downtown Partnership or Downtown Tampa Attractions Association. 3 COT Parking Fund • Construct peripheral parking and use revenues to offset operating costs of circulator system • Convert existing parking garages to incorporate retail on 1st floor − Use revenues from retail to support circulator service • Consider option of parking revenues swapping off between subsidizing parking and supporting transit operations • Future Implications: Use revenue from improved circulator service to leverage bond issue to assist in construction of additional fringe parking 4 Development contribution in-lieu fee of $4,300 • Contribute fee to circulator operating costs or to off-site parking garages With respect to the funding scenarios in which a specific user fee has been proposed (box highlighted in teal), the benefits to circulator users may include, but are not limited to the following: • Downtown free fare zone covering all participating destinations • Easy to use stops, route diagrams • Increased frequency, longer hours, some new geographic areas of service 2
7-15
Section 7.0
7.6.1
LONG-TERM FUNDING STRATEGY
The existing Downtown Channel District and Central Park Village CRAs generate tax revenue through Tax Increment Financing (TIFs). A portion of this revenue may be available to supplemental transit operational costs. 7.6.2
ADDITIONAL FUNDING OPTIONS
Additional funding options, proposed by project team, stakeholder and focus group members are listed below. Each of the funding options listed below are categorized by type and the applicability of each option will likely depend on circumstances at the time of implementation. 7.6.2.1
Tax Options
Local Option Sales Tax County governments are authorized to levy a variety of local discretionary sales surtaxes. For example, Miami-Dade County, through voter referendum, passed a ½ cent sales tax benefiting county and city transit and transportation needs. These funds are used as a local match to federal and state dollars and for issuing bonds. In addition, the county established an independent committee to oversee the expenditure of the ½ cent sales tax funds and ensure that the goals and objectives of the “People’s Transportation Plan” was carried out. Charter County Transit System Surtax Also, as Hillsborough County is a charter county, they have the authority to levy a separate Charter County Transit System Surtax. The levy is subject to a charter amendment or approval of the surtax in a countywide referendum. While surtax funds are generally used for capital costs associated with construction and development of rapid transit systems and bus systems, the tax can also be used for planning and operation of transit and transportation projects (as defined in 125.011(1) Florida Statues). At least 75 percent of the funds must be used for transit projects, including bus projects. 7.6.2.2
Federal Grants
The federal government is often an important partner with local governments on public transportation projects, but major transit investments require a long-term commitment on the part of the local government. The following federal grants are worth considering, however it is important to keep in mind that federal dollars are in high-demand, limited and over committed.
7-16
Section 7.0 The Federal Transit Administration’s Urban Formula Grants and Bus and Bus Facilities Program provide a source of funding for transit projects. Additionally, flexible funding provisions under SAFETEA-LU include funds from the Federal Highway Administration’s Surface Transportation Program (STP), National Highway System (NHS), and Transportation, Community, and System Preservation (TCSP). Through these programs, FHWA funds can be transferred to FTA for transit purposes. 7.6.2.3
Federal Transit Administration (FTA) Grants
FTA Urbanized Area Formula Grants (Section 5307) •
Transit capital and planning assistance to urbanized areas with populations over 50,000 and operating assistance to areas with populations of 50,000 – 200,000.
•
In a Transportation Management Area, the MPO may elect to transfer portions of its FTA Section 5307 (Urbanized Area Formula Grants) funds that cannot be used for operating assistance to FHWA for highway projects subject to the requirements of 49 U.S.C. 5307 (b)(2).
Bus and Bus Facilities (Sections 5309, 5318) This Federal Transit Authority grant program provides capital assistance for replacement of buses and related equipment and facilities, as well as new buses and facilities. Projects of interest to the Circulator Study and that are eligible under this program include: acquisition of buses for service expansion, park-and-ride stations, acquisition of replacement vehicles, passenger amenities such as passenger shelters and bus stop signs, bus malls, and transportation centers. Eligible recipients include transit authorities and other state and local public bodies and agencies. Once funds are appropriated, they remain available for three years. 7.6.2.4
Federal Highway Administration (FHWA) Programs
Surface Transportation Program (STP) (23 U.S.C. 133) •
Construction, reconstruction, rehabilitation, resurfacing, restoration, and operational improvements for highways and bridges including construction or reconstruction necessary to accommodate other transportation modes.
•
Capital costs of transit projects that are eligible under Ch. 53 of 49 U.S.C., including vehicles and facilities, publicly or privately owned, that are used to provide intercity bus service; carpool projects and fringe and corridor parking facilities; transit safety infrastructure improvements and programs; transit research, development and technology transfer; surface transportation planning programs; public transportation management systems under 23 U.S.C. 303
7-17
Section 7.0 •
Up to 50 percent of the STP funds may be transferred to NHS, CMAQ, HSIP, IM, RTP and/or HBRRP except that funds suballocated under 23 U.S.C. 133 (d)(3) for use in areas of a State may not be transferred to other 23 U.S.C. programs
•
May be transferred to FTA for transit projects eligible for STP funds under 23 U.S.C. 133 (b)
Surface Transportation Program Transportation Enhancements Set-aside (TE) (23 U.S.C. 133 (d)(2)) •
12 specific activities included in the definition of Transportation Enhancement Activities in 23 U.S.C. 101 (a)(35). Although transit is not specifically mentioned in the list of 12 eligible TE activities, some of the eligible TE activities benefit transit.
•
May be transferred to FTA for transit projects eligible for TE projects that benefit transit
National Highway System (NHS) (23 U.S.C. 103) •
Improvements to rural and urban roads that are part of the NHS or that are NHS Intermodal connectors. Transit improvements within a NHS corridor, subject to statutory conditions set in 23 U.S.C. 103 (b)(6)(C); transportation planning in accordance with 23 U.S.C. 134 and 135; fringe and corridor parking facilities; carpool and vanpool projects; public transportation management systems under 23 U.S.C. 303; publicly owned intracity and intercity bus terminals.
•
May be transferred to FTA for transit projects eligible for NHS funds under 23 U.S.C. 103 (b)(6).
Transportation, Community, and System Preservation Program (TCSP) (S-LU Sec. 1117, formerly TEA-21 Sec. 1221) •
Provides funding for a comprehensive program to facilitate the planning, development, and implementation of strategies to integrate transportation, community and system preservation plans and practices that: − Improve the efficiency of the transportation system of the U.S. − Reduce the impacts of transportation on the environment − Reduce the need for costly future investments in public infrastructure − Provide efficient access to jobs, services and centers of trade − Examine community development patterns and identify strategies to encourage private sector development
7-18
Section 7.0 •
Transit projects that meet the purpose of the TCSP that are: − Eligible under Title 49 U.S.C., Ch. 53 − Transit activities relating to TCSP that the Secretary determines to be appropriate, including corridor preservation activities that are necessary to implement (a) Transit-oriented development plans, (b) traffic calming measures, or (c) other coordinated TCSP practices.
•
7.6.2.5
May be administered by FTA; although TCSP funds cannot be transferred, they may be allocated to FTA for eligible transit projects. Florida Department of Transportation’s (FDOT) Transit Corridor Program
This program provides some funding for projects that prove to meet the goals of managing congestion and increasing capacity in a corridor. Fund allocation is formula based and existing projects are prioritized over new projects. Local partnership with FDOT is essential, with or without federal funding. 7.6.2.6
Other
Other means of creative financing may be available or could be created to assisting in the funding of the Circulator System. Parking Bank •
Allow developers to donate the value of parking spaces to the City for use in the construction of high density, regional parking structures. Utilize a portion of the revenue from these structures to fund the system.
Transportation Surcharge •
7.6.3
A small fee could be applied to hotel rooms, event tickets, convention registration fees, and/or restaurant/bar bills and applied to operational costs of the Circulator. CIRCULATOR OPERATING PLAN
Two bus circulator routes have been identified within Downtown Tampa for the nearterm period. These bus circulators are designed to replace the existing In-Town Trolley routes 96 and 98. Following is a description of each of the proposed bus circulator routes. The North-South Circulator is designed to serve the core of Downtown Tampa providing service that extends from the TECO Line Streetcar System to I-275. The second route is designed to serve special events and provide visitor and local resident circulation during evening events.
7-19
Section 7.0 HART is proposing the elimination of Route 98 based upon poor patronage performance and duplication of services from other fixed routes. This recommendation from HART is independent of this study and its recommendations. 7.6.3.1
North-South Circulator
The North-South Circulator provides weekday service along the Florida Avenue and Tampa Street corridor between Harbour Island and I-275 on the north side of Downtown Tampa. This route begins on Harbour Island along Knights Court providing service to Beneficial Drive and Harbour Place Drive, continuing west to Harbour Island Boulevard. Service continues north along Harbour Island Boulevard / Franklin Street, east on Channelside Drive, north on Florida Avenue, east on Cass Street and north on Marion Street to Kay Street, serving the Marion Street Transit Center along the way. This route then travel west on Kay Street, returning south along Tampa Street, east on Whiting Street, south on Franklin Street / Harbour Island Boulevard, east on Knights Court to Beneficial Drive. Both the northbound and southbound travel patterns serve the Southern Transportation Center and the existing end-of-line for the TECO Line Streetcar System. 7.6.3.2
Event Circulator
The Event Circulator provides Friday and Saturday evening service as well as service on other event days, between the Channelside District and the Tampa Bay Performing Arts Center. This route begins at the Shops at Channelside, travels west along Channelside Drive, northwest / north along Brorein Street and Jefferson Street, west along Whiting Street, north on Florida Avenue, west on Tyler Street and north on W.C. Mac Innes Place to the Tampa Bay Performing Arts Center. Southbound, this route proceeds east on Fortune Street, south on Ashley Drive, east on Cass Street, south on Tampa Street, east on Whiting Street, south on Morgan Street, and east along Channelside Drive returning to the Shops at Channelside. 7.6.3.3
Service Plan Assumptions / Characteristics
Bus circulator operating plans have been developed using assumptions related to vehicle performance and travel times, service periods, days of service operation and service levels. The first step in the development of the bus circulator operating plans involves the estimate of bus travel times along the course of the designed route alignments. 7.6.3.4
Circulator Travel Times and Service Frequencies
Travel times were estimated using typical transit coach performance, including vehicle acceleration and deceleration, bus dwell times at stop locations and traffic signal delays
7-20
Section 7.0 along the given route alignment. proposed routes:
Following are roundtrip travel times for the two
•
North-South Circulator: 27 minutes and 20 seconds or rounded to 27 minutes
•
Event Circulator: 25 minutes and 9 seconds, or rounded to 25 minutes
Service frequencies can be optimized for each circulator route based on roundtrip travel times. Preferred peak period service frequencies for each circulator were identified as 10 to 15 minutes. Optimization of service frequencies involves the determination of a service frequency that is divisible into a routes cycle time. Cycle time is defined as the roundtrip travel time (in-service) plus layover time at the end (or both ends) of the route to ensure on-time performance (i.e., make up time lost through running behind schedule) and provide vehicle operator recovery time (e.g., restroom breaks). Layover time is typically a minimum of 15 percent of the travel time, plus additional time required to generate a cycle time divisible by the preferred service frequency. Service frequency for the North-South Circulator was determined in the following manner: •
Peak Periods: Roundtrip Travel Time (27 minutes) * minimum 15 percent layover time (4 minutes) plus additional time (5 minutes) required for a cycle time divisible by the preferred peak period service frequency (10-15 minutes, used 12 minutes) = a total cycle time of 36 minutes / 12 minute frequencies = 3 buses
•
Non-Peak Periods: Roundtrip Travel Time (27 minutes) * minimum 15 percent layover time (4 minutes) plus additional time (5 minutes) required for a cycle time divisible by the preferred non-peak period service frequency (1530 minutes, used 18 minutes) = a total cycle time of 36 minutes / 18 minute frequencies = 2 buses
Service frequency for the Event Circulator was determined in the following manner: •
Peak Periods: Roundtrip Travel Time (25 minutes) * minimum 15 percent layover time (4 minutes) plus additional time (1 minute) required for a cycle time divisible by the preferred peak period service frequency (10-15 minutes, used 10 minutes) = a total cycle time of 30 minutes / 10 minute frequencies = 3 buses
•
Non-Peak Periods: Roundtrip Travel Time (25 minutes) * minimum 15 percent layover time (4 minutes) plus additional time (1 minute) required for a cycle time divisible by the preferred non-peak period service frequency (30 minutes) = a total cycle time of 30 minutes / 30 minute frequencies = 1 buses
7-21
Section 7.0 7.6.3.5
Service Characteristics
The following table identifies service periods, service frequencies and days of service assumed for each Downtown Tampa circulator route. The North-South Circulator route is proposed to operate on weekdays only between 6:30 a.m. and 6:30 p.m. at 12 minute frequencies during peak periods and 18 minute frequencies during non-peak periods. The Event Circulator is proposed to operate on Friday and Saturday evenings from 6:30 p.m. to 2:00 a.m. as well as during other special event times (i.e., scheduled for other days of the week). The Event Circulator is proposed to operate at 10 minute frequencies during peak periods and 30 minutes during non-peak periods. Consistent with HART costing assumptions, 253 weekdays per year are assumed, 59 Saturdays and an additional 59 special event days are assumed.
Circulator Route Peak North-South Circulator
Service Periods 6:30 a.m. – 9:00 a.m., 11:30 a.m. – 1:30 p.m., and 4:00 p.m. – 6:30 p.m.
Base
9:00 a.m. – 11:30 a.m., and 1:30 p.m. - 4:00 p.m. 6:30 p.m. – 8:00 p.m., and 12:00 a.m. – 2:00 a.m. 8:00 p.m. 12:00 a.m.
Peak Event Circulator Base
7.6.3.6
Service Frequencies
Days of Service
12 minute
Weekdays Only
18 minute
10 minutes
30 minutes
Fridays, Saturdays an Special Event Days
Operating Requirements
Operating requirements for the North-South Circulator and the Event Circulator were developed using the service characteristics described above. Operating requirements include peak and fleet vehicles, annual bus-miles, and annual bus hours. The followining tables identify operating requirements for the two circulators. North-South Circulator From
To
Harbour Island Kay Street
Day
Headway Peak Base Eve.
M-F
12
18
0
E/L 0
Vehicles Peak Total 3
4
Annual Bus-Miles Bus-Hrs 49,383
7,819
NOTES: (1) Operating hours assume 12 hour span of service on weekdays only. (2) Calculated total fleet = peak vehicle requirement * 1.2 (20% spare ratio). (3) Annual Revenue Bus-Hours include layover time. (4) Roundtrip layover time includes sufficient time at each end-of-line to provide for schedule recovery
(layover Time =minimum 15% of cycle time).
7-22
Section 7.0
Event Circulator From
To
Channelside
T.B. Perf. Arts Center
Day
Headway Peak Base Peak Eve. Eve.
F Spec. Sat
n/a n/a n/a
ESTIMATED ANNUAL TOTALS:
10 10 10
30 30 30
Vehicles
Annual
E/L
Peak
Total
Bus-Miles
Bus-Hrs
n/a n/a n/a
3
4
5,030 5,030 5,030
856 856 856
3
4
15,091
2,567
NOTES: (1) Operating hours assume 7.5 hour span of service on Fridays, Saturdays and Other Special Event Days. (2) Calculated total fleet = peak vehicle requirement * 1.2 (20% spare ratio). (3) Annual Revenue Bus-Hours include layover time. (4) Roundtrip layover time includes sufficient time at each end-of-line to provide for schedule recovery
(layover Time =minimum 15% of cycle time).
7.6.3.7
Annual Operating Costs
Annual operating costs were estimated using HARTline FY 2008 Marginal Cost Allocated 3 Variable Cost Model. Annual costs are based on a 3-part marginally allocated formula for Fiscal Year 2008. The following tables identify annual operating costs for the North-South Circulator and the Event Circulator.
7-23
Section 7.0
North-South Downtown Tampa Circulator FY2008 Marginal Cost Estimate FY2008 Marginal Allocated 3 Variable Cost Model
Weekdays Saturday Sunday
Days 253 59 50
Vehicle Hours Vehicle Miles Daily Hours Hour Rate Daily Miles Mile Rate Vehicles 30.91 $28.71 195.2 $1.56 3 0 $28.71 0 $1.56 0 0 $28.71 0 $1.56 0
Peak Vehicles Vehicle Rate
Total $12,336.24 $338,569.05 $2,876.83 $0.00 $2,437.99 $0.00 Estimated Gross Annual Operating Cost: $338,569.05
Downtown Tampa Event Circulator FY2008 Marginal Cost Estimate FY2008 Marginal Allocated 3 Variable Cost Model
Fridays Saturday Spec Events
Days 59 59 59
Vehicle Hours Vehicle Miles Peak Vehicles Daily Vehicle Hours Hour Rate Daily Miles Mile Rate Vehicles Rate Total 14.5 $28.71 85.3 $1.56 3 $2,876.83 $41,042.91 14.5 $28.71 85.3 $1.56 0 $2,876.83 $32,412.42 14.5 $28.71 85.3 $1.56 0 $2,876.83 $32,412.42 Estimated Gross Annual Operating Cost: $105,867.74
7-24
APPENDIX A Hart Profile Reports: Route 96 and Route 98
APPENDIX B Market Analysis Technical Memorandum
Market Analysis Technical Memorandum Table of Contents & Figures 1.0
INTRODUCTION.........................................................................................1
2.0
VENUE ATTENDANCE AND U OF T ENROLLMENT STATISTICS .........2 Figure 2.0, Downtown Venues and the University of Tampa ...................3
3.0
DOWNTOWN TRAVEL PATTERNS ..........................................................4
3.1
METHODOLOGY .............................................................................................4 Figure 3.1a, Representative Traffic Analysis Zones ................................4 Figure 3.1b, Travel Desire (“Spider”) Network .........................................5 HOME-BASED WORK (HBW) TRAVEL..............................................................6 Figures 3.2a, 3.2b and 3.2c Year 2008 & 2012 HBW Person-Trip Productions / Change....................6 Figures 3.2d, 3.2e and 3.2f Year 2008 & 2012 HBW Person-Trip Attractions / Change......................8 Figures 3.3a & 3.3b HBW Person-Trip Productions and Attractions ......................................10 Figures 3.3c & 3.3d HBW Travel Desire Assignment Results................................................10 HOME-BASED SHOPPING (HBSHOP) TRAVEL ...............................................12 Figures 3.4a, 3.4b and 3.4c Year 2008 & 2012 HBSHOP Person-Trip Productions / Change...........12 Figures 3.4d, 3.4e and 3.4f Year 2008 & 2012 HBSHOP Person-Trip Attractions / Change.............14 Figures 3.5a & 3.5b HBSHOP Person-Trip Productions and Attractions ...............................15 Figures 3.5c & 3.5d HBSHOP Travel Desire Assignment Results.........................................16 HOME-BASED SOCIAL & RECREATIONAL (HBS&R) TRAVEL ............................17 Figures 3.6a, 3.6b and 3.6c Year 2008 & 2012 HBS&R Person-Trip Productions / Change..............17 Figures 3.6d, 3.6e and 3.6f Year 2008 & 2012 HBS&R Person-Trip Attractions / Change................19 Figures 3.7a & 3.7b HBS&R Person-Trip Productions and Attractions ..................................21 Figures 3.7c & 3.7d HBS&R Travel Desire Assignment Results............................................22 HOME-BASED MISCELLANEOUS (HBMISC) TRAVEL .......................................23 Figures 3.8a, 3.8b and 3.8c Year 2008 & 2012 HBMISC Person-Trip Productions / Change ............23
3.2
3.3
3.4
3.5
3.6
4.0
Figures 3.8d, 3.8e and 3.8f Year 2008 & 2012 HBMISC Person-Trip Attractions / Change ..............24 Figures 3.9a and 3.9b HBMISC Person-Trip Productions and Attractions ................................26 Figures 3.9c & 3.9d HBMISC Travel Desire Assignment Results ..........................................27 NON-HOME-BASED (NHB) TRAVEL ...............................................................28 Figures 3.10a, 3.10b and 3.10c Year 2008 & 2012 NHB Person-Trip Productions / Change ..................28 Figures 3.10d, 3.10e and 3.10f Year 2008 & 2012 NHB Person-Trip Attractions / Change ....................30 Figures 3.11a and 3.11b NHB Person-Trip Productions and Attractions.......................................32 Figures 3.11c & 3.11d NHB Travel Desire Assignment Results ................................................33 DOWNTOWN TRIP ATTRACTIONS ........................................................34 Figure 4.1 HBW External to Internal Work Trip Attractions ....................34 Figure 4.2 HBSHOP External to Internal Work Trip Attractions .............35 Figure 4.3 HBS&R External to Internal Work Trip Attractions ................36 Figure 4.4 HBMISC External to Internal Work Trip Attractions ..............36 Figure 4.5 NHB External to Internal Work Trip Attractions.....................37
1.0
Introduction
The purpose of the Tampa Downtown Circulator Study is to explore strategies to enhance the current downtown/in-town circulators. This report offers statistics for Downtown venues and the University of Tampa, as well as an assessment of travel markets in the Downtown. It merits some mention that these analyses, as scoped, were to examine the following: ♦ ♦ ♦ ♦ ♦ ♦ ♦ ♦ ♦ ♦
Persons who live downtown and work downtown Persons who live downtown and want to use transit to get around Persons who work downtown and seek daytime services Persons who work downtown and utilize satellite parking Persons who come to events downtown Persons who ride transit into downtown Persons with evening work shifts Convention participants Students Event participants and tourists
However, most of the bulleted items above involve unique travel markets. To fully assess the travel characteristics of these markets as they pertain to public transportation (e.g., income, trip origins, destinations, trip lengths, volumes, modal choices, parking, costs, etc.), survey data is essential. Recent survey data is either non-existent or unavailable. As such, much of the analysis in this report is based on travel patterns from the Hillsborough MPO’s travel demand model. The initial section of the report offers a listing of attendance for special venues in the Downtown. Subsequent sections present the model-based analyses by the model’s trip purposes including: ♦ ♦ ♦ ♦ ♦
Home-Based Work (HBW), Home-Based Shopping(HBSHOP), Home-Based Social & Recreational(HBS&R), Home-Based Miscellaneous (HBMSC), and Non-Home-Based (NHB).
Other studies and data reviewed as part of these analyses include: ♦ Results of the Uptown-Downtown Connector (Route 96) Survey of riders and non-riders, conducted by the Tampa Downtown Partnership in 2003; ♦ Results of the Route 96 and Route 98 On-Board Survey, conducted by HART in May 2005; ♦ Data from the Tampa Downtown Partnership, including residential developments and parking facilities; ♦ The Downtown Tampa Access Study; ♦ The Downtown Tampa Transportation Vision Plan; and ♦ Strategies for an Intra-Urban Circulator System. March 2007
Tampa Downtown Circulator Study Market Analysis Tech Memo
1
2.0
Venue Attendance and U of T Enrollment Statistics
Figure 2.0 show the location of seven special venues in and around Downtown Tampa, as well as the University of Tampa U of T. Attendance and enrollment statistics for U of T appear in the table below Figure 2.0. The attendance statistics were assembled from the Tampa Chamber of Commerce website; while similarly, U of T statistics were obtained from their website. By far the largest attendance is the Ybor City activity center which attracts some 3 million visitors annually. The St. Pete Times Forum attracts some 1.5 million persons annually from around the region. U of T’s website suggests an enrollment of 5,300 students. 65% of those students are full-time, while 70% are said to live on-campus. In addition, U of T indicates parking spaces accommodate 2,500 automobiles.
March 2007
Tampa Downtown Circulator Study Market Analysis Tech Memo
2
Figure 2.0 Tampa Downtown Circulator Downtown Venues and the University of Tampa
Map Key 1
Tampa Bay Performing Arts Center
2
Tampa Museum of Art
3
Channelside Shops
Annual Attendance 634,000 81,000 1.0 million (est.)
4
Florida Aquarium
5
Ybor City
3.0 million
6
St Pete Times Forum
1.5 million
7
Convention Center
303,000
Cruise Passengers
812,000
8
March 2007
Downtown Venues
600,000
University of Tampa 5,300 Students 65% full-time 70% live on-campus 2,500 parking spaces
Tampa Downtown Circulator Study Market Analysis Tech Memo
3
3.0
Downtown Travel Patterns
This section offers a review of potential travel patterns in Downtown Tampa. The analysis examines travel desire in Downtown Tampa, based in part on interpolated distribution patterns from the Hillsborough MPO’s travel demand model. The section begins with a brief discussion of the methods used to carryout the analysis. Trailing subsections correspond to the model’s five trip purposes in the presentation of results. 3.1
Methodology
The initial step was to define a set of traffic analysis zones (TAZs) that best fit the area of the Tampa Downtown Circulator Study. This study area is depicted in Figure 3.1a. In general, the TAZs are bounded by Channelside areas to the south, I- 4 and Columbus Drive to the north, 22nd Street to the east and North Boulevard to the west. Figure 3.1a Tampa Downtown Circulator Representative Traffic Analysis Zones
Source: Hillsborough County MPO
March 2007
Tampa Downtown Circulator Study Market Analysis Tech Memo
4
The next step was to construct a travel desire network (Figure 3.1b). Sometimes called a “spider” network, it is essentially a collection of travel desire lines (i.e., links) connecting the centers of TAZs. After the network is assembled, trips are projected or assigned to the network to provide a visual albeit general understanding of trip exchanges between zones. Figure 3.1b Tampa Downtown Circulator Travel Desire (“Spider”) Network
In addition to providing shapefiles for the TAZ boundaries, the Hillsborough MPO also provided Year 2000 and 2025 person trip tables from the region’s travel demand model. These tables contain estimates of the number of persons traveling between TAZs on a typical weekday for the following trip purposes: ♦ ♦ ♦ ♦ ♦
Home-Based Work (HBW), Home-Based Shopping(HBSHOP), Home-Based Social & Recreational(HBS&R), Home-Based Miscellaneous (HBMSC), and Non-Home-Based (NHB).
A couple of pre-processing steps were necessary before the trip tables could be assigned to the travel desire network. In the first step, trip values were computed March 2007
Tampa Downtown Circulator Study Market Analysis Tech Memo
5
to the years 2008 and 2012 by interpolation. The next step was to isolate and extract trips for the collection of TAZs used to represent the Downtown. Together, these steps yielded Downtown tables (i.e., matrices) of daily person trips for the years 2008 and 2012. The Downtown trip tables were then assigned to the travel desire networks. Single-iteration assignments and coequal link coding were used to ensure results were essentially unimpeded. More succinctly, the assignment network is a system of travel desire lines not streets and the aim in making these assignments was simply to show the basis of travel desire. This as opposed to the typical highway assignment, which aims to determine route choices, based on travel time and available capacity. Results from the assignments were then reassembled with GIS software to illustrate travel desire in the Downtown. Additionally, trip production and attraction volumes were mapped for the downtown study area. The following sections present these results in terms of the regional model’s five trip purposes (i.e., HBW, HBSHOP, HBS&R, HBMISC and NHB). 3.2
Home-Based Work (HBW) Travel
Home-Based Work production and attraction trip volumes were determined for each on the zones within the defined downtown study area for 2008 and 2012. A comparison of 2008 and 2012 production and attraction trip volumes reflects trip growth within the study area on a zone level basis. Figures 3.2a through 3.2f illustrate these trip volumes based on the downtown zonal structure, and identifies the difference in trip volumes between year 2008 and 2012. Figures 3.2a, 3.2b and 3.2c Tampa Downtown Circulator Year 2008 & 2012 HBW Person-Trip Productions / Change
March 2007
Tampa Downtown Circulator Study Market Analysis Tech Memo
6
Figure 3.2a - 2008 HBW Person-Trip Productions
Figure 3.2b - 2012 HBW Person-Trip Productions
March 2007
Tampa Downtown Circulator Study Market Analysis Tech Memo
7
Figure 3.2c - Difference between 2008 & 2012 HBW Person-Trip Productions
Figures 3.2d, 3.2e and 3.2f Tampa Downtown Circulator Year 2008 & 2012 HBW Person-Trip Attractions / Change Figure 3.2d - 2008 HBW Person-Trip Attractions
March 2007
Tampa Downtown Circulator Study Market Analysis Tech Memo
8
Figure 3.2e - 2012 HBW Person-Trip Attractions
Figure 3.2f - Difference between 2008 & 2012 HBW Person-Trip Attractions
Respectively, Figures 3.3a and 3.3b summarize HBW trip productions and attractions for Downtown Tampa. On the production or residential side (Fig. 3.3a), year 2008 productions total 9,926 and grow to 12,573 (+27%) in the year 2012. Some 4,158 (42%) of the year 2008 work productions are expected to both begin and end within Downtown Tampa. On the attraction or employee side (Fig. 3.3b), work attractions for 2008 and 2012 are estimated to be 119,423 and 132,909 respectively. This represents an March 2007
Tampa Downtown Circulator Study Market Analysis Tech Memo
9
11% increase over the 4-year period or roughly a 3% per year rate of growth. The percentage of work trips that begin and end in the Downtown is about 4% of the total attractions in both years. Figures 3.3a & 3.3b Tampa Downtown Circulator HBW Person-Trip Productions and Attractions Figure 3.3a
Figure 3.3b
Downtown Trip Productions
Downtown Trip Attractions 135,000
14,000 12,000
8,000
125,000
Within the Downtown
8 4,15
Downtown to Elsewhere
6,000
Within the Downtown 120,000 4,15
8
115,000
4,000 2,000
0 4,95
130,000
0 4,95
10,000
8 5,76
127,9
58
Elsewhere to the Downtown
3 7,62 110,000
0
65 115,2
105,000
Y2008
Y2012
Y2008
Y2012
Results from the travel desire assignments appear in Figures 3.3c and 3.3d, for the years 2008 and 2012 respectively. As was mentioned previously, these results reflect only those HBW trips that begin and end within the zones representing the Downtown (yellow area). As noted in the previous charts, the total number of daily HBW trips within in the Downtown is 4,158 for year 2008 and 4,950 for year 2012. The largest concentration of travel desire occurs between the Ybor City area and the heart of Downtown. Figures 3.3c & 3.3d Tampa Downtown Circulator HBW Travel Desire Assignment Results
March 2007
Tampa Downtown Circulator Study Market Analysis Tech Memo
10
Figure 3.3c – Year 2008
Figure 3.3d – Year 2012
March 2007
Tampa Downtown Circulator Study Market Analysis Tech Memo
11
3.3
Home-Based Shopping (HBSHOP) Travel
Home-Based Shopping production and attraction trip volumes were determined for each on the zones within the defined downtown study area for 2008 and 2012. A comparison of 2008 and 2012 production and attraction trip volumes reflects trip growth within the study area on a zone level basis. Figures 3.4a through 3.4f illustrate these trip volumes based on the downtown zonal structure, and identifies the difference in trip volumes between year 2008 and 2012. Figures 3.4a, 3.4b and 3.4c Tampa Downtown Circulator Year 2008 & 2012 HBSHOP Person-Trip Productions / Change Figure 3.4a - 2008 HBSHOP Person-Trip Productions
March 2007
Tampa Downtown Circulator Study Market Analysis Tech Memo
12
Figure 3.4b - 2012 HBSHOP Person-Trip Productions
Figure 3.4c - Difference between 2008 & 2012 HBSHOP Person-Trip Productions
March 2007
Tampa Downtown Circulator Study Market Analysis Tech Memo
13
Figures 3.4d, 3.4e and 3.4f Tampa Downtown Circulator Year 2008 & 2012 HBSHOP Person-Trip Attractions / Change Figure 3.4d - 2008 HBSHOP Person-Trip Attractions
Figure 3.4e - 2012 HBSHOP Person-Trip Attractions
March 2007
Tampa Downtown Circulator Study Market Analysis Tech Memo
14
Figure 3.4f - Difference between 2008 & 2012 HBSHOP Person-Trip Attractions
Figure 3.5a summarizes productions and Figure 3.5b summarizes attractions, respectively for HBSHOP trips in the Downtown study area. On the production side (Fig. 3.5a), year 2008 has a total of 14,030. That value grows to 16,885 (+20%) in the year 2012. Some 5,215 (59%) of the year 2008 shopping productions are expected to both begin and end within Downtown Tampa. On the shopping attraction side (Fig. 3.5b), total attractions for 2008 and 2012 are estimated to be 45,834 and 52,644 respectively. This represents a 15% increase over the 4-year period or nearly a 4% per year rate of growth. The percentage of shopping trips that begin and end in the Downtown is expected to be about 12% of the total attractions in both years. Figures 3.5a & 3.5b Tampa Downtown Circulator HBSHOP Person-Trip Productions and Attractions Figure 3.5a
Figure 3.5b Downtown Trip Attractions
Downtown Trip Productions
60,000
18,000 16,000
6,32
50,000
14,000 12,000 10,000
4 6,32 40,000
5 5,21
Downtown to Elsewhere
4,000
5 8,81
62 10,5
Within the Downtown 30,000 20,000
4
9 0,61
46,3
20
Elsewhere to the Downtown
10,000
2,000 0
0
Y2008
March 2007
4
5
Within the Downtown
8,000 6,000
5,21
Y2012
Y2008
Tampa Downtown Circulator Study Market Analysis Tech Memo
Y2012
15
Results from the travel desire assignments for the HBSHOP trip purpose appear in Figures 3.5c and 3.5d, years 2008 and 2012 respectively. As noted in the previous charts, the number of daily HB shopping trips within in the Downtown is estimated as 5,215 for year 2008 and 6,324 for year 2012. Results suggest ample shopping travel occurs across Florida and Nebraska Avenues in an exchange with the Ybor City area. Desire lines extending from the University of Tampa area suggest a considerable number of daily shoppers travel north and south along the western edge of the study area as well as to and from the heart of the Downtown. Figures 3.5c & 3.5d Tampa Downtown Circulator HBSHOP Travel Desire Assignment Results Figure 3.5c – Year 2008
March 2007
Tampa Downtown Circulator Study Market Analysis Tech Memo
16
Figure 3.5d – Year 2012
3.4
Home-Based Social & Recreational (HBS&R) Travel
Home-Based Social and Recreational production and attraction trip volumes were determined for each on the zones within the defined downtown study area for 2008 and 2012. A comparison of 2008 and 2012 production and attraction trip volumes reflects trip growth within the study area on a zone level basis. Figures 3.6a through 3.6f illustrate these trip volumes based on the downtown zonal structure, and identifies the difference in trip volumes between year 2008 and 2012. Figures 3.6a, 3.6b and 3.6c Tampa Downtown Circulator Year 2008 & 2012 HBS&R Person-Trip Productions / Change
March 2007
Tampa Downtown Circulator Study Market Analysis Tech Memo
17
Figure 3.6a - 2008 HBS&R Person-Trip Productions
Figure 3.6b - 2012 HBS&R Person-Trip Productions
March 2007
Tampa Downtown Circulator Study Market Analysis Tech Memo
18
Figure 3.6c - Difference between 2008 & 2012 HBS&R PersonTrip Productions
Figures 3.6d, 3.6e and 3.6f Tampa Downtown Circulator Year 2008 & 2012 HBS&R Person-Trip Attractions / Change Figure 3.6d - 2008 HBS&R Person-Trip Attractions
March 2007
Tampa Downtown Circulator Study Market Analysis Tech Memo
19
Figure 3.6e - 2012 HBS&R Person-Trip Attractions
Figure 3.6f - Difference between 2008 & 2012 HBS&R Person-Trip Attractions
Respectively, Figures 3.7a & 3.7b summarize the productions and attractions for HBS&R trips in the Downtown study area. Year 2008 HBS&R productions (Fig. 3.7a) total 5,758 and grow to 7,393 in the year 2012, an increase of 28%. S&R travelers that are expected to begin and end their trips within the Downtown amount to 1,525. This represents some 26% of the HBS&R travel market on a typical day in the year 2008. On the attraction side (Fig. 3.7b), HBS&R attractions are estimated to be 17,421 and 21,365 for the respective years 2008 and 2012.
March 2007
Tampa Downtown Circulator Study Market Analysis Tech Memo
20
This represents a 23% increase over the 4-year period or nearly a 6% annual growth rate. Figures 3.7a & 3.7b Tampa Downtown Circulator HBS&R Person-Trip Productions and Attractions Figure 3.7a
Figure 3.7b
Downtown Trip Productions
Downtown Trip Attractions 25,000
8,000 7,000 1,885
6,000 5,000
1,52
5
4,000 3,000 2,000
4,23
3
5,508
5 1,88
20,000 1,525
Within the Downtown
15,000
Downtown to Elsewhere
10,000
Within the Downtown
6 15,89
0 19,48
Elsewhere to the Downtown
5,000
1,000 0
0
Y2008
Y2012
Y2008
Y2012
For the HBS&R trip purpose, results from the year 2008 and 2012 travel desire assignments appear respectively in Figures 3.7c and 3.7d. The universe of daily trips for this HBS&R travel market (i.e., HBS&R travelers within in the Downtown) is estimated as being 1,525 in the year 2008 and 1,885 in the year 2012. Results suggest HBS&R travel desire is mostly concentrated between Ybor City and the heart of Downtown Tampa.
March 2007
Tampa Downtown Circulator Study Market Analysis Tech Memo
21
Figures 3.7c & 3.7d Tampa Downtown Circulator HBS&R Travel Desire Assignment Results Figure 3.7c – Year
Figure 3.7d – Year
March 2007
Tampa Downtown Circulator Study Market Analysis Tech Memo
22
3.5
Home-Based Miscellaneous (HBMISC) Travel
Home-Based Miscellaneous production and attraction trip volumes were determined for each on the zones within the defined downtown study area for 2008 and 2012. A comparison of 2008 and 2012 production and attraction trip volumes reflects trip growth within the study area on a zone level basis. Figures 3.8a through 3.8f illustrate these trip volumes based on the downtown zonal structure, and identifies the difference in trip volumes between year 2008 and 2012. Figures 3.8a, 3.8b and 3.8c Tampa Downtown Circulator Year 2008 & 2012 HBMISC Person-Trip Productions / Change Figure 3.8a - 2008 HBMISC Person-Trip Productions
March 2007
Tampa Downtown Circulator Study Market Analysis Tech Memo
23
Figure 3.8b - 2012 HBMISC Person-Trip Productions
Figure 3.8c - Difference between 2008 & 2012 HBMISC Person-Trip Productions
Figures 3.8d, 3.8e and 3.8f Tampa Downtown Circulator Year 2008 & 2012 HBMISC Person-Trip Attractions / Change
March 2007
Tampa Downtown Circulator Study Market Analysis Tech Memo
24
Figure 3.8d - 2008 HBMISC Person-Trip Attractions
Figure 3.8e - 2012 HBMISC Person-Trip Attractions
March 2007
Tampa Downtown Circulator Study Market Analysis Tech Memo
25
Figure 3.8f - Difference between 2008 & 2012 HBMISC Person-Trip Attractions
Home-Based Miscellaneous trips represent the balance of trips originating at places of residence but not related to the work, shopping or social-recreational purposes. As such, the HBMISC trip purpose is sometimes called HB Other. Year 2008 and 2012 HBMISC trips are summarized respectively by Figures 3.9 & 3.9b. In the Downtown study area, HBMISC productions (Fig. 3.9a) total 15,759 for 2008 and are expected to grow some 20% to 18,931 by the year 2012. HBMISC trip makers that begin and end their trips within the Downtown amount to 4,236, roughly 27% of the daily HBMISC travel market in the year 2008. On the attraction side (Fig. 3.9b), HBMISC attractions amount to 60,677 in 2008 and 68,557 in 2012, a 13% increase. Over the 4-year period, this represents a 4% annual growth in HBMISC travelers.
Figures 3.9a and 3.9b Tampa Downtown Circulator HBMISC Person-Trip Productions and Attractions
March 2007
Tampa Downtown Circulator Study Market Analysis Tech Memo
26
Figure 3.9a
Figure 3.9b
Downtown Trip Productions
Downtown Trip Attractions 80,000
20,000 18,000
70,000
5,032
16,000 14,000
4,23
12,000
Within the Downtown
8,000 4,000
6 4,23
6
10,000 6,000
2 5,03
60,000
11,52
3
13,8
99
Downtown to Elsewhere
50,000
Within the Downtown
40,000 30,000
41 56,4
26 63,5
Elsewhere to the Downtown
20,000 10,000
2,000 0
0
Y2008
Y2012
Y2008
Y2012
Year 2008 and 2012 travel desire assignments appear respectively in Figures 3.9c and 3.9d. The universe of daily trips for Downtown HBMISC travel is estimated as being 4,535 for 2008 and 5,032 for 2012. Travel patterns emerging from the assignments suggest considerable travel along the peripheral of the study area TAZs (yellow area). A pattern similar to the other trip purposes is also evident in the exchange of trips between Ybor City areas and the core of Downtown Tampa. Figures 3.9c & 3.9d Tampa Downtown Circulator HBMISC Travel Desire Assignment Results Figure 3.9c – Year 2008
March 2007
Tampa Downtown Circulator Study Market Analysis Tech Memo
27
Figure 3.9d – Year 2012
3.6
Non-Home-Based (NHB) Travel
Non-Home-Based production and attraction trip volumes were determined for each on the zones within the defined downtown study area for 2008 and 2012. A comparison of 2008 and 2012 production and attraction trip volumes reflects trip growth within the study area on a zone level basis. Figures 3.10a through 3.10f illustrate these trip volumes based on the downtown zonal structure, and identifies the difference in trip volumes between year 2008 and 2012. Figures 3.10a, 3.10b and 3.10c Tampa Downtown Circulator Year 2008 & 2012 NHB Person-Trip Productions / Change
March 2007
Tampa Downtown Circulator Study Market Analysis Tech Memo
28
Figure 3.10a - 2008 NHB Person-Trip Productions
Figure 3.10b - 2012 NHB Person-Trip Productions
March 2007
Tampa Downtown Circulator Study Market Analysis Tech Memo
29
Figure 3.10c - Difference between 2008 & 2012 NHB Person-Trip Productions
Figures 3.10d, 3.10e and 3.10f Tampa Downtown Circulator Year 2008 & 2012 NHB Person-Trip Attractions / Change Figure 3.10d - 2008 NHB Person-Trip Attractions
March 2007
Tampa Downtown Circulator Study Market Analysis Tech Memo
30
Figure 3.10e - 2012 NHB Person-Trip Attractions
Figure 3.10f - Difference between 2008 & 2012 NHB Person-Trip Attractions
It is common for NHB trips to represent the lion’s share of travel in any Downtown because, by definition, NHB travel occurs between areas of employment. Summaries for Downtown Tampa’s NHB travel market (Figures 3.11a & 3.11b) affirm this characteristic. In addition, NHB trip generation rates, by design, generally yield equivalent values for NHB productions and attractions. Year 2008 NHB productions (Fig. 3.11a) total 82,956, nearly the same amount as the 2008 attractions (Fig. 3.11b). NHB trips grow to about 99,000 in the year
March 2007
Tampa Downtown Circulator Study Market Analysis Tech Memo
31
2012, an increase of 20%. NHB travel within the Downtown is 38% of the Downtown’s total daily NHB travel market. Figures 3.11a and 3.11b Tampa Downtown Circulator NHB Person-Trip Productions and Attractions
Figure 3.11a
Figure 3.11b Downtown Trip Attractions
Downtown Trip Productions
120,000
120,000
100,000
100,000
80,000 60,000
37,6
90
Downtown to Elsewhere
40,000 20,000
90 37,6
80,000
Within the Downtown
03 32,1
60,000
03 32,1
Within the Downtown Elsewhere to the Downtown
40,000
50,8
53
61,0
21 20,000
0
51 51,3
82 61,4
0
Y2008
Y2012
Y2008
Y2012
Travel desire patterns for the NHB trip purpose are illustrated in Figures 3.11c and 3.11d. As with results for the other trip purposes, NHB trip exchanges between Ybor City and the core of Downtown Tampa appear to standout in the results. There is a circular concentration of NHB travel around the heart of the Downtown, reflecting the employment-to-employment definition of NHB travel.
March 2007
Tampa Downtown Circulator Study Market Analysis Tech Memo
32
Figures 3.11c & 3.11d Tampa Downtown Circulator NHB Travel Desire Assignment Results Figure 3.11c – Year 2008
Figure 3.11d – Year 2012
March 2007
Tampa Downtown Circulator Study Market Analysis Tech Memo
33
4.0
Downtown Trip Attractions
This section identifies external to internal (EI) trip attractions by trip purpose by traffic analysis zone within the downtown study area. This information is important from the perspective knowing trip volumes into the downtown core that may park at periphery parking garages and traverse the downtown area using transit circulator routes. These trip volumes are illustrated for 2012 only because it is assumed that construction of new parking structures built around the perimeter of the downtown core would not be feasible by 2008 given the lead time required to locate sites, purchase property, plan and design the structure and complete construction. This information does provide a basis to examine attraction by trip purpose and will be used in designing transit circulators to link potential parking structure areas with the highest demand zones within downtown. Figures 4.1 through 4.5 illustrate zonal trip attraction volumes for trips from zones outside of downtown Tampa to those within the downtown study area. Trip voles are identified for the five trip purposes in the Hillsborough MPO’s travel demand model (i.e., HBW, HBSHOP, HBS&R, HBMISC and NHB). Figure 4.1 Tampa Downtown Circulator HBW External to Internal Work Trip Attractions
As expected, the largest concentration of external to internal work trips occurs in the core of downtown. However, higher concentrations of work trips are also occurring in the Ybor City area, with moderate concentrations north of I-275 and southwest of Kennedy Boulevard and the Hillsborough River.
March 2007
Tampa Downtown Circulator Study Market Analysis Tech Memo
34
Figure 4.2 Tampa Downtown Circulator HBSHOP External to Internal Work Trip Attractions
The highest concentration of external to internal shopping trip attractions occurs in the Ybor City area. Moderate levels also appear west of the Hillsborough River along Kennedy Boulevard, north of I-275 and the southeast portion of the downtown core. Although some of these trip volumes appear unusual when compared to existing land use conditions, the travel demand model land use designations for future years indicate differences from existing land use for these zones resulting in trip attractions different than existing conditions.
March 2007
Tampa Downtown Circulator Study Market Analysis Tech Memo
35
Figure 4.3 Tampa Downtown Circulator HBS&R External to Internal Work Trip Attractions
The highest concentration of external to internal shopping trip attractions occurs in the Ybor City area. Moderate levels also appear west of the Hillsborough River and south of Kennedy Boulevard. Figure 4.4 Tampa Downtown Circulator HBMISC External to Internal Work Trip Attractions
The highest concentration of external to internal miscellaneous trip attractions occur in the Ybor City area, the University of Tampa Campus and the area north of I-275. March 2007
Tampa Downtown Circulator Study Market Analysis Tech Memo
36
Figure 4.5 Tampa Downtown Circulator NHB External to Internal Work Trip Attractions
The highest concentration of external to internal non-home based trip attractions occur in the Ybor City area. Moderate levels also appear west of the Hillsborough River, south of Kennedy Boulevard, north of I-275 and the southeast portion of the downtown core.
March 2007
Tampa Downtown Circulator Study Market Analysis Tech Memo
37
APPENDIX C Public Outreach Materials
Tampa Downtown Circulator Study Stakeholder Member List Name Ned Baier Mike Brown Alastair Cain Marlo Chavarria Donna Chen Jim Corbett Abbey Dohring Jean Dorzback Shannon Edge Adam Fritz Ram Kancharla Tom Keating Karen Kress Roy LaMotte Susan Martin David Mechanik Mary Milne Greg Minder John Moors Michelle Ogilvie Bob Potts Chris Prather Guy Revelle Jerome Ryans Linda Saul-Sena Mary Shavalier Linda Stachewicz Thom Stork Ed Turanchik Chris Weber Sharon West Genie White Susan Williams Allison Yeh
Position Manager, Transportation Division Public Transportation Coordinator Senior Research Assoc.
Agency Hillsborough County Florida Department of Transportation CUTR/USF Tindale-Oliver Manager, Special Projects HARTline Parking Manager City of Tampa Vice President The Dohring Group Transportation Planning Chief City of Tampa Director Tampa Neighborhood and Community Architect CGHJ Architects Sr. Director of Planning and EconomicTampa Port Authority President Ybor Chamber Transportation Director Tampa Downtown Partnership Transportation Manager City of Tampa General Manager Hyde Park Village President/Shareholder Mechanik Nuccio Williams et al Director of Event Operations SP Times Forum President InTown Group Administrator, Convention Facilities &Tampa Convention Center Principle Planner Hillsborough County Planning Commi GM of Operations HARTline Property Manager CB Richard Ellis owner Channelside Restaurants President/CEO Tampa Housing Authority Councilwoman City of Tampa Director of Planning HARTline Government Liasion Floirda Department of Transportation President Florida Aquarium Managing Director InTown Properties Director of Transportation Westshore Alliance Manager COT Housing and Community Develop President Channel District Council Director of Services Tampa Bay Convention and Visitor's B Senior Planner Hillsborough County MPO
Tampa Downtown Circulator Study Stakeholder Group Meeting County Center -26th Floor 601 East Kennedy December 13, 2006 9:30 am to 11:00 am
Agenda 1.
Welcome and Introduction
2.
Study Purpose
3.
Project Scope and Schedule
4.
Discussion of Downtown Circulator Routes
5.
Next Steps
6.
Adjourn
Tampa Downtown Circulator Study Stakeholder Group Meeting Meeting Notes December 13, 2006 9:30 am to 11:00 am Attendees See attached sign-in sheet. Overview of Project The meeting was commenced and Harry Reed gave an overview of the Downtown Circulator Study, welcomed the stakeholders and began the open discussion. Stakeholder Group Input The meeting was conducted in a round-table format, whereby each person can voluntarily provide feedback or ask questions. Harry Reed served as the facilitator, ensuring that the meeting’s focus remained in tact. The group provided the following ideas, concerns, potential funding sources and recommendations at the meeting: Information University of Tampa • 3000 residents on campus; covers 100 acres • Many students work at Channelside and St. Pete Times Forum • Two parking garages on campus at 100% capacity (residents & commuters) • 5000 full-time undergraduate student enrollment • Employees need public transportation • Need to find out where students are going Hyde Park • 953 parking spaces • Park in garage, eat here, then take Rte. 98 to Forum • Parking occurs in residential areas (for nighttime activities) • Need better connection to downtown St. Pete Times Forum • 1500 employees (peak- Sep to May) • Summertime is slower • 200 events per year • #2 arena in the country: ACC tournaments, SEC BB games, spiritual conferences; Final Four games
1/9/2007
1
Key Concerns • KEY: Frequency; most people won’t wait 15 minutes • KEY: Circulator system and transit system as a whole needs to mirror City of Tampa Master Plan • KEY: Need parking for employees and visitors of Forum and Channelside • KEY: Connect convention center, arts district, FL aquarium, riverwalk, PAC and Forum • KEY: simple schedule, more consumer friendly, frequent Additional Concerns • Connection from downtown to Hyde Park is lacking (Rte. 98) • Connection from downtown to Performing Arts Center is not productive/realistic, because the service often ends before the shows/events end • Rte. 96 is dead after 6 pm • Reduced usage during the day; most lunch spots are within walking distance of employment centers • Current system is confusing; not holistic- can get to places, but cannot get back home • If all of the development at Channelside and Forum gets built, all of the surface parking will be eliminated and parking will have to be built elsewhere • City Council parking requirements have been increased for developments (July) • Property bought from Port Authority to build 2 residential towers and Publix with parking on top; City council denied request for Publix and parking garage, because Harbour Island residents complained there would be too much traffic generated; now there will be a CVS with 75 surface parking spaces • Forum has to let employees leave early to catch the current shuttle, which affects overall business and profitability • HART is making interim modification in April implementing neighborhood flex-ondemand services with vans (Carrollwood, Seffner, Brandon) • Funding for Rte. 98 will end this year ($339,000/yr) • Funding is needed primarily for operating costs; buses are already being replaced • Significant changes will occur with HART in Fall ‘07 • Idea: survey riders, operators, businesses • No trolley service to Channelside except for Hooters trolley • Need change machines for streetcar; streetcar needs expansion • University of Tampa shuttles students to and from Hyatt Hotel Potential Funding Sources • • • • • •
Lightning/St. Pete Times Forum (employee/patron shuttle) University of Tampa Activity Fee (students ride free, city relaxes zoning regulations) City of Tampa Parking fund Hyde Park assessment district Channel District Community Redevelopment Area (CRA) Central Park Village CRA Strategic Plan
1/9/2007
2
Recommendations • • • • • • • • • • •
Developers contribute funding to downtown transit (in-lieu fee of $4300) o Find out where current in-lieu fee goes? Could contribute to circulator operating costs or to off-site parking garages Marketing for all transit including downtown circulator- put an ad in the Tampa Tribune showing the routes, schedules and additional information Restricted parking policies in downtown (similar to Chattanooga) Construct peripheral parking and use revenues to offset operating costs of circulator Inventory parking and promote it in the newspaper, magazines and website Unique branding (e.g. Hop, Skip, Jump) Locate potential park-and-ride locations (e.g. Ybor City garages) Need parking policy changes! Hotels/UT have private shuttles; they could pay into a fund if City provided a convenient circulator Add fee to price for conventioneers to fund circulator Evening shuttle routes could be based on specific event times at Forum and Channelside
1/9/2007
3
Tampa Downtown Circulator Study Stakeholder Group Meeting County Center - 26th Floor (Room B) 601 East Kennedy January 26, 2006 1:30 pm to 3:30 pm
Agenda 1.
Welcome and Introduction
2.
Review and Update Base Map
3.
Report and Discussion • Existing Conditions Analysis • Circulator Peer Reviews • Near Term Strategies for Rt. 96 and Rt. 98
4.
Focus Group Discussion
5.
Next Steps • Potential Funding Sources • Potential Travel Markets
6.
Meetings: February 16th – 10 am to 12 pm March 12th – 1 pm to 3 pm
7.
Adjourn
Tampa Downtown Circulator Study Stakeholder Group Meeting Meeting Notes January 26, 2006 1:30 pm to 3:30 pm
Attendees See attached sign-in sheet.
Peer Review Comments •
•
• •
•
All peer circulators have a better frequency of service as compared to HART circulators (Bob Potts) o Service is too infrequent o Routes are too complicated Need to find out and include parking rate structures (in other cities) in peer reviews (Mike Chen) o Parking revenues swap off between subsidized parking and supporting transit operations (discuss with COT) Parking requirements are reduced in peer cities o Will need to occur in Tampa through change in Land Development Code Key: peripheral parking Key: free fares
Concerns Service/Routes • Vehicles go near PAC, but the timing of the service does not coordinate with the timing of events (Sandra Sroka) • Trolley is not easy to use • Circulator makes a stop at the Marion Transit Center; waits for 10 minutes, which affects personal schedules • Connection to residents is important: Harbour Island Channelside North Franklin Street Central Park Village Riverside Tampa Heights • Route 96 o Runs into the evening hours, but does not go to the people o Not many people are riding • Need more segmented services; serve specific needs as the growth in downtown increases (Bob Potts) o Evening Entertainment
2/12/2007
1
o o
SoHo Hyde Park
Study Coordination • Circulator Study should coordinate with Downtown Tampa Transportation Vision (Ross Silvers) o This study is a component within the DTTV o Define Vision Statement Downtown Environment • Identify core downtown hours: 6 am to 6 pm • Encourage pedestrian traffic (e.g. Publix on Bayshore) • Need more retail in downtown area to attract residents • Encourage resident pedestrian/circulator travel o Skypoint will be complete in the Spring (Lou Prida) • Coordination among venues is important o Aquarium is open on weekends to support Channelside University of Tampa • Reason Hyde Park Rte 98 was selected- to connect to UT o Many UT students use the Rte 98 circulator o Some may not be aware that it is available for them • Data on UT student ridership is not available yet (Randy O’Kelley) • Commuter students could benefit
Participant Recommendations • • •
• •
•
Designate Franklin Street as a retail hub o Plaza Park to support retail Need to effectuate a paradigm shift: get people out of their vehicles Target specific users o Students o Entertainment/sports visitors o Downtown employees Wide area service vs. Focused area service (Mike Chen) o Reach more users or improve frequency o Need a balance Fare free zone (Karen Kress) o Users can take any bus within a certain boundary o Combination trolley and ROW buses o One pass for all bus services (Sandra Sroka) Discuss with COT: FDOT Commitment for a 2800-space parking garage at NE of downtown
Miscellaneous • •
Corrections to presentation o Rte 98 hours of operation o Rte 96 – most of Rte 98 absorbs Rte 96 on the weekends Draft recommendations by March
2/12/2007
2
Stakeholder Meeting January 26, 2007
Project Partners Hillsborough
MPO (Lead)
HART City
of Tampa Tampa Downtown Partnership
Project Status Two
project team meetings Two stakeholder meetings Circulator Base Map Circulator Peer Reviews Existing Conditions Analysis Focus Groups Next Steps
Circulator Base Map
Circulator Peer Review Orlando
Norfolk
Chattanooga
Downtown Circulators Orlando
– LYMMO
– Funding- City’s downtown parking revenues, General Fund and CRA-Downtown District – 80% of all parking in downtown is located within 1 block of the LYMMO system – Downtown Parking Program supported in land development regulations
Downtown Circulators Norfolk
– NET
– Funding- City’s Parking Enterprise Fund (50%); Federal/State sources (50%) – Ridership- downtown employee who parks in 1 of 3 major satellite parking lots
Downtown Circulators Chattanooga
– Electric Shuttle
– Funding- parking revenues (2/3 of operating costs); CARTA General Operating Fund – CARTA receives revenue from Bijou Cinema, Ruginas and Holiday Inn through parking garage leases
Existing Conditions Analysis Downtown
Trolley (Route 96) Hyde Park Trolley (Route 98)
Existing Conditions Downtown Trolley (Route 96) Hours of Operation – Mon-Thu, 6am to 9pm – Friday- 6am to 10 pm – No weekend service 15
min headway Ridership: – 6,842 riders/month
Primary Ridership Markets Route 96
HART local/express passengers who can transfer via the MTC Harbour Island residents working downtown Channel District residents working downtown via Streetcar transfer Commuters who park remotely and ride trolley Downtown workers patronizing lunch venues Business travelers, conventioneers and other visitors Area residents/visitors attending weekday functions at the PAC or Museum of Art
Findings Downtown Trolley (Route 96) Difficulty maintaining 15 min headways (missed connections & shortened recovery time) Ridership consistent on weekdays, reduced in evenings Mid-day ridership equal to AM & PM peaks Ridership fairly significant between Harbour Island & Downtown; could boost ridership with later evening service
Downtown Trolley (Route 96) Highest
Ridership Stops:
– Marion Transit Center – Southern Transportation Plaza Lowest
Ridership:
– Northern segments of Florida Ave & Tampa St Highest Lowest
Existing Conditions Hyde Park Trolley (Route 98) Hours of Operation – – –
Mon-Fri, 11:30am - 6pm; 6pm-9pm Sat, 11:30 am to 9pm; 9pm-11pm Sun, Noon to 8:30 pm
Headways – Weekday: 15 min – Nights & Weekend: 30 min
Ridership: – 4,080 riders/month
Primary Ridership Markets Route 98 Area residents/visitors dining or attending functions on the weekend Business travelers, conventioneers and other visitors who wish to go to Hyde Park to eat or shop Hyde Park residents who work downtown and do not need a car throughout the day Downtown workers patronizing lunch venues in Hyde Park
Findings Hyde Park Trolley (Route 98) Significantly lower ridership on Route 98 as compared to Route 96 Saturday is the most productive day Cultural Arts District/Old Hyde Park Village fairly high on weekend
Hyde Park Trolley (Route 98) Highest
Ridership Stop:
– Southern Transportation Plaza (overall) – Weekdays: Hyde Park (Albany Ave) Old Hyde Park (Dakota St)
– Weekends: Old Hyde Park Village Performing Arts Center
Lowest Ridership: – Between Downtown & Hyde Park (Cleveland/Platt)
Highest Lowest
Focus Groups Goal:
– Assess major origins and destinations – Create desire lines – Solicit opinions on frequency, convenience and attractiveness of service – Propose route improvements Preliminary
Questions (handout)
Meetings:
– January 29, 12 pm to 2 pm (Employers & Potential Partners)
– January 30, 6 pm to 8 pm (Residents)
Next Steps Potential
Travel Markets Potential Funding Sources (handout)
Future Meetings Stakeholders
Group:
– February 16, 10 am to 12 pm County Center, 18th Floor – March 12, 1 pm to 3 pm County Center, 26th Floor
We Appreciate Your Feedback! If
you have any additional feedback, you can call or email: – Allison Yeh 813-273-3774 or
[email protected]
– Lori Nail 813-636-2125 or
[email protected]
Thank You!
Tampa Downtown Circulator Study Stakeholder Group Meeting County Center - 18th Floor 601 East Kennedy February 16, 2006 10:00 am to 12:00 pm
Agenda 1.
Welcome and Introduction
2.
Focus Group Results
3.
Preliminary Market Analysis
4.
Preliminary Recommendations
5.
Next Steps: • Draft Plan
6.
Next Meeting: March 29th – 1:30 pm to 3:30 pm
7.
Adjourn
Tampa Downtown Circulator Study Stakeholder Group Meeting Meeting Notes February 16, 2006 10:00 to 12:00 pm
Attendees See attached sign-in sheet.
Streetcar Discussion • • • •
• •
HART is prepared to make changes to routes now to plan for future streetcar expansion Policy changes are needed now for streetcar ° Hour changes (start at 6 am) Circulator Study can open doors for rubber-wheeled trolley/fixed-guideway system How much recognition is given to future streetcar expansion and how could it help the trolley system? ° Streetcar is an enhancement and the trolley will not take away from it; we want to create a symbiotic system Now, the streetcar = destination (entertainment); Future, the streetcar = commuter service Whiting Extension is crucial for success of streetcar extension
Miscellaneous Discussion • • • • •
Tampa General shuttles employees to Ybor parking garage ° Could rework circulator and streetcar to make this more seamless ° Potential funding contributor Scarier to walk in north downtown area as compared to south downtown area Important to look at resident issues ° HART does extensive public outreach Make sure Soho Route does not take away from downtown service Water Taxi-utilize Hillsborough River for transportation ° Homeland Security ° Continuity of riverwalk ° ADA issues ° ROW issues
Participant Recommendations Routes • Separate routes for weekday and weeknights (similar to Norfolk)
3/6/2007
1
• •
HART is looking into an evening/entertainment shuttle to connect parking, Forum, Channelside and hotels Singular “postage stamp” route
Parking • Use Twiggs Street Garage at night for events • Utilize ConAgra lot ° Convert to parking garage ° Future activity: light rail/TOD • Convert parking garages to retail on 1st floor • Need to tie into parking under I-275; people could park, walk to the MTC and ride in to downtown Ybor City • Ybor City could serve as parking node ° Noriega Garage, ACC Garage • Night Shuttle Kick-off Event: branding, marketing • Streetcar could go to Ybor at night and connect to Forum/Channelside ° Need to connect all of downtown and stop competing within downtown ° Holistic process/system • Use Tax Increment Financing techniques Policy • City has rigid practices and policies on uses of parking garages ° How can the city improve its practices? ° How can the city support mixed uses in low-use hours? • Redevelopment/New Development- existing public parking needs to support development • Change in Land Development Code • City Parking Permits • Developer Required Parking ° Debate over whether or not parking requirement should be reduced
Studies City Efforts • Parking & Transportation Study • Underwriting 2000- 2500 parking spaces in downtown URS Study of South CBD Special Events • 8 high capacity parking garage locations- immediately adjacent to Crosstown Expressway (5 minute walk to Channelside and Forum); • BUT, the value of land is so high, the City is unable to compete with land developers in buying the land to construct parking garages
Map Revisions Make revisions to General Market Areas Map • Change educational areas to residential/employment areas • Channelside/Aquarium area also includes some residential
3/6/2007
2
• • • •
Channel District includes retail Ybor City includes employment (office space/manufacturing) Tampa Heights – residential area Central Park Village- residential area
Comments on Recommended Route Corridors • Marion Street – mostly for fixed route buses and express buses
3/6/2007
3
Project Partners Hillsborough
MPO (Lead)
HART City
of Tampa Tampa Downtown Partnership Stakeholder Meeting February 16, 2007
Project Status
Circulator Base Map
Two
project team meetings stakeholder meetings Circulator Base Map Circulator Peer Reviews Existing Conditions Analysis Focus Groups Preliminary Market Analysis Next Steps Three
Peer City Strategies What strategies can we apply to the Tampa Downtown Circulator?
Chattanooga Parking
garages at north & south end of downtown Parking revenues helps fund shuttle
1
Norfolk Connection
between convention center, retail, hotels and other attractions Student use & support
Existing Parking Areas
Orlando 80%
of public parking is located within one block of the LYMMO system Land Development Regulations in support of transit and peripheral parking
Focus Group Meetings
Goal: – Assess major origins and destinations – Solicit opinions on frequency, convenience and attractiveness of service – Propose route improvements
Employers/Potential Partners
Residents/Developers
– January 29 – January 30
Focus Group Discussion
Employers/Potential Partners Major Concerns – Incomplete routes – Service hours – Public safety – Funding from “Big Players” Players”
2
Employers/Potential Partners Recommendations
Segmented markets
Routes – N-S Shuttle – Residents/Hooters Shuttle – Night/Events Shuttle
Amend Land Development Code
Funding
Improve downtown pedestrian environment
– Retail/Hotel Sponsorships – Free Fare Zone – Commercial parking pay into transit fund – Convention fee – Employer transit pass
Residents/Developers Recommendations
Route improvements Extended hours Better marketing Reduce parking requirements Attract more retail Funding – CRA monies – Special assessment district – No impact fees
Questionnaire Results Employers/Potential Partners
Quality of LifeLife- Public Safety Greatest StressStress- Transportation 4 out of 9 use transit; 2 out of 9 use transit for work Most are WTP to use circulator Walking Tolerance: 2 to 3 blocks Funding (Top 3) – – –
Sponsorships Special District Tax Grants
Residents/Developers Major Concerns – Lack of marketing/education for shuttle – Need better connections – No incentives to live downtown – Public safety – Lack of parking – Public perception of transit
Questionnaire Results General
Questions
– 15 respondents Specific
Questions
– 9 Employer/Potential Partner – 7 Residential
Questionnaire Results Residents/Developers Greatest
StressStress- Transportation/Commute 5 of 7 live/develop downtown; 1 of 7 uses transit Walking Tolerance: 1 to 3 blocks All are WTP to use circulator Funding (Top 2) – Property tax dollars – Hotel sponsorships
3
Preliminary Market Analysis Specific
Employment Attractors
Markets
– Employment – Events – Shopping
Existing
Employment Producers
Events Attractors
2012
Shopping/Retail Attractors
Existing
Market Growth Projections 2007 - 2012 HB Work HB Shopping HB Event NonNon-HB
Attractors 5.5% 8.2% 5.7% 14.0%
Producers 8.9% 8.0% 10.0% 14.0%
Existing
4
Downtown Venues 2006 Attendance Figures Ybor City St. Pete Times Forum Channelside Shops Cruise Passengers Tampa Bay Performing Arts Center Florida Aquarium Tampa Convention Center Tampa Museum of Art University of Tampa 65% fullfull-time 70% live onon-campus
General Market Areas
3.0 million 1.5 million 1.0 million 812,000 634,000 600,000 303,000 81,000 5,300 3,445 3,710
Recommended Route Corridors
Next Steps Finalize
Market Analysis Draft Plan
Future Meetings Stakeholders
Group:
– March 29, 1:30 pm to 3:30 pm County Center, 18th Floor
We Appreciate Your Feedback! If
you have any additional feedback, you can call or email: – Allison Yeh 813813-273273-3774 or
[email protected]
– Lori Nail 813813-636636-2125 or
[email protected]
Thank You!
5
6
Tampa Downtown Circulator Study Stakeholder Group Meeting Meeting Notes March 29, 2007 1:30 pm to 3:30 pm
Attendees See attached sign-in sheet. Stakeholder Comments The last of four stakeholder meetings commenced with a welcome by Marty Peate and the floor was opened for discussion on the Draft Circulator Study. Comments were taken from all willing participants and the following bulleted list provides an overview of these comments and in some cases a response from HART or the consultant. Hooters • Interested in establishing a more permanent route • Not sure they are going to continue funding for Hooters Shuttle o $288,000/3 years to fund the shuttle o Need to build the infrastructure now for the future Tampa Downtown Partnership • Markets need to be prioritized- The routes cannot be all things to all people- all the markets were just listed in the report- what’s the prioritization? Consultant Response: Depends on which routes potentially have the highest ridership (This will likely be fleshed out in report) • West of River; University of Tampa not served Consultant Response: Throughout the study, it has been determined that the core area/CBD should be the focus of HART’s efforts for route modification • Having a route sometimes during some events may be confusing HART Response: HART is concerned with how to get the “biggest bang for their buck” • What happened to Route 98? Consultant Response: There are a couple of existing HART routes that connect from Hyde Park to Downtown: Route 4 and Route 19 (This will need to be further discussed in report) o But these routes run only Monday through Friday and do not run late; so increasing the frequency or running on weekends may be a consideration (HART is looking into this) • Why is the N-S route going north of the interstate? HART Response: There is likelihood that the City of Tampa will be constructing a remote parking area (lower cost parking) north of the interstate; HART would like to tie their
4/11/2007
1
routes into this parking area. This route will also connect to Stetson University and the proposed Tampa Heights area. Channelside Restaurants • During ACC Tournament, many tourists staying at main downtown hotels loved downtown atmosphere b/c everything was accessible; those staying in Westshore did not like it as much • Lower east/west route is already handled by the streetcar Consultant Response: The lower east-west route could be a supplement to the streetcar during event times (with Forum); maybe only a demand-driven route for short term, and possibly a more permanent route in the long term City of Tampa • With the Tampa/Florida N-S Route, coordination with FDOT will be required, because these are state roads. HART Response: This will not be an issue per HART. Considerations for HART • Need to keep connection with Harbour Island • North-South route needs to encompass the Marion Transit Center • How all of this will be perceived by the county • HART has a lot of flexibility with changing routes, times and schedules • HART will be prioritizing a finite pool of taxpayers money based on current demand • In response to private sponsorships: o HART cannot be a collection agency- this is somewhat counterproductive, because they are not set up to do this • Nighttime/Entertainment issues are complex o HART will have to work with all of the entertainment venues to really make it happen o Next Step: planning on a quarterly basis to create a schedule and prioritize events • Available Resources will limit some recommendations o Some phasing will be required • Key Change for HART in short-term: Evening/Events Circulator Recommendations • Establish an Advisory Board to help implement route modifications o Use existing Circulator Stakeholder Group o Will look at how to prioritize events for evening shuttle, primary markets, funding o Future advisory board meetings need to also involve the Performing Arts Center and City of Tampa Events and Parking staff • Establish private sponsorships • Recommend that the TDP or Downtown Tampa Attractions Association handling the collection of bills associated with private sponsorships
4/11/2007
2
Looking to the Future HART will use the Circulator Study as a guideline for developing/modifying routes for Fall 2007. The study provides justification that changes to the routes need to be made and is key for obtaining funding from HART sources and recommending other funding options. HART will have between now and June to develop a list of service options. They will need this much time to get with their Chief Financial Officer to determine funding availability. The Circulator Stakeholder’s Group can serve as an Advisory Board to HART for making recommendations to the Board. By June, they will modify Route 96 and Route 98 and make recommendations to the HART Board in August. All of the input received throughout the Downtown Circulator Study process will go towards HART’s fine-tuning of routes. Implementation of route modification will occur in October 2007. Additionally, Bob Potts is anticipating asking for official authority for the public involvement process to begin on the designation of routes, to perform a cost-benefit analysis and actually drive the routes to determine feasibility.
4/11/2007
3
Focus Groups Focus Group Member List These lists include all of those members who were invited to participate in the focus group. The sign-in sheet, attached to the meeting notes, shows who came to the meetings. Employee/Employer and Potential Partners Focus Group Jim Corbett, City of Tampa Parking Donna Chen, HART Mike Chen, City of Tampa Debbie Dahma, Hillsborough County Administration Fred Dobbins, Suntrust Bank Karen Kress, Tampa Downtown Partnership Liana Lopez, City of Tampa Nina Mabilleau, City of Tampa Mary Milne, St. Pete Times Forum Vicki Mitzel, Concierge at 100 North Tampa Randy O’Kelley, University of Tampa Chris Prather, Bank of America Plaza Guy Revelle, Channelside Restaurants Robert Rose, Tampa Convention Center Mary Scott, Marriott Waterside Jim Shimberg, Holland & Knight Janet Rivera Tucker, City of Tampa Lacey Willard, GSA Residential Focus Group Jason Accardi, 717 Parking Stacey Borsik, Skypoint Condos Donna Chen, HART Don Coryell, Green Acre Properties Abbey Dohring, The Dohring Group Jennifer Fadal, Davis Island Chamber of Commerce Nina Mabilleau, City of Tampa Pierre Mathurin, Hillsborough Advocates for Improved Transit Francine Messano, Channel District Resident Greg Minder, InTown Properties Jerome Ryans, Tampa Housing Authority Sandra Sroka, Hillsborough County ADA Ken Stoltenberg, Mercury Advisors John Thorington, Tampa Port Authority Genie White, Channel District Council
Tampa Downtown Circulator Study Focus Group Meeting Notes County Center- 18th Floor 601 East Kennedy January 29, 2007 12:00 pm to 2:00 pm
Attendees Employers and Potential Partners *See attached sign-in sheet
Information Transit • Bus runs up Whiting St to MTC until 1 am • Hillsborough Co. subsidizes bus passes 75% (by BOCC); but nobody utilizes • Monthly bus pass: $80/mo (express bus); compare to monthly cost of parking o Discounted pass: 20 rides = $7.50 • Future: Intermodal Center Residential • 2200 residential units under construction • 600 current residents in downtown Employers Channelside • Hours: 4-12 (weeknights); Until 3 am (weekends) • Employees park in northside of Aquarium lots ($13,000/yr for Channelside) o 10 year lease, 25 year option • 1 ½ blocks from St. Pete Times Forum to Channelside St. Pete Times Forum • Hours: Arrive b/t 3-5 pm; Leave b/t 11pm -1 am • Employee parking lot is leased o 100% of parking is paid by Forum ($13,000/mo) o Free parking for carpool of 3 or more • If a better option is provided for employees, Forum will be willing to consider it Parking • 2800 parking garage- FDOT (in conjunction with approval of Interstate Master Plan) COT Parking • Twiggs St Garage- 900 spaces o Empty at night o Jurors use during day • Whiting St Garage- 500 spaces • Ft. Brooke & Whiting Garages offer lower prices for parking • Lots of wasted parking in downtown • Daytime metered parking- 25 cents/2 hrs
February 12, 2007
1
•
• • • •
COT Parking Study o Move parking to perimeter o Open up core spaces for visitor parking o COT discussions with HART Parking garage in Ybor- joint use between City and Community College o 1200 spaces o 800 community spaces 225 parking spaces under I-275, but used as equipment storage $48/mo parking in County Center $46/mo parking in County Garage
Concerns Routes • Routes are not complete- can get to a location, but cannot get back • City is lacking east-west connections • Streetcar: o Transfer from streetcar to trolley is underutilized o Tourist attraction, not ideal for residents, workers, slow, inconvenient, needs a better connection to other transit Service • Circulator hours not in sync with Forum hours • Use of transit may depend on purpose of trip (e.g. for dinner, may not use; for an event, may use) Funding • “Big Players” need to buy-in to the concept- City, County, HART, landowners Public Safety • Whiting St- dark, scary for pedestrians making connection to MTC • Majority of downtown at night is unsafe o Area S of Whiting, N of Channelside, E of Morgan St and W of Meridian is especially unsafe • Downtown environment not conducive for driving @ looking for parking o One-way streets o Construction o Poor signage o “Big City” mentality • “Broken Windows” Syndrome • Most will walk 3-4 blocks if the avenue is well lit • Balance between pedestrian friendly and traffic impacts External Factors • UT students carpool or park on campus o Parking is inexpensive o ½ of student population have cars • Forum parking will be eliminated in future
February 12, 2007
2
Participant Recommendations Potential Markets • Shoppers (conventioneer spouse) • For residents to get to work or arts/entertainment o Advertise evening/entertainment shuttle in advance • Service workers/hourly employees • Students • UT/USF employees in Channelside Routes/Service • Connection from South CBD to MTC late nights or events • Single route: if shuttle travels north on one street, it should come back down the same street • Run Hooters shuttle in conjunction with residents shuttle during the day • Westshore Lunchtime Circulator • 3 In-Town Circulators o N-S Shuttle- to and from garages and MTC o Residents/Hooters Shuttle o Night/Events Shuttle Downtown Environment • Improve lighting, landscaping, pedestrian environment @ downtown (decorative light poles, wrought iron fencing, potted plants, wayfinding signs) • Piggyback on City’s efforts to make downtown more pedestrian friendly • Coordinate with Downtown Signage Study • Create a “Park N Ride” concept Funding • Retail/Hotel sponsorships (similar to St. Pete Looper) • Free Fare Zone • Convert commercial parking leases to pay into transit fund • Convention fee (include in pass) • Employers provide transit pass (eligible for tax credit) Policy Implications • Need a City Resolution: Move parking to periphery and charge less for employee parking in remote lots, leaving nearby spaces open to patrons • Use ITS parking strategies such as online pre-paid parking (by vendors) • Circulator will help make UT parking policies more restrictive
Summary of Questionnaire *See attached spreadsheet for full results General Questions With respect to the initial questions, 8 out of 9 of the respondents cited public safety as most important relative to quality of life. Among the top five indicators of quality of life included mass transit options, affordable housing and employment opportunities. Cited
February 12, 2007
3
as the greatest cause of daily stress, transportation/commute related was chosen as the 1st or 2nd greatest stressor by about 90% of the respondents. Interestingly, only 4 of the 9 respondents actually use some form of transit and those that do not expressed lack of convenience, infrequent service, no incentives, as well as some external factors explaining why they do not use transit. Most of the respondents agree or strongly agree that a downtown circulator is needed and list frequency, routes, and origins/destinations as the top three factors in creating a successful circulator shuttle system. All respondents (except one) were willing to pay some fare amount to use the circulator and the type of payment options varied. Most importantly, the suggestions for funding a downtown circulator consisted of the following: • • • • • • •
Fare Free Area (for CBD) Tax Increment Sales Tax Community Investment Tax Parking revenues Sponsorships Government funding (including Federal Grants)
Specific Questions Many of the respondents cited lack of parking as a major disadvantage of working/having a business in the downtown area. With this said, only two out of the nine respondents said they used public transit to get to work. Many of the reasons for not using public transit to get to work include inconvenience, inaccessibility, and other external factors. Though the monthly parking costs exceed $50 for many of the respondents, these costs are either subsidized or paid in full by the employer. Personal mobility plays an important part in the economic vitality of the downtown area for all respondents. The average number of blocks one is willing to walk from his/her vehicle to a circulator stop and/or from the stop to his/her place of employment is 2 to 3 blocks. An improved circulator system could directly benefit most of the respondents and/or their businesses. The top three funding scenarios identified include sponsorships, special district tax and grants. If asked to financially support a circulator system, the respondents (and their businesses) would hope to receive frequent, accessible service, improved routes and discounted passes.
February 12, 2007
4
Tampa Downtown Circulator Study Focus Group Meeting Notes County Center-18th Floor 601 East Kennedy January 30, 2007 6:00 pm to 8:00 pm Attendees Residents and Residential Developers *See attached sign-in sheet
Issues Routes/Service • Need connection to and from work/schools • If people knew they could get to and from their destination and knew the routes/times, they would be likely to use it • Ybor connection to Channelside is not as huge an issue, because people know about this (Streetcar) • Need shuttle for evening/entertainment purposes o Residents of Davis Island to Hyde Park & Soho Downtown • No incentives to live downtown • Channel District residents are being taxed for the streetcar- disincentive Public Safety • All segments of population could benefit and feel safe • Walking impediments; not a pedestrian friendly environment • Crossing Channelside Drive is dangerous • Allow circulator operators to identify security risks Parking • Tampa General Hospital employees need more parking on Davis Island • TCC on Davis Island- lack of parking • Lots of recreational opportunities on Davis Island, but nowhere to park • Current parking requirements in Channelside: 1 space/bedroom; increases cost of unit • Construction parking is an issue in the short-term o Construction workers should park under the expressway, but there is no way for them to get to and from job site Public Perception • Bus vs. streetcar vs. rail vs. trolley (bus not as safe) • Some feel safer on circulator as compared to HART bus (Sandra Sroka) • Stigma attached to the bus
2/12/2007
1
Participant Recommendations Routes • Kennedy to Jackson Loop (within a block of major office buildings) • Downtown Trolley-More residential to cultural arts district • Davis Island to Franklin St • Channel District to Performing Arts Center • Include marketing for circulators with PAC passes • Connection for airport travelers (Rte 30: MTC to airport, but need to get to MTC) • Convention center connection • Future: Downtown/Channelside to Westshore District (including malls/airport) Service • Need later hours • Needs to be more convenient, attractive • Needs better marketing Downtown • Circulator acts as an incentive in attracting residents downtown • Retail space on ground floor of arts district condos • Will generate more traffic/people • 30,000 sq. ft retail coming to downtown • Include signage on properties displaying system information • Utilize Aquarium parking lots to fullest extent (currently not full during the day) • Future: TOD with light rail Policy • Reduce amount of parking associated with condo developments • Lender should deem the project “good-to-go” w/o parking Funding • CRA Monies (City Council) o Drew Park o Ybor City o Central Park Village o Channel District *Needs to serve/benefit the district; every cent does not have to stay within the CRA • Opposition to impact fees o Citywide Impact Fee Study • Coordinate with commercial property owners o Add money to special assessment district o Use of technology meters
Summary of Questionnaire *See attached spreadsheet for full results General Questions With respect to the initial questions, the responses varied somewhat in identifying the top five factors in order of importance as they relate to quality of life. In fact, there was
2/12/2007
2
no one factor that was identified by everyone as a “Top Five Factor”. Alternatively, the greatest cause of daily stress is transportation/commute related for four out of the six respondents and the remaining two did include this factor in their line-up. Most of the respondents do not use public transportation and the most cited reasons include lack of convenience and infrequent service. All respondents agree or strongly agree that a downtown circulator system is needed and cite the following as the top three factors in creating a successful circulator system: • Frequency • Routes • Origins/Destinations All of the respondents are willing to pay some fare amount, out-of-pocket for a downtown circulator service. Additionally, three respondents thought the payment should be included in a monthly HART pass. Finally, suggestions for funding a downtown circulator included using property tax dollars, hotel sponsorships and use of existing circulator funds. Specific Questions Reasons for moving or developing in the downtown area range from provision of city services, proximity to work, retail and entertainment venues, various recreational opportunities and to have less of a commute. With this said, the respondents listed disadvantages of living/developing in the downtown area, most of which were related to the transportation system (e.g. traffic, lack of public transportation, parking, roads closed for events) and lack of services and amenities (e.g. lack of retail, no grocery stores, lack of green space, less house for the money). Five out of the seven respondents work in the downtown area, but only one uses public transit. Some of the most attractive features in a circulator system, as identified by the respondents, include convenience, free fares, accessibility and safety. Lastly, while most of the respondents are willing to walk 1 to 3 blocks to get to the circulator (from residence) or to the office (from circulator system), one individual is willing to walk up to 10 blocks.
2/12/2007
3
Thank you in advance for participating in our focus group for the Tampa Downtown Circulator Study. Your input will be used to shape the market analysis and recommendations sections of this study. Your feedback is invaluable! Name Organization
Please answer the following questions. 1. Please rank the following factors in order of importance as they relate to quality of life (1 being the most important, 8 being the least important). • Public safety • Public education • Affordable housing • Mass transit options • Weather • Entertainment activities • Recreational opportunities • Employment opportunities 2. Please rank the following factors in order of greatest causes of daily stress (1 being the greatest stressor, 7 being the least). • Employment related • Housing related • Education related • Social related • Transportation/Commute related • Public safety related • Weather related
3. Do you currently use transit to travel to and within the downtown area?
4. • • • •
If yes, which system? Streetcar Downtown Circulator HART Local Bus HART Express Bus
5. • • • •
If no, why? Not convenient to my origin and/or destination Not frequent enough No desire to use transit Other (please describe)
1
6. Rate the following statement: There is a need for a circulator shuttle system in downtown Tampa. • Strongly Agree • Agree • Neutral • Disagree • Strongly Disagree 7. Please choose the top 3 factors that are most important in creating a successful circulator system. • Frequency • Routes • Origins/Destinations • Type of vehicle • Stations • Cost savings over driving • Prefer experience to driving • Saves Time • Employer Incentives 8. • • • • •
Please rank the following activities for which you might use a downtown circulator. To and from work To and from retail To and from lunch/dinner To and from entertainment opportunities To and from special events
9. How much would you or your constituents be willing to pay for a downtown circulator service? • Not willing to pay • $.50 or less • $.50 to $1 • $1 to $1.50 • More depending on service 10. • • • •
How would you or your constituents be willing to pay? Out- of- Pocket Condo Fees Included in Monthly HART Pass Convention Pass
11. How would you suggest funding a downtown circulator?
2
Employer/Employee and Potential Partners Focus Group Please answer the following questions as they relate to you. 1.
What are the advantages/disadvantages of working/having a business in the downtown area?
2. Do you use a public transportation system to travel to work? If no, why?
3. Is parking available at your job/place of business?
4. What is the cost of parking? Does your employer pay for the cost of parking?
5. Is personal mobility important to the economic vitality of the downtown area?
6. How many blocks would you be willing to walk from your vehicle to a circulator stop?
7. How many blocks would you be willing to walk from the circulator system to your place of employment?
8. Which three (3) of the following are the most attractive scenarios for funding an improved circulator system? • Special district tax • Tax increment financing • Sponsorship • Grants • Sales tax • Bond issues • Existing governmental sources 9. Do you feel that an improved circulator system could directly benefit you/your business?
10. If you/your business were asked to financially support an improved circulator system, what would be attractive incentives for you/your business?
1
Residential Focus Group Please answer the following questions. 1. What attracted you to move to/develop in the downtown area?
2. What are the top 3 disadvantages of living/developing in the downtown area?
3. Do you work in the downtown area? If yes, how do you travel to work?
4. What would be the most attractive feature in a circulator system for you?
5. How many blocks would you be willing to walk from your residence to a circulator stop?
6. How many blocks would you be willing to walk from the circulator system to your office?
1
General Questions Participant Number
1
2
3
4
5
6
7
Questions 1 1 2 3 4 5
Public safety Employment opportunities Affordable housing Mass transit options Public education
Public safety Public education Employment opps Affordable housing Mass transit options
Public safety Employment Opps Affordable housing Mass transit options Public education
Public safety Entertainment activities Recreational opps Employment opps Affordable housing
Public safety Entertainment activities Mass transit options Weather Employment Opps
Public safety Employment opps Public education Affordable housing Recreational opps
Public safety Public education Mass transit options Affordable housing Employment opps
1 2 3 4 5
Transportation/commute related Public safety related Housing related Employment related Social related
Employment related Transportation/commute related Public safety related Housing related Education related
Transportation/commute related Weather related Employment related X X
Transportation/Commute Related Social Related Employment related X X
Public safety related Transportation/Commute Related Housing related X X
Employment related Transportation/commute related Social related Education related Housing related
3 4 5
No N/A D
No N/A A
Yes D-Limited Express N/A
No N/A A
No N/A A
Employment related Housing related Public safety related X X No- personally; Yes-students B, C D
D explanation 6 7 (No particular order)
Need to accommodate school age child Agree
Strongly Agree
2
Yes A, B, C N/A
Neutral
Strongly Agree
Strongly Agree
Strongly Agree
Freedom, flexibility, little to no cost to park on campus Strongly Agree
1 Frequency 2 Saves time 3 Prefer experience to driving
Routes Cost of savings over driving Origins/Destinations
Frequency Routes Saves Time
Frequency Routes Origins/Destinations
Frequency Routes Cost savings over driving
Frequency Origins/Destinations Cost savings over driving
Frequency Routes Origins/Destinations
1 2 3 4 5 9
To and from lunch/dinner To and from work To and from retail To and from special events To and from entertainment opps B
To and from special events To and from lunch/dinner To and from entertainment opps To and from retail To and from work B
To and from entertainment opps To and from lunch/dinner To and from work X X C
To and from entertainment opps To and from lunch/dinner To and from work X X E
To and from special events To and from entertainment opps To and from work X X C
To and from lunch/dinner To and from special events To and from entertainment opps X X B
10
C
A
To and from retail X X X X C or E C-Special circulator fare good for entire year
ALL
C
A, C
C
11
Fare Free Area or pass (one time fee) for certain area (CBD)
Federal Grants
Tax Increment Sales Tax
Community investment tax Federal funds Access development
Parking revenues
8
Participant Number
Employer help defray cost; county discounts passes 75%
8
9
10
11
12
13
14
15
Questions 1 1 2 3 4 5
Entertainment Activities Mass transit options Public education Public safety Recreational opps
Public safety Mass transit options Entertainment activities Employment opps Affordable housing
Employment opps Affordable housing Mass transit options Recreational opps Public education
Public safety Entertainment Activities Affordable housing Employment opps X
Entertainment activities Mass transit options Recreational opps Employment opps Public Safety
Public education Entertainment activities Recreational opps Mass transit options Employment opps
Mass transit options Affordable housing Entertainment activities Recreational opps Public safety
Affordable housing Public safety Employment opps Affordable housing Weather
1 2 3 4 5
Transportation/commute related Employment related Public safety related Housing related Social related Yes A N/A
Public safety related Transportation/commute related Social related Housing related Employment related No N/A A, B
Transportation/Commute related Housing related Employment related Public safety related Weather related Yes & No B B,D
Transportation/commute related Employment related Social related Public safety related X No N/A A, B
Transportation/commute related Housing related Social related Employment related X No N/A A, D
Housing related Transportation/commute related X X X No N/A A
Transportation/commute related Employment related Weather related Public safety related Social related No N/A C
Strongly Agree
Strongly Agree
Job requires travel throughout county Strongly Agree Strongly Agree
Not familiar with bus stops Strongly Agree
Employment related Education related Transportation/commute related Social related X No N/A A, B Not educated as to when or where pickups/drop-offs are; also live near work Strongly Agree
Agree
Agree
1 Frequency 2 Routes 3 Stations
Routes Origins/Destinations Type of vehicle
Frequency Routes Origins/Destinations
Frequency Routes Origins/Destinations
Frequency Routes Origins/Destinations
Type of vehicle Frequency Routes
Origins/Destinations Cost savings over driving X
Routes Frequency Saves time
1 2 3 4 5
To and from lunch/dinner To and from entertainment opps To and from special events To and from retail To and from work A- should be free B, D, C
To and from entertainment opps To and from retail To and from work To and from special events To and from lunch/dinner B,C A, C
To and from work To and from entertainment opps To and from special events To and from lunch/dinner To and from retail E A, B
To and from retail To and from lunch/dinner To and from entertainment opps To and from special events To and from work D A, C
To and from work To and from special events To and from lunch/dinner To and from entertainment opps To and from retail E A
To and from special events To and from lunch/dinner To and from work X X C A
Use of property tax dollars
With the same funds that are used currently for the In-town trolley
X
To and from entertainment opps To and from lunch/dinner To and from retail To and from special events To and from work C A, C Not with a special assessment district; Use property taxes from entire county
2
3 4 5
D explanation 6 7 (No particular order)
8
9 10
11
To and from special events To and from work To and from lunch/dinner To and from entertainment opps To and from retail C D End users Corporate Government funding/budgets Sponsorships
Stakeholders & Government should pay for it; "a complete package" X
Hotel and/or pay as you go
Specific Questions- Employers/Employee & Potential Partners Group Participant Number
1
2
3
4
5
6
7
8
9
Questions 1
2
3 4
5 6 7 8
9
10
Centrally located w/in downtown
Business group is captured; Having easy access to other downtown Wealth of resources for community development; Center for urban cultural activity M-F; 8am-5pm businesses
Parking Traffic No
After 5pm-downtown area is People can't get to us and there is no dead parking Yes No
Not available
X
Yes
a $50/month b Yes, partially subsidized Yes, personally 2 to 3 2 to 3 1 Sponsorship 2 Special district tax 3 Bond issues
Walk = good exercise Advantages Large daytime pop. Cost of parking Walk b/t parking and destination Disadvantages Foul weather No Need to accommodate school-age child Explanation and frequent appointments No (offsite)
No
Government: public funding
Entertainment
Amenities Nearness of meetings
X
X
Perception of poor public safety Bike routes have high incidents of accidents No I live w/in walking distance of my work UT students/commuters do
Congestion Parking Sometimes
Not one accessible
X No Not applicable to residence and work schedule
Yes
Yes
Yes
Yes
Yes
Lack of parking/transportation opps that work for all shifts Not currently. Buses in my area do not run at early/late times Yes for me, but not for employees due to costs
$86/month Yes Yes 3 3
$48/month No Yes 2 to 3 2 to 3
Free to employees Yes Yes 2 2
$107/month Yes- full cost Yes 2 4
$0/mo for faculty;