Supply and Demand
1.
CHAPTER
3
A survey indicated that chocolate is the most popular flavor of ice cream in America. For each of the following, indicate the possible effects on demand, supply, or both as well as equilibrium price and quantity of chocolate ice cream. a. A severe drought in the Midwest causes dairy farmers to reduce the number of milk-producing cattle in their herds by a third. These dairy farmers supply cream that is used to manufacture chocolate ice cream. b. A new report by the American Medical Association reveals that chocolate does, in fact, have significant health benefits. c. The discovery of cheaper synthetic vanilla flavoring lowers the price of vanilla ice cream. d. New technology for mixing and freezing ice cream lowers manufacturers’ costs of producing chocolate ice cream.
1. Solution
a. By reducing their herds, dairy farmers reduce the supply of cream, a leftward shift of the supply curve for cream. As a result, the market price of cream rises, raising the cost of producing a unit of chocolate ice cream. This results in a leftward shift of the supply curve for chocolate ice cream as ice cream producers reduce the quantity of chocolate ice cream supplied at any given price. Ultimately, this leads to a rise in the equilibrium price and a fall in the equilibrium quantity of chocolate ice cream.
b. Consumers will now demand more chocolate ice cream at any given price, represented by a rightward shift of the demand curve. As a result, both equilibrium price and quantity rise. c. The price of a substitute (vanilla ice cream) has fallen, leading consumers to substitute it for chocolate ice cream. The demand for chocolate ice cream decreases, represented by a leftward shift of the demand curve. Both equilibrium price and quantity fall. d. Because the cost of producing ice cream falls, manufacturers are willing to supply more units of chocolate ice cream at any given price. This is represented by a rightward shift of the supply curve and results in a fall in the equilibrium price and a rise in the equilibrium quantity of chocolate ice cream.
2.
In a supply and demand diagram, draw the shift of the demand curve for hamburgers in your hometown due to the following events. In each case, show the effect on equilibrium price and quantity. a. The price of tacos increases. b. All hamburger sellers raise the price of their french fries. c. Income falls in town. Assume that hamburgers are a normal good for most people. d. Income falls in town. Assume that hamburgers are an inferior good for most people. e. Hot dog stands cut the price of hot dogs.
S-33
KrugWellsECPS4e_Micro_CH03.indd S-33
9/23/14 9:35 AM
S-34
CHAPTER 3
S U P P LY A N D D E M A N D
Solution 2.
a. A rise in the price of a substitute (tacos) causes the demand for hamburgers to increase. This represents a rightward shift of the demand curve from D1 to D2 and results in a rise in the equilibrium price and quantity as the equilibrium changes from E1 to E2. Price of hamburger
S E2
P2 E1
P1
D2 D1 Q1
Q2 Quantity of hamburgers
b. A rise in the price of a complement (french fries) causes the demand for hamburgers to decrease. This represents a leftward shift of the demand curve from D1 to D2 and results in a fall in the equilibrium price and quantity as the equilibrium changes from E1 to E2. Price of hamburger
S E1
P1 E2
P2
D1 D2 Q2
Q1 Quantity of hamburgers
c. A fall in income causes the demand for a normal good (hamburgers) to decrease. This represents a leftward shift of the demand curve from D1 to D2 and results in a fall in the equilibrium price and quantity as the equilibrium changes from E1 to E2. Price of hamburger
S E1
P1 E2
P2
D1 D2 Q2
Q1 Quantity of hamburgers
KrugWellsECPS4e_Micro_CH03.indd S-34
9/23/14 9:35 AM
CHAPTER 3
S U P P LY A N D D E M A N D
S-35
d. A fall in income causes the demand for an inferior good (hamburgers) to increase. This represents a rightward shift of the demand curve from D1 to D2 and results in a rise in the equilibrium price and quantity as the equilibrium changes from E1 to E2. Price of hamburger
S E2
P2 E1
P1
D2 D1 Q1
Q2 Quantity of hamburgers
e. A fall in the price of a substitute (hot dogs) causes demand for hamburgers to decrease. This is represented by a leftward shift of the demand curve from D1 to D2 and results in a fall in the equilibrium price and quantity as the equilibrium changes from E1 to E2. Price of hamburger
S E1
P1 E2
P2
D1 D2 Q2
Q1 Quantity of hamburgers
3.
The market for many goods changes in predictable ways according to the time of year, in response to events such as holidays, vacation times, seasonal changes in production, and so on. Using supply and demand, explain the change in price in each of the following cases. Note that supply and demand may shift simultaneously. a. Lobster prices usually fall during the summer peak lobster harvest season, despite the fact that people like to eat lobster during the summer more than at any other time of year. b. The price of a Christmas tree is lower after Christmas than before but fewer trees are sold. c. The price of a round-trip ticket to Paris on Air France falls by more than $200 after the end of school vacation in September. This happens despite the fact that generally worsening weather increases the cost of operating flights to Paris, and Air France therefore reduces the number of flights to Paris at any given price.
KrugWellsECPS4e_Micro_CH03.indd S-35
9/23/14 9:35 AM
S-36
CHAPTER 3
S U P P LY A N D D E M A N D
Solution 3.
a. There is a rightward shift of the demand curve from D1 to D2 during the summer because consumers prefer to eat more lobster during the summer than at other times of the year. Other things equal, this leads to a rise in the price of lobster. Simultaneously, lobster fishermen produce more lobster during the summer peak harvest time, when it is cheaper to harvest lobster, representing a rightward shift of the supply curve of lobster from S1 to S2. Other things equal, this leads to a fall in the price of lobster. Given the simultaneous rightward shifts of both the demand and supply curves, the equilibrium changes from E1 to E2. The fall in price indicates that the rightward shift of the supply curve exceeds the rightward shift of the demand curve. Price of lobster
S1 S2
P1
E1 E2
P2
D2
D1 Q1
Quantity of lobster
Q2
b. There is a leftward shift of the demand curve for Christmas trees after Christmas from D1 to D2, as fewer consumers want Christmas trees at any given price. The supply curve does not shift; the reduction in the quantity of trees supplied is a movement along the supply curve. This leads to a fall in the equilibrium price and quantity, as the equilibrium changes from E1 to E2. Price of Christmas tree
S
P1
E1
P2
E2
D2 Q2
D1
Q1 Quantity of Christmas trees
KrugWellsECPS4e_Micro_CH03.indd S-36
9/23/14 9:35 AM
CHAPTER 3
S U P P LY A N D D E M A N D
S-37
c. There is a leftward shift of the demand curve for tickets to Paris in September, after the end of school vacation, from D1 to D2. Other things equal, this leads to a fall in the price of tickets. At the same time, as the cost of operating flights increases, Air France decreases the number of flights, shifting the supply curve leftward from S1 to S2. Other things equal, this leads to a rise in price. Given the simultaneous leftward shifts of both the demand and supply curves, the equilibrium changes from E1 to E2. The fall in price indicates that the leftward shift of the demand curve exceeds the leftward shift of the supply curve. Price of ticket
S2 S1
P1
E1 E2
P2
D1
D2 Q2
4.
Q1 Quantity of tickets
Show in a diagram the effect on the demand curve, the supply curve, the equilibrium price, and the equilibrium quantity of each of the following events. a. The market for newspapers in your town Case 1: Case 2:
The salaries of journalists go up. There is a big news event in your town, which is reported in the newspapers.
b. The market for St. Louis Rams cotton T-shirts Case 1: Case 2:
The Rams win the Super Bowl. The price of cotton increases.
c. The market for bagels Case 1: Case 2:
People realize how fattening bagels are. People have less time to make themselves a cooked breakfast.
d. The market for the Krugman and Wells economics textbook Case 1: Case 2:
KrugWellsECPS4e_Micro_CH03.indd S-37
Your professor makes it required reading for all of his or her students. Printing costs for textbooks are lowered by the use of synthetic paper.
9/23/14 9:35 AM
S-38
CHAPTER 3
S U P P LY A N D D E M A N D
Solution 4.
a. Case 1: Journalists are an input in the production of newspapers; an increase in their salaries will cause newspaper publishers to reduce the quantity supplied at any given price. This represents a leftward shift of the supply curve from S1 to S2 and results in a rise in the equilibrium price and a fall in the equilibrium quantity as the equilibrium changes from E1 to E2. Price of newspaper
S2
P2
S1
E2 E1
P1
D Q2
Q1 Quantity of newspapers
Case 2: Townspeople will wish to purchase more newspapers at any given price. This represents a rightward shift of the demand curve from D1 to D2 and leads to a rise in both the equilibrium price and quantity as the equilibrium changes from E1 to E2. Price of newspaper
S P2
E2
P1
E1 D2 D1 Q1
Q2 Quantity of newspapers
b. Case 1: Fans will demand more St. Louis Rams memorabilia at any given price. This represents a rightward shift of the demand curve from D1 to D2 and leads to a rise in both the equilibrium price and quantity as the equilibrium changes from E1 to E2. Price of T-shirt
S E2
P2
E1
P1
D2 D1 Q1
KrugWellsECPS4e_Micro_CH03.indd S-38
Q2 Quantity of T-shirts
9/23/14 9:35 AM
CHAPTER 3
S U P P LY A N D D E M A N D
S-39
Case 2: Cotton is an input into T-shirts; an increase in its price will cause T-shirt manufacturers to reduce the quantity supplied at any given price, representing a leftward shift of the supply curve from S1 to S2. This leads to a rise in the equilibrium price and a fall in the equilibrium quantity as the equilibrium changes from E1 to E2. Price of T-shirt
S2
S1
E2
P2
E1
P1
D Q2
Q1 Quantity of T-shirts
c. Case 1: Consumers will demand fewer bagels at any given price. This represents a leftward shift of the demand curve from D1 to D2 and leads to a fall in both the equilibrium price and quantity as the equilibrium changes from E1 to E2. Price of bagel
S P1
E1 E2
P2
D1
D2 Q2
Q1
Quantity of bagels
Case 2: Consumers will demand more bagels (a substitute for cooked breakfasts) at any given price. This represents a rightward shift of the demand curve from D1 to D2 and leads to a rise in both the equilibrium price and quantity as the equilibrium changes from E1 to E2. Price of bagel
S
P2
E2 E1
P1
D1 Q1
KrugWellsECPS4e_Micro_CH03.indd S-39
Q2
D2
Quantity of bagels
9/23/14 9:35 AM
S-40
CHAPTER 3
S U P P LY A N D D E M A N D
d. Case 1: A greater quantity of textbooks will be demanded at any given price, representing a rightward shift of the demand curve from D1 to D2. Equilibrium price and quantity will rise as the equilibrium changes from E1 to E2. Price of textbook
S
P2
E2
P1
E1 D2 D1 Q1
Q2 Quantity of textbooks
Case 2: The textbook publisher will offer more textbooks for sale at any given price, representing a rightward shift of the supply curve from S1 to S2. Equilibrium price will fall and equilibrium quantity will rise as the equilibrium changes from E1 to E2. Price of textbook
S1
P1
S2
E1
P2
E2
D Q1
5.
Q2 Quantity of textbooks
Let’s assume that each person in the United States consumes an average of 37 gallons of soft drinks (nondiet) at an average price of $2 per gallon and that the U.S. population is 294 million. At a price of $1.50 per gallon, each individual consumer would demand 50 gallons of soft drinks. From this information about the individual demand schedule, calculate the market demand schedule for soft drinks for the prices of $1.50 and $2 per gallon.
5. Solution
The quantity demanded by an individual consumer at a price of $2 was 37 gallons, and there were 294 million consumers. Multiplying the quantity demanded at that price by each individual consumer gives us the market quantity demanded at that price: 294 million × 37 gallons = 10.9 billion gallons. Similarly, the market quantity demanded at a price of $1.50 would be 294 million × 50 gallons = 14.7 billion gallons.
KrugWellsECPS4e_Micro_CH03.indd S-40
9/23/14 9:35 AM
CHAPTER 3
6.
S U P P LY A N D D E M A N D
S-41
Suppose that the supply schedule of Maine lobsters is as follows: Price of lobster
Quantity of lobster supplied
(per pound)
(pounds)
$25
800
$20
700
$
$15
600
$
$10
500
$
$5
$400$
Suppose that Maine lobsters can be sold only in the United States. The U.S. demand schedule for Maine lobsters is as follows: Price of lobster
Quantity of lobster demanded
(per pound)
(pounds)
$25
200
$20
400
$
$15
600
$
$10
800
$
$5
1,000$
a. Draw the demand curve and the supply curve for Maine lobsters. What are the equilibrium price and quantity of lobsters? Now suppose that Maine lobsters can be sold in France. The French demand schedule for Maine lobsters is as follows: Price of lobster
Quantity of lobster demanded
(per pound)
(pounds)
$25
100
$20
300
$
$15
500
$
$10
700
$
$5
$900$
b. What is the demand schedule for Maine lobsters now that French consumers can also buy them? Draw a supply and demand diagram that illustrates the new equilibrium price and quantity of lobsters. What will happen to the price at which fishermen can sell lobster? What will happen to the price paid by U.S. consumers? What will happen to the quantity consumed by U.S. consumers?
KrugWellsECPS4e_Micro_CH03.indd S-41
9/23/14 9:35 AM
S-42
CHAPTER 3
S U P P LY A N D D E M A N D
Solution 6.
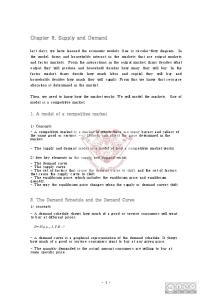
a. The equilibrium price of lobster is $15 per pound and the equilibrium quantity is 600 pounds, point E in the accompanying diagram. Price of lobster (per pound)
S
$25 20 Equilibrium price
E
15 10 5
D
0
200 300 400 500 600 700 800 900 1,000 Equilibrium quantity
Quantity of lobster (pounds)
b. The new demand schedule is obtained by adding together, at any given price, the quantity demanded by American consumers and the quantity demanded by French consumers, as shown in the accompanying table. Price of lobster (per pound)
Quantity of lobster demanded (U.S. pounds plus French pounds)
$25
300
20
700
15
1,100
10
1,500
5
1,900
The new equilibrium price of lobster is $20 per pound and the new equilibrium quantity is 700 pounds, point E in the accompanying diagram. The opportunity to sell to French consumers makes Maine fishermen better off: they sell more lobster and at a higher price than before. U.S. consumers, however, are made worse off: they must pay a higher price for lobster ($20 versus $15 per pound) and, as a result, consume less lobster (400 versus 600 pounds). Price of lobster (per pound)
S
$25 Equilibrium price
E
20 15 10 5 0
D 300
700 Equilibrium quantity
KrugWellsECPS4e_Micro_CH03.indd S-42
1,100
1,500
1,900
Quantity of lobster (pounds)
9/23/14 9:35 AM
CHAPTER 3
7.
S U P P LY A N D D E M A N D
S-43
Find the flaws in reasoning in the following statements, paying particular attention to the distinction between shifts of and movements along the supply and demand curves. Draw a diagram to illustrate what actually happens in each situation. a. “A technological innovation that lowers the cost of producing a good might seem at first to result in a reduction in the price of the good to consumers. But a fall in price will increase demand for the good, and higher demand will send the price up again. It is not certain, therefore, that an innovation will really reduce price in the end.” b. “A study shows that eating a clove of garlic a day can help prevent heart disease, causing many consumers to demand more garlic. This increase in demand results in a rise in the price of garlic. Consumers, seeing that the price of garlic has gone up, reduce their demand for garlic. This causes the demand for garlic to decrease and the price of garlic to fall. Therefore, the ultimate effect of the study on the price of garlic is uncertain.”
Solution 7.
a. This statement confuses a shift of a curve with a movement along a curve. A technological innovation lowers the cost of producing the good, leading producers to offer more of the good at any given price. This is represented by a rightward shift of the supply curve from S1 to S2. As a result, the equilibrium price falls and the equilibrium quantity rises, as shown by the change from E1 to E2. The statement “but a fall in price will increase demand for the good, and higher demand will send the price up again” is wrong for the following reasons. A fall in price does increase the quantity demanded and leads to an increase in the equilibrium quantity as one moves down along the demand curve. But it does not lead to an increase in demand—a rightward shift of the demand curve—and therefore does not cause the price to go up again. Price
S1
S2
E1
P1
E2
P2
D Q1
KrugWellsECPS4e_Micro_CH03.indd S-43
Q2
Quantity
9/23/14 9:35 AM
S-44
CHAPTER 3
S U P P LY A N D D E M A N D
b. This statement also confuses a shift of a curve with a movement along a curve. The health report generates an increase in demand—a rightward shift of the demand curve from D1 to D2. This leads to a higher equilibrium price and quantity as we move up along the supply curve, and the equilibrium changes from E1 to E2. The following statements are wrong: “Consumers, seeing that the price of garlic has gone up, reduce their demand for garlic. This causes the demand for garlic to decrease and the price of garlic to fall.” They are wrong because they imply that the rise in the equilibrium price causes the demand for garlic to decrease—a leftward shift of the demand curve. But a rise in the equilibrium price via a movement along the supply curve does not cause the demand curve to shift leftward. Price
S E2
P2
E1
P1
D2
D1 Q1
8.
Q2
Quantity
The following table shows a demand schedule for a normal good. Price
Quantity demanded
$23
70
$21
90
$19
110
$17
130
a. Do you think that the increase in quantity demanded (say, from 90 to 110 in the table) when price decreases (from $21 to $19) is due to a rise in consumers’ income? Explain clearly (and briefly) why or why not. b. Now suppose that the good is an inferior good. Would the demand schedule still be valid for an inferior good? c. Lastly, assume you do not know whether the good is normal or inferior. Devise an experiment that would allow you to determine which one it was. Explain.
Solution 8.
a. The increase in quantity demanded from 90 to 110 when the price declines from $21 to $19 is not due to a rise in consumers’ income. Rather, it represents a movement along the demand curve as the price falls. In contrast, a rise in consumers’ income causes the demand curve to shift rightward for a normal good; as a result, the quantity demanded will increase at any given price.
b. This demand schedule is valid for an inferior good because inferior goods obey the law of demand: a rise in the price leads to a fall in the quantity demanded, other things equal. c. You can determine whether a good is normal or inferior only by examining what happens to the demand after consumers’ income changes. A rise in income leads to an increase in demand for a normal good and a decrease in demand for an inferior good. A fall in income leads to a decrease in demand for a normal good and an increase in demand for an inferior good. So a suitable experiment would
KrugWellsECPS4e_Micro_CH03.indd S-44
9/23/14 9:35 AM
CHAPTER 3
S U P P LY A N D D E M A N D
S-45
be to raise consumers’ income: if the quantity demanded at any given price rises, the good is normal; if the quantity demanded at any given price falls, the good is inferior. If you experiment by reducing consumers’ income, the results are reversed for the two types of goods.
9.
In recent years, the number of car producers in China has increased rapidly. In fact, China now has more car brands than the United States. In addition, car sales have climbed every year and automakers have increased their output at even faster rates, causing fierce competition and a decline in prices. At the same time, Chinese consumers’ incomes have risen. Assume that cars are a normal good. Draw a diagram of the supply and demand curves for cars in China to explain what has happened in the Chinese car market.
9. Solution
As more automakers enter the Chinese market, the supply curve shifts to the right, from S1 to S2. And as Chinese consumers’ incomes rise, the demand curve for cars shifts to the right, from D1 to D2, because cars are a normal good. As a result, the equilibrium moves from its initial position at E1 to the new equilibrium at E2, and the quantity of cars bought and sold increases from Q1 to Q2. This accounts for the rapid increase in sales. Since the question mentions a decline in prices, the rightward shift of the supply curve must have been greater than the rightward shift of the demand curve. Price of car
P1
S1
S2
E1 E2
P2
D1 Q1
10.
Q2
D2 Quantity of cars
Aaron Hank is a star hitter for the Bay City baseball team. He is close to breaking the major league record for home runs hit during one season, and it is widely anticipated that in the next game he will break that record. As a result, tickets for the team’s next game have been a hot commodity. But today it is announced that, due to a knee injury, he will not in fact play in the team’s next game. Assume that season ticketholders are able to resell their tickets if they wish. Use supply and demand diagrams to explain your answers to parts a and b. a. Show the case in which this announcement results in a lower equilibrium price and a lower equilibrium quantity than before the announcement. b. Show the case in which this announcement results in a lower equilibrium price and a higher equilibrium quantity than before the announcement. c. What accounts for whether case a or case b occurs? d. Suppose that a scalper had secretly learned before the announcement that Aaron Hank would not play in the next game. What actions do you think he would take?
KrugWellsECPS4e_Micro_CH03.indd S-45
9/23/14 9:35 AM
S-46
CHAPTER 3
S U P P LY A N D D E M A N D
Solution 10.
a. Fewer fans want to attend the next game after the announcement is made. As a result, the demand curve will shift leftward from D1 to D2, as fewer tickets are demanded at any given price; other things equal, this results in a fall in both equilibrium price and quantity. In addition, the supply curve will shift rightward from S1 to S2, as more season ticket-holders are willing to sell tickets at any given price. Other things equal, this results in a fall in equilibrium price and a rise in equilibrium quantity. In this case, the leftward shift of the demand curve exceeds the rightward shift of the supply curve; as a result, equilibrium quantity falls, shown by the change of the equilibrium from E1 to E2. Price of ticket
E1
P1
P2
S1
S2
E2 D1 D2 Q2
Q1
Quantity of tickets
b. The supply and demand curves shift in the same manner as in part a, but in this case the rightward shift of the supply curve exceeds the leftward shift of the demand curve. Consequently, equilibrium quantity rises, shown by the change of the equilibrium from E1 to E2. Price of ticket
P1
P2
S1
E1
S2
E2
D2 Q1 Q2
D1 Quantity of tickets
c. Case a (equilibrium quantity falls) occurs because the decrease in demand exceeds the increase in supply. Case b (equilibrium quantity rises) occurs because the increase in supply exceeds the decrease in demand. d. A scalper who learns about the announcement secretly should take actions—such as lowering price somewhat—that ensure that he will sell all of his tickets before the announcement is made. He will do this because he knows a ticket will command a much lower price after the announcement. An expectation that the price will be lower in the future causes supply to increase today.
KrugWellsECPS4e_Micro_CH03.indd S-46
9/23/14 9:35 AM
CHAPTER 3
11.
S U P P LY A N D D E M A N D
S-47
Fans of rock and rock stars often bemoan the high price of concert tickets. One superstar has argued that it isn’t worth hundreds, even thousands, of dollars to hear him and his band play. Let’s assume this star sold out arenas around the country at an average ticket price of $75. a. How would you evaluate the argument that ticket prices are too high? b. Suppose that due to this star’s protests, ticket prices were lowered to $50. In what sense is this price too low? Draw a diagram using supply and demand curves to support your argument. c. Suppose the rock superstar really wanted to bring down ticket prices. Since he and his band control the supply of their services, what do you recommend they do? Explain using a supply and demand diagram. d. Suppose the band’s next album was a total dud. Do you think they would still have to worry about ticket prices being too high? Why or why not? Draw a supply and demand diagram to support your argument. e. Suppose the group announced their next tour was going to be their last. What effect would this likely have on the demand for and price of tickets? Illustrate with a supply and demand diagram.
Solution 11.
a. If markets are competitive, the ticket price is simply the equilibrium price: the price at which quantity supplied is equal to quantity demanded. No one is “made” to pay $75 to go to a concert: a potential concert-goer will pay $75 if going to the concert seems worth that amount and will choose to do something else if it isn’t. b. At $50 each, the quantity of tickets demanded exceeds the quantity of tickets supplied. There is a shortage of tickets at this price, shown by the difference between the quantity demanded at this price, QD, and the quantity supplied at this price, QS. Price of ticket
S
$75
E
50 Shortage 0
KrugWellsECPS4e_Micro_CH03.indd S-47
QS
D QD Quantity of tickets
9/23/14 9:35 AM
S-48
CHAPTER 3
S U P P LY A N D D E M A N D
c. The band can lower the average price of a ticket by increasing supply: give more concerts. This is shown as a rightward shift of the supply curve from S1 to S2, resulting in a lower equilibrium price and a higher equilibrium quantity, shown by the change of the equilibrium from E1 to E2. Price of ticket
S1 S2
P1
E1
P2
E2
D Q1
Q2 Quantity of tickets
d. If the band’s CD is a total dud, the demand for concert tickets is likely to decrease. This represents a leftward shift of the demand curve from D1 to D2, resulting in a lower equilibrium price and quantity as the equilibrium changes from E1 to E2. This is likely to eliminate the worry that ticket prices are “too high.” Price of ticket
S
P1
E1
P2
E2
D2 Q2
Q1
D1 Quantity of tickets
e. The announcement that this is the group’s last tour causes the demand for tickets to increase. This is represented by a rightward shift of the demand curve from D1 to D2, resulting in an increase in both the equilibrium price and quantity as the equilibrium changes from E1 to E2. Price of ticket
S
P2
E2
P1
E1
D1 Q1
KrugWellsECPS4e_Micro_CH03.indd S-48
Q2
D2 Quantity of tickets
9/23/14 9:35 AM
CHAPTER 3
12.
S U P P LY A N D D E M A N D
S-49
After several years of decline, the market for handmade acoustic guitars is making a comeback. These guitars are usually made in small workshops employing relatively few highly skilled luthiers. Assess the impact on the equilibrium price and quantity of handmade acoustic guitars as a result of each of the following events. In your answers indicate which curve(s) shift(s) and in which direction. a. Environmentalists succeed in having the use of Brazilian rosewood banned in the United States, forcing luthiers to seek out alternative, more costly woods. b. A foreign producer reengineers the guitar-making process and floods the market with identical guitars. c. Music featuring handmade acoustic guitars makes a comeback as audiences tire of heavy metal and alternative rock music. d. The country goes into a deep recession and the income of the average American falls sharply.
Solution 12.
a. The cost of producing handmade acoustic guitars rises as more costly woods are used to construct them. This reduces supply, as luthiers offer fewer guitars at any given price. This is represented by a leftward shift of the supply curve and results in a rise in the equilibrium price and a fall in the equilibrium quantity. b. This represents a rightward shift of the supply curve, resulting in a fall in the equilibrium price and a rise in the equilibrium quantity. c. As more people demand music played on acoustic guitars, the demand for these guitars by musicians increases as well. (Acoustic guitars are an input into the production of this music.) This represents a rightward shift of the demand curve, leading to a higher equilibrium price and quantity. d. If average American income falls sharply, then the demand for handmade acoustic guitars will decrease sharply as well because they are a normal good. This is represented by a leftward shift of the demand curve, leading to a lower equilibrium price and quantity.
13.
Demand twisters: Sketch and explain the demand relationship in each of the following statements. a. I would never buy a Miley Cyrus album! You couldn’t even give me one for nothing. b. I generally buy a bit more coffee as the price falls. But once the price falls to $2 per pound, I’ll buy out the entire stock of the supermarket. c. I spend more on orange juice even as the price rises. (Does this mean that I must be violating the law of demand?) d. Due to a tuition rise, most students at a college find themselves with less disposable income. Almost all of them eat more frequently at the school cafeteria and less often at restaurants, even though prices at the cafeteria have risen, too. (This one requires that you draw both the demand and the supply curves for school cafeteria meals.)
KrugWellsECPS4e_Micro_CH03.indd S-49
9/23/14 9:35 AM
S-50
CHAPTER 3
S U P P LY A N D D E M A N D
Solution 13.
a. In this case, the quantity demanded is zero regardless of the price. So this person’s demand curve for Miley Cyrus albums is a vertical line at the quantity of zero— that is, a vertical line that lies on top of the vertical axis. Price of Miley Cyrus album
D
0
Quantity of Miley Cyrus albums
b. The person here has the typical downward-sloping demand curve for coffee until it reaches the price of $2 per pound, at which point it becomes horizontal, showing that he or she would buy a very large quantity at that price. Price of coffee (per pound)
$2
D
0
Quantity of coffee (pounds)
c. This person does not necessarily violate the law of demand: the quantity of orange juice demanded may in fact fall as price goes up. The likely explanation is the following: spending is price times the quantity demanded. Although price goes up, the total amount of money this person spends on orange juice rises because he or she does not reduce the quantity demanded enough to offset the increased cost per unit. This person will have a steep demand curve as shown in the diagram: quantity demanded falls as price rises, but the fall in quantity demanded is proportionately less than the rise in price. Price of orange juice
P2 Large price increase P1 D Q2 Q1
Quantity of orange juice
Small quantity decrease
KrugWellsECPS4e_Micro_CH03.indd S-50
9/23/14 9:35 AM
CHAPTER 3
S U P P LY A N D D E M A N D
S-51
d. Since students’ income has fallen, but the demand for cafeteria meals has increased, cafeteria meals must be an inferior good. The rightward shift of the demand curve, from D1 to D2, results in an increase in the equilibrium price and quantity of cafeteria meals, as the equilibrium changes from E1 to E2. Price of meal
S
E2
P2 E1
P1
D2 D1 Q1
14.
Q2
Quantity of meals
Will Shakespeare is a struggling playwright in sixteenth-century London. As the price he receives for writing a play increases, he is willing to write more plays. For the following situations, use a diagram to illustrate how each event affects the equilibrium price and quantity in the market for Shakespeare’s plays. a. The playwright Christopher Marlowe, Shakespeare’s chief rival, is killed in a bar brawl. b. The bubonic plague, a deadly infectious disease, breaks out in London. c. To celebrate the defeat of the Spanish Armada, Queen Elizabeth declares several weeks of festivities, which involves commissioning new plays.
Solution 14.
a. The death of Marlowe means that the supply of a substitute good (Marlowe’s plays) has decreased. As a result, the demand for Shakespeare’s plays will increase, inducing a rightward shift of the demand curve in the market for Shakespeare’s plays from D1 to D2. As a result, equilibrium price and quantity will rise as the equilibrium changes from E1 to E2. Price of Shakespeare play
S
P2
E2
P1
E1 D2 D1 Q1
Q2 Quantity of Shakespeare plays
KrugWellsECPS4e_Micro_CH03.indd S-51
9/23/14 9:35 AM
S-52
CHAPTER 3
S U P P LY A N D D E M A N D
b. After the outbreak of the plague, fewer Londoners will wish to see Shakespeare’s plays to avoid contracting the illness, inducing a leftward shift of the demand curve from D1 to D2. Equilibrium price and quantity will fall as the equilibrium changes from E1 to E2. Price of Shakespeare play
S
P1
E1
P2
E2 D1 D2 Q2
Q1 Quantity of Shakespeare plays
c. Queen Elizabeth’s commissions result in a greater quantity of Shakespeare’s plays demanded at any given price. This represents a rightward shift of the demand curve from D1 to D2, resulting in a higher equilibrium price and quantity as the equilibrium changes from E1 to E2. Price of Shakespeare play
S
P2
E2
P1
E1 D2 D1 Q1
Q2 Quantity of Shakespeare plays
15.
This year, the small town of Middling experiences a sudden doubling of the birth rate. After three years, the birth rate returns to normal. Use a diagram to illustrate the effect of these events on the following. a. The market for an hour of babysitting services in Middling this year b. The market for an hour of babysitting services 14 years into the future, after the birth rate has returned to normal, by which time children born today are old enough to work as babysitters c. The market for an hour of babysitting services 30 years into the future, when children born today are likely to be having children of their own
KrugWellsECPS4e_Micro_CH03.indd S-52
9/23/14 9:35 AM
CHAPTER 3
S U P P LY A N D D E M A N D
S-53
Solution 15.
a. There are more babies today, so the demand for an hour of babysitting services has increased. This produces a rightward shift of the demand curve for babysitting services from D1 to D2, resulting in a rise in the equilibrium price and quantity as the equilibrium changes from E1 to E2. Price of babysitting services
S
P2
E2
E1
P1
D2 D1 Q2
Q1
Quantity of babysitting services
b. The children born today will cause an increase in the supply of babysitters available 14 years from now, when there will be a rightward shift of the supply curve for babysitting services from S1 to S2. This will result in a lower equilibrium price and a higher equilibrium quantity as the equilibrium changes from E1 to E2. Price of babysitting services
S1 S2
P1
E1
E2
P2
D Q2
Q1
Quantity of babysitting services
c. It is likely that there will be an increase in the number of babies born 30 years from now. Therefore, there will be an increase in the demand for babysitting services, shifting the demand curve rightward from D1 to D2. This will result in a higher equilibrium quantity and price as the equilibrium changes from E1 to E2. Price of babysitting services
S E2
P2 P1
E1 D2 D1 Q1
Q2 Quantity of babysitting services
KrugWellsECPS4e_Micro_CH03.indd S-53
9/23/14 9:35 AM
S-54
CHAPTER 3
S U P P LY A N D D E M A N D
16.
Use a diagram to illustrate how each of the following events affects the equilibrium price and quantity of pizza. a. The price of mozzarella cheese rises. b. The health hazards of hamburgers are widely publicized. c. The price of tomato sauce falls. d. The incomes of consumers rise, and pizza is an inferior good. e. Consumers expect the price of pizza to fall next week.
Solution 16.
a. Mozzarella is an input in the production of pizza. Since the cost of an input has risen, pizza producers will reduce the quantity supplied at any given price, a leftward shift of the supply curve from S1 to S2. As a result, the equilibrium price of pizza will rise and the equilibrium quantity will fall as the equilibrium changes from E1 to E2. Price of pizza
S2 S1
P2
E2
P1
E1 D Q2
Q1
Quantity of pizza
b. Consumers will substitute pizza in place of hamburgers, resulting in an increased demand for pizza at any given price. This generates a rightward shift of the demand curve from D1 to D2, leading to a rise in the equilibrium price and quantity as the equilibrium changes from E1 to E2. Price of pizza
S E2 P2 P1
E1 D2 D1 Q1
KrugWellsECPS4e_Micro_CH03.indd S-54
Q2 Quantity of pizza
9/23/14 9:35 AM
CHAPTER 3
S U P P LY A N D D E M A N D
S-55
c. Tomato sauce is an input in the production of pizza. Since the cost of an input has fallen, pizza producers will increase the quantity supplied at any given price, a rightward shift of the supply curve from S1 to S2. As a result, the equilibrium price of pizza will fall and the equilibrium quantity will rise as the equilibrium changes from E1 to E2. Price of pizza
S1 S2
P1
E1
P2
E2 D Q1
Q2
Quantity of pizza
d. The demand for an inferior good decreases when the incomes of consumers rise. So a rise in consumer incomes produces a leftward shift of the demand curve from D1 to D2, resulting in a lower equilibrium price and quantity as the equilibrium changes from E1 to E2. Price of pizza
S
P1
E1
P2
E2 D1 D2 Q1
Q2
Quantity of pizza
e. Consumers will delay their purchases of pizza today in anticipation of consuming more pizza next week. As a result, the demand curve shifts leftward from D1 to D2, resulting in a lower equilibrium price and quantity as the equilibrium changes from E1 to E2. Price of pizza
S
P1
E1
P2
E2 D1 D2 Q2
KrugWellsECPS4e_Micro_CH03.indd S-55
Q1 Quantity of pizza
9/23/14 9:35 AM
S-56
CHAPTER 3
S U P P LY A N D D E M A N D
17.
Although he was a prolific artist, Pablo Picasso painted only 1,000 canvases during his “Blue Period.” Picasso is now dead, and all of his Blue Period works are currently on display in museums and private galleries throughout Europe and the United States. a. Draw a supply curve for Picasso Blue Period works. Why is this supply curve different from ones you have seen? b. Given the supply curve from part a, the price of a Picasso Blue Period work will be entirely dependent on what factor(s)? Draw a diagram showing how the equilibrium price of such a work is determined. c. Suppose rich art collectors decide that it is essential to acquire Picasso Blue Period art for their collections. Show the impact of this on the market for these paintings.
Solution 17.
a. There are no more Picasso Blue Period works available. Hence the supply curve is a vertical line at the quantity 1,000. S
Price of painting
0
1,000 Quantity of paintings
b. Since supply is fixed, the price of a Picasso Blue Period work is entirely determined by demand. Any change in demand is fully reflected in a change in price. Price of painting
Equilibrium price
S
E
D 0
KrugWellsECPS4e_Micro_CH03.indd S-56
1,000 Quantity of paintings
9/23/14 9:35 AM
CHAPTER 3
S U P P LY A N D D E M A N D
S-57
c. This results in a rightward shift of the demand curve for these works from D1 to D2, and the equilibrium changes from E1 to E2. But since no more works are available, this increase in demand simply results in an increase in the equilibrium price. Price of painting
S
P2
E2
P1
E1 D2 D1
0
18.
1,000
Quantity of paintings
Draw the appropriate curve in each of the following cases. Is it like or unlike the curves you have seen so far? Explain. a. The demand for cardiac bypass surgery, given that the government pays the full cost for any patient b. The demand for elective cosmetic plastic surgery, given that the patient pays the full cost c. The supply of reproductions of Rembrandt paintings
Solution 18.
a. Since the government pays the full cost of cardiac bypass surgery, the price paid by the patient is always zero. Consequently, the demand for surgery is constant, regardless of the price actually paid by the government. The quantity demanded is constant at the quantity that would be demanded by patients if the government, not the patient, pays for surgery. That is, it is a vertical line at the quantity that patients would demand if the price of surgery to them were zero. Price of cardiac surgery
D
Quantity of cardiac surgeries
KrugWellsECPS4e_Micro_CH03.indd S-57
9/23/14 9:35 AM
S-58
CHAPTER 3
S U P P LY A N D D E M A N D
b. In this case, the patient must pay the cost of the surgery, so the quantity demanded is affected by price, and the demand curve has its usual downward-sloping shape. Price of cosmetic surgery
D Quantity of cosmetic surgeries
c. The supply of Rembrandt reproductions is not fixed because they can be created by existing artists. So the supply curve of these reproductions has the familiar upward-sloping shape. S
Price of reproduction Rembrandt painting
Quantity of reproduction Rembrandt paintings
19.
The accompanying table gives the annual U.S. demand and supply schedules for pickup trucks. Quantity of trucks demanded
Quantity of trucks supplied
(millions)
(millions)
$20,000
20
14
$25,000
18
15
$30,000
16
16
$35,000
14
17
$40,000
12
18
Price of truck
a. Plot the demand and supply curves using these schedules. Indicate the equilibrium price and quantity on your diagram. b. Suppose the tires used on pickup trucks are found to be defective. What would you expect to happen in the market for pickup trucks? Show this on your diagram. c. Suppose that the U.S. Department of Transportation imposes costly regulations on manufacturers that cause them to reduce supply by one-third at any given price. Calculate and plot the new supply schedule and indicate the new equilibrium price and quantity on your diagram.
KrugWellsECPS4e_Micro_CH03.indd S-58
9/23/14 9:35 AM
CHAPTER 3
S U P P LY A N D D E M A N D
S-59
19. Solution
a. The supply curve is S1 and the demand curve is D1. The equilibrium in the market for pickup trucks is indicated by point E1, with an equilibrium price of $30,000 and an equilibrium quantity of 16 million trucks bought and sold. Price of truck
S1
$40,000 35,000 Equilibrium price
E1
30,000 25,000 20,000 0
D1 12
13
14
15
16
17
18
19
20
Quantity of trucks (millions)
Equilibrium quantity
b. The announcement of a defect is likely to decrease the demand for pickup trucks. This is represented by a leftward shift of the demand curve, as shown by the shift from D1 to D2, and causes the equilibrium price and quantity to fall as the equilibrium changes from E1 to E2. Price of truck
S1
E1
P1 E2
P2
D2 Q2
Q1
D1
Quantity of trucks (millions)
c. The new supply schedule is as follows. Price of truck
Quantity of trucks supplied (millions)
$20,000
9.3
25,000
10.0
30,000
10.7
35,000
11.3
40,000
12.0
KrugWellsECPS4e_Micro_CH03.indd S-59
9/23/14 9:35 AM
S-60
CHAPTER 3
S U P P LY A N D D E M A N D
This one-third decrease in the quantity supplied at any given price is shown as a leftward shift of the supply curve from S1 to S2. It results in a new, higher equilibrium price, $40,000 per truck, and a lower equilibrium quantity, 12 million trucks, as shown by the change of the equilibrium from E1 to E3. Price of truck
S2 P3 $40,000 35,000 P1
S1
E3 E1
30,000 25,000 20,000 0
D1 9
10 11 12 13 14 15 16 17 18 19 20 Q3 Q1 Quantity of trucks (millions)
KrugWellsECPS4e_Micro_CH03.indd S-60
9/23/14 9:35 AM