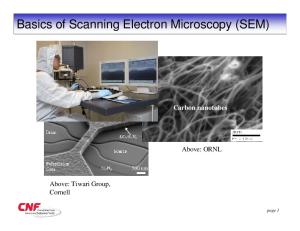
SEM Scanning Electron Microscope A To Z Basic Knowledge For Using The SEM
Serving Advanced Technology
Basic Knowledge For Using The SEM
Since the Scanning Electron Microscope (SEM) was first commercialized about 40 years ago, the SEM has shown a remarkable progress. Now, many types of SEMs are being used, and their performance and functions are greatly different from each other. To utilize these different SEMs, it is essential to recognize their features, as well as to understand the reasons for the contrast of SEM images. Thus, this document material is aimed at helping SEM users and future SEM users to understand the basics of the SEM, including the instrument principles, specimen preparation and elemental analysis.
Contents Construction of SEM ..................................................................................................3 Construction of Instrument Electron Gun Construction of Lens Condenser Lens and Objective Lens Specimen Stage Secondary Electron Detector Image Display and Recording Vacuum System
Magnification of SEM................................................................................................7 Depth of Focus of SEM ..............................................................................................8 Why Images Are Visible?..........................................................................................9 Interactions of Electrons with Substances Secondary Electrons Backscattered Electrons Edge Effect Influence of Accelerating Voltage Illumination Effect of Secondary Electron Detector Illumination Effect of Backscattered Electron Detector
To Improve Image Resolution ................................................................................15 Resolution and Resolving Power To Improve Resolution
Types of Electron Guns............................................................................................16 Filed-Emission Electron Gun Schottky-Emission Electron Gun Features of Three Types of Electron Guns
Types and Capabilities of Objective Lenses .......................................................18 Conventional Objective Lens Strongly Excited Objective Lens for High Resolution Role of Objective Lens Aperture
Actual Resolution of SEM.......................................................................................20 Charging and Its Influence .....................................................................................21 What is Charging? Influence of Charging on SEM Image To Prevent Charging
Basics of Specimen Preparation...........................................................................24 Exposing Surface to Observe and Contrast Enhancement Mounting Specimen Coating Treatment of Biological Specimen
Low Vacuum SEM ....................................................................................................26 Basics of Elemental Analysis ................................................................................27 Generation of X-rays X-ray Spectrometer Qualitative Analysis X-ray Mapping Analysis Area Quantitative Analysis Analysis of Non-conductive Specimen
History ........................................................................................................................31
2
The Scanning Electron Microscope (SEM) is used for observation of specimen surfaces. When the specimen is irradiated with a fine electron beam (called an electron probe), secondary electrons are emitted from the specimen surface. Topography of the surface can be observed by two-dimensional scanning of the electron probe over the surface and acquisition of an image from the detected secondary electrons.
Construction of SEM Electron gun
Construction of Instrument The SEM requires an electron optical system to produce an electron probe, a specimen stage to place the specimen, a secondary-electron detector to collect secondary electrons, an image display unit, and an operation system to perform various operations (Fig. 1). The electron optical system consists of an electron gun, a condenser lens and an objective lens to produce an electron probe, a scanning coil to scan the electron probe, and other components. The electron optical system (inside of the microscope column) and a space surrounding the specimen are kept at vacuum.
Condenser lens
Scanning coil Display unit Objective lens
Specimen
Secondary electron detector
Fig. 1 Basic construction of a SEM.
Electron Gun
Filament heating power supply
The electron gun produces an electron beam. Its construction is shown in Fig. 2. Note that this is a thermionic emission gun (TE gun). Thermoelectrons are emitted from a filament (cathode) made of a thin tungsten wire (about 0.1 mm) by heating the filament at high temperature (about 2800K). These thermoelectrons are gathered as an electron beam, flowing into the metal plate (anode) by applying a positive voltage (1 to 30 kV) to the anode. If a hole is made at the center of the anode, the electron beam flows through this hole. When you place an electrode (called a Wehnelt electrode) between the cathode and anode and apply a negative voltage to it, you can adjust the current of the electron beam. At this time, the electron beam is finely focused by the action of the Wehnelt electrode. The finest point of the beam is called the crossover, and this is regarded as an actual electron source with a diameter of 15 to 20 µm. The TE gun, explained here, is most generally used. An LaB 6 single crystal is also used as a cathode, but it requires a higher vacuum because of its high activity. Other electron guns are the field-emission electron gun (FE gun) or the Schottky-emission electron gun (SE gun) (see page 16).
Bias power supply
+ -
Filament
Wehnelt electrode
Crossover ~ 15 µm Accelerating voltage power supply
Anode
Fig. 2 Construction of an electron gun.
3
+
Construction of Lens
Optical axis
An electron microscope generally uses a magnetic lens. When you pass a direct electric current through a coilwound electric wire, a rotationally-symmetric magnetic field is formed and a lens action is produced on an electron beam. To make a strong magnetic lens (with a short focal length), it is necessary to increase the density of the magnetic line. Thus, as shown in Fig. 3, the surroundings of the coil are enclosed by yokes so that part of the magnetic field leaks from a narrow gap. A portion with a narrow gap, called “polepiece,” is fabricated with a high accuracy. The main feature of the magnetic lens is that when you change the current passing through the coil, the strength of the lens is also changed. This is not achieved by an optical lens.
Yoke
Coil
Polepieces
Fig. 3 Construction of a magnetic lens.
Condenser Lens and Objective Lens Placing a lens below the electron gun enables you to adjust the diameter of the electron beam. A fine electron beam (probe) is required for the SEM. Figure 4 illustrates the formation of a fine electron probe. Two-stage lenses, which combine the condenser and objective lenses, are located below the electron gun. The electron beam from the electron gun is focused by the two-stage lenses, and a small electron probe is produced.
Fig. 4 Formation of the electron probe by the lenses.
•Role of the condenser lens If the lens action of the condenser lens is strengthened, the electron probe becomes narrower with a smaller ratio of b/a, whereas if weakened, the electron probe becomes broader. The “aperture” is placed between the condenser lens and objective lens. The “aperture,” made of a thin metal plate, has a small hole. The electron beam, which passed through the condenser lens, illluminates this aperture-plate. The aperture allows a part of the electron beam to reach the objective lens. If the excitation of the condenser lens is increased, the electron beam greatly broadens on the aperture and therefore, the number of the electrons (amount of probe current) reaching the objective lens is decreased. To the contrary, if the excitation of the condenser lens is decreased, the electron beam does not broaden very much and therefore, most of the electrons pass through the aperture and many electrons reach the objective lens. That is, the adjustment of the excitation of the condenser lens enables you to change the electron-probe diameter and the probe current. However, even if the excitation of the condenser lens is infinitely increased, the diameter of the electron probe does not become infinitely small. This topic will be explained on page 15.
4
•Role of the objective lens The objective lens is used for focusing, and this lens is a very important lens that determines the final diameter of the electron probe. If the performance of the objective lens is not good, an optimally-fine electron probe cannot be produced despite all of the efforts before the action of the objective lens. Thus, it is crucial to make the objective lens with the best performance.
Specimen Stage In general, the specimen is observed at a high magnification in an electron microscope. Thus, a specimen stage, which stably supports the specimen and moves smoothly, is required. The specimen stage for a SEM can perform the following movements: horizontal movement (X, Y), vertical movement (Z), specimen tilting (T), and rotation (R). The X and Y movements are used for the selection of a field of view. While the Z movement provides the change of image resolution (see page 15) and the depth of focus (see page 8). Figure 5 shows the construction of the specimen stage.
Electron probe
Rotation (R) Vertical (Z)
Horizontal plane (Y) Horizontal plane (X) Tilt (T)
Fig. 5 Construction of the specimen stage.
Most SEMs use the eucentric specimen stage. By the use of this stage, the observation area does not shift while tilting the specimen and also, the focus on the specimen does not change after shifting the field of view while the specimen is tilted. In addition to a conventional manual-drive stage, the use of motor-drive stages has increased in recent years. Furthermore, the use of a computer-controlled specimen stage has been increasing. With this stage, you can move the stage to a selected point by simply clicking a mouse, restore the stage to a desired observed point, and use more sophisticated eucentric capabilities.
5
Secondary Electron Detector The secondary electron detector is used for detecting the secondary electrons emitted from the specimen. Its construction is shown in Fig. 6. A scintillator (fluorescent substance) is coated on the tip of the detector and a high voltage of about 10 kV is applied to it. The secondary electrons from the specimen are attracted to this high voltage and then generate light when they hit the scintillator. This light is directed to a photo-multiplier tube (PMT) through a light guide. Then, the light is converted to electrons, and these electrons are amplified as an electric signal. A supplementary electrode, called the collector, is placed before the scintillator. In general, in order to help the scintillator acquire secondary electrons, a few hundred volts is applied to this collector. By changing this voltage, you can control the number of secondary electrons to be collected. This type of the detector was originally developed by Everhart and Thornley, so this detector can be called the E-T detector. Many SEMs incorporate this detector in the specimen chamber; however, when a SEM is equipped with a strongly excited objective lens for higher resolution (see page 19), a secondary electron detector is placed above the objective lens and secondary electrons are detected by utilizing the lens magnetic fields. This detector is often called the TTL (Through The Lens) detector.
Fig. 6 Construction of the secondary electron detector.
Image Display and Recording The output signals from the secondary electron detector are amplified and then transferred to the display unit. Since the scanning on the display unit is synchronized with the electron-probe scan, brightness variation, which depends on the number of the secondary electrons, appears on the monitor screen on the display unit, thus forming a SEM image. A cathode-ray tube (CRT) was used for many years as a display unit; however in recent years, a liquid-crystal display (LCD) has been widely used. In general, the scan speed of the electron probe can be changed in several steps, An extremely fast scan speed is used for observation and a slow scan speed is used for acquisition or saving of images. To record an SEM image, in the past, the SEM image appearing on the CRT was photographed with a camera. But recently, the image has been recorded in a digital format (electronic file). This is because it is now difficult to get a high-resolution CRT and there are many advantages of electronic file. That is, it is easier to process images and convenient to send or receive image information. Note that an image format with 1M pixels is generally used for the electronic file.
Vacuum System The inside of the electron optical system and the specimen chamber must be kept at a high vacuum of 10-3 to 10-4 Pa. Thus, these components are evacuated generally by a diffusion pump. If a user desires an oil-free environment, a turbo molecular pump may be used. When a SEM incorporates an FE gun (explained later), a sputter ion pump is used because the FE gun needs an ultrahigh vacuum. To exchange a specimen, either of two methods is applied. One vents the entire specimen chamber at the time of specimen exchange. The other uses a specimen pre-evacuation chamber (airlock chamber) while keeping a high vacuum in the specimen chamber.
6
Magnification of SEM When the specimen surface is two-dimensionally scanned by the electron probe, a SEM image appears on the monitor screen of the display unit. At this time, if the scan width of the electron probe is changed, the magnification of the displayed SEM image is also changed. Since the size of the monitor screen is unchanged, decreasing the scan width increases the magnification, whereas increasing the scan width decreases the magnification. Figure 7 shows this principle. For example, when the size of the monitor screen is 10 cm and the scan width of the electron probe is 1 mm, the magnification is 100 times, whereas the scan width is 10 µm, 10,000 times. In terms of historical background, the magnification is expressed for a screen of 12 cm (horizontal) and 10 cm (vertical) as the standard (slightly different depending on a SEM manufacturer). If a display unit has a larger monitor screen compared to the standard size, the magnification of the displayed SEM image becomes larger. In such a case, the magnification and the size of an object is calculated with a scale bar displayed on the screen as a reference.
Electron probe
Specimen
Display unit
Magnification
M=D/d
Fig. 7 Concept of SEM magnification.
7
Depth of Focus of SEM In the observation of a specimen with a substantial depth, if the focus is adjusted to the top side, the bottom side may be out of focus. In such a case, if the range between upper and lower image blur is large, it is said that “the depth of focus is large.” Whereas if the range between upper and lower image blur is small, it is said that “the depth of focus is small.” As shown in Fig. 8, when the electron probe is considerably parallel (aperture angle is small), the image stays in focus even if the focus is changed by a large amount. Whereas when the electron probe is substantially angular (aperture angle is large), the image goes out of focus even if the focus is only slightly changed. In the case of an optical microscope (OM) where the probe scanning is not used for imaging, when the angle subtended by the objective lens from the specimen (aperture angle) is small, the depth of focus is large. Whereas when this angle is large, the depth of focus is small. Note that even when the image is blurred, this cannot be seen at a low magnification. However, when the magnification is increased, the image blur is found to appear. That is, the depth of focus is changed also by the magnification.
Objective lens Aperture: small
Aperture: large
Aperture angle: small
Aperture angle: large
Blur Blur Depth of focus: large
Depth of focus: small
Fig. 9 Difference of the depth of focus between SEM and optical microscope. Fig. 8 Relation between the aperture angle of the electron probe and the depth of focus.
Figure 9 is a graph that shows a difference of the depth of focus between the SEM and OM. Although a stereoscopic microscope provides an image with a relatively large depth of focus between OMs, you can obtain a much larger depth of focus with the SEM. This is because the aperture angle of the electron probe in the SEM is much smaller than that of the objective lens in the OM. Note that the depth of focus for the SEM is different depending on the observation conditions. Figure 10 compares the OM and SEM images of a fractured surface of a screw. This fractured surface has large irregularity, leading to a fact that only a small part of the surface is actually focused with the OM. But, due to the large depth of focus of the SEM, the entire observed surface is in sharp focus. OM image
SEM image
Fig. 10 OM image and SEM image of the same field of view.
8
Why Images Are Visible? Since the SEM image appears as if you observe an object with the naked eye, you may intuitively understand the features of the object. However, the SEM image often produces a contrast that is difficult to explain. To fully understand the contrast of the SEM image, you must understand the principle of the formation of the SEM image.
Interactions of Electrons with Specimens When electrons enter the specimen, the electrons are scattered within the specimen and gradually lose their energy, then they are absorbed in the specimen. This behavior is shown in Fig. 11. The scattering range of the electrons inside the specimen is different depending on the electron energy, the atomic number of the elements making up the specimen and the density of the constituent atoms. As the energy is higher, the scattering range is larger. To the contrary, if the atomic number and density are large, the scattering range is smaller. The Monte Carlo simulation enables us to understand these phenomena. Fig. 11 Monte Carlo simulation showing the scattering behavior of electrons within the specimen.
Figure 12 is a schematic diagram that illustrates various signals emitted from the specimen when the incident electron beam enters the specimen. The SEM utilizes these signals to observe and analyze the specimen surface (or just beneath the surface). The SEM is not a simple morphology-observation instrument, but a versatile instrument capable of performing elemental analysis and state analysis.
Incident electron beam
X-rays
Backscattered electrons
Cathodoluminescence
Auger electrons
Secondary electrons Absorbed electrons
Specimen
Transmitted electrons
Fig. 12 Emission of various electrons and electromagnetic waves from the specimen.
Secondary electrons Number of emitted electrons
Figure 13 shows the energy distribution of various electrons emitted from the specimen. The energy of secondary electrons is limited to 50 eV or less; however the energy distribution of backscattered electrons is very wide, ranging from an energy equal to the incident-electron energy down to 50 eV, which is far lower than the incident-electron energy. Small peaks that appear in the range of backscattered electrons correspond to Auger electrons.
Backscattered electrons
Incident-electron energy
Energy of emitted electrons
Fig. 13 Energy distribution of electrons emitted from the specimen.
9
Secondary Electrons When the incident electron beam enters the specimen, secondary electrons are produced from the emission of the valence electrons of the constituent atoms in the specimen. Since the energy of secondary electrons is very small, those generated at a deep region are quickly absorbed by the specimen. Only those generated at the top surface of the specimen are emitted outside of the specimen. This means that secondary electrons are very sensitive to the surface. In addition, as shown in Fig. 14, compared to when the incident electron beam enters perpendicularly to the specimen, the amount of the secondary electron emission is larger when the electron beam enters obliquely. Figure 15 shows an actual example of the secondary electron image. The difference in the brightness of the crystal surface is due to the difference of the incidence angle of the electron beam. Thus, the secondary electron is used to observe the topography of the specimen surface. Since the secondary electron possesses a small energy, it is influenced by the potential near the specimen. As a result, an anomalous contrast arises when a specimen is electrically charged; and the secondary electron is often used to measure the operating voltage of a circuit in a semiconductor device.
Secondary electron diffusion area Escape depth of secondary electrons
Amount of emission: small Amount of emission: large
Secondary electron yield
Incident electrons
Tilt angle of specimen surface
Fig. 14 Relation between the incidence angle of the electron probe and the secondary electron yield.
Fig. 15 Secondary electron image of tungsten oxide crystal.
10
Backscattered Electrons Backscattered electrons are those scattered backward and emitted out of the specimen, when the incident electrons are scattered in the specimen. They are sometimes called reflected electrons. Since backscattered electrons possess higher energy than secondary electrons, information from a relatively deep region is contained in the backscattered electrons. The backscattered electrons are sensitive to the composition of the specimen. As shown in Fig. 16, as the atomic number of the constituent atoms in the specimen is larger, the backscattered electron yield is larger. That is, an area that consists of a heavy atom appears bright in the backscattered electron image. Thus, this image is suitable for observing a compositional difference. Figure 17 shows an actual example of a backscattered electron image. In addition, as shown in Fig. 18, if the specimen surface has irregularity, the intensity of the backscattered electrons becomes higher in the direction of specular reflection. This feature can be used to observe the topography of the surface.
Fig. 16 Atomic number dependence of backscattered electron intensity.
Fig. 17 Example of a backscattered electron image. Specimen: Magnetic head for a hard disk
Fig. 18 Relation between the electron-probe incidence angle and the backscattered electron intensity.
As shown in Fig. 19, if an electron beam enters a crystalline specimen with a uniform composition, the backscattered electron intensity changes depending on the crystal orientation. Utilizing this phenomenon enables you to observe the difference in crystal orientation as an image. The contrast in this image is called Electron Channeling Contrast (ECC). Figure 20 shows an example. Slightly tilting the crystalline specimen causes a change in the contrast.
Electron probe
Backscattered electrons
Crystal A
Crystal B
Fig. 19 Relation between crystal orientation and backscattered electron intensity.
Fig. 20 Example of Electron Channeling Contrast (ECC). Specimen: Cross section of flexible board
11
Edge Effect As shown in Fig. 21, if there exists uneven steps or thin protrusions on the specimen surface, the edges of the steps or protrusions appear bright while the bright parts have a certain width (theoretically, edges should appear as sharp lines). This phenomenon is called the edge effect. Figure 22 shows the schematic diagram of this effect. Even when the electron probe irradiates the area distant from an edge on an uneven step, secondary electrons generated by the electrons diffused in the specimen are emitted from the edge surface as secondary electrons.
Electron probe
Secondary electrons emitted from the edge surface
Specimen surface Secondary electron escape depth Diffusion area
Fig. 21 Example of the edge effect. Specimen: Etched pit on steel. Accelerating voltage: 25 kV
Fig. 22 Diffusion of incident electrons and resultant edge effects.
12
Influence of Accelerating Voltage When the accelerating voltage is changed, the penetration depth of the incident electrons changes. As the accelerating voltage is higher, the penetration depth is larger. If the accelerating voltage is increased, information from the inside of the specimen gives rise to the background, degrading the contrast on the specimen surface. As shown in Fig. 23, the electron probe broadens within the specimen. Thus, if a structural object exists inside the specimen, a higher accelerating voltage causes an unclear image of this object that overlaps on the surface image. In addition, as the accelerating voltage is higher, the edge effect is larger. Accordingly, in order to clearly observe surface structures, it is better to use a lower accelerating voltage.
Backscattered electrons from the inside of the specimen Secondary electrons generated by backscattered electrons
Electron probe
Specimen surface
Internal structural object
Fig. 23 Overlap of the internal structural information on the surface image.
Figure 24 shows images of plate-like crystals of boron nitride taken at three different accelerating voltages. Thin crystals of elements with small atomic number overlap each other. When the accelerating voltage is high (10 kV), crystals beneath another crystals are seen through. Two remarkable phenomena arise for floating crystals in the images. That is, parts of the floating crystals appear bright or dark. The reason for this is the following: In the former case, the secondary electrons emitted from the under side of the floating crystals are detected, contributing to a bright contrast. In the latter case, crystals located just beneath the floating crystals prevent the emission of the secondary electrons from the underside of the floating crystals. When the accelerating voltage is decreased to 1 kV, step-shaped structures on the crystals are clearly observed with sufficient contrast.
Fig. 24 Difference in the contrast of secondary electron images depending on the accelerating voltage. Specimen: Plate-like crystals of boron nitride
13
Illumination Effect of Secondary Electron Detector Theoretically, in the secondary electron image, the specimen surface perpendicular to the incident electron probe appears darker, whereas, when the specimen surface is tilted with respect to the electron probe, the image appears brighter. But actually, the position of the secondary electron detector also influences the contrast of the SEM image. Figure 25 illustrates the trajectory of the secondary electrons that enter the secondary electron detector. Secondary electrons are accelerated by a high voltage applied to the tip of the secondary electron detector and then they enter this detector. The secondary electrons emitted in the opposite direction of the detector (on the left side of the electron probe) are also attracted to the detector because their energy is very low. As the trajectory of the detected electrons causes the illumination effect, the image looks as if the specimen was illuminated with a shadow-less light. In addition, part of backscattered electrons with relatively high energies may enter the detector to produce an illumination effect having directional property. Consequently, the resultant image is seen as if soft light from the detector illuminated the specimen. The direction of the secondary electron trajectory corresponds to the illumination direction to the specimen. You may interpret the illumination effect that a pseudo light source located in front of the detector illuminates the specimen and you observe an image from the direction of the electron probe. This effect takes place when the SEM is provided with the commonly-used E-T detector. But, when a TTL detector is used, the illumination effect changes a little. As shown in Fig. 26, the secondary electrons emitted from the specimen move along the optical axis while they are confined by the magnetic fields of the objective lens, and then they enter the detector. In this case, the direction of the secondary electron trajectory corresponds to that of the incident electron probe (observation direction). Thus, the illumination effect is weakened (less topographic contrast), and a SEM image is seen differently from the image obtained with an E-T detector.
Electron probe
Illumination direction Detector
Specimen
Fig. 25 Illumination effect of the commonly used E-T secondary electron detector.
Detector
Electron probe
Illumination direction
Specimen
Fig. 26 Illumination effect of a TTL detector.
Illumination Effect of Backscattered Electron Detector The illumination effect also occurs for backscattered electrons. You can observe an image as if light illuminated the specimen from the backscattered electron detector. However, note that backscattered electrons enter the detector while they travel in a straight line. This is different from the secondary electron trajectory to the detector, which takes a curve. The straight trajectory of the backscattered electrons leads to a difference in the contrast depending largely on the position of the backscattered electron detector; and also strong topographic contrast is obtained. Figure 27 shows an example of the backscattered electron detector. Two detectors (A and B), which are symmetric with respect to the electron probe, are positioned just above the specimen. After the detection of the backscattered electrons, the output signals are calculated (the signal detected with detector A is taken as A, whereas that detected with detector B as B). Subtracting B from A enables you to obtain the topographic information on the specimen surface because an image becomes as if light illuminated the specimen from detector A. On the other hand, adding A and B causes the topographic information to disappear and enables you to observe a compositional difference because an image changes as if light illuminated the specimen from the electron-probe direction.
Electron probe
To the amplifier
Detector A Detector B
Backscattered electrons
Specimen
Fig. 27 Two-segment backscattered electron detector.
14
To Improve Image Resolution Resolution and Resolving Power If the electron probe is finely focused, a sharp image can be obtained. This image sharpness can be regarded as the resolving power. To be precise, the resolving power is defined as “the minimum distance that can be separated as two distinguishable points using the instrument.” Traditionally in the SEM, the resolving power is determined by measuring the minimum distinguishable distance between two objects. Figure 28 is a SEM image of gold particles evaporated on a carbon plate. As shown in arrows in Fig. 28, the distance between two particles, which are most close to each other, is measured and a resolving power of about 1 nm is obtained. In order to facilitate the measurement of resolving power, it is important to prepare a specimen that is stable and easy to observe as much as possible. A standard specimen for measurement of resolving power is different with manufacturers of electron microscopes. In addition, there are Fig. 28 Gold particles evaporated on a carbon plate. differences in measurement conditions and measureTwo arrows indicate that the distance between two points are about 1 nm ment techniques for determining the resolving power (resolution of 1 nm). among the manufacturers. The resolving power is obtained when the instrument is used under the optimum conditions. The “resolution” is a term similar to the resolving power. The resolution is defined as “the minimum distance that can be separated as two distinguishable points in the (SEM) image.” The resolution is determined by various factors: the status of the instrument, structures of the specimen, observation magnification, etc. However actually, the resolution and the resolving power are often used in the same sense.
To Improve Resolution Electron-probe diameter
The SEM resolution is determined by the diameter of the electron probe. In principle, the electron beam emitted Limit due to from the electron gun is focused by the condenser and the image quality objective lenses. But in the actual operation of the SEM, the excitation of the objective lens is unchanged; therefore, the diameter of the electron probe is changed by changing the excitation of the condenser lens. Figure 29 shows the change of the electron-probe diamElectron-probe eter when the excitation (strength) of the condenser lens diameter with an ideal objective lens is changed. As the condenser lens is strengthened, the diameter of the electron-source image (electron probe Limit determined by the objective lens diameter) is decreased. However, this diameter does not become smaller than the theoretical probe-size limit determined by the objective lens. Decreasing the electron-probe diameter decreases the probe current that Strength of the condenser lens irradiates the specimen. When the TE gun is used, as the condenser lens is strengthened, the image quality (sigFig. 29 Change of the electron-probe diameter when the strength of the condenser nal-to-noise ratio) deteriorate before the electron-probe lens is changed. diameter reaches the theoretical limit due to the lack of the probe current, and you cannot observe an image. When using the FE gun that produces larger probe current than the TE gun, the curve in Fig. 29 shifts to the left. Thus, the electron-probe diameter reaches the theoretical limit while you can observe an image. In addition, when the performance of the objective lens is enhanced, the curve shifts downward, enabling you to obtain a much higher resolution. Consequently, the combination of the FE gun and a higher-performance objective lens provides an extremely high resolution.
15
Type of Electron Guns There are three types of electron guns: TE gun, FE gun and the SE gun. This section explains the two latter guns.
Field-Emission Electron Gun
Flashing power supply
An electron gun that is used for a high-resolution SEM is the FE gun. The FE gun utilizes the field-emission effect that takes place when a high electric field is applied to a Extracting-voltage -metal surface. Its construction is shown in Fig. 30. The Emitter power supply + cathode is made of a thin tungsten wire. A tungsten single crystal is welded to this tungsten wire, and the tip of the tungsten single crystal is shaped to be a curvature radius of about 100 nm. This is called the emitter. When a Extracting Accelerating-voltage -positive voltage (a few kV) is applied to a metal plate electrode power supply + (extracting electrode), the tunneling effect occurs and electrons are emitted from the emitter. If a hole is made at the center of the extracting electrode, the emitted Accelerating electrode electron beam flows through this hole. Then, when you apply a voltage to the electrode (accelerating electrode) Fig. 30 Construction of the FE gun. located below the extracting electrode, you can obtain an electron beam having certain energy. In order to generate a field emission, the tip of the emitter must be very clean. Thus, the FE gun needs to be placed in an ultrahigh vacuum of about 10-8 Pa. The electron beam emitted from the emitter behaves as if the beam was emitted from a small electron source with a diameter of 5 to 10 nm. In the case of the TE gun, its electron source is 10 to 20 µm in diameter, indicating that the FE gun produces a much smaller electron source than the TE gun, thus suitable for high-resolution SEMs. In addition, another advantage of the FE gun is that the energy spread of the electron beam is small because the FE gun requires no heating of the emitter. In low-accelerating voltage observation, this energy spread determines the resolution (chromatic aberration); therefore, this advantage is very important.
Schottky-Emission Electron Gun
Heating power supply
The SE gun utilizes the Schottky-emission effect that takes place when a high electric field is applied to a Extracting voltage heated metal surface. Its construction is shown in Fig. 31. + power The cathode is a ZrO/W emitter. That is, a tungsten single supply crystal coated with ZrO, which has a tip curvature radius + Emitter Suppressor of a few hundred nanometers. Coating of ZrO greatly decreases the work function, thus a large emission current can be obtained at a relatively low cathode temperaExtracting Accelerating voltage ture of about 1800K. As shown in Fig. 31, in order to shield electrode power supply + the thermoelectrons from the emitter, a negative voltage is applied to an electrode, called the suppressor. An advantage of the SE gun is that the electron-beam curAccelerating electrode rent is highly stable because the emitter, which is placed in an ultrahigh vacuum of about 10-7 Pa, is kept at a high Fig. 31 Construction of the SE gun. temperature and no gas-absorption occurs. Compared to the FE gun, the energy spread of the electron beam is somewhat larger, but the SE gun produces larger probe currents. Thus, these features are very effective for various analyses simultaneously with morphological observation. This electron gun is often called the thermal-cathode FE gun or thermal FE gun for convenience.
16
Features of Three-Type Electron Guns Figure 32 is a radar chart compares the features of the TE gun, FE gun and SE gun. The FE gun is superior in terms of the electronsource size, brightness (quantity that means the current density and parallelity of the electron beam), lifetime and energy spread (energy width) of the electron beam. The TE gun is superior in terms of the probe current and current stability. Considering these features, the FE gun is suitable for morphological observation at high magnifications, and the TE gun is suitable for versatile applications such as analysis that does not require high magnification. The SE gun is situated between these two electron guns and its applications ranges from high-magnification observation to various analyses.
Brightness
Electron-source size
Energy spread TE gun FE gun SE gun
Lifetime
Probe current
Current stability
Fig. 32 Comparison of three-type electron guns.
Table 1 summarizes the features of these electron guns. Table 1 Features of three electron guns.
TE gun Electron-source size -2
-2
Brightness (Acm rad ) Energy spread (eV)
Tungsten
LaB6
15 ~ 20 µm
10 µm
10
5
10
6
FE gun
SE gun
5 ~ 10nm
15 ~ 20nm
10
8
108
3~ 4
2~ 3
0.3
0.7 ~ 1
Lifetime
50 h
500 h
Several years
1 to 2 years
Cathode temperature (K)
2800
1900
300
1800
Current fluctuation (per hour)