Advanced Materials Characterization Workshop
Scanning Electron Microscopy (SEM) Wacek Swiech Jim Mabon Vania Petrova Mike Marshall Ivan Petrov Supported by the U.S. Department of Energy under grants DEFG02-07-ER46453 and DEFG02-07-ER46471 © 2008 University of Illinois Board of Trustees. All rights reserved.
Parallel Acquisition
Sequentioal Acquisition
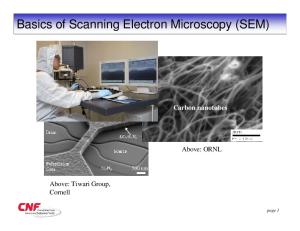
Basic Comparison to Optical Microscopy
Optical
SEM (secondary electron)
The higher resolution and depth of focus available with the SEM are clearly observed, electrons have small mass (m0).
2
de Broglie : λ = h p −1
λrelat (x102 nm)
v (x107 m/s)
500
5.48
1.33
eU = m0 v 2 / 2 ⇒
1,000
3.88
1.87
hence : λnon − rel = h (2m0 eU ) −1/ 2
U (V)
5,000
1.73
4.16
10,000
1.22
5.85
30,000
0.70
9.84 (≈c/3!)
p = m0 v = h (2m0 eU )1/ 2
λrelat = h [2m0 eU (1 + eU (2m0 c 2 )−1 )]−1/2 From Scanning Electron Microscopy and X-Ray Microanalysis, Joseph I. Goldstein et al. Plenum Press
What does the SEM do? • An instrument for observing and analyzing the surface microstructure of a bulk sample using a finely focused beam of energetic electrons • An electron-optical system is used to form the electron probe which is scanned across the surface of the sample (raster pattern). • Various signals are generated through the interaction of this beam with the sample. These signals are Many Applications: collected by appropriate detectors. Most widely employed microscopy • The signal amplitude obtained at technique other then optical microscopy each position in the raster pattern is Surface morphology (SE, BSE, FSE) assembled to form an image. Composition analysis (X-EDS, WDS) Crystallography (electron diffraction and channeling techniques) Optical properties (cathodoluminescence CL) Many other more specialized applications
3
Animation from A Guide to X-Ray Microanalysis, Oxford Microanalytical Instruments
Secondary and Backscattered Electrons Energy Distribution of Emitted Electrons
Secondary electrons are low energy electrons ejected from the specimen atoms by the energetic primary beam 4
Backscattered electrons are primary beam electrons scattered back out of the sample. Adapted From L. Reimer, Scanning Electron Microscopy, 2nd edition, Springer Verlag
Electron Beam / Specimen Interactions CL UV/Visible/IR Light
EDS/WDS
Incident Ib, E =0.5-30 keV, α = 0.2-1o Beam
Characteristic Xrays
Secondary electrons (SE)
Imaging
Auger electrons
Backscattered electrons (BSE)
Bremsstrahlung X-rays
Elastic Scattering Inelastic Scattering Micrometer-size Interaction Volume
Heat Specimen Current
Imaging
Isc
Isc = Ib− ηIb − δIb = Ib (1−(η+δ)) 5
Monte-Carlo simulations of electron scattering C
15 keV Al
PMMA @ 20kV Everhart et.al. (1972)
15 keV 1 μm
Ti
Ti
5 keV
15 keV
• Determine effective lateral or depth resolution for a particular signal in a defined sample • Simulate X-ray generation / X-ray spectra in a defined sample • Simulate image contrast 6
W
15 keV
Ti
25 keV Simulations are very useful for testing if a measurement is possible or interpreting results Animation from A Guide to X-Ray Microanalysis, Oxford Microanalytical Instruments Monte Carlo Calculations, CASINO
Sequential Image Acquisition in SEM
•
•
M = Ldisplay/Lspecimen
7
Animations from, The Oxford Guide to X-Ray Microanalysis, Oxford Instruments Microanalysis Group
The scan of the electron beam and the screen raster are synchronized with intensity proportional to the collected signal Magnification is given by the ratio of the length of the line on display device to length scanned on the real sample Figure from Scanning Electron Microscopy and X-Ray Microanalysis, Joseph I. Goldstein et al. Plenum Press
Typical SEM Column / Vacuum Conditions JEOL 6060LV
Courtesy JEOL USA 8
•
An SEM specimen chamber typically operates at high vacuum conditions: Vacuum better resolution
•
Longer Focal Lengths(W2) –> larger d2, smaller α2 -> better depth of field
•
Smaller Apertures –> smaller d2, smaller α2 -> better resolution & better depth of focus
•
Correction coils are used to correct asymmetries in lens (correct astigmatism)
16
Adapted from Scanning Electron Microscopy and X-Ray Microanalysis, Joseph I. Goldstein et al. Plenum Press
Lens Aberrations / Optimum Aperture Angle Spherical Aberration Aperture diffraction causes a fundamental limit to the achievable probe size
Optimum aperture angle determined by combined effect of spherical aberration and aperture diffraction
17
Adapted from Scanning Electron Microscopy and X-Ray Microanalysis, Joseph I. Goldstein et al. Plenum Press
Chromatic Aberration
Lens Aberrations / Astigmatism Astigmatism is caused imperfections in lens or other interference. Lens by Aberrations – the Astigmatism It can be corrected using additional elements called stigmators contained inside the objective lens
Magnetostatic quadrupole lens is basis of a stigmator
Octupole lens stigmator
18
Adapted from Scanning Electron Microscopy and X-Ray Microanalysis, Joseph I. Goldstein et al. Plenum Press
Secondary Electron Detector / Imaging • •
•
Faraday Cage (collector) is usually biased a few hundred volts positive (for collection efficiency) Scintillator is biased +10kV to accelerate electrons to sufficient energy to efficiently excite scintillating material Amplified output level is directly used to set brightness (offset) and contrast (gain) in corresponding pixel in image
Everhart-Thornley SE detector
Contrast from predominately angular dependence of secondary electron yield and edge effects. Reactive ion etching of Al/Si(001) 19
Secondary Electron Yield Dependence of SE yield with angle (local) of incidence with surface
Escape probability for SE’s as a function of depth of generation Æ image resolution for SE imaging will approach the probe size 20
From Scanning Electron Microscopy and X-Ray Microanalysis, Joseph I. Goldstein et al. Plenum Press
Edge Effect on SE Yield
21
Adapted From L. Reimer, Scanning Electron Microscopy, 2nd edition, Springer Verlag
Analogy to Oblique and Diffuse Optical Illumination • Secondary electron yield is strongly dependent on local angle of incidence with beam • Backscattered electrons are also directly and indirectly detected (image is not pure SE) • Together this, along with the high depth of focus of the SEM, gives the familiar SEM images with a good perceptive sense of surface topography 22
From Scanning Electron Microscopy and X-Ray Microanalysis, Joseph I. Goldstein et al. Plenum Press
Exceptionally High depth of Focus 10,000X original magnification
Electrodeposited Gold Dendritic Structure
100,000X original magnification
Carbon Nanotube
23
Extremely Wide Range of Magnifications 12X original magnification
Miniature Sensor Device Calorimeter
24
500,000X original magnification
Sputtered Au-Pd on Magnetic Tape
Backscattered Electron Detectors and Yield Objective lens pole piece
•
• • Typical 4 quadrant solid state BSE detector
•
Solid State 4 quadrant Backscattered Electron detector placed annular to bottom of objective lens Composition image – electronically sum signal from all 4 quadrants BSE topographic images – differencing various detector quadrants
Backscattered electron yield is a strongly dependent on sample mean atomic number
Graphic from, The Oxford Guide to X-Ray Microanalysis, Oxford Instruments Microanalysis Group
25
Backscattered Compositional Contrast Secondary Electron Image
Backscattered Electron Image
SnBi alloy • most useful on multi-phase samples • can be sensitive to < 0.01 average Z differences • flat-polished specimens essential 26
Non-Conductive Specimens - Charging
Isc = Ib− ηIb − δIb = Ib (1−(η+δ)) =0 Total emitted electron coefficient η+δ as a function of beam energy When η+δ=1 Æ charge balance
Upper cross-over energy, E2, for several materials
27
From Scanning Electron Microscopy and X-Ray Microanalysis, Joseph I. Goldstein et al. Plenum Press
Variable Pressure (VP / LV / Environmental) SEM • A different and simpler solution to specimen charging of un-coated nonconductive samples is to introduce a gas (air, etc.) into the specimen chamber. • The high energy electrons ionize the gas, thus positive ions are available to dynamically neutralize any charge on the sample. • Available in both Schottky and Thermionic (Tungsten) instruments
28
@ high vacuum
Uncoated Dysprosium Niobium Oxide Ceramic
@ 20 Pa air
JEOL JSM-7000F Analytical Scanning Electron Microscope EDS
EBSD WDS
CL
• Energy-Dispersive Spectroscopy (EDS) – solid state detector simultaneously measures all energies of X-ray photons • Wavelength Dispersive Spectroscopy (WDS) – sequentially measures intensity vs X-ray wavelength (energy). Superior energy resolution and detection limits (P/B ratio). • Electron Backscattered Diffraction (EBSD) – acquires electron diffraction information from surface of highly tilted bulk sample with lateral resolution of 10’s of nm • Cathodoluminesence (CL) – optical emission spectrometer and imaging system for 3001,700nm. Liquid He cooled stage module. 29
Characteristic X-ray Generation • A scattering event kicks out an electron from K,L,M, or N shell of atom in specimen • An electron from an outer shell falls to fill in the vacancy • Energy difference results in release of an X-ray of characteristic energy/wavelength or an Auger electron X-ray vs. Auger Generation
30
Graphic from, The Oxford Guide to X-Ray Microanalysis, Oxford Instruments Microanalysis Group
Atomic Number
Energies of Characteristic X-rays to 20 keV
From Scanning Electron Microscopy and X-Ray Microanalysis, Joseph I. Goldstein et al. Plenum Press
31
Energy Dispersive X-ray Detector: Si(Li)
Copper Rod (at Liq. N2 Temperature)
FET charge sensitive amplifier
Si(Li) Detector X-ray Window Magnetic Electron Trap Collimator
32
Graphics from A Guide to X-Ray Microanalysis, Oxford Microanalytical Instruments
Voltage
Mechanism of X-ray Energy Determination Voltage step X-ray event
Charge restore
Time
Animations from, The Oxford Guide to X-Ray Microanalysis, Oxford Instruments Microanalysis Group
•
• • • 33
X-ray loses energy through inelastic scattering events creating electron / hole pairs High voltage bias keeps generated pairs from re-combining Charge sensitive amplifier “counts” pairs generated by X-ray Spectrometer calibration effectively multiplies by energy/pair (3.8 eV) to determine X-ray energy
EDS Spectral Resolution and Count Rates Pulse processing time constants are used to adjust available count rate versus spectral peak resolution
• Long time constants are best for single acquisition analysis for best energy resolution. • Short time constants are best for fast acquisition of X-ray elemental maps (elemental distribution images) or line-scans (intensity or concentration profiles). • Compromise is often needed. 34
X-ray EDS Microanalysis in the SEM • •
Fast Parallel Detection Qualitative elemental analysis
Oxford Instr.: Link-ISIS software
– From beryllium up on periodic table – Sensitivities to