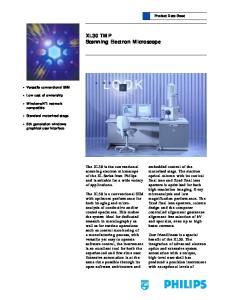
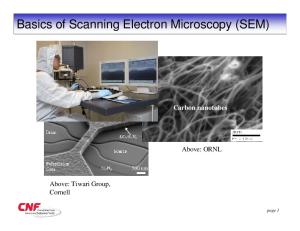
Scanning Electron Microscope (SEM)
Scanning Electron Microscope (SEM)
(From IOWA U. web site)
Danny Porath 2003
Radiolarian (in Plankton) x 750
(From IOWA U. web site)
Internet Sites http://www.rit.edu/~bekpph/ http://www.rit.edu/~bekpph/sem/ARS/sem.htm http://www.unl.edu/CMRAcfem/em.htm http://www.jeol.com/sem_gde/tbcontd.html http://mse.iastate.edu/microscopy/home.html http://laser.phys.ualberta.ca/~egerton/SEM/sem.htm http://acept.la.asu.edu/PiN/rdg/elmicr/elmicr.shtml http://www.mos.org/sln/sem/seminfo.html http://www.mih.unibas.ch/Booklet/Lecture/Chapter1/Chapter1.html
.. ..
Outline SEM/TEM: 1. Links and examples 2. Optics a. Ray diagrams b.Resolution c. Magnification
1. Bruce Kahn - RIT 2. Yossi Rosenwacks 3. Yosi Shacam – TAU 4. JEOL guide for SEM 5. “Electron Microscpy and Analysis”, P.J. Goodhew and F.J. Humphreys. 6. IOWA state U., Dept. of Material Science & Engineering site 7. …
Homework 2 1. Find on the web, in a paper or in a book the 3 most impressive SEM and TEM images: a. 1 - Technically b. 1 - Scientifically c. 1 - Aesthetically
Explain your choice. If needed compare with additional images.
3. SEM/TEM structure
3. Which types of analysis can be done by SEM/TEM beyond imaging. Explain shortly.
4. Electrons-surface interactions and signals
4. Be prepared to present each one of them to the class in 5 minutes.
5. Types of disturbances
1
With the help of…….
Transmission Electron Microscope (TEM) Image (Leo 922 OMEGA)
Tunnelling device on the basis of a Si/Ge heterostructure
Si[110] taken on LEO 922 Lattic spacings: [111] = 0.31nm, [200] = 0.27nm
SEM Images (Leo 1530 and JEOL Guide to SEM)
Black widow spider x500
Cucumber skin x350
Big Radiolarian x500 and x2,000
SEM Image (Leo 1530)
High resolution image of a frozen, hydrated yeast
Uncoated chromite
SEM Images (Leo 1530 and JEOL Guide to SEM)
Staple in paper x35
Ceropia moth x350 and 15,000
Some History….
1611 Kepler suggested a way of making a compound microscope.
Toner x2,500
Gold particles x36,000
Eye of a fly x100
Kosher Salt x75
Integrated Circuit x720
Toilet Paper x500
SEM Imaging
1655 Hooke used a compound microscope to describe small pores in sections of cork that he called "cells". 1674 Leeuwenhoek reported his discovery of protozoa. He saw bacteria for the first time 9 years later. 1833 Brown published his microscopic observations of orchids, clearly describing the cell nucleus. 1838 Schleiden and Schwann proposed the cell theory, stating that the nucleated cell is the unit of structure and function in plants and animals.
2 nm
1857 Kolliker described the mitochondria in muscle cells. 1876 Abbé analyzed the effects of diffraction on image formation in the microscope and showed how to optimize microscope design. 1879 Flemming described with great clarity chromosome behavior during mitosis in animal cells. 1881 Retzius described many animal tissues with a detail that has not been surpassed by any other light microscopist. In the next two decades he, Cajal, and other histologists developed staining methods and laid the foundations of microscopic anatomy.
2
~4 nm gap
Before Au55 trapping
After Au55 trapping
Some (more) History….
1882 Koch used aniline dyes to stain microorganisms and identified the bacteria that cause tuberculosis and cholera. In the following two decades, other bacteriologists, such as Klebs ans Pasteur, identified the causative agents of many other diseases by examining stained preparations under the microscope.
s c i t p O
1886 Zeiss made a series of lenses, to the design of Abbé, that enabled microscopists to resolve structures at the theoretical limits of visible light. 1898 Golgi first saw and described the Golgi apparatus by staining cells with silver nitrate. 1924 Lacassagne and collaborators developed the first autoradiographic method to localize radioactive polonium in biological specimens. 1930 Lebedeff designed and built the first interference microscope. 1932 Zernike invented the phase-contrast microscope. These two developments allowed unstained living cells to be seen in detail for the first time. 1941 Coons used antibodies coupled to fluorescent dyes to detect cellular antigens. 1952 Nomarski devised and patented the system of differential interference contrast for the light microscope that still bears his name. 1981 Allen and Inoué perfected video-enhanced contrast light microscopy.
Various Optical Ray Diagrams
1/f=1/u+1/v
Image Through a Thin Lens
M=f/(u-f)=(v-f)/f
Light Sources
Two lens System and Magnification Transmission illumination
Objective
Projector
TEM
Reflected illumination SEM
3
M1=(v1-f1)/f1
M2=(v2-f2)/f2
M=(v1-f1)(v2-f2)/f1f2
Resolution
Spectral range
The resolution depends on the lens ability to collect light (~1/f#) and inverse to the aperture number (NA)
f/#=f/D n – refractive index
NA=n sin(α) NA = 1/(2 f/#) Re solution = k1
λ
NA
Resolution … Airy Discs
Diffraction limited Resolution
Partially resolved
Laser beam Diffraction through a pinhole
Unresolved
100 µm
75 µm
Resolved
~84 %
Rayleigh Resolution Criterion
Thus the smallest separation is determined by the N.A. (1/2f#) Typically the best objective has N.A ≈1.6 ⇒ resolution ≈170 nm For λ~400 nm (green light)
⇒ Decrease λ
d1~1/aperture-diameter
R1= d1/2=0.61λ/nsin(α)= 0.61λ/NA
Electron Microscopy - Decreasing The Wavelength
The Evolution of Resolution
⇒ E=
p2 = eV 2m
Energy Conservation
⇒ p = 2meV P=
λ=
o h h 6.6 ⋅ 10−34 = = ≈ 0.05 A − 31 − 19 p 2meV 2 ⋅ 91 . ⋅ 10 ⋅ 16 . ⋅ 10 ⋅ 50000
Resolution (50 kV):
4
h
λ
.
R1= 0.61λ/NA~(0.6 0.05)/1.6~0.2 Å
Magnifications (YBCO)
Depth of Focus
SEM
x70
x300
x1400
h=0.61λ/[nsin(α)tg(α)] Depth of focus, h, is the distance from the plane of optimum focus in which the beam diverges by no more than the spot diameter d1.
x2800 Optical
Depth of Field - the range of positions for the object for which our eye can detect no change in the sharpness of the image
SEM Operation
SE
e r u t c u M St r
Magnification = length of TV screen/Scanning length
JEOL Optical System
5
SEM Operation
Beam's Path through the Column
Large WD:
SEM Ray Diagrams
• Demagnification decreases • Spot size increases • Divergence angle α decreased The decrease in demagnification is obtained when the lens current is decreased, which in turn increases the focal length f of the lens. The resolution of the specimen is decreased with an increased working distance, because the spot size is increased. Conversely, the depth of field is increased with an increased working distance, because the divergence angle is smaller.
The Electron Source
Small WD
Large WD
Light vs. Electron Microscopes
The electron source: Filament: Tungsten This filament is a loop of tungsten which functions as the cathode. A voltage is applied to the loop, causing it to heat up. The anode, which is positive with respect to the filament, forms powerful attractive forces for electrons.
LaB6 Gun
6
The Potential Distribution in the Tunsten Gun
Field Emission Gun
Field Emission Gun
Thermionic Emitter Materials
Gun Types SEM Cathode Comparison Tungsten filament
LaB6
Schottky (TF)
Field Emission
Apparent Source Size
100 micrometers
5 micromete rs