Journal of Biological Engineering Research and Review, 2016; 3(1): 16-20 © 2016 Shanti Braj Educational and Welfare Society ISSN: 2349-3232 Online Available online at www.biologicalengineering.in/Archive Research Article
Analysis of Genetic Variation between five Banana Fruit Varieties by RAPD Markers Md. Rakibul Islam*, Abul Kalam Azad, Md. Abuhena, Ratikanta Haldar, Shahidur Rahman Department of Biotechnology and Genetic Engineering, Faculty of Applied Science and Technology, Islamic University, Kushtia-7003, Bangladesh. *Email:
ARTICLE INFO: Article History: Received: Revised: Accepted: Available Online:
01/01/2016 21/02/2016 23/02/2016 24/02/2016
Keywords: DNA fingerprinting, RAPD primers, Polymorphism, Dendrogram, Genetic variation
[email protected]
Abstract: The banana (Musa acuminate Colla) is considered as an important crop plant due to its high economic value and rich dietary source, a cheapest and very popular fruit of Bangladesh. For analysis of genetic variation, five banana varieties were selected from Kushtia district and DNA was isolated from banana leaves of Bichikola, Chinichampa, Kachkola, Ranginsagor and Sabrikola by modified method of CTAB protocol. DNA fingerprinting was conducted of five banana varieties using 3 RAPD primers (OPA-03, OPD-04 and OPE-20). RAPD analysis was revealed 49 score able bands on amplification and their sizes ranged between 300bp to 1500bp. Among the 49 RAPD bands, 7 bands were monomorphic and 42 bands were polymorphic and 13% polymorphism was observed. The maximum polymorphism was found by the primer OPE20 (23.07 %). The RAPD based dendrogram were revealed that two major clusters and the inter variety similarity indices between Bichikola and Sabrikola was found the highest (1.29 %) and the lowest 0.33 % value was found between Chinichampa and Sabrikola and average value of variety the similarity (Si) was 0.81 %. The highest linkage distance (3.74) was found in Chinichampa vs. Sabrikola variety pair and the lowest linkage distance (2.65) was found in Kachkola vs. Ranginsagor variety pair. All five varieties are closely related with each other in the samples studied and providing clear informations for any future genetic manipulation.
INTRODUCTION
B
anana (Musa acuminate Colla) is the best-known tropical
fruit [1]. It is one of the economical important fruit crops grown in Bangladesh in both homestead and commercial farms [2]. Musa spp., banana and plantain, constitute the fourth most important staple food commodity of the world, after rice, wheat and maize [3].The bananas are rich in carbohydrates, minerals, vitamins and dietary fibers. The different solvent extracts showed antimicrobial and antioxidative activities [4]. Ripe banana mixed with rice and milk, is the traditional dish for Bangladeshi [5]. The improvement of Musa spp. by traditional breeding programs is difficult and time-consuming process because of the high sterility, polyploidy and long generation times to get an ultimate edible variety. The analysis of morphology based genetic variability in plants is time consuming [5]. The application of biotechnological tools and techniques the genetic manipulation is accelerated and it shortened the breeding cycles with more precision (neglecting environmental effects) and fast-track manner than the classical breeding techniques [6]. The systematic
comparison of different animal genomics gives a chance of identifying genetic basis for diversity. RAPDs have the advantage that the material is processed by an efficient and inexpensive technique without requiring prior knowledge of the genome [7]. DNA Fingerprinting of five banana varieties was performed using the three RAPD markers developed by Operon Tech., Inc., Alameda, California, USA. These are OPA03, OPD-04 and OPE-20 (Table 01). RAPD assay has the advantage of being easy to use, requiring very small amount of genomic DNA without the need for blotting and radioactive detection [8,9]. It can reveal difference and relationship between taxa [10] (Dore, 2001). Generally, RAPD markers have found a wide range of applications in gene mapping, population genetics, molecular evolutionary genetics and plant and animal breeding. In this research, we attempted to fingerprint and study their genetic relationships using RAPD markers, which could be very helpful for germplasm management or conservation, improvement of crops and plant varieties and determining the relationship and genetic diversity among five commercial local banana verities in Kushtia, Bangladesh.
16
MATERIALS AND METHODS
RESULTS AND DISCUSSION
The leaves of five Musa varieties (Bichikola, Chinichampa, Kachkola, Ranginsagor and Sabri) were taken from the healthy commercial fields of Kushtia District for the isolation of genomic DNA. In this investigation, modified method of Aljanbi et al. 1999 [10] and Hossain et al. 2006 [11] have been adopted to isolate the total genomic DNA from banana leaves. Young leaves of banana were used as sample for DNA extraction. A high salt concentration and combination of Poly vinyl pyrrolidone (PVP) and Hexadecyltrimethylammonium bromide (CTAB) were used in the extraction buffer in an order to prevent the solubilization of polysaccharides and polyphenols during the DNA extraction method. The purity and quantity of the extracted DNA from the banana were evaluated by using 260/280 nm UV absorption ratios. The PCR reaction was carried out in a final volume of 25 μl in a 0.2ml PCR tube. Each PCR reaction mixture contained 12.5 μl of GoTag G2 Hot Start colorless master mix and 2 μl of primer, 0.5µl of template DNA, 10 μl of nuclease- free water (Table 02). The PCR amplification was done in an oil-free thermal cycler. It was programmed for initial denaturation at 94oC for 5 min, primer annealing at 36oC for 1 min, primer extension at 72oC for 1 min, and final extension of 7 min at 72oC, mentioned in PCR Programme Table 03 [12]. Table 01: Parameters of the Operon random primers used in the present study for screening Primer Code OPA-03 OPD-04 OPE-20
Sequence (5/-3/) AGTCAGCCAC TCTGGTGAGG AACGGTGACC
Table 02: PCR cocktail for RAPD based PCR reaction Components GoTagG2 HotStart Colorless master mix Template DNA Primer Nuclease- free water Total Volume
Volume (µl)
Quantity for one reaction (µl)
12.5
12.5
1-5
0.5
0.25-2.5
2
25
10
-
25µl
Quantification of DNA Visually the DNA was estimated by observing the DNA in electrophoreses agarose gel comparing with known molecular weight marker (Lambda DNA HindIII digest). In spectrophotometric method amount of DNA was determined by taking absorbance reading at 260 nm. The highest amount of DNA was recovered from the Sabrikola (129.9 ng/l) and the lowest amount was obtained from Chinichampa (53.4 ng/l). Table 04: Spectrophotometric absorbance readings and concentration of DNA of five banana varieties Banana varieties
Absorbance Reading at (A260/A280)
Concentration of DNA (ng/l)
1 2
Bichikola Chinichampa
1.693 1.068
84.6 53.4
3 4
Kachkola Ranginsagor
1.745 1.984
87.2 99.2
5
Sabrikola
2.598
129.9
S.N.
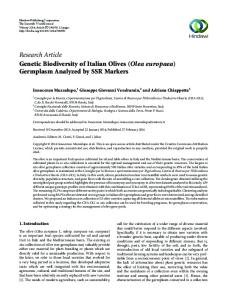
Quality of DNA To check the DNA quality, isolated genomic DNA was run on a 1% agarose gel for each sample as shown in the Figure 4.1. Agarose gel electrophoresis indicates presence of both degraded and quality of DNA. There was neither RNA contamination nor any sign of degraded DNA in all samples. No enzyme such as RNase and Proteinase were used in this method. High concentration of NaCl (5M) was used for removal of polysaccharides. It seems that RNA was degraded during the process of the extraction.
Table 03: PCR Programme Table Steps
Temperature (oC)
Time (Minute)
Number of Cycle
Initial Denaturation Denaturation
94
5
1
94
1
Primer Annealing
36
0.5
Primer Extension
72
1
Final Extension
72
7
30
1
Figure: 01. Electrophoregram of ethidium bromide stained genomic DNA samples of banana varieties (Lane B= Bichikola, Lane C= Chinichampa, Lane K= Kachkola, Lane R= Ranginsagor, Lane S=Sabrikola).
17
Band Size
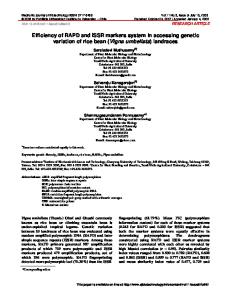
1500 bp. The representative electrophoregrams according to primers OPA-03 and OPE-20 were shown in Figure 01. For two primers, the total number of bands (49) varied from 23 to 26 (Table 02). The primer OPA-03 amplified the highest number of bands (23) and the primer OPE-20 amplified the lowest number of bands (26). Out of the 49 bands, 7 bands were monomorphic bands and 42 bands were polymorphic bands. The primer OPA-03 produced the 22 polymorphic bands. Thus, it showed 4.34% of polymorphism. The primer OPE-20 produced 20 polymorphic bands, and 23.07% polymorphism (Table 02). The highest number of bands (5.2) per variety was found by the primer OPE-20 and the number of bands per variety was found 4.6 by primer OPA03, but OPD-04 primer did not show any band (Table 05).
The sizes of the amplified bands in the five banana varieties ranged from 300 bp to 1500 bp (Table 02). The bands of primer OPA-03 ranged from 500 bp to 1500 bp; the bands of primer OPE-20 ranged from 300 bp to 1500 bp. All distinct bands or fragments (RAPD marker) were thereby given identification numbers according to their position on the gel and scored visually based on their presence (1) or absence (0), separately for each individual and each primer. Number of Bands Two primers generated 49 bands from the five varieties of banana using the Thermal Cycler (Genius, Techne) and 1% agarose gel electrophoresis with size ranging from 300 bp to
Table: 05. RAPD primers with corresponding bands scored, their size range, number of monomorphic and polymorphic bands, polymorphism and number of band per variety in five banana varieties. Size ranges (bp)
Total number of bands scored
Number of polymor-phic bands 22
Polymor-phism (%)
Number of band per variety
23
Number of monomor-phic bands 1
OPA-03
500-1500
4.34%
4.6
OPE-20
300-1500
26
6
20
23.07%
5.2
OPD-04
-
-
-
-
-
-
Total
49
7
42
27.41
Average
24.5
3.5
21
13.708
Primer codes
Inter–variety similarity indices The inter variety similarity indices between Bichikola and Sabrikola was found the highest (1.29 %) and the lowest 0.33 % value was found between Chinichampa and Sabrikola and average value of variety the similarity (Si) was 0.81 %, mentioned in table 06. Table: 06. Pair wise inter-variety similarity indices (Sij) among five banana varieties
Figure: 02. DNA Fingerprinting of five banana varieties based on RAPD Primer OPA-03 and OPE-20 through 1 % Agarose Gel. Lane M: Molecular weight marker (100 bp DNA ladder); (1-5 Lane for OPA-03 Primer) Lane 1: Variety Bichikola; Lane 2: Variety Chinichampa; Lane 3: Variety Kachkola; Lane 4: Variety Ranginsagor; Lane 5: Variety Sabrikola; (1-5 Lane for OPE-20 Primer) Lane 1: Variety Bichikola; Lane 2: Variety Chinichampa; Lane 3: Variety Kachkola; Lane 4: Variety Ranginsagor; Lane 5: Variety Sabrikola.
S.N.
Variety combination
1
Bichikola vs Chinichampa
Percentage of similarity 1.07%
2
Bichikola vs Kachkola
0.85%
3
Bichikola vs Ranginsagor
0.90%
4
Bichikola vs Sabrikola
1.29%
5
Chinichampa vs Kachkola
0.75%
6
Chinichampa vs Ranginsagor
0.53%
7
Chinichampa vs Sabrikola
0.33%
8
Kachkola vs Ranginsagor
0.85%
9
Kachkola vs Sabrikola
0.76%
10
Ranginsagor vs Sabrikola
0.85% Average
0.81%
18
Linkage distances (based on new.sta) The values of pair-wise comparisons of linkage distances were analyzed by using software “Statistica” between different cultivar pairs of banana for the two primers, ranged from 2.65 to 3.74 (Table 07). The highest linkage distance (3.74) was found in Chinichampa vs. Sabrikola variety pair. The lowest linkage distance (2.65) was found in Kachkola vs. Ranginsagor variety pair. Table: 07. Summary of linkage distances (based on new. Statistica) values for Different cultivar pairs of banana Bichikola
Chinichampa
Kachkola
Ranginsagor
Sabrikola
Bichikola
0.00
3.46
3.00
2.83
3.46
Chinichampa
3.46
.00
3.00
3.46
3.74
Kachkola
3.00
3.00
.00
2.65
3.32
Ranginsagor
2.83
3.46
2.65
.00
3.46
Sabrikola
3.46
3.74
3.32
3.46
.00
Dendrogram based on RAPD markers Dendrogram based on linkage distance using Unweighted Pair Group Method of Arithmetic Means (UPGMA) indicated segregation of the five banana verities into two main clusters at linkage distance 3.5. UPGMA cluster analysis revealed that two main cluster are produced at linkage distance 3.5. The cluster one (C1) is Sabrikola and cluster two (C2) is Chinichampa which is also divided into another two sub cluster.
Figure: 03. Cluster analysis by Unweighted Pair Group Method of Arithmetic Means (UPGMA) of five banana varieties based on RAPD markers. Bichikola (VR01), Kachkola (VR02), Ranginsagor (VR03), Chinichampa (VR04), Sabrikola (VR05).
CONCLUSION All five varieties are very closely related because they showed very little level of polmorphism, although higher levels of polymorphic bands are desirable for good resolution of intervarietal variations and development of cultivar specific markers. We found lower level of polymorphism using molecular markers which will contribute to accurate and reliable estimation of genetic
variability, thereby helping in defining the nature of existing gene pools of the cultivars. ACKNOWLEDGEMENTS The authors wish to thank Department of Biotechnology and Genetic Engineering, Faculty of Applied Science and Technology, Islamic University, Bangladesh and Invent Technology Bangladesh Ltd. for providing instrumental facilities for the study. COMPETING INTEREST The authors declare that they have no competing interests. REFERENCES 1.
Ahmed, K. Gardener's book of production and nutrition. 1st Edn. 1982, 262. 2. Uganda National Council for Science and Technology (UNCST). The Biology of Bananas and Plantains in Collaboration with Program for Biosafety Systems (PBS). International Development (USAID) funded Project Document. 2007, 01 3. Padam, B.S., Tin, H.S., Chey, F.Y., Abdullah, M.I. Antibacterial and Antioxidative Activities of the Various Solvent Extract of Banana (Musa paradisiacal cv.Mysore) Influrescences. Journal of biological science 2012, 12(2): 62-73. 4. Scheliro, E., Predieri, S., Bertaccini, A. Use of random amplified DNA analysis to detect genetic variation in pyrus species. Plant Mol. Bio. Rep. 2001, 19: 271. 5. Hossain, M. F. A study of banana production in Bangladesh: area, yield and major constraints. ARPN Journal of Agricultural and Biological Science 2014, 9:206-209. 6. Govindaraj, M., Vetriventhan and Srinivasan, M. Importance of Genetic Diversity Assessment in Crop Plants and Its Recent Advances: An Overview of Its Analytical Perspectives. Genetics Research International., 2015, 4. 7. Bhat, KV., Jarret, RL. Random amplified polymorphic DNA and genetic diversity in Indian Musa germplasm, Genet. Res. Crop Evol. 1995, 42: 107-118. 8. Cipriani, G., Bella, R., Testolin, R. Screening RAPD primer for molecular taxonomy and cultivar fingerprinting in genus Actinidia. Euphytica 1996, 90: 169-174. 9. Atienzar, F., Evenden, A., Jha, A., Savva, D., Depledge, M. Optimized RAPD analysis generates high-quality genomic DNA profiles at high annealing temperatures. Biotechniques 2000, 28: 52-54. 10. Aljanabi, S.M., Forget L. and Dookun A. An improved rapid protocol for the isolation of polysaccharide and
19
polyphenol-free sugarcane DNA. Plant Mol. Biol. Rep. 1999, 17:1-8. 11. Hossain MA, Shaik MM, Islam N, Faruque HM and. Miah MAS. Transformation of foreign gene in Sugarcane variety Isd 28 using Agrobacterium-mediate method.Bangladesh J. of Sugarcane 2006, 29: 01-06. 12. Kiran U, Moahnty S. K., Roy P. S., Behera L. and Chand P. K. Genetic diversity among banana cultivars from Odisha using RAPD Markers. Science Research Reporter, 2015, 5(2):118-124
20


![GENETIC DIVERSITY ANALYSIS IN COWPEA [VIGNA UNGUICULATA (L.) WALP.] BY USING RAPD MARKERS](https://kipdf.com/img/300x300/genetic-diversity-analysis-in-cowpea-vigna-unguicu_5ab5b7191723dd339c8121ce.jpg)