VOLUME 2: FREMONT CAMPUS Cañon City, Colorado
PUEBLO COMMUNITY COLLEGE FACILITIES MASTER PLAN
PREPARED BY: STEPHEN HALL ARCHITECTS 2910 Beacon Street Colorado Springs, CO 80907 FINAL REPORT PUBLISHED: July 1, 2012
ACKNOWLEDGMENTS
ACKNOWLEDGMENTS TO: COLORADO STATE BOARD FOR COMMUNITY COLLEGES AND OCCUPATIONAL EDUCATION Bernadette Marquez, Chair Meg Porfido, Member Maury Dobbie, Vice Chair Ruth Ann Woods, Member Ledy Garcia-Ekstein, Member Dr. Todd Bergren, SFAC Representative Jim Johnson, Member Andy Bartlett, SSAC Representative Rich Martinez, Member COLORADO COMMUNITY COLLEGE SYSTEM Dr. Nancy McCallin, President Cliff Richardson, Vice President for Administration and
Barbara McDonnell, Vice President for Legal Affairs Kristin Korash, Associate Vice President, Strategic
Finance
Mark Superka, Vice President for Administration and Fin. PUEBLO COMMUNITY COLLEGE Patricia Erjavec, President Colleen Armstrong, Vice President of Administration and Finance
Lucinda Mihelich, Vice President of Student Services Laura Solano, Vice President of Learning Sue Kochevar, Dean of Health Professions Dr. Lana Carter, Dean of Arts and Sciences Dr. Dave Cockrell, Dean of Business and Technology Jennifer Pierceall Herman, Dean of the Fremont Campus
Dr. Lynn Urban, Dean of the SCCC East Campus Shannon South, Dean of the SCCC West Campus Juanita Fuentes, Dean of CETD John Vukich, Dean of EWDD Joe Easton, Faculty Bruce Batchelder, College Assembly Chair Mary Kubeck, Faculty Dr. Patricia Grandieu-Diawara, Director of Institutional Research, Planning and Accreditation
Bryan Crawford, Director of Computer Services JanDee Haag, Director of Human Resources Paula McPheeters, Grants / Budgets Coordinator Erin Hergert, Coordinator of External Affairs/ Marketing Gary Franchi, Public Relations Clifford Kitchen, Director of Facilities Services Jeanne Gardner, Director, Library Services Larry Bontrager, Chair, Med. Imaging Tech. Mary Chavez, Chair, Physical Therapist Assistant Elsa Eccles, Chair, Dental Hygiene Beth Ingo-Rider, Chair, Cosmetology Karen Kissell, Chair, Nurse Aide Delia Lechtenberg, Chair, Respiratory Care Pract. Dawn Mathis, Chair, EMS Lynne Ross, Faculty, Massage Therapy Eva Tapia, Director, Nursing program
Planning and Research
David Besel, Consultant to CCCS Janet Trujillo, Chair, Dental Assisting Tricia Vigil, Chair, Occupational Therapy Assistant Dr. Silviano Arguello, M.D., Med. Dir., Health Clinic Cynthia Ayala, Director, Upward Bound Cindy Bernal, Director, Children First Carriann Martinez, Director, Recruitment Michael Gage, Director, Academic Advising Dennis Trujillo-Johnson, Director, Counsel. & Career Maija Kurtz, Director, Admissions & Records Jamie Manzanares, Director, TRiO SSS Ron Swartwood, Director, Financial Aid Joel Zarr, Director, College Center / Aux. Services Dan Gallegos, Director of Grounds / Housekeeping Kathy Kaufman, Facilities / Grounds / Housekeeping Brian Figueroa, Facilities Mike Pacheco, Ray Torres, & Larry Romero, Housekeeping
Julie Leyba, Executive Assistant to the President Jamie Davis, Services Coordinator, Admin. & Finance Lori Clevenger, Admin. Assistant, Nursing Department Barb Buchanan, Assist. Director, Admissions & Records Linda Tremblay, Grant Writer Connie Oelrich, Assist. to the Dean, Fremont Campus Lisa Barrett, Director of Student & Academic Services, SCCC East Campus
Ken Bigelow, IT Network Tech., SCCC East Campus Carole Anne Massone, Director, Nursing, SCCC East Campus
Beverly Cattles, Campus Scheduling, SCCC West Campus
Robert Sitton, Facilities Coordinator, SCCC West Campus
Anita Neely, Facilities, SCCC West Campus
The consultants would like to acknowledge Bennett Wagner Grody Architects, Milestone Engineering, NorthStar Engineering and Surveying, Hornberger + Worstell, OZ Architecture, Kleinfelder, Cap Allen Engineering, DLR Group, Trautner Geotech, MGA Engineering, Schendt Engineering, Plant Engineering Consultants, Zak George Landscaping, and Mestas Design for contributions and assistance. The consultants would especially like to thank faculties, staffs, and students of all PCC campuses, and government and community representatives from the City of Pueblo, Cañon City, and Montezuma County for their valued assistance and insights.
Pueblo Community College Facilities Master Plan – Vol. 2 Fremont Campus
Acknowledgments July 1, 2012
TABLE OF CONTENTS
ACKNOWLEDGMENTS I.
INTRODUCTION / PLANNING PROCESS A. B. C. D. E. F.
II.
PROGRAM INFORMATION / INSTITUTIONAL DATA OVERVIEW A. B. C. D.
E. F. G. H. I. J. III.
Master Plan Authors General Process Used to Develop the Plan Student / Faculty / Staff Involvement Community and Local Government Involvement Additional Stakeholder Involvement Overview of Conclusions through Development of the Master Plan
Institution Role, Mission and Vision History General Overview of Programs or Program Types Overview of Current Policies Affecting Facilities i. Admissions ii. Housing iii. Student Services iv. Campus Parking v. Athletics vi. Libraries vii. Class Scheduling viii. Facilities Maintenance and Annual Operation, Maintenance and Utility Costs ix. Relevant Institutional Space Allocation Guidelines Assessment of Academic Plans, Strategic Plans, Technology Master Plans, and Any Other Relevant Strategic Planning in Relation to the Proposed Master Plan. Campus Location Map Enrollment: Projections, Demographics Faculty and Staff Size and Distribution Student Performance Institution’s Programs in Response to Service Area Economy
EXISTING CONDITIONS ASSESSMENT AND CONCLUSIONS A.
B. C.
D. E. F. G.
H.
Current Land Use Map i. Campus Building Functions by Location ii. Land Uses Adjacent to the Campus Building Locations Map i. Current Footprints Current Space Inventory / Projections Tables i. Current Space Utilization by Space Type in Relation to Department Space Utilization Guidelines ii. Overview of Current Space Utilization Facility Conditions Index Topographic Map Subsurface Soil Conditions Map / 100 Year Flood Map Circulation Systems i. Pedestrian Circulation ii. Vehicular Circulation iii. Bicycle Circulation Utility Systems i. Water, Waste, and Storm Water Systems ii. Heating Systems iii. Electric Systems
Pueblo Community College Facilities Master Plan – Vol. 2 Fremont Campus
Table of Contents, i July 1, 2012
TABLE OF CONTENTS
I. J. K.
IV.
THE PLAN A.
B.
C.
D. E. F. G. V.
iv. Individual Building Utility Descriptions v. Technology Infrastructure Storm Water Management Athletics / Parks/ Recreational Fields Assessment of Current Campus Aesthetics i. Architecture ii. Scale iii. Materials iv. Urban Design v. Public Art
Ideal Functional Diagrams i. Nature and Relationship of Land Zones ii. Functional Relationships within Land-Use Zones iii. Flexibility for Growth Land Coverage Decisions i. Building Density with Building Zones ii. Parking Facilities Proposed Campus Plans and Supporting Data i. Land Perimeter ii. Land Use iii. Circulation Systems and Vehicle Storage iv. Utility Systems, Including Technology Infrastructure v. Building Location vi. Storm Water Management Plan vii. Facility Staging Plan Campus Plans to Continue or Renew Aesthetic Considerations Project Implementation Plan Facilities Construction and Renovation Time Schedule Criteria for Updating the Plan
APPENDICES A. B. C. D. E. F.
Students on Campus Analysis Campus Building Inventory Tables Historic Projections (1999 – 2010, Fall Semester) / School District Enrollment Trends Classroom and Teaching Laboratory Utilization by Building / Function Classroom and Teaching Laboratory Utilization by Room Capacity Alternative Enrollment Space Needs and Utilization Studies
Pueblo Community College Facilities Master Plan – Vol. 2 Fremont Campus
Table of Contents, ii July 1, 2012
I. INTRODUCTION / PLANNING PROCESS
Pueblo Community College Facilities Master Plan – Vol. 2 Fremont Campus
Section I July 1, 2012
INTRODUCTION / PLANNING PROCESS
I.
INTRODUCTION / PLANNING PROCESS
(Refer to Part One, “Introduction / Planning Process” in Volume 1.)
I.A.
MASTER PLAN AUTHORS
(Refer to Part One, “Introduction / Planning Process” in Volume 1.)
I.B.
GENERAL PROCESS USED TO DEVELOP THE PLAN
(Refer to Part One, “Introduction / Planning Process” in Volume 1.)
I.C.
STUDENT / FACULTY / STAFF INVOLVEMENT
The consultants met with PCC’s Vice President of Administration and Finance, PCC’s Facilities Management Director, and the Dean of the Fremont Campus in assessing Fremont Campus’ present facility and planned construction projects. The Consultants also drew from past direct involvement with Fremont Campus’ efforts in 2008 for a program plan / conceptual design study of the renovation of their historic barn structure for a multipurpose Arts and Humanities Classroom building and Site Development which included an outdoor amphitheater for the public. For that project, the consultants had met with student, faculty and staff groups in evaluating program needs for the arts programs.
I.D.
COMMUNITY AND LOCAL GOVERNMENT INVOLVEMENT
The consultants contacted the Stormwater Department Technician of Cañon City for current stormwater management policy and information on utility infrastructure at the campus site. The consultants’ past involvement with the Fremont Campus’ 2008 program plan and conceptual design study included focus group meetings with local government leaders, which included members of Fremont County Commissioners and the Cañon City Fire Department Inspector.
I.E.
ADDITIONAL STAKEHOLDER INVOLVEMENT
The Consultant’s past involvement with the Fremont Campus’ 2008 program plan / conceptual design study for an Arts and Humanities Classroom building and Site Development included focus group meetings with business and art community members.
I.F.
OVERVIEW OF CONCLUSIONS THROUGH DEVELOPMENT OF THE MASTER PLAN
The Fremont Campus is anticipated to grow from 446 to 479 FTE, a 7% increase, by target year Fall 2014. The campus has experienced an increase of 38% FTE within the past four years alone, due to increased course offerings in Career Tech, Health Professions and Arts and Humanities programs. The base year of Fall 2009 revealed a demanding schedule on the 22,852 ASF Fremont Campus building but also an imbalance of space, primarily between teaching spaces and combined academic office/assembly/administrative/student spaces. The campus reported that all available
Pueblo Community College Facilities Master Plan – Vol. 2 Fremont Campus
Section I., Page 1 July 1, 2012
INTRODUCTION / PLANNING PROCESS
classroom and laboratory space, as well as some non-classroom / laboratory space, which included a small portion of the Learning Resource Center, were utilized to accommodate enrollment in Fall of 2009. Though the space needs analysis identified surpluses of 3,336 ASF in classroom space and 2,836 ASF in teaching laboratory space, deficits were reported in open laboratory space (103) ASF, academic office space (1,997) ASF, assembly and exhibit area (1,545) ASF, other administrative space (105) ASF, (1,017) ASF in student lounge space, and (144) ASF in bookstore/merchandising space. This translated into 2,538 ASF of overall surplus space for Fall 2009, but an overall deficit of (1,464) ASF in Fall 2014. Moreover, the combined Academic and Academic Support Space ASF/FTE amounted to 39.98 ASF/FTE, which is over 9% below the state guideline of 44 ASF/FTE for a branch/satellite campus, which is further evidence of the lack of physical space. Average classroom SSO utilization was recorded at 32% for room use, and room capacity studies identified the larger classroom space (31-40 capacity) at 46% utilization. Average SSO utilization studies on teaching laboratory space identified use at 37%, while room capacity studies identified higher contact hours and use at 39% for the smaller laboratory (20 and under). This Facilities Master Plan recommends as a first priority to address improving the utilization of their existing classroom inventory within the current campus building footprint, given the identified surpluses, by reassessment of existing classroom inventory to better meet present and future enrollment needs in anticipating smaller class sizes. This is planned to be accomplished through subdividing large rooms into smaller classrooms, and the creation of a dedicated larger computer lab space. Additionally, smaller rooms will be carved out of the Learning Resource Center for much needed dedicated study and testing spaces. A second priority is to provide needed student service space, which was addressed in the program of a major expansion project for the Fremont Campus, with planned 7,200 GSF of lecture classrooms, offices and a Student Commons space to address academic, offices and student services needs. With the implementation of space reassignment under the first and second priorities, the Campus desires to plan for additional physical space past this master planning period, to incorporate areas for academic growth and the requisite academic and administrative support, and auxiliary services, such as those described in the expansion project program. Another future project is the renovation/re-purposing of an existing 4,400 GSF historic barn into gallery/classroom space. PCC will also actively pursue opportunities for collaborative community partnerships for the Fremont Campus, expanding on their base of offcampus sites for learning spaces in enhancing student life, retention and graduation rates. As the campus moves into its next decade in providing much needed educational services and programs to its service area, the Master Plan will serve to guide program planning and facility physical changes. Space needs analysis has verified specific needs for assembly space, academic and administrative office spaces and student lounge space. The Fremont Campus will be involved in the process of reviewing, challenging and updating the plan to meet needs as their demographics, programs, and facilities evolve. The Master Plan is intended to assure that campus goals and physical development are aligned with Pueblo Community College’s mission and vision statements.
Pueblo Community College Facilities Master Plan – Vol. 2 Fremont Campus
Section I., Page 2 July 1, 2012
II. PROGRAM INFORMATION / INSTITUTIONAL OVERVIEW
Pueblo Community College Facilities Master Plan – Vol. 2 Fremont Campus
Section II July 1, 2012
PROGRAM INFORMATION / INSTITUTIONAL DATA OVERVIEW
II.
PROGRAM INFORMATION / INSTITUTIONAL DATA OVERVIEW
II.A.
INSTITUTION ROLE, MISSION AND VISION
Refer to Section II.A., “Institution Role”, Volume 1. MISSION Pueblo Community College’s mission is to foster higher learning, student success, and service to our communities. VISION Pueblo Community College is a premier teaching institution providing students assured success pathways to relevant and progressive career, transfer, and personal growth opportunities. For 30 years, Pueblo Community College’s mission of fostering higher learning, student success, and service to its communities has been extended into Fremont and Custer counties through the activities of the Fremont Campus (formerly the Fremont County Center). The campus offers students of all ages the ability to improve their lives through job training, transfer courses that count toward a bachelor’s degree, and personal enrichment opportunities. Students also build confidence through personalized attention, strong support services, and participation in campus life—helping them become productive citizens and successful in their careers.
II.B.
HISTORY
Note: The history of Pueblo Community College is being included in this narrative for context. Pueblo Community College traces its origins to 1933 when Southern Colorado Junior College was incorporated. In 1937, local citizens made a commitment to support the institution with county taxes and organized the Pueblo County Junior College district; and the institution was renamed Pueblo Junior College. The Pueblo Junior College District was dissolved in 1961, and in 1963 Colorado’s General Assembly enacted legislation to change the status of Pueblo Junior college to a four-year, degree-granting institution governed by the Board of Trustees for State Colleges. The college named Southern Colorado State College (SCSC), offered educational programs at two campuses, including the Orman Avenue campus (the current Pueblo Campus) and the Belmont Campus located at the northern end of Pueblo (Colorado State University-Pueblo). The Southern Colorado Junior College administration, community and state agencies saw the need for additional secondary, post secondary, and adult vocational training in the southern Colorado area. Most of the Orman campus buildings had a vocational orientation, and the decision to revitalize the campus as a vocational-technical training center was based on both past programs and functional accommodations. In 1974, Southern Colorado State College gave the name College for Community Services and Career Education to the vocational activities located on the Orman Campus. Southern Colorado Junior College was granted university status (University of Southern Colorado) in 1975, when the Colorado General Assembly passed a bill clarifying legislation that would allow the University of Southern Colorado to operate the College for Community Services and Career Education as a technical community college. This change was made to enable the programs to be eligible for state and federal vocational funds within the state’s Community college and Vocational System. Pueblo Community College Facilities Master Plan – Vol. 2 Fremont Campus
Section II., Page 3 July 1, 2012
PROGRAM INFORMATION / INSTITUTIONAL DATA OVERVIEW
In 1978, the Colorado General Assembly passed Senate Bill 81 which transferred governance of the University of Southern Colorado from the Trustees of State Colleges and University Consortium to the State Board of Agriculture, effective July 1, 1978. Senate Bill 81 also separated the institution into two autonomous entities. The bill stipulated that a two-year technical college (Pueblo vocational community College) was to be separated from the University of Southern Colorado and transferred to the State Board for Community colleges and Occupational Education (SBCCOE) no later than July 1, 1980. Pueblo Vocational Community College became a State System Community College on July 1, 1979. On October 29, 1979 the College was granted NCA accreditation at the associate degree-granting level. On July 1, 1982 the name was officially changed to Pueblo Community College, and the College began moving towards becoming a comprehensive community college. The mission of the Community Colleges of Colorado system is “to offer a broad range of general, personal, vocational, and technical education programs to fill the occupational needs of youth and adults in technical and vocational fields, to provide two-year transfer educational programs to quality students for admission to the junior year at others colleges and universities, and to provide a broad range of programs of personal and vocational education for adults”. With this mission in place, Pueblo community college had full support when the College moved from being a vocational school to become a comprehensive community college that emphasized both vocational and transfer degree programs. The College also began offering courses in Cañon City in branch campuses throughout the city in 1980, and established a more permanent presence in 1986 when the college leased facilities on the grounds of the Holy Cross Abbey. Joe Chapman, a consultant and general historian, came up with the idea of transferring 55 acres of the State owned Prison Gardens for a permanent Pueblo Community College site in Cañon City. An agreement was negotiated with the Department of Corrections and the land was deeded to CCOES in January, 1995. Fundraising began locally in 1996, with the community raising over $1 Million. The State then funded just under $8 Million of the construction costs, with the remainder coming from local fundraisers. Initial enrollment was 254 in 2002-03 and has grown to over 800 in the baseline year 2009.
II.C.
GENERAL OVERVIEW OF PROGRAMS OR PROGRAM TYPES
Pueblo Community College is a comprehensive community college offering a range of career and educational programs. The Fremont Campus offers the following complete programs:
Transfer Programs: Associate of Arts, Associate of Science, Associate of General Studies, AATeacher Education, AA-Social Work emphasis, AGS-Criminal Justice, AGS-Computer Information Systems, AA-Early Childhood Education, AGS-Business Management, AGSAccounting. Career Technical Programs: AAS-Criminal Justice-Corrections emphasis, AAS-Computer Information Systems, AAS-Early Childhood Education, AAS-Business Management, AAS-Office Administration, AAS-Nursing* – LPN and RN (full 2 year program). Certificates: Addictions Counselor*, Business Fundamentals, Business Management, EMT, Administrative Assistant, C.N.A.*, Phlebotomy*, Fire Science, Welding (at Florence High School), Automotive Services Technician (at Cañon City High School). *Limited entry programs
Pueblo Community College Facilities Master Plan – Vol. 2 Fremont Campus
Section II., Page 4 July 1, 2012
PROGRAM INFORMATION / INSTITUTIONAL DATA OVERVIEW
Both credit and non-credit courses and programs, specialized training and seminars are available. In addition, a wide variety of adult and continuing education classes and specialized classes for senior citizens are offered.
II.D.
OVERVIEW OF CURRENT POLICIES AFFECTING FACILITIES
i. Admissions Pueblo Community College has an open-door policy concerning admissions. ii. Housing There is no housing policy, as Fremont Campus is a commuter campus and has no housing. iii. Student Services The Fremont Campus is supported by the Student Services Division at the Pueblo Campus, but does provide all student services including admissions, financial aid assistance, and advising through their one stop student services / enrollment Go!Zone Center, as well as tutoring, a bookstore and student life organizations. A Health Clinic offering basic health care was recently constructed, and is staffed twice a week by a nursing faculty member. iv. Campus Parking The Fremont Campus utilizes an on-site striped parking lot. Overflow parking can be accommodated on adjacent dirt areas as needed. There are presently 184 available on-site striped parking spaces: 177 Regular, 7 Accessible. With the addition of staff (headcount information covered in Section II.H), it appears that the striped parking is insufficient for the largest building population: 268. However, the data excludes those groups not represented in FTE enrollment, so the level of parking insufficiency may be more significant than shown here. v. Athletics The Fremont Campus offers on-campus recreational activities, but does not have nor is affiliated with any sports teams The Sports Club, a student government-sponsored organization, is working with the Cañon City Parks and Recreation Department to give students access to organized sport programs, such as Softball. Taking advantage of their open space, the College also has an on-site Frisbee golf course. (See Section III.J.). vi. Libraries The Fremont Campus Library houses 4,456 volumes at their on-site Learning Resource Center (LRC). vii. Class Scheduling With regard to scheduling for classrooms and laboratory facilities at the Fremont Campus, the Campus Dean works with a scheduler. The Dean reports to the President of PCC. viii. Facilities Maintenance and Annual Operation, Maintenance and Utility Costs There are campus employees assigned to grounds keeping and maintenance. Additionally, the Fremont Campus is supported by the Facilities Department at the Pueblo Campus.
Pueblo Community College Facilities Master Plan – Vol. 2 Fremont Campus
Section II., Page 5 July 1, 2012
PROGRAM INFORMATION / INSTITUTIONAL DATA OVERVIEW
Annual Operation, Maintenance and Utility Costs Based on reports from the Facilities Director, the following table outlines the combined annual costs for operating and maintaining the facilities at both the Pueblo Campus and the Fremont Campus:
Budget Item Repair and Maintenance Janitorial Roads and Grounds Utilities
Gross Square Footage GSF 33,000 435,343 2,439,360 33,000
Annual Cost $ $ 1,012,281 $ 406,569 $ 251,237 $ 104,963
Cost per GSF $/GSF $2.2642 $0.9339 $0.1030 $3.18
Totals – GSF 3,758,932 TOTAL ANNUAL EXPENSE $2,686,710 $0.7148 The annual operation, maintenance and utility cost per combined Student FTE, based on Fall 2009 FTE = $ 2,686, 710 / 3,366 FTE = $ 789.19 ix. Relevant Institutional Space Allocation Guidelines The consultants referred to several sources for guidelines used in this Master Plan in ascertaining the College’s projections, covered in detail in Section III.C. The Colorado Community College System Office recently established space utilization guidelines in late Spring of 2010. The Colorado Department of Higher Education likewise has set standards for higher education facilities. Renowned planning industry leader, the Council of Educational Facility Planners International (CEFPI) publishes planning guidelines for institutions of higher education. Furthermore, the consultants applied space guidelines based on existing building use in relevant specific situations. Guidelines are cited in the appropriate sections under Section III.C.
II.E.
ASSESSMENT OF ACADEMIC PLANS, STRATEGIC PLANS, TECHNOLOGY MASTER PLANS, AND ANY OTHER RELEVANT STRATEGIC PLANNING IN RELATION TO THE PROPOSED MASTER PLAN
Academic Plans Pueblo Community College continually engages in a comprehensive academic planning process. Committees involved in this planning process review and evaluate existing programs for their viability or potential removal, as well as newly proposed programs. These committees will be actively reviewing the Facilities Master Plan to guide decisions on academic plans to determine the appropriate physical resources exist to support these plans. The educational programs are under the overall supervision of the Vice President of Learning and the Deans of Arts and Sciences, Business and Technology, and Health Professions. Strategic Planning Pueblo Community College participates in the Academic Quality Improvement Program of the Higher Learning Commission (AQIP), a comprehensive and self evaluation process, focusing on enhancing operations of the College through quality improvement. In 2007, as an AQIP action, the College put into place a strategic planning model intended to conduct effective, consistent, and continuous strategic planning into the future. Their most current strategic plan for 2008-2012 (see Appendix A in Volume 1) identified six strategic objectives: •
Offer all students a mentored and focused pathway to success to ensure they graduate with relevant 21st-century skills.
Pueblo Community College Facilities Master Plan – Vol. 2 Fremont Campus
Section II., Page 6 July 1, 2012
PROGRAM INFORMATION / INSTITUTIONAL DATA OVERVIEW
• • • • •
Support and engage the “whole student” through assured success strategies in learning, leadership, and life skills. Become a recognized leader in higher education programs and curricula. Strengthen the regional workforce to contribute to economic growth and vitality in southern Colorado. (See Section II.J. in Volume I with regard to Programs addressing this objective.) Foster professional development and leadership opportunities for all employees. Implement state-of-the-art continuous improvement processes at both the strategic and daily work flow levels.
The Facilities Master Plan has the ability to work in concert with the Strategic Plan process, and participants involved in both planning processes can assure goals are in alignment. CCCS Strategic Plan The CCCS Strategic Plan identifies five key goals addressing student access, success, and operational excellence, three of which are highlighted within this Facilities Master Plan: •
•
•
Student Access Goal: “All Coloradoans shall have access to comprehensive community college educational programs.” (Section II.G. in Volume I, Enrollment: Projections, Demographics) Student Success Goal: “The demands of Colorado businesses and communities shall be met through the development of a highly skilled workforce.” (Section II.J. in Volume I, Institution’s Programs in response to Service Area Economy) Student Success Goal: “Colorado students shall have seamless opportunities to transition from high school into college and from two-year institutions into four-year institutions.” (Section II.I. in Volume I, Student Performance)
Colorado EPP and Office of the State Architect HPCP In July of 2009, the State of Colorado Department of Personnel and Administration State Purchasing Office published the document “Environmentally Preferable Purchasing” (EPP) which adopted the EPP policy guidance for the procurement of sustainable commodities and services. The policy guidance is intended to facilitate adoption of best environmental practices consistent with Federallyadopted environmental purchasing trends. One of the mandates in this policy is a requirement for all new construction over 5,000 square feet among State Buildings’ capital construction projects to achieve LEED Gold status per the Office of the State Architect’s High Performance Certification Program (HPCP)*. In consideration of this requirement, Pueblo Community College must anticipate the mark up associated with commissioning for project construction costs. Commissioning agents require additional fees that must be incorporated into a project budget, however the Owner must keep in mind that Commissioning is an important part of the LEED process in that it ensures that greater cost savings to the Owner as a result of energy-efficiency are achieved. *
Source: Policy document OSA-HPCP, originally published September 1, 2007, updated February of 2010.
Further descriptions of the design criteria and cost impact with LEED Gold are covered under Section IV.E., Campus Plans and Supporting Data. Technology Master Plan The vigilant re-evaluation of Pueblo Community College’s Information Technology Master Plan has become increasingly important as technology changes and the demands of business and industry increase, particularly with the demands of upgrades at all campuses. The college intends to remain state-of-the-art in communication techniques, administrative management tools, alternative delivery methods (classroom or remote), networking, bandwidth and video-conferencing capabilities. PCC’s IT Department remains committed to supporting the mission and goals of PCC’s Information Pueblo Community College Facilities Master Plan – Vol. 2 Fremont Campus
Section II., Page 7 July 1, 2012
PROGRAM INFORMATION / INSTITUTIONAL DATA OVERVIEW
Technology Master Plan, which was developed in 2001, reviewed in 2005, and revised in 2007, and remains effective through the end of the 2010-2011 academic year. At this writing, the College’s Information Technology Services recently unveiled PCC’s new five year Information Technology Master Plan 2011 - 2015, dated December, 2010, attached to this Facilities Master Plan (Refer to Appendix B. in Volume 1). The Plan cites the pressing need of committing budget for staffing and remaining state-of-the-art with its technology infrastructure, emphasizing increased access to information and security. It is important to note that staffing guidelines are drawn from industry standards which should be considered in conjunction with those set by peer institutions. As a course of action with this Facility Master Plan, discussions involving IT planning with the appropriate college personnel and user groups and A/E design teams should be integrated throughout the planning, design, pre-construction and construction stages of any building project. Built into these discussions will be review of security and backup systems and construction scheduling coordination.
II.F.
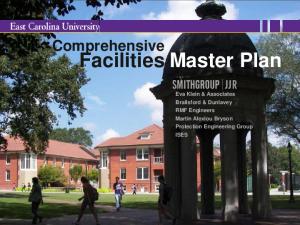
CAMPUS LOCATION MAP
The Fremont Campus is located at 51320 West Highway 50 in Cañon City, just west of the commercial downtown of Cañon City, past Territorial Prison, and east of Royal Gorge.
Figure A. Campus Location Map.
Source: Pueblo Community College
Map not to scale
Author’s note: Appendices A., B., C., D., and E. appear throughout this document, addressing elements of utilization, building inventory, and enrollment projection.
Pueblo Community College Facilities Master Plan – Vol. 2 Fremont Campus
Section II., Page 8 July 1, 2012
PROGRAM INFORMATION / INSTITUTIONAL DATA OVERVIEW
II.G. ENROLLMENT: PROJECTIONS, DEMOGRAPHICS As a forward to the FTE and Headcount enrollment narratives, a discussion on county and state population forecasting is included to study anticipated growth. The Fremont Campus’ immediate service area is comprised of Fremont County and Custer County. Source: Colorado Demography Office
COUNTY AREA SERVED BY PUEBLO COMMUNITY COLLEGE – Fremont Campus TABLE 3. PRELIMINARY POPULATION FORECASTS, 2000 - 2030 CDS CENSUS
CDS PROJ.
CDS PROJ.
CDS PROJ.
CDS PROJ.
CDS PROJ.
CDS PROJ.
April, 2000
July, 2005
July, 2010
July, 2015
July, 2020
July, 2025
July, 2030
00-05
05-10
10-15
15-20
20-25
25-30
Colorado
4338793
4731275
5171798
5632137
6186161
6718452
7227385
1.7%
1.8%
1.7%
1.9%
1.7%
1.5%
Fremont
46,145
46,957
48,825
53,101
58,285
63,411
68,288
1.7%
4.0%
8.7%
8.1%
8.8%
7.7%
Custer TOTAL
3,503 49,648
3,881 50,838
5,098 53,923
5,956 59,057
6,031 64,316
6,925 70,336
7,782 76,070
10.7%
31.6%
16.8%
1.3%
14.8%
12.4%
Average Annual Percent Change
The State Demography Office’s projected population forecast includes a county listing up to Year 2030, prepared by the Projections Program, which takes into account job, labor force and migration forecasts. The following table follows Fremont and Custer Counties’ population forecasts up to Year 2030. The figures were produced in October of 2009. The percentage change for both Fremont County and Custer County follow a steady increase, similar to the state of Colorado’s population forecast trend, but significantly higher than Colorado’s 1.5% average increase, through Year 2040. Custer County is projected to have higher increases than Fremont’s. FTE Enrollment Fremont’s enrollment trends as well as the overall PCC Campuses and PCC Online and Inmate populations are documented in the following chart and graphs. It is important to note that the current database system Banner was implemented in Fall of 2006; prior to that time SIS was the database system. Given the difference in database systems and to maintain reporting consistency, the past four years are tracked (Fall 2006 – Fall 2009) to compare with projections up to 2014. In addition, the FTEs represented in this Facilities Master Plan reflect the “Course Campus FTE”; they are not “Priority Campus” FTE which include the online FTEs. Fremont’s enrollment projections are reported as a slight but steady increase in enrollment, reflected in anticipated economic recovery for Fremont and Custer counties and the state of Colorado, and the combined primary service areas’ anticipated population increase of 12.75% average annual percentage change. Reporting for Custer County shows a dramatic increase for the master plan period.
Fall End of Term Enrollment Trends - Semester FTE by Campus
All PCC Campuses Fremont Campus PCCOnline/CCCOnline Corrections
2005 3258 315 244 0
End-of-Term data 2006 2007 2008 3105 3075 3370 323 324 356 142 184 277 4 0 19
Pueblo Community College Facilities Master Plan – Vol. 2 Fremont Campus
2009 4667 446 288 13
Projected End-of-Term 2010 2011 2012 2013 2014 455
464
469
474
Section II., Page 9 July 1, 2012
479
PROGRAM INFORMATION / INSTITUTIONAL DATA OVERVIEW
CCCS Strategic Plan – Key Performance Measures: Ages 14 – 64 In addition to the study of Fremont & Custer County’s overall population average increase of 12.75% for the master plan period, average data from the Census Bureau was collected on the age range of 14 – 64, the target age range for the community college student. The next graph studies the population for this age group in the subject counties and the FTE enrollments at the Fremont campus – historic and projected into 2014. Trend lines superimposed on both graphs appear to be unparallel, highlighting Fremont Campus’ apparent higher rate of growth (over 5:1) compared to those of the combined Fremont and Custer Counties. FREMONT/CUSTER COUNTIES GROWTH AGES 14-64 TREND LINE AT 0.80% AVERAGE
FREMONT CAMPUS GROWTH TREND LINE AT
ANNUAL INCREASE YRS 2005-14
Historic Years + Projection Years
4.99% AVERAGE ANNUAL INCREASE YRS 2005-14
Note: Linear trend lines of Fremont / Custer Counties’ population and Fremont Campus FTE show unparallel rates of growth.
YR 2014
479
YR 2013
474
YR 2012
469
38,060
YR 2011
464
37,796
YR 2010
455
37,389
YR 2009
446
37,034
YR 2008
362
36,861
YR 2007
324
36,886
YR 2006
324
36,726
YR 2005
315
36,444
0
39,178 38,580
10,000 20,000 30,000 40,000 Population - Fremont / Custer Counties Ages 14 - 64
Pueblo Community College Facilities Master Plan – Vol. 2 Fremont Campus
Fremont Campus FTE
Fremont/Custer Counties Linear (Fremont/Custer Counties) 50,000
Section II., Page 10 July 1, 2012
PROGRAM INFORMATION / INSTITUTIONAL DATA OVERVIEW
Historic patterns of annualized FTE tracking for Fremont enrollment are documented in Appendix C., which highlights peak and downturn activity associated with economic cycles but illustrates a general upward trend. Also noteworthy is the second Appendix C. chart tracking enrollment trends for local school districts in Fremont and Custer County. These trends reflect a stabilization to slight decrease of enrollment for all represented school districts, which differ with the Census’ anticipated increase of older populations into the Fremont and Custer Counties.
Fremont Campus Basic Enrollment Data – Headcount Note: See Volume 1, Section II.G. for PCC Online, PCC CCCOnline and Corrections enrollments.
The following charts and graphs, “Fall 2009 Demographics” and “Fremont Campus Student Resident Demographic Data” provide the makeup of the Fremont Campus’ enrolled students. Comparisons of the figures from these charts with those drawn from the 2006 Basic Enrollment Data (Fall of 2005) indicate the following: Overall enrollment at the Fremont Campus has grown by 53% (2006 projections indicated 10% growth). Fremont continues to lead in enrollment growth among the PCC campuses; The number of Full-time students showed a decrease from 37.8% to 31.6%; Female students continue to make up the majority of students, though the disparity between male students decreased over this time period by 13.2%; Students attending at the Fremont Campus are still overwhelmingly resident status; Ethnicity continues to show similar make-up, with White-Non-Hispanic comprising the majority of students; The average age of the Fremont Campus student is 27.3, down from 30.6 in Fall of 2005. The largest age group is in the 18-20 age bracket, over 1 in 5 students; The top resident students’ zip codes shown have changed little from 2005 – positions 1-5 are relatively unchanged, but suggest more Custer residents attending. The following tables and graphs, “Student Demographics” and “Fremont Campus Student Resident Demographic Data” provide the headcount makeup of enrolled students.
Pueblo Community College Facilities Master Plan – Vol. 2 Fremont Campus
Section II., Page 11 July 1, 2012
PROGRAM INFORMATION / INSTITUTIONAL DATA OVERVIEW
Student Demographics: Fall 2009 compared with Fall 2005 Percent relative to Fall 2009
Demographic
Fall 2005 (%)
Headcount
535 (100%)
Fall 2009 817
Full Time Part Time Gender
202 (37.8%) 333 (62.2%)
258 559
31.6% 68.4%
Female Male
404 (75.5%) 131 (24.5%)
509 308
62.3% 37.7%
3 (0.6%) 532 (99.4%)
4 813
0.5% 99.5%
7 (1.3%) 4 (0.7%) 3 (0.6%) 45 (8.4%) 9 (1.7%) 467 (87.3%)
28 8 4 70 81 626
3.4% 1.0% 0.5% 8.6% 9.9% 76.6%
* * * * * * 65 (12.1%) 51 (9.5%) 42 (7.9%) * * * * * * 30.6
2 140 169 72 78 117 69 69 27 40 21 8 3 1 1 27.3
0.2% 17.1% 20.7% 8.8% 9.6% 14.3% 8.4% 8.4% 3.3% 5.0% 2.6% 1.0% 0.4% 0.1% 0.1%
100%
F/T – P/T
Residency Non-Resident Resident Ethnicity Amer. Indian/Alask. Native Asian / Pacific Islander Black Non-Hispanic Hispanic – Other Unknown / Not Reported White – Non-Hispanic Age *age categories revised since 2005 unless noted otherwise
70 Average Age
Pueblo Community College Facilities Master Plan – Vol. 2 Fremont Campus
Section II., Page 12 July 1, 2012
PROGRAM INFORMATION / INSTITUTIONAL DATA OVERVIEW
Fremont Campus
Demographics by Enrollment
Fremont Campus
Demographics by Residency 99.5%
100.0%
68.4%
70.0%
Fremont Campus
Demographics by Gender
70.0%
60.0%
60.0%
50.0%
50.0%
62.3%
90.0% 80.0% 70.0% 60.0%
37.7% 40.0%
50.0%
40.0%
31.6%
30.0%
30.0%
20.0%
20.0%
10.0%
10.0%
40.0% 30.0% 20.0%
Full-Time
0.5%
10.0% 0.0%
Female
Part-Time
Resident
Male
Non-Resident
Fremont Campus
Demographics By Ethnicity 90.0% 76.6%
80.0% 70.0% 60.0% 50.0% 40.0% 30.0% 20.0% 9.9%
1.0%
0.5% Black NonHispanic
3.4%
Asian/Pacific Islander
8.64
10.0%
Fremont Campus Demographics
White - NonHispanic
Unknown/Not Reported
Hispanic - Other
American Indian/Alaskan Native
0.0%
by Age
25.0% 20.7% 20.0%
17.1% 14.3%
15.0% 8.8% 9.6%
10.0%
8.4% 8.4% 5.0% 3.3%
5.0%
2.6% 1.0% 0.4% 0.1% 0.1%
0.2%
Pueblo Community College Facilities Master Plan – Vol. 2 Fremont Campus
>70
66-70
61-65
56 - 60
51 - 55
46 - 50
41 - 45
36 - 40
31 - 35
26 - 30
23 - 25
21 -22
18 - 20
16 - 17
< 16
0.0%
Section II., Page 13 July 1, 2012
PROGRAM INFORMATION / INSTITUTIONAL DATA OVERVIEW
Fremont Campus Student Resident Demographic Data by Zip Code Note: Excludes Online data.
Rank 1 2 3 4 5 6 7 8 9 10
Zip Code 81212 81226 81240 81223 81215 81007 81244 81252 81005 81201
Headcount
Description
566 95 58 16 11 6 5 5 4 4
Cañon City Florence Penrose Cotopaxi Cañon City Pueblo West Rockvale Custer SW Pueblo Chafee
Top 5 zip codes = 746 or roughly 91.2% of Headcount, the measure of the 25 miles radius from the campus site.
PCC Headcount By ZipCode - Fall 2009 Fremont Campus
Zip Code 81212 81226 81240 81215
Description Cañon City Florence Penrose Cañon City Additional Service Area Zip Codes
Total Headcount 817 Headcount % Total Cumulative 566 69.3% 69.3% 95 11.6% 80.9% 58 7.1% 88.0% 11 1.3% 89.4% 15
1.8%
91.2%
Figure B. Student Enrollment Service Area Map, excludes online. Source: David Besel /Colorado Community College System (CCCS) Copyright © 1997-2009 Jon Corvat – USNaviguide.com Map data © 2011 Google maps
Map not to scale
The zip code information and map suggest that in Fall 2009 a large percentage of FTE students lived within a 25 mile radius from campus (91.2%), mostly from Fremont County. Summary of Student Demographics A review of the demographics presents some interesting patterns of growth that the Fremont Campus should consider in planning enrollments. The pre-college programs have introduced a much younger population to the traditional college adult environment. There is a steady increase of high school enrollments reported among community colleges statewide*. High school-aged students are participating in programs alongside adult students as part of concurrent enrollment offerings at the Fremont Campus. Though the combined Fremont and Custer County growth rate projections did not match the Fremont Campus growth, the 14-64 age range graphs identified the 16-17 age as the second largest age representation for the two county area. Custer County’s anticipated relative high growth should also be a planning consideration. The overall socialization, academic maturation, and environmental adaptations for this youthful segment are special needs to factor into planning. Many of these students do not have their own transportation, nor are some of legal driving age. Regarding demographic changes over the past Master Plan, the ethnicity demographic shows a slight shift toward a mix of ethnic groups. More men are attending, though women are still the majority. Most students attending Fremont still reside within the 25 mile radius, yet the number of full-time students Pueblo Community College Facilities Master Plan – Vol. 2 Fremont Campus
Section II., Page 14 July 1, 2012
PROGRAM INFORMATION / INSTITUTIONAL DATA OVERVIEW
has decreased. All these factors become important considerations on building use and traffic congestion. * Source: “Fall 2009 Fact Book”, CCCS Office www.cccs.edu, “Fall 2007 – 2009 High School Student Enrollment*”, pg. 22, reports statewide enrollments were steadily increasing between Fall 2007 and Fall 2009 at the average rate of 14% per year.
Fremont Campus Enrollment Distribution by Organizational Unit Table: Fall Semester FTE 2014 Projections by Program
The Enrollment Distribution by Organizational Unit chart below identifies enrollment for the 2009 fall semester as well as projected growth for the 2014 fall semester at the Fremont Campus.
Fall 2009 enrollment reveal the highest in the General Education transfer courses, followed by Nursing, Science and Arts & Humanities programs. Fall 2014 projections include continued growth for these programs and the Business programs, and no growth for the remaining.
Pueblo Community College Facilities Master Plan – Vol. 2 Fremont Campus
Section II., Page 15 July 1, 2012
PROGRAM INFORMATION / INSTITUTIONAL DATA OVERVIEW
II.H.
FACULTY AND STAFF SIZE AND DISTRIBUTION Fremont Campus Faculty and Staff Headcounts/FTE and Distribution Fall 2009 and growth to Fall 2014 Staff Category
FALL 2009
FALL 2014
Headcount
FTE
Headcount
FTE
Administrator Full-Time Administrator Part-Time Administrative/Professional/Technical F/T Administrative/Professional/Technical P/T Classified Full-Time Classified Part-Time Faculty Full-Time Faculty Part-Time Instructor Part-Time
1 0 2 1 7 2 7 0 41
1 0 2 0.5 7 1.25 5 0 4
1 0 4 1 7 2 10 2 70
1 0 3 0.5 7 1.25 10 1 9
TOTALS
61
20.75
97
32.75
Non-Student Hourly Student Hourly Work Study
II.I.
Fall 2009 Headcount
Fall 2014 Headcount
3 1 13
10 15 26
STUDENT PERFORMANCE
(Refer to section II.I in Volume 1 for student performance data.)
II.J.
INSTITUTION’S PROGRAMS IN RESPONSE TO SERVICE AREA ECONOMY
It is important to note that the Fremont Campus of Pueblo Community College works closely with many companies, organizations and agencies through partnerships, grants and contracts. Partnering organizations for the Fremont Campus include the following: • • • • • • •
Fremont Economic Development Corporation Fremont RE-1 School District (Cañon City) Fremont RE-2 School District (FlorencePenrose) Cotopaxi Schools Custer County Schools St. Thomas Moore Hospital Centura Health Facilities: o St. Thomas Moore Hospital o St Mary Corwin Hospital
• • • • •
Hildebrand Care Center Colorado State Veterans Home-Florence Parkview Medical Center Colorado Mental Health Institute-Pueblo Memorial Hospital Colorado Springs
Pueblo Community College Facilities Master Plan – Vol. 2 Fremont Campus
• • • • • • • • • • • •
Colorado State University-Pueblo Small Business Development Center – Fremont County Cañon City Workforce Center Upper Arkansas Area Council of Governments Upper Arkansas Area Workforce Investment Board Cañon City Chamber of Commerce U.S. Department of Justice-Federal Bureau of Prisons-Florence Complex Fremont Economic Development Corporation Fremont County Department of Human Services City of Cañon City Cañon City Area Recreation & Park District Brush Marks Art Guild
Section II., Page 16 July 1, 2012
PROGRAM INFORMATION / INSTITUTIONAL DATA OVERVIEW
• • • • • •
Royal Gorge Quilt Council Project ECHO (Early Childhood training) Rocky Mountain Behavioral Health (Cañon City) Pueblo Community College Foundation Cañon City Fire Department Cañon City Rotary Club
• • • • •
Royal Gorge Artists Association Orchard of Hope Foundation Loaves and Fishes Southeastern Colorado Health Education Consortium U.S. Bank
These valued relationships underscore the major role of the College’s impact to local, regional and state economies. As an example, the Fremont Campus is home to the Small Business Development Center, the primary support organization for business plan development assistance, counseling and referral to financial sources for businesses and industry in Fremont County, working directly with employers to build a dedicated workforce. In addition, Pueblo Community College has been the recipient of many grants and awards (funds reported approximately $5,399,712 in FY08-09 and FY09-10), which allow the College to enact programs that support the communities of their respective service areas, programs in these fiscal years such as: three-year funding to build mobile labs and implement community job based training programs in Pueblo, El Paso and Teller Counties; Dental Assist education / community service project; equipment for the PCC Health Clinics on each campus; pre- and post-nursing education programs for diverse student populations; nursing scholarships, upgrade of simulators to support Health Professions and CES (Center for Health & Emergency Services); Balloon Satellite program, integrated into course and extra-curricular experience from NASA; Early Childhood Program quality improvement; scholarships for students pursuing careers as teachers in high needs areas; PCC team participation in IHEP Symposium on financial Literacy and College Success at Minority Serving Institutions; subsidizing cost of TED course and exam fees for students; Bridge to HOPE and Opportunity program to support former offenders in pre-college programs.
Pueblo Community College Facilities Master Plan – Vol. 2 Fremont Campus
Section II., Page 17 July 1, 2012
III. EXISTING CONDITIONS ASSESSMENT / CONCLUSIONS
Pueblo Community College Facilities Master Plan – Vol. 2 Fremont Campus
Section III July 1, 2012
EXISTING CONDITIONS ASSESSMENT AND CONCLUSIONS
III.
EXISTING CONDITIONS AND ASSESSMENT AND CONCLUSIONS
III.A.
CURRENT LAND USE MAP
i. Campus Building Functions by Locations The Fremont Campus is a satellite campus for Pueblo Community College. Its operations are housed in one main campus building which sits in the relative center of a rectangular-shaped site. Other buildings on site are the original prison garden structures, which are presently not occupied. ii. Land Uses Adjacent to the Campus As the former property of the Department of Corrections, the Fremont Campus site is in close proximity to DOC properties, most notably the Colorado State Penitentiary to the north. The City of Cañon City’s Water Treatment plant lies adjacent to the southwest of the campus, with Unzoned open space areas adjacent to the campus’ northwest and west boundaries and a State Wildlife Area extending further northwest. To the east of the campus site sits U.S. Highway 50.
Fremont Campus – satellite campus for PCC, academic spaces, administrative spaces, full-range of student services, Learning Resource Center, auxiliary functions (bookstore), physical plant and other building support services
Source: Google Maps, City of Cañon City Zone District Map, December, 2010 City - Residential
City - Industrial
Dept. of Corrections
City - Commercial
City - Open Space
State Wildlife Area
Map not to scale Unzoned
Figure C. Current Land Use Map.
Pueblo Community College Facilities Master Plan – Vol. 2 Fremont Campus
Section III., Page 18 July 1, 2012
EXISTING CONDITIONS ASSESSMENT AND CONCLUSIONS
III.B.
BUILDING LOCATIONS MAP
i.
Current footprints
Fremont Campus Main Building
Historic structures Highway 50 access / campus entrance
Historic Barn and Watchtower structures
Figure D. Fremont Campus, 51320 West Highway 50.
Source: Stephen Hall Architects, Bennett Wagner & Grody Architects, Milestone Engineering
Drawing not to scale
The Fremont Campus on West Highway 50 is comprised of one main college building and six unoccupied historic buildings, totaling 41,917 GSF (.96 acre). The Main Campus Building is approximately 32,607 gross square feet and is a one-story building. Historic Buildings: The following historic buildings exist on site and are currently not used nor occupied: The Tower is approximately 144 gross square feet and is a one-story building that is raised on a 4-foot high platform. The Barn is approximately 4,404 gross square feet and is a two-story high building. Gross square footage may be increased depending on the decision to develop full or partial second-story spaces. The Storehouse is approximately 770 gross square feet and is one story. The Bunkhouse is approximately 555 gross square feet and is one story. The Residence is approximately 169 gross square feet and is one story. The Dining Hall is approximately 3,268 gross square feet and is one story.
Pueblo Community College Facilities Master Plan – Vol. 2 Fremont Campus
Section III., Page 19 July 1, 2012
EXISTING CONDITIONS ASSESSMENT AND CONCLUSIONS
III.C.
CURRENT SPACE INVENTORY / PROJECTIONS TABLES
i.
Current Space Utilization by Space Type in Relation to Department Space Utilization Guidelines Utilization of the classrooms and teaching laboratories was reviewed using Fall 2009 course and facility data for the Fremont Campus received by PCC’s Office of Institutional Research and Accreditation through Banner, and comprehensive scheduling information from Fremont administrative staff. The utilization analyses includes scheduled room use by day and time of day, as well as utilization analyzing weekly room hours of use and student station occupancy percentage. This information assisted in the formulation of the classroom and laboratory guideline applications for Pueblo Community College in association with the space guidelines set by the Colorado Community College System office in concert with the Colorado Commission on Higher Education. Detailed space inventory for the Campus Building is located in Appendix B. The Space Utilization table is located in Appendix D. In addition, the consultants, interviewed the Fremont Campus Dean at the Fremont campus, and met with Pueblo Campus administration at the Pueblo Campus to gather additional information on space needs. This information combined with enrollment data was used to perform the space needs analyses. Space needs were compared to existing space at the Fremont campus to determine surpluses and deficits. Classrooms The 2010 CCCS “Space Utilization Guidelines for Master Planning” defines college classrooms as rooms used for scheduled classes that are not limited in their use to a specific subject or discipline. College classrooms include general purpose classrooms, lecture halls, seminar rooms, auditoriums, and computer classrooms that are not software specific. Classroom service space supports one or more classrooms, providing media support, preparation areas or storage. Fremont Campus has a total of nine classrooms. However, the College reported that to accommodate their scheduling and enrollment, the College created classrooms from “unconventional” classroom spaces, namely A105, an administrative conference room and L118, a room within the Library area created with moveable partitions to accommodate classes. This classroom space combined with classroom service area totals 5,778 ASF. The 2010 CCCS guideline for classrooms utilizes a formula which determines a space factor: 2010 CCCS Guideline: 22 ASF Assignable Square Footage
Space Factor
=
Average Station Size Station Occupancy x Total Hours/Week
2010 CCCS Guideline: 68% classroom
2010 CCCS Guideline: 42 Hours day/evening use facility for Classrooms;
This equation produces a Space Factor of 0.77. This space factor is multiplied by the Weekly Student Contact Hours (WSCH) – see Appendix D for WSCH totals – for both the Fall Semester Base Year and Target Year:
Pueblo Community College Facilities Master Plan – Vol. 2 Fremont Campus
Section III., Page 20 July 1, 2012
EXISTING CONDITIONS ASSESSMENT AND CONCLUSIONS
Fall 2009 = 0.77 x 3,171 = 2,442 ASF Fall 2014 = 0.77 x 3,404 = 2,621 ASF Given that the existing classroom/service area is 5,778 ASF, this calculation indicates a surplus of classroom space for both the base year and the target year. Teaching Laboratories Teaching laboratories are rooms used predominantly for regularly scheduled classes that require special equipment for student participation, experimentation, observation, or practice. The 2010 CCCS “Space Utilization Guidelines for Master Planning” identified multiple categories for teaching laboratories with recommended ASF for their respective spaces. Student Stations are noted to include service spaces. Fremont Campus has five teaching laboratories. Combined with the teaching lab service area, the campus has a total of 5,485 ASF. Among the teaching lab types found at the campus are: General Science, Chemistry and Physics, Business, Music, Art, Nursing, Health Sciences, Multi-Media, and Computer Science. The Fremont Campus has an arrangement with the local high school to conduct welding classes. The CCCS guideline for teaching laboratories utilizes a formula which determines a space factor: 2010 CCCS Guideline: ASF - varies Average Assignable Square Footage
Space Factor
=
Average Station Size Station Occupancy x Total Hours/Week
2010 CCCS Guideline: 80% laboratories
2010 CCCS Guideline: 28 Hours day/evening use facility for Laboratories
The consultants identified four teaching laboratory space types (Art, Computer, Nursing, and Science – Wet Lab) for the Fremont Campus in Fall 2009. Using the CSSS guideline factors, listed below, the consultants determined an average ASF for the Fremont Campus. Teaching Lab Type General Science – Wet Lab Chemistry and Physics Dining Teaching Business Music Art - average Nursing Health Sciences Foreign Language Multi-media Computer Science Auto Repair Building Trades Electronics (bench type) Machine Shop, Wood Shop Welding
Teaching Lab ASF 65 65 22 33 39 58 100 100 40 75 37 240 210 50 60 100
Pueblo Community College Facilities Master Plan – Vol. 2 Fremont Campus
Section III., Page 21 July 1, 2012
EXISTING CONDITIONS ASSESSMENT AND CONCLUSIONS
The breakdown of the guideline ASF space factors used for the Fremont Campus’ teaching laboratories is as follows: Art (2D dry/wet media) = 60 Computer (median between Computer Science and Multi-media) = 56 Nursing = two labs at 100 each Science (wet lab) = 65 Average Assignable Square Footage = 76.20. Applying this average to the equation, the Space Factor is calculated to be 3.40. This space factor is multiplied by the Weekly Student Contact Hours (WSCH) – see Appendix D for WSCH totals – for both the Fall Semester Base Year and Target Year: Fall 2009 = 3.40 x 779 = 2,649 ASF Fall 2014 = 3.40 x 836 = 2,843 ASF Given that the existing teaching laboratory/service area is 5,485 ASF, this calculation indicates a surplus of teaching lab space for both the base year and the target year. Open Laboratory CEFPI defines the open laboratory as laboratories not used on a regularly scheduled basis, having “disparate functions” as computer laboratories with discipline specific software or where access is limited, group and individual music practice rooms, and studios for independent study. Intensity of use and station size may be varied to meet institutional requirements. The Fremont Campus has one large open lab in the library for assessment testing and two smaller open labs also for testing, computer and pencil formats. Open teaching lab space was calculated by multiplying a Space Factor by the fall FTE; 4.9 is the recommendation by CEFPI for institutions less than 3,000. Fall 2009 = 4.9 x 446 = 2,186 ASF Fall 2014 = 4.9 x 479 = 2,347 ASF
Office Space The Colorado Department of Higher Education has established guidelines for office space: Staffing Type
Office ASF
President Vice President/Dean Department Chair / Manager Faculty Supervisor Technical / Paraprofessional Clerical / Secretarial
300 250 200 130 130 120 100
Office space is determined by multiplying the space factor guidelines by FTE. The Fremont Campus has two types of general office space: Academic Office and Administrative Office. Academic: Fall 2009 Faculty FTE was reported at 5 FTE, comprised of department chairs/directors, faculty, adjunct instructors, and faculty support. CEFPI recommends using a fraction for adjuncts and students’ headcounts, such as ½ faculty for part-time and ¼ for students (the consultants used a reduced fraction 1/3 for part-time/adjunct and a station factor of 5 ASF/student headcount:
Pueblo Community College Facilities Master Plan – Vol. 2 Fremont Campus
Section III., Page 22 July 1, 2012
EXISTING CONDITIONS ASSESSMENT AND CONCLUSIONS
Faculty (5 x 130) + Part-time/Adjunct 1/3(41) x 130 + Hourly/Students ¼(17) x 5 = 650 + 1,777 + 22 = 2,449 ASF for Fall 2009. For Fall 2014, the consultants applied a modest increase of 650 (F/T faculty) additional ASF to account for faculty growth = 3,099 ASF. Administrative: Fall 2009 Administrative FTE (Administration, APT, Classified, and all non-academic deans) information for the Pueblo Campus was reported at 11.75 FTE. Space recommendations were assigned as follows: Dean (non-academic) (1.0 x 250) + APT (2.5 x 150) + Classified (8.25 x 100) = 250 + 375 + 825 = 1,450 ASF for the Fall 2009 guideline; the consultants applied the increased staff FTE to obtain the Fall 2014 guideline = 1,600 ASF. Administrative office space at the Fremont Campus also includes the internal lounge areas, meeting rooms that serve not only the campus but the community at large, as well as the Go!Zone enrollment center, which encompasses student stations. As the campus’ main entry waiting room accounts for some of the Go!Zone enrollment area, the consultants chose a small factor to calculate this space enrollment area: 12% of FTE factor similar to the CEFPI for Study Space multiplied by 9 ASF: (.12 x 446) x 9 = 482 ASF. For the meeting rooms, the consultants chose to use the existing meeting room inventory = 825 ASF. (Lounges will be taken up in surplus in administrative office support space.) Therefore, total ‘Other Administrative’ space requirements = 482 + 825 = 1,307 ASF for the Fall 2009 guideline; the consultants applied the increased FTE to obtain the Fall 2014 guideline = 518 + 825 = 1,343 ASF. Library The Learning Resource Center (LRC) at Fremont Campus serves as a multi-functional space that is used as a study area, a stacks area, and exhibit/event space with appropriate service areas. All of these functions have been incorporated into the space analysis, excluding areas defined as Open Laboratory and Service (200). It bears mentioning the impact of the LRC and the Pueblo Campus Library their collection resources to the overall campus population with regard to space inventory. Usage of library resources is up, with resources being utilized 763,746 times in fiscal year July 09 to June 10, a 179% increase over the previous fiscal year (July 08 – June 09). Current LRC available resources with utilization figures for FY 09-10 include: Usage / Circulation (stacks, reserves, software, equipment): 106,478 – combined Pueblo & Fremont Collection: 1,097 book volumes, 1,037 AV titles - Fremont Online catalog usage: 197,750 searches and full text retrieval ebooks: 16,388 (netLibrary and Stat!Ref); accessed 2,958 times Online Databases: 29; accessed 457,065 times Other media: VHS tapes (being replaced by DVDs and video on demand), laser discs, slides, slide cassettes, film strips, audiocassettes (being replaced by CD audio). This latter list represents those media showing a decrease in use/circulation. This is one point underscoring the popularity of digital media and the use of the web. Resources showing an increase in requests include: downloadable ebooks, downloadable videos, earbuds.
Pueblo Community College Facilities Master Plan – Vol. 2 Fremont Campus
Section III., Page 23 July 1, 2012
EXISTING CONDITIONS ASSESSMENT AND CONCLUSIONS
Online Reference: All campuses have access to online reference services through EBSCO Host’s Ask a Librarian. In addition there is a link on all campus library pages to the PCC Library’s email reference assistance. This trend of online usage will likewise impact course delivery and ultimately LRC access/usage patterns, as patron numbers increase. Library space utilization for the Fremont Campus was determined using the CEFPI standards which utilize space factors with both collection and enrollment. Stack (or collection) space is calculated at 0.08 ASF per physical bound volume equivalent (PVBE), where bound volumes are given a factor of 1. A detailed breakdown of quantities of different types of audio-visual materials except for audio tape, periodicals, newspapers and other documents was not provided. For the purpose of this analysis, a (PBVE) factor of 1.2 was assigned to the audio tape collection and a .5 factor of bound volume count to account for other materials. An allowance factor of .03 was further applied to the collection for growth. Processing is figured at 18% of collection space. The LRC also includes Study Space which will be calculated at 35 ASF per user, and study service at 12% of study space, and Exhibit/Event Space which will be calculated at 1.5 ASF per user, where user is determined as a percentage of FTE, with students at 12% and faculty at 5%, user = (0.12 x 446) + (.05 x 5) = 54: 2412 Total Library ASF = .08[(1,097) + (1.2 x 1,037) + (.5 x 1,097)] + .03 (stack) + [(36.5 * 54) + .12 (study)] =232 +7+ (1971 + 237) = 2440 ASF for Fall 2009; the consultants adjusted the FTEs to arrive at the Fall 2014 guideline in anticipation of growth = 2644 ASF. Assembly and Exhibit CEFPI defines assembly spaces, as spaces designed for large group events such as plays, concerts or commencement, and includes theaters, concert halls, and auditoriums. The recommendation for two year institutions for the first 5,000 FTE is to be assigned a core of 14,000 ASF. Without a formal assigned assembly area, the Fremont Campus has utilized its LRC to function as an ad hoc assembly area, which has reasonably accommodated a variety of functions, but scheduling issues have created undesired conflicts of events concurrent with open lab type functions. For the Fall 2009 and 2014 guidelines, the consultants chose the area assigned in the planned campus renovation project, the size of the existing Art Lab, 876 ASF, as this space was originally designed to be the campus’ assembly type space. For exhibit spaces, CEFPI assigns a product of a Space Factor and FTE, where institutions less than 3,000 FTE utilize 1.5 ASF / FTE, with a minimum of 2,000 ASF. With a strong Arts and Humanities program, the Fremont Campus regularly and exhibits works by students, faculty and visiting artists in its present corridor areas as well as room in the LRC on a temporary basis with no formal assigned exhibit space, as the corridors lend themselves to exhibit function. For the Fall 2009 guideline, the exhibit requirement = 1.4 x 446 = 669 ASF; for Fall 2014, the larger 2,000 ASF was chosen in anticipation of the campus expansion plans and potential historic barn renovation. Total Assembly + Exhibit:
Fall 2009 = 876 + 669 = 1,545 ASF Fall 2014 = 876 + 2,000 = 2,876 ASF
Support Facilities/Physical Plant As Support Facilities is an all-encompassing category, including Telecommunications, Shops and Central Service, an ample amount of space is required, particularly with PCC’s commitment to increase technology infrastructure. CEFPI notes ASF = 6% X (ASF of Room Use Codes 100 through 600) + (ASF of Room Use Codes 800 through 900). For the Fall 2009 guideline: 22,852 x .06 = 1,371 ASF. For the Fall 2014, the consultants recommended an increase based on the proposed expansion project: (22,852 + 6,000(approx)) x .06 = 1,732 ASF Pueblo Community College Facilities Master Plan – Vol. 2 Fremont Campus
Section III., Page 24 July 1, 2012
EXISTING CONDITIONS ASSESSMENT AND CONCLUSIONS
Auxiliary Space: Student Commons (Lounge) Recreation and/or rest areas for students are vital to higher education facilities, and more so for commuter campuses, where students travel long distances to attend classes. The recommendation for defined lounge space is 3 ASF/FTE. In addition, the recommendation for defined recreation space is 0.5 ASF/FTE, giving a combined recommendation total for lounge and recreation of 3.5 ASF/FTE. The consultants chose this factor for the Fremont Campus, making the design guideline 1,561 ASF for Fall 2009. The campus currently provides 544 ASF of Student Center Space (in the form of 2 Lounge areas), and plans to increase this to 2,100 ASF with future expansion projects; the consultants chose this figure for Fall 2014. Fitness Center The College has indicated that a Fitness Center is not a high priority for Fremont Campus at this time. The consultants agree that a Fitness Center is not appropriate for Fremont Campus, and specific guidelines for a Fitness Center will not be addressed under this Master Plan. Health Clinic Health Care facilities defined by CEFPI are those that are provided for the day-to-day care and primary treatment of students and staff. The two year institutions are assigned a core of 500 ASF + 0.2 ASF/FTE in excess of 1,500 FTE, which amounts to 500 ASF for the Fremont Campus. The consultants chose to reduce this to the size of the campus’ planned location for their health clinic (which opened Spring 2010), and accommodating one full-time professional staff, which is ample for anticipated growth = 196 ASF for the Fall 2009 and Fall 2014 guidelines. Merchandising CEFPI defines merchandising rooms as those involved in the sale of goods and services, and include such spaces as book and general merchandise stores, grocery stores, vending machine areas without seating, hair care, and central ticket areas. A Space Factor of 2 ASF/FTE is the guideline, with a minimum of 2,000 ASF. For Fall 2009 the guideline is 2 x 457 = 914 ASF. The Fremont Campus started with a campus bookstore at a total of 595 ASF. Within the past year, two merchandising areas were added, both which were incorporated into Corridor/Student Lounge Spaces: the coffee beverage cart at 120 ASF and the ATM machine at 45 ASF, bringing the total to 760 ASF, falling short of the guideline. The consultants chose the 914 ASF for both the 2009 and 2014 guidelines, in consideration of modest student growth and need for concentrated locations for food concessions. Conclusions The Fremont Campus reported high use of their facility in Fall of 2009, the base year. The space needs analysis confirmed 4,791 ASF combined deficits in open lab, administrative support, assembly and auxiliary spaces during the base year. However, the analysis also reported 6,172 ASF surplus in classroom and teaching laboratory spaces, though this surplus is reduced (-373 ASF) for the target year. Combined ASF/FTE for Academic and Academic Support Categories for Fall 2009 netted 39.71, 9.75% below State guideline for a satellite/branch campus, but Fall 2014 raises this figure to 43.74 ASF/FTE, which approximates the State guideline of 44. In evaluating the utilization studies that follow, the Fremont Campus must review and re-asses their existing building inventory in concert with room scheduling and the utilization studies to determine ideal and appropriate use of their existing building in conjunction with acquiring additional building space. Office, assembly and student spaces are clearly needs that must be addressed, but just as critical are managing the use of classrooms and teaching labs.
Pueblo Community College Facilities Master Plan – Vol. 2 Fremont Campus
Section III., Page 25 July 1, 2012
EXISTING CONDITIONS ASSESSMENT AND CONCLUSIONS
Pueblo Community College Facilities Master Plan – Vol. 2 Fremont Campus
Section III., Page 26 July 1, 2012
EXISTING CONDITIONS ASSESSMENT AND CONCLUSIONS
ii. Overview of Current Space Utilization Utilization of the classrooms and teaching laboratories was reviewed using Fall 2009 credit course enrollment and facility data for the Fremont Campus. Excluded from the enrollment data are noncredit courses, online, hybrid, and independent studies. As the Fremont campus offer morning through evening sessions throughout the weekdays, with additional weekend sessions, data was analyzed to determine the high use hours per building per campus. (See Appendix A.) For both classroom and teaching laboratories, these peak hours occurred primarily Monday through Thursday, between 10:00am to 9:00pm, with some classroom peak time extended into Mondays (before 9:00am) and Fridays (10:00am to12:00pm and 7:00pm to 8:00pm). Likewise, some laboratory peak times were extended into Fridays (11:00am to 12:00pm). The utilization analyses, as set by current CCCS guidelines, includes scheduled room use by day and time of day, as well as utilization analyzing weekly room hours of use, and weekly student (scheduled) contact hours (WSCH)* by students in credit courses, and student station occupancy as a expressed percentage of room station count multiplied by the state guidelines of 42 hours (classrooms) and 28 hours (laboratories). * Weekly student (or scheduled) contact hours = the number of equivalent hours (50-minute hours) that seats are occupied in a week during scheduled on-campus classes.
WSCH: Weekly Student Contact Hours
Utilization (%) Capacity
=
No. of Stations Occupied x Hours/Week Occupied No. of Stations x Total Hours/Week
Number of stations as identified in the Room inventory
2010 CCCS Guidelines: 42 Hours day/evening use facility for Classrooms; 28 Hours day/evening use facility for Laboratories
In using this formula, course enrollments that are considered out of the high use hours times, were excluded from the overall utilization percentage calculations. This eliminated courses with low enrollments and/or low contact hour classes. In addition to the formulation of the building utilization, data for assignable square footage (ASF) per student was collected to determine planning for classroom and laboratory guideline applications for the Fremont Campus in association with the space guidelines set by the Colorado Community College System office in concert with the Colorado Commission on Higher Education. Detailed space inventory for the Fremont Campus Building is located in Appendix B. Space Utilization tables are located in Appendices D and E. The Fall 2009 Utilization Summary is as follows:
Classroom State Guideline Target Utilization: 68% Teaching Laboratory State Guideline Target Utilization: 80%
Pueblo Community College Facilities Master Plan – Vol. 2 Fremont Campus
Section III., Page 27 July 1, 2012
EXISTING CONDITIONS ASSESSMENT AND CONCLUSIONS
Utilization Analysis by Student Station Occupancy (SSO) / Function Based on FTE enrollments for Fall 2009 Review of the classroom student station occupancy utilization analysis revealed for the campus average, utilization at 30%, far less than the desired utilization rate of 68%. Those classrooms demonstrating well above the average 30% with some over-enrolled courses, but still under the desired rate, included: classrooms for General Education courses, Business, Criminal Justice, Biology, Advanced Academic Achievement and Remedial English (C129 at 55%), General Education, Management, upper level Business and Psychology, and Remedial Math (C128 at 48%), General Education, Health Science, upper level Psychology and English, and Remedial Math and English (C127 at 46%), and Art, Criminal Justice, Health Science, upper level Counseling, Business Technology and Sociology, and Remedial Math (C126 at 45%). Teaching Laboratory usage analysis for the campus average likewise, showed low SSO utilization at 37% under the State target of 80%. Those labs demonstrating well above the average 37% with some over-enrolled courses, but still under the desired rate, included: Nursing Lab and Spanish (C134 at 61%) and Nursing Lab and Latin (C135 at 57%). Refer to Appendix D for a complete review and summary of utilization analysis. Utilization Analysis by Room Capacity Based on FTE enrollments for Fall 2009 An analysis of utilization by room capacity was likewise studied for Classroom and Laboratory room categories; the data is tracked on the following charts. The majority of Fremont Campus’ classrooms are in the 20 and under and 21-30 capacities. The Classroom findings revealed most SSO use showed the highest rate of usage at the 31-40 capacity (46%) and decreasing with decreased room size, suggesting the most balanced use with the 21-30 room capacity.
Classrooms
46%
50% 38%
40% 30%
Utilization
20% 20% 10% 0% 20 and under
21-30
31-40
41-50
51-60
61-75
76-100
Room Capacity
The majority of Fremont Campus’ teaching laboratories is in the 20 and under capacity. The Teaching Laboratory findings also revealed most SSO use showed the highest rate of usage at the 20 and under (39%), indicating the most use with the smaller room capacity, given the requirements for lab equipment and student station sizes.
Pueblo Community College Facilities Master Plan – Vol. 2 Fremont Campus
Section III., Page 28 July 1, 2012
EXISTING CONDITIONS ASSESSMENT AND CONCLUSIONS
Teaching Laboratories 40%
39%
38% 36% 33%
34%
Utilization
32% 30% 20 and under
21-30
31-40
41-50
51-60
61-75
76-100
Room Capacity
Room Capacity by Average Weekly Hours A study of weekly hour use as a factor of room capacity was also analyzed. Most time was reported for larger sized classrooms, while laboratory space showed most time in the smaller spaces. This data underscores the need to balance use and room size to meet scheduling needs.
Classrooms 35 30 25 20 15 10 5 0
30 26
Avg Weekly Hrs
12
20 and under
21-30
31-40
41-50
51-60
61-75
76-100
Room Capacity
Teaching Laboratories 16 14 12 10 8 6 4 2 0
14 10
Avg Weekly Hrs
20 and under
21-30
31-40
41-50
51-60
61-75
76-100
Room Capacity
Refer to Appendix E. for a complete review and summary of utilization analysis.
Pueblo Community College Facilities Master Plan – Vol. 2 Fremont Campus
Section III., Page 29 July 1, 2012
EXISTING CONDITIONS ASSESSMENT AND CONCLUSIONS
III.D.
FACILITY CONDITIONS INDEX
A Facility Condition Index (FCI) is a numerical rating of the overall condition of a building and its component on a 0 – 100 scale. Zero (0) would be considered a building that has just been demolished and One Hundred (100) would have just been newly constructed. For the ratings in between, State Buildings has provided the following interpretations: 99 – 95 94 – 75 74 – 55 54 – 35 34 – 1
Routine or Minor Maintenance needed Major Maintenance is needed Remodel is needed Extensive Renovation is needed Demolish, cannot be satisfactorily renovated
Year 2005 In Year 2005, four years after the opening of the Fremont Campus facility, the firm of Stephen Hall, Architect conducted a facility audit for Pueblo Community College at the Fremont Campus for six small on-site historic buildings (referenced as Building #1, #2, #3, #4, #5 and #6) to ascertain their condition for salvaging and restoring for contemporary uses.* The ratings and descriptions listed within this narrative have been referenced from the document published by Stephen Hall, Architect. The site was previously owned by the Colorado Department of Corrections, which occupied and used the property between the years mainly for agricultural purposes. Due to the special circumstances of the smaller size and older construction of the structures, two sets of Facility Condition Index (FCI) ratings were developed during this facility audit: “Standard Analysis” (the State’s standards) and “Revised Analysis” (substituting modern construction in lieu of older techniques and lack of utility infrastructure). The FCIs were reported to the Office of the State Architect as follows: Standard Analysis 49.48 Building #1 – Tower 68.89 Building #2 – Barn 51.97 Building #3 – Storehouse 62.75 Building #4 – Bunkhouse 59.48 Building #5 – Residence 58.48 Building #6 – Dining Hall
Revised Analysis Not performed 44.19 Building #2 - Barn 42.16 Building #3 - Storehouse 54.56 Building #4 - Bunkhouse Not performed 51.63 Building #6 – Dining Hall
Given the Revised Analysis FCIs, most structures were determined to be in the category “Extensive Renovation is needed”, with the exception of Building #5, whose Standard FCI rating determined the structure to be in the category “Remodel is needed”. * Source: The history of the site and these six buildings were documented in a report entitled “Prison Gardens – Historic Structures Assessment” published in 2001 by the firm Bennett Wagner & Grody Architects. The report focused on defining the historical significance of six of the original site structures.
Year 2006 In Year 2006, Pueblo Community College self-conducted a facility audit for the main Fremont Campus building. The Facility Condition Index (FCI) rating developed during this facility audit was reported as follows: 98.10 Fremont Campus (Main Building) As this was the first facility audit performed for the relatively new building, the FCI was identified in the upper range of the “Routine or Minor Maintenance needed” category.
Pueblo Community College Facilities Master Plan – Vol. 2 Fremont Campus
Section III., Page 30 July 1, 2012
EXISTING CONDITIONS ASSESSMENT AND CONCLUSIONS
III.E.
TOPOGRAPHIC MAP
Figure E. Topographic Map.
The Fremont Campus site is situated in the low point of the Hogback hill formation. The main one story campus building sits on fairly level terrain, while the remaining site is sloped toward Sand Creek at the east. Source: Stephen Hall Architects, Bennett Wagner & Grody Architects, Milestone Engineering Drawing not to scale
III.F.
SUBSURFACE SOIL CONDITIONS / 100 YEAR FLOOD MAP Figure F. Floodplain Map.
The Fremont Campus site is located several hundred yards north of the Arkansas River. One of its tributaries, Sand Creek forms part of the site’s east boundary, which runs along the west side of Highway 50. The natural low lying area represents a floodplain area. Source: Google Maps
Map not to scale
100 Year Flood Map Pueblo Community College Facilities Master Plan – Vol. 2 Fremont Campus
Section III., Page 31 July 1, 2012
EXISTING CONDITIONS ASSESSMENT AND CONCLUSIONS
As of October 1, 2009, FEMA, the Federal Emergency Management Agency has transitioned from a paper format of flood hazard data to a digital format. Information on flood hazard data for the Fremont Campus was obtained upon review of the Flood Insurance Rate Map (FIRM) 08043C0609E*, dated September 19, 2007. The campus site is generally distinguished among two separate areas: (1) All physical campus structures are located in Zone X (unshaded), “Areas determined to be outside the 0.2% annual chance floodplain”; and (2) Sand Creek and creekside areas are designated Special Flood Hazard Area (SFHA), “Subject to Inundation by the 1% Annual Chance Flood (100 year flood)” and Zone X (shaded) respectively. SFHA areas are prone to flooding by the 100 year floods. Zone X (shaded) are those areas of “0.2% annual chance flood; areas of 1% annual chance flood with average depths of less than 1 foot or with drainage areas less than 1 square mile; and areas protected by levels from 1% annual chance flood.” More information can be accessed at the referenced website. *Source: www.msc.fema.gov
Pueblo Community College Facilities Master Plan – Vol. 2 Fremont Campus
Section III., Page 32 July 1, 2012
EXISTING CONDITIONS ASSESSMENT AND CONCLUSIONS
III.G.
CIRCULATION SYSTEMS
i. Pedestrian Circulation Sidewalks connect the main building’s entrances, wrapping around the building’s perimeters and connecting to the parking lot. The site around the older buildings to the south has remained largely untouched, without any formal hardscape. There are no paved walkways connecting the campus with Cañon City. ii. Vehicular Circulation All vehicular traffic accesses the site from the southeast and flows around the entire perimeter of the main building. Traffic routes are all two-way, with the exception of one section of one-way road along the eastern portion of the site that serves to direct traffic towards the site’s main entry/exit point. There is a designated drop-off lane at the south end of the main building. iii. Bicycle Circulation One small bike rack is located outside of the southwest entrance of the main building. Considering that the rack is located on an 8-foot wide concrete pad, the campus does not appear to be able to accommodate a sufficient amount of bicycle traffic.
Source: Stephen Hall Architects, Bennett Wagner & Grody Architects, Milestone Engineering
Drawing not to scale
Figure G. Fremont Campus Circulation Patterns.
Pueblo Community College Facilities Master Plan – Vol. 2 Fremont Campus
Section III., Page 33 July 1, 2012
EXISTING CONDITIONS ASSESSMENT AND CONCLUSIONS
III.H.
UTILITY SYSTEMS
Source: Stephen Hall Architects, Bennett Wagner & Grody Architects, Milestone Engineering
Drawing not to scale
Figure H. Utilities Systems Plan.
i. Water, Waste, and Storm Water Systems The main building is protected by an automatic fire sprinkler system. Water service enters the campus from the southwest corner and connects to the main building from the north, as does the fire sprinkler main. The sanitary sewer main exits the main building from its south end and exits campus ground to the southeast. ii. Heating Systems The main building is heated by means of a VAV system served by three packaged rooftop heating and cooling units. Electrical wall and unit heaters at vestibules and other areas with direct exterior access supplement building heating systems, as well as one gas-fired unit heater located in a mechanical area. The crawl space areas of the building are served by a series of electric unit heaters and sensors. iii. Electric Systems Main electrical service is brought to the site via underground electrical lines that enter the site from the campus’ southeast corner, run beneath the eastern access road and northern parking area to ultimately connect to the main transformer at the northern end of the building. The campus is also served by an emergency generator adjacent to the transformer. There are live overhead utility
Pueblo Community College Facilities Master Plan – Vol. 2 Fremont Campus
Section III., Page 34 July 1, 2012
EXISTING CONDITIONS ASSESSMENT AND CONCLUSIONS
transmission and distribution lines south of the Barn. The transmission lines must remain overhead but the distribution lines may be converted to underground by Aquila, the electrical utility company. iv.
Individual Building Utility Descriptions
Main Campus Building The building is fully sprinklered. It is served by the campus central heating water system. The electrical service is 800 amp, 120/208V, 3 phase, 4 wire sub distribution center, which has a 200 ampere spare breaker labeled “BARN” (see below). The service has capacity to accommodate future loads. Barn Building The 1937 stone barn building has minimal existing electrical systems. There is an overhead service on the south end of the building that is no longer energized. All of the existing lighting is not operational. A 200 ampere fusible disconnect switch was installed when the new campus was built but it was never connected. An empty conduit routes to the sub distribution center at the Main Campus Building. The service does not have the capacity to accommodate future loads and will require a new separate service. v. Technology Infrastructure A wireless network was recently installed at the Learning Resource Center primarily for its library, Learning Center and computer lab.
III.I.
STORM WATER MANAGEMENT
The Fremont Campus does not have a formal stormwater management plan. The City of Cañon City Stormwater Program issued mandates in their 2007 report to broaden education and outreach to the public on local water quality problems caused by urban stormwater runoff. One of the other mandates included construction site stormwater runoff control and post construction stormwater management. This becomes an issue for the Fremont Campus to stay vigilant on monitoring their own site drainage, particularly with their proximity to Sand Creek and the Arkansas River.
Pueblo Community College Facilities Master Plan – Vol. 2 Fremont Campus
Section III., Page 35 July 1, 2012
EXISTING CONDITIONS ASSESSMENT AND CONCLUSIONS
III.J.
ATHLETICS / PARKS / RECREATIONAL FIELDS
Below is an aerial photo, Figure I., of the campus’ disc golf course, maintained by the College Frisbee Club. One of the holes was reported to have been slightly relocated due to impact of a rainstorm.
Figure I. Layout of the Fremont Campus’ nine - hole disc golf course.
Source: Pueblo Community College - Fremont Campus
III.K.
Map not to scale
ASSESSMENT OF CURRENT CAMPUS AESTHETICS
i. Architecture The original on-site historic building structures, dating back to the 1930s, noted in Section III.D., represent the agrarian/utilitarian nature of the campus site. The most prominent of these is the twolevel barn structure, with its gambrel-styled, wood-shingled, wood-framed roof, painted woodshingled, wood-framed walls, and stone masonry foundation walls that rise four feet above the upper level floor joists. The remaining structures are low-pitched roofs with plaster walls. Though striking in its contrast, the modern architectural style of the main building of the Fremont Campus complements the older buildings with its sweeping sculptural massing. Additionally the building draws from its natural environs featuring the striking native limestone. The modern aesthetic form prevails as a counterpoint to recall the history and to anticipate the future. ii. Scale The more modern campus buildings are one story in height, so as to not overshadow the historical buildings on campus and to blend in with adjacent construction. Architectural scales are designed on a human-scale level, as opposed to large and monumental, in order to provide a comforting and welcome appearance.
Pueblo Community College Facilities Master Plan – Vol. 2 Fremont Campus
Section III., Page 36 July 1, 2012
EXISTING CONDITIONS ASSESSMENT AND CONCLUSIONS
iii. Materials With a color palette and texture reflecting the site, all the Fremont Campus buildings share similar materials, primarily the stone and stucco. The main campus building features aluminum entrances and storefront systems. iv. Urban Design The Fremont Campus is situated outside of the main commercial center of Cañon City, with access off of Highway 50, the main thoroughfare that runs through the city. It is surrounded by mostly open space. The impact of vehicular traffic along the Highway 50 translates to prevailing sound and some air pollution, though slight. v. Public Art As the Fremont Campus has a strong Arts and Humanities program and synergies with the local art community in Cañon City, temporary display of public art is commonplace throughout the academic year.
Pueblo Community College Facilities Master Plan – Vol. 2 Fremont Campus
Section III., Page 37 July 1, 2012
IV. THE PLAN
Pueblo Community College Facilities Master Plan – Vol. 2 Fremont Campus
Section IV July 1, 2012
THE PLAN
IV.
THE PLAN
Utilization studies and space projections show that the physical academic and academic support spaces are sufficient for the present enrollment, though the guideline Academic + Academic Support Space ASF/FTE is below the State target, and scheduling of teaching space continues to challenge staff, students and the building. The analyses confirmed the campus facilities lack in open lab, office, assembly and auxiliary spaces. Paramount to these concerns are consistently growing enrollment and locating required space for existing programs offered off-site and new specialized training programs. The Plan is to focus on physically creating additional classroom and laboratory space to serve existing and new programs. •
Utilize existing building space to re-configure and renovate to create needed classroom space, study space for smaller class sizes;
•
To provide wireless networking for entire campus in anticipation of adapting to new technologies;
•
To develop plans promoting sustainable design.
The Plan additionally includes long range projects that address building expansion as a long term vision that go beyond the Master planning period: •
The Fremont Campus Expansion project, which is intended to be developed within three phases: Phase I: Addition of three new classrooms, the Student Commons, and faculty offices to the existing Main Building; Phase II: Adding a new teaching lab space, renovation of the existing Art Studio space for needed large lecture space, additional offices; Phase III: Creation of a new stand alone Career Tech Building.
•
Arts and Humanities Classroom Building and Amphitheater: Renovate/upgrade the Historic Barn structure, create classroom space and gallery/exhibit space for the Arts and Humanities programs; install loop road, develop surrounding site area with landscaping for outdoor learning opportunities (community gardens), site amphitheater.
Sections IV.C., IV.D., and IV.E. will present the College’s proposed projects in detail.
Pueblo Community College Facilities Master Plan – Vol. 2 Fremont Campus
Section IV., Page 38 July 1, 2012
THE PLAN
IV.A.
IDEAL FUNCTIONAL DIAGRAMS
Source: Stephen Hall Architects, Bennett Wagner & Grody Architects, Milestone Engineering
Drawing not to scale
Figure J. Drawing highlighting areas of potential building.
i. Nature and Relationships of Land Zones The map above identifies the land zones surrounding the existing Fremont Campus as well as areas of planned and future building expansion. ii. Functional Relationships within Land-use Zones Future campus expansion plans have been based around the existing infrastructure on site. Expansion to the Main Campus Building is anticipated to remain contained by the existing perimeter vehicular roadway, and to not encroach further into the undeveloped area adjacent to Sand Creek. New building construction is located so that existing parking area is in a central location where it can serve both existing and new portions of campus (though additional parking is still anticipated as part of future projects). iii. Flexibility for Growth The site of the Fremont Campus has sufficient growth potential. Surrounded by a mix of State- and City-owned zones to the north and west, and by U.S. Highway 50 and Sand Creek to the east, the campus site has the greatest potential for growth-expansion to south of the existing Main Campus Building, as highlighted in the site plan above, see Figure J. Southward expansion will need to take into account the presence of significant topographic variation, as well as the presence of existing historical buildings. Eastward expansion remains a secondary possibility; however, this would involve additional environmental impact studies and soils investigation with respect to Sand Creek. Pueblo Community College Facilities Master Plan – Vol. 2 Fremont Campus
Section IV., Page 39 July 1, 2012
THE PLAN
IV.B.
LAND COVERAGE DECISIONS
i. Building Density with Building Zones Planning and development in the City of Cañon City are governed by the Department of Planning and Community Development. The Fremont Campus site is in a low density, surrounded by primarily open space. ii. Parking Facilities The Fremont Campus on-site parking is currently insufficient. Parking expansion should not only take into account meeting current needs, but also future growth. Locating parking areas where they can accommodate the greatest amount of existing and future buildings (i.e.: expanding the existing centrally located parking area) is ideal. See Figure K.
Source: Stephen Hall Architects, Bennett Wagner & Grody Architects, Milestone Engineering
Drawing not to scale
Figure K. Campus Parking Plan.
Pueblo Community College Facilities Master Plan – Vol. 2 Fremont Campus
Section IV., Page 40 July 1, 2012
THE PLAN
IV.C.
PROPOSED CAMPUS PLANS AND SUPPORTING DATA
i.
Land Perimeter
Source: Google Maps
Map not to scale Figure L. Planned Campus Perimeter. .
The Fremont Campus site is surrounded by primarily open space. U.S. Highway 50 borders the site to its east, State Wildlife area to its north, Unzoned open space to the west, and Cañon City’s water treatment plant and a commercial zone to its immediate south. At present none of these areas are known to be scheduled for re-development.
Pueblo Community College Facilities Master Plan – Vol. 2 Fremont Campus
Section IV., Page 41 July 1, 2012
THE PLAN
ii.
Land Use
Land zones around the Fremont Campus site west of Highway 50 are generally low density, and open.
Fremont Campus – satellite campus for PCC, academic spaces, administrative spaces, full-range of student services, Learning Resource Center, auxiliary functions (bookstore), physical plant and other building support services
Land immediately on the east side of Highway 50 is currently undeveloped and not expected to be developed in the near future.
Source: Google Maps, City of Cañon City Zone District Map, December, 2010
Map not to scale
City - Residential
City - Industrial
Dept. of Corrections
City - Commercial
City - Open Space
State Wildlife Area
Unzoned
Figure M. Planned Land Use Map.
iii. Circulation Systems and Vehicle Storage The main and singular access for vehicular transportation to the Fremont Campus is from U.S. Highway 50. Automobile transportation continues to be the primary mode of transportation onto campus, and planning for vehicle storage will be required with continued enrollment growth. The current campus count as described in Section II.D.iv. is insufficient for present building needs, especially during special events. Use of parking facilities is also magnified during the height of enrollment period for the fall and spring semesters and the few weeks following. As the Highway dominates the surrounding landscape, consideration must be given to sound abatement. Bicycle use is encouraged, and space and location for storage racks should be an on-going consideration, as with motorcycle parking needs. All established pedestrian walkways remain sufficient for connections to buildings, parking areas and open landscaped areas. All access points to proposed building additions should consider Pueblo Community College Facilities Master Plan – Vol. 2 Fremont Campus
Section IV., Page 42 July 1, 2012
THE PLAN
connections to these established walkways. iv. Utility Systems, Including Technology Infrastructure Site utilities are appropriate for the Main Campus Building and appear to be adequate to address its present operations and future additions planned for up to the target year of 2014, as detailed in Section III.H. The consultants recommend the most current site utility plan be maintained and updated for the College’s records by the Facilities Services Department. v. Building Location Its location at the west end of Cañon City proper is befitting for the Fremont Campus site. It provides reasonable proximity to the center of Cañon City. The site’s adjacency to Highway 50 provides conveniently direct access from a main traffic artery. vi. Storm Water Management Plan Future construction projects for the Fremont Campus – both building and site infrastructure, including roads – will need to refer to the guidelines contained in the City of Cañon City Storm Water Program. It is the consultants’ recommendation that the Fremont Campus coordinates future construction projects with the City of Cañon City, and reviews the city’s standard construction specification sections that address storm water management requirements. Significant changes may require further investigation regarding environmental impact, particularly in the vicinity of Sand Creek. vii. Facility Staging Plan The campus site area is generous to accommodate staging areas for planned construction. Low depression areas will need to be avoided. The entrance driveway with its physical twisting shape will require construction traffic monitoring in concert with the day to day campus traffic use. Coordination should also include discussions with the City of Cañon City on matters concerning traffic and recycled waste management.
IV.D.
CAMPUS PLANS TO CONTINUE OR RENEW AESTHETIC CONSIDERATIONS
Aesthetic Narrative Plans for the interior renovations and additions to the Main Building will involve matching and reinforcing the existing architecture, its material and color selections, its massing, and detailing. Any potential stand-alone building will reflect this same vocabulary, with appropriate material and finish selections to accommodate the planned activities. The building will be sited and designed to compliment the main building structure; due to its required high volume spaces, its massing is planned not to overpower the main building.
IV.E.
PROJECT IMPLEMENTATION PLAN
The Project Implementation Plan indentifies those projects which respond to the assessments and conclusions of the Facilities Master Plan. The listing of projects has been structured into two time frames: Short Term Range and Mid to Long Term range. Each of these time frames has identified specific goals. The Short Term Range is planned out for the target year of AY2014 - 2015. The focus of this timeframe is on the development of a re-configuration and subdividing of existing spaces for the Main Building.
Pueblo Community College Facilities Master Plan – Vol. 2 Fremont Campus
Section IV., Page 43 July 1, 2012
THE PLAN
The priority elements are as follows: • Relocate the Large Computer Lab 125 to Room 131 and renovate Room 131 to accommodate multiple computer stations/groupings. • Subdivide Room 125 into two rooms, a larger room to accommodate the Art Lab with sink(s) and a smaller classroom. • Subdivide Rooms 127 and 129 into three smaller classrooms. Provide an option for movable walls between these rooms. • Similar to the original design in the Library, provide three additional small rooms for quiet group study and/or small classes adjacent to the west-facing exterior wall. • In the south-east corner of the Library, provide an enclosed area for Testing of 4-6 students. The Fremont Campus will also address a stronger emphasis for collaborative opportunities and building community partnerships to strengthen academics and workforce training programs. The Mid to Long Term Range is planned out for beyond the target year of AY2014 - 2015. The focus of this timeframe is expansion/new construction projects to address growth. Both projects were conceptually designed during the Master Planning reporting period and assigned both project budgets and timetables. It is imperative that the College re-evaluate the intention of these projects and their respective budgets and timetables at the appointed time of a more favorable economic period that could support these projects. Project One: FREMONT CAMPUS EXPANSION
Phase 1 – Commons/ Classroom Addition / Offices
Phase 2 – Lab/Offices/Admin/ Lecture Renovation Phase 3 – Career Tech Building
Figure N. Site / Floor Plans for Fremont Campus Expansion. Source: Bennett Wagner & Grody Architects
Pueblo Community College Facilities Master Plan – Vol. 2 Fremont Campus
Drawing not to scale
Section IV., Page 44 July 1, 2012
THE PLAN
The Fremont Campus had developed three phased plans for a significant addition which will add a combined total of 10,978 gross square feet in new construction and 2,545 gross square feet in renovations for needed classrooms, laboratory space, offices, and student spaces. Also, a new Technology and Welding facility (“Career Tech Building”) is planned. These projects will continue the same architectural vocabulary of the existing building, also borrowing from the older buildings. Additionally the building additions will draw from its natural environs featuring the striking native limestone. The modern aesthetic form prevails as a counterpoint to recall the history and to anticipate the future. The plan is to add five additional classrooms, including two rooms capable of holding industrial career technical training courses; remodeling a large classroom into a lecture hall; and adding a student and community activity room to also be used for short-term workforce training. This expansion will allow the College to increase course and program capacity by more than 50% and will also allow the College to offer courses that previously could not be accommodated on campus, such as welding and machining, which are offered off-site at a local high school. This plan, in concert with hybrid and online courses, should accommodate growth for the next 10 years.
Pueblo Community College Facilities Master Plan – Vol. 2 Fremont Campus
Section IV., Page 45 July 1, 2012
THE PLAN
Project One: FREMONT CAMPUS EXPANSION Project Costs Table – Phase One Commons / Classroom / Offices
Land / Building Acquisition Land / Building Acquisition Total Land / Building Acquisition
$0 $0
Professional Services Master Planning etc. Site Surveys, Investigations, Reports Architectural / Engineering Basic Services Code Review / Inspection Construction Management Advertisements Other Total Professional Services
$ $ $ $ $ $
$0 12,000 199,742 5,000 29,839 484 $0 247,065
Construction or Improvement Infrastructure Service / Utilities Site Improvements Structure / Systems / Components
New: 7224 GSF @ $154 per GSF Renovate: 0 @ $ 0 per GSF
$ 50,000 $ 142,500 $ 1,112,496
Other High Performance Certification Program Total Construction or Improvement Cost
$0 $ 80,000 $ 1,384,996
Equipment / Furnishings / Communications IT / Communications / Tables / Chairs Total Equipment / Furnishings / Communications Costs
$ $
258,874 258,874
$
13,850 $0 13,850
Miscellaneous Art in Public Places 1% Other Total Miscellaneous Costs Total Project Costs Project Contingencies 5% for New 10% for Renovation
TOTAL BUDGET REQUEST – PHASE ONE
Pueblo Community College Facilities Master Plan – Vol. 2 Fremont Campus
$
$ 1,904,301
$
95,215 $0
$ 2,000,000
Section IV., Page 46 July 1, 2012
THE PLAN
Project One: FREMONT CAMPUS EXPANSION (Cont’d) Project Costs Summaries – Phase Two & Three Phases Two and Three of the Fremont Campus Expansion Project, like Phase One, were divided into components with the intention of keeping each portion of phased construction at or below a $2,000,000 total budget. Although the budget for Phase One was broken down in greater detail, the anticipated summary budgets for Phases Two and Three have been calculated and listed below.
Fremont Campus Expansion – Phase Two: Lab / Offices / Admin Renovation / Lecture Phase includes renovations to existing lab and office/support areas in the Main Campus Building that were not included under Phase One. Structure/Systems/Components Construction: (2545 GSF @ $154 per GSF) = $468,300 Total Anticipated Budget Request: $1,062,369 Fremont Campus Expansion – Phase Three: Career Tech Building Phase includes construction of a new campus building housing Career Technology Learning spaces. The expectation is that the Career Tech Building can also be expanded under future construction projects, as the need arises. Structure/Systems/Components Construction: (3754 GSF @ $154 per GSF) = $576,000 Total Anticipated Budget Request: $1,948,176
Pueblo Community College Facilities Master Plan – Vol. 2 Fremont Campus
Section IV., Page 47 July 1, 2012
THE PLAN
Project Two: ARTS & HUMANITIES CLASSROOM BUILDING AND AMPHITHEATER This project intends to accommodate the current and future needs of the Arts and Humanities programs presently served within the Fremont Campus Building. Additionally, the project will function as a community outreach facility for the Fremont Campus’ multiple enrichment education programs that cater to groups ranging from elementary school students to retirees, with the ability to host various cultural events and programs for the general public, both indoors and outdoors.
Source: Stephen Hall Architects; Zak George Landscaping; Mestas Design
Drawing not to scale
Figure O. Landscape Plan for the Arts & Humanities Classroom Building and Amphitheater.
Pueblo Community College Facilities Master Plan – Vol. 2 Fremont Campus
Section IV., Page 48 July 1, 2012
THE PLAN
Figure P. Building Elevations for the Arts & Humanities Classroom Building. Source: Stephen Hall Architects Drawing not to scale
The project involves: renovation of the existing 4,400 GSF Prison Gardens Barn, (located south of the existing Fremont Campus Building); the construction of a 1,560 square foot addition to the Barn structure; and site improvements, including the rehabilitation of an existing former guard tower structure, a plaza area dedicated to public art display, landscaping, and construction of a 350-seat outdoor amphitheater with raised stage. Plans for the Barn renovation and addition will focus on restoring and upgrading the barn, replacing areas of failing building materials (structural framing, roof shingles, stone masonry walls), upgrading / outfitting new infrastructure (electrical, plumbing, mechanical), while incorporating modern and life safety features, accessible building entrances, stairs, new window openings, public restrooms, and other support spaces, and furnishings associated with the creation of two classrooms and one multi-functioning assembly space. Pueblo Community College Facilities Master Plan – Vol. 2 Fremont Campus
Section IV., Page 49 July 1, 2012
THE PLAN
Project Two:
ARTS & HUMANITIES CLASSROOM BUILDING AND AMPHITHEATER Project Costs Table
Land / Building Acquisition Land / Building Acquisition
$0
Total Land / Building Acquisition
$0
Professional Services Master Planning / Program Planning etc. Site Surveys, Investigations, Reports Architectural / Engineering Basic Services Code Review / Inspection Construction Management Advertisements Other Total Professional Services
$ $ $ $ $ $
Construction or Improvement Infrastructure Service / Utilities Site Improvements Structure / Systems / Components:
New: Renov:
1560 GSF @ $150 per GSF 4344 GSF @ $236 per GSF
$0 25,000 222,302 15,500 65,883 3,500 $0 302,685
$ 35,000 $ 1,048,371 $ 1,261,151
Other – 9% Inflation High Performance Certification Program Total Construction or Improvement Cost
$ 2,11276 $ 80,000 $ 2,615,318
Equipment / Furnishings / Communications IT / Communications / Tables / Chairs Total Equipment / Furnishings / Communications Costs
$ $
420,000 420,000
$
26,153 $0 26,153
Miscellaneous Art in Public Places 1% Other Total Miscellaneous Costs
$
Total Project Costs
$ 3,364,156
Project Contingencies 5% for New 10% for Renovation
$
TOTAL BUDGET REQUEST – PHASE THREE
Pueblo Community College Facilities Master Plan – Vol. 2 Fremont Campus
$0 336,416
$ 3,700,572
Section IV., Page 50 July 1, 2012
THE PLAN
The following narrative is being included as a discussion on LEED project development for the Campus’ use in pursuing certification. As the Fremont Campus anticipates a major building addition and/or remodel work, the Campus must consider, among other issues, energy consumption reduction, construction methodologies, and managing building waste. Refer to Volume I, Section IV.E. for complete text. Costs Associated with LEED Projects Per the Governor’s Executive Order D 005 05 “Greening of State Government”*, Executive Directors of all state agencies and departments are directed to manage future new building construction and renovation projects within the LEED (Leadership in Energy and Environmental Design) rating system when feasible. The intent of this directive is for all future projects to pursue an official LEED Certification whenever it is “applicable and practicable” and is “deemed cost-effective”. In order for the LEED Certification process to be considered cost-effective as part of a college construction project, it is most helpful for the institution to be aware of and anticipate the additional explicit costs in advance. It is also important that in budgeting these costs, that the institution is aware that the additional costs involved with pursuing LEED certification are typically recouped many times over through the general savings that go along with the design of a sustainable and energy-efficient building. * Source: www.colorado.gov
IV.F.
FACILITIES CONSTRUCTION AND RENOVATION TIME SCHEDULE – LONG TERM
Author’s note: No fiscal year has been assigned to these long term projects. FREMONT CAMPUS EXPANSION Year ----------------
Start January March May November February
Completion February November November December August
Remarks Program Report Secure Funding Design Documents Bid Construction
Renovation and addition will be accomplished as a single construction project.
ARTS & HUMANITIES CLASSROOM BUIILDING AND AMPHITHEATER Estimated Timetable: Component Entire Project
Start Completion Anticipate start-completion = 18 months.
Pueblo Community College Facilities Master Plan – Vol. 2 Fremont Campus
Remarks All Construction
Section IV., Page 51 July 1, 2012
THE PLAN
IV.G. CRITERIA FOR UPDATING THE PLAN The Fremont Campus and Pueblo Community College will undertake the task of reviewing this document on an annual basis to stay apprised of planning guidelines and policies that will impact planning decisions as academic needs are presented. The task group should review for consistency with the College’s Academic, Strategic and Informational Technology Master Plans. Upon approval by the State Board of Community Colleges of Occupational Education and the Colorado Department of Higher Education, the College will prepare program plans for the proposed projects and obtain appropriate approvals. If funding is not available for the fiscal year identified, the schedule for requests for funding will be adjusted.
Pueblo Community College Facilities Master Plan – Vol. 2 Fremont Campus
Section IV., Page 52 July 1, 2012
V. APPENDICES
Pueblo Community College Facilities Master Plan – Vol. 2 Fremont Campus
Section V July 1, 2012
APPENDICES
V.
APPENDICES
V.A.
Students on Campus Analysis
V.B.
Campus Building Inventory Tables
V.C.
Historic Projections (1999 – 2010, Fall Semester) / School District Enrollment Trends
V.D.
Classroom and Teaching Laboratory Utilization by Building / Function
V.E.
Classroom and Teaching Laboratory Utilization by Room Capacity
V.F.
Alternative Enrollment Space Needs and Utilization Studies
Pueblo Community College Facilities Master Plan – Vol. 2 Fremont Campus
Section V July 1, 2012
V.A.
Students on Campus Analysis
Note: Gray shaded cells represent peak hours.
Students on Campus Fremont Campus Fall 2009 Classrooms Time 7:00 AM 7:59 AM 8:00 AM 8:59 AM 9:00 AM 9:59 AM 10:00 AM 10:59 AM 11:00 AM 11:59 AM Noon 12:59 PM 1:00 PM 1:59 PM 2:00 PM 2:59 PM 3:00 PM 3:59 PM 4:00 PM 4:59 PM 5:00 PM 5:59 PM 6:00 PM 6:59 PM 7:00 PM 7:59 PM 8:00 PM 8:59 PM 9:00 PM 9:59 PM Total Average
MON 77 77 173 287 163 127 175 130 106 268 225 164 164 26 2,162 154
TUE 108 138 115 145 114 123 215 140 79 180 160 182 191 78 1,968 141
WED 77 77 141 255 150 127 179 111 93 265 240 180 180 26 2,101 150
THU 122 138 115 164 109 109 210 109 62 175 168 129 154 27 1,791 128
FRI 95 95 120 171 87 38 51 58 39 93 79 112 85 20 1,143 82
SAT
Total 9 20 34 34 35 26 34 34 34 14
274 20
488 545 698 1,056 658 550 864 582 413 995 872 767 774 177 9,439
Average 81 91 116 176 110 92 144 97 69 166 145 128 129 30 1,573
Data excludes Online, FLEX, Independent Study, Internships/Co-Ops and Private Instruction
Laboratories Time 7:00 AM 8:00 AM 9:00 AM 10:00 AM 11:00 AM Noon 1:00 PM 2:00 PM 3:00 PM 4:00 PM 5:00 PM 6:00 PM 7:00 PM 8:00 PM 9:00 PM Total
MON 7:59 AM 8:59 AM 9:59 AM 10:59 AM 11:59 AM 12:59 PM 1:59 PM 2:59 PM 3:59 PM 4:59 PM 5:59 PM 6:59 PM 7:59 PM 8:59 PM 9:59 PM
77 77 173 287 163 127 175 130 106 268 225 164 164 26 2,162
TUE 108 138 115 145 114 123 215 140 79 180 160 182 191 78 1,968
WED 77 77 141 255 150 127 179 111 93 265 240 180 180 26 2,101
THU 122 138 115 164 109 109 210 109 62 175 168 129 154 27 1,791
FRI 95 95 120 171 87 38 51 58 39 93 79 112 85 20 1,143
SAT
Total 9 20 34 34 35 26 34 34 34 14
274
488 545 698 1,056 658 550 864 582 413 995 872 767 774 177 9,439
Average 81 91 116 176 110 92 144 97 69 166 145 128 129 30 1,573
Section V.A., Page 1 of 1
PUEBLO COMMUNITY COLLEGE: FREMONT CAMPUS
MAIN BUILDING FACILITIES INVENTORY
Room ID
Room Use Code
Room Type / Room Name
Department
College / Administrative Unit
A102
315
Waiting Area
Office (Admin) - Fremont
Fremont Campus
Faculty Count
Student Count
ASF
Comments 646
Waiting
A103
310
Go!Zone Enrollment
Office (Admin) - Fremont
Fremont Campus
342
Recept/Enroll
A104
310
Office
Office (Admin) - Fremont
Fremont Campus
288
Work room - records
A105
680
Meeting Room
Office (Admin) - Fremont
Fremont Campus
780
Conference / Classroom *see note below
A105A A106
685
Meeting Room Storage
Office (Admin) - Fremont
Fremont Campus
310
Dean's Office
Office (Admin) - Fremont
Fremont Campus
1
228
Dean's Office
A107
310
Office
Office (Admin) - Fremont
Fremont Campus
1
156
Admin Asst. Office
A108
310
Office
Office (Admin) - Fremont
Fremont Campus
1
108
A109
310
Office
Office (Admin) - Fremont
Fremont Campus
1
A110
315
Office Work Area
Office (Admin) - Fremont
Fremont Campus
A110A
350
Conference / Lounge
Office (Admin) - Fremont
Fremont Campus
A111
310
Office
Office (Admin) - Fremont
Fremont Campus
A113
660
Merchandising
Student Services - Fremont
VP of Student Services
497 108
A114
665
Merchandising Storage
Student Services - Fremont
VP of Student Services
C114
730
Central Storage
Facilities Services - Fremont
Fremont Campus
15
45
120
Academic Serv. Coord.
204
Work Area Conference / Lounge
320 1
Storage
126
72
Office Bookstore Bookstore storage Storage
C123
110
Classroom - Computer
Instructional space - Fremont
Fremont Campus
16
558
Computer classroom
C124
110
Classroom - Computer
Instructional space - Fremont
Fremont Campus
16
557
Computer classroom
C125
210
Teaching Laboratory - Computer
Instructional space - Fremont
Fremont Campus
20
1127
C126
110
Classroom
Instructional space - Fremont
Fremont Campus
32
719
Computer Lab Classroom
C127
110
Classroom
Instructional space - Fremont
Fremont Campus
32
719
Classroom
C128
110
Classroom
Instructional space - Fremont
Fremont Campus
24
612
Classroom / *see note below
C129
110
Classroom
Instructional space - Fremont
Fremont Campus
24
613
Classroom / *see note below
C130
110
Classroom
Instructional space - Fremont
Fremont Campus
24
600
Classroom
12
875
Art Lab / *see note below
C131
210
Teaching Laboratory - Art
Instructional space - Fremont
Fremont Campus
C133
215
Teaching Laboratory Service
Instructional space - Fremont
Fremont Campus
194
Building Storage
C134
210
Teaching Laboratory - Nursing
Instructional space - Fremont
Fremont Campus
10
867
Nursing Lab+Classroom *see note below
C135
210
Teaching Laboratory - Nursing
Instructional space - Fremont
Fremont Campus
10
829
Nursing Lab+Classroom *see note below
C137
110
Classroom
Instructional space - Fremont
Fremont Campus
28
640
C137A
115
Classroom Service
Instructional space - Fremont
Fremont Campus
C138
210
Teaching Laboratory - Science
Instructional space - Fremont
Fremont Campus
28
1214
21
C139
215
Teaching Lab Service
Instructional space - Fremont
Fremont Campus
52
C140
215
Lab Support / Prep
Instructional space - Fremont
Fremont Campus
327
Storage Lecture+Lab Drench Shower Casework Computer Mediated Lab & Assessment Testing
L101
220
Open Laboratory
Library - Fremont
Fremont Campus
L103
310
Office
Office (Admin) - Fremont
Fremont Campus
1
219
Work Room
L104
710
Central Computer / Telecom
Computer Services - Fremont
Fremont Campus
1
140
Lab Support
1835
L105
715
Central Computer / Telecom Service
Computer Services - Fremont
Fremont Campus
187
Comm Hub
L106
730
Central Computer / Telecom
Computer Services - Fremont
Fremont Campus
106
Storage
L107
310
Office
Office (Admin) - Fremont
Fremont Campus
L108
310
Office
Office (Fac) - Fremont
Fremont Campus
L109
110
Classroom / Conference
Instructional Space - Fremont
Fremont Campus
L110
310
Office
Office (Fac) - Fremont
Fremont Campus
1 1
L112
310
Office
Office (Fac) - Fremont
Fremont Campus
L113
650
Lounge
Student Services - Fremont
Fremont Campus
L113A
660
Merchandising
Student Services - Fremont
VP of Student Services
L115
730
Telecom
Computer Services - Fremont
Fremont Campus
1 6
145
Office
120
Faculty
169
Video Lect+Lab
106
Faculty
86 332 45 192
Faculty Student Lounge ATM Machine Storage
L117
650
Lounge
Student Services - Fremont
Fremont Campus
212
Student Lounge
L117A
660
Merchandising
Student Services - Fremont
VP of Student Services
120
Coffee Cart
L118*
430
Open Stack Reading Room
Library - Fremont
Fremont Campus
L119
455
Study Service
Library - Fremont
Fremont Campus
Section V.B., Page 1 of 2
15
2737 88
Learning Resource Center Storage
PUEBLO COMMUNITY COLLEGE: FREMONT CAMPUS
MAIN BUILDING FACILITIES INVENTORY
Room ID
Room Use Code
Room Type / Room Name
Department
College / Administrative Unit
L120
455
Study Service
Library - Fremont
Fremont Campus
Office (Admin) - Fremont Office (Fac) - Fremont
Fremont Campus
1
117
Small Bus Devpt
Fremont Campus
1
140
Faculty Computer testing
L122
310
Office
L123
310
Office
Faculty Count
Student Count
ASF
Comments 176
L124
220
Open Laboratory - Computer Testing
Office (Admin) - Fremont
Fremont Campus
4
173
"L124A"
220
Open Laboratory - Pencil Testing
Office (Admin) - Fremont
Fremont Campus
5
75
M143
720
Shop
Facilties Services - Fremont
Fremont Campus
M144
368
Pencil testing Ground Equipment
725
Shop Service
Facilties Services - Fremont
Fremont Campus
300
Warehouse
730
Central Storage
Facilities Services - Fremont
Fremont Campus
100
Storage Shed @ north
Fremont Campus
3105
050
*In Fall of 2009, this assigned classroom / teaching laboratory space accommodated course sections which exceeded the dedicated number of workstations. Refer to Appendix F.4. for the specific course sections and respective enrollment number.
Building/Campus ASF Total
25,957
100 Classroom Facilities
5,778
110 Classroom ASF Total
5,187
*Classroom 'Simulation' ASF Total (max stations in Rooms A105 (15) and L118 (15) multiplied by 19 ASF/FTE) 115 Classroom Service ASF Total
570 21
200 Laboratory Facilities
7,568
210 Teaching Laboratory ASF Total
4,912
215 Teaching Laboratory Service ASF Total
573
220 Open Laboratory ASF Total
2,083
300 Office Facilities
3,471
310 Office - Administrative ASF Total
1,849
310 Office - Faculty ASF Total
452
315 Office Service - Administrative ASF Total
850
350 Conference Room ASF Total
320
400 Study Facilities
2,716
430 Library / Learning Resource Center ASF Total (excludes 285 ASF for classroom simulation )
2,452
455 Study Service
600 General Use
264
1,854
650 Lounge ASF Total
544
660 Merchandising ASF Total
662
665 Merchandising Service ASF Total
108
680 Meeting Room ASF Total (excludes 285 ASF for classroom simulation )
495
685 Meeting Room Service ASF Total
700 Support Facilities
45
1,465
710 Central Computer / Telecommunications ASF Total
140
715 Central Computer / Telecommunications Service ASF Total
187
720 Central Shop ASF Total
368
725 Central Shop Service ASF Total
300
730 Central Storage ASF Total
470
Inactive Areas
3,105
050 Inactive Area ASF Total
3,105
Section V.B., Page 2 of 2
Barn
Fremont Campus Annualized FTE 550 519 500 500
450
Annualized FTE
411 395
393
400
380
AFTE
371 358
2 per. Mov. Avg. (AFTE)
348 350
300 300
250 225 216 200 99-00
00-01
01-02
02-03
03-04
04-05
05-06
Academic Year
Section V.C., Page 1 of 2
06-07
07-08
08-09
09-10
10-11
Fremont Campus Area School Enrollment Trends 4500 4,236 4000 3,878
3,810
3,800
3,699
3,702
3500
Enrollment
3000
CUSTER COUNTY SCHOOL DISTRICT C-1
2500
CANON CITY RE-1 FLORENCE RE-2
2000
COTOPAXI RE-3
1,779
1,739
1,701
1,631
1,623
1,600
1500
1000
500
522
522
519
514
489
454
324
316
273
235
224
222
0 05-06
06-07
07-08
08-09
School Year
Section V.C., Page 2 of 2
09-10
10-11
PCC Fremont Campus Fall 2009 Classroom & Teaching Laboratory Utilizations Utilization Analysis by Building
Classroom and Teaching Laboratory Utilization Analysis Detail by Building
Building Main Building
Section V. D., Page 1 of 7
Number of Classrooms
Average Number of Stations per Classroom
Utilization Average for Classrooms
Number of Teaching Laboratories
Average No. of Stations per Teaching Laboratory
Utilization Average for Teaching Laboratories
11
21
29%
5
16
37%
PCC Fremont Campus Fall 2009 Classroom & Teaching Laboratory Utilizations Utilization Analysis by Function
Classroom Utilization Analysis Detail by Function
Room ID
Room Use Code
A105 C123 C124 C126 C127 C128 C129 C130 C137 L109 L118
350 110 110 110 110 110 110 110 110 110 430
Averages Totals No. of Rooms
ASF
No. of Stations
ASF per Station
Average Enrollment
Total Peak Weekly Course Section Hours
Total Peak Weekly Student Contact Hours
Total Hours in Use Student Station Occupancy %
285 558 557 719 719 612 613 600 640 169 285
15 16 16 32 32 24 24 24 28 6 15
19 35 35 22 22 26 26 25 23 28 19
11 9 10 17 19 17 18 10 17 5 9
4 16 14 30 30 29 31 17 18 13 2
46 127 128 611 620 481 550 181 347 65 15
7% 28% 19% 45% 46% 48% 55% 18% 30% 26% 2%
523 5,757 11
21 232
25
13
19
288 3,171
29%
Teaching Laboratory Utilization Analysis Detail by Function
Room ID
Room Use Code
C125 C131 C134 C135 C138
210 210 210 210 210
Averages Totals No. of Rooms Section V. D., Page 2 of 7
ASF
No. of Stations
ASF per Station
Average Enrollment
Total Peak Weekly Course Section Hours
Total Peak Weekly Student Contact Hours
Total Hours in Use Student Station Occupancy %
1,127 875 867 829 1,214
20 12 10 10 28
56 73 87 83 43
11 10 10 10 24
7 12 18 16 10
69 122 170 160 258
12% 24% 61% 57% 33%
982 4,912 5
16 80
68
13
13
156 779
37%
Notes:
Italicized text represents time(s) when a classroom or laboratory was used for a function other than an FTE course, i.e. alternative high school, open lab, ESL classes, etc. Light gray text represents courses with only one attendee. These courses are listed from informational purposes only and not included with the other data for that room.
PCC Fremont Campus Data - Fall 2009 - List of Course Sections
Room ID Room Type (Room Use Code) - Average Enrollment Begin Time
A105 1430 1730 C123 1000 1130 1430 1430 1600 1730 1730 1800 1800 C124 0830 1000 1130 1600 1600 1730 1800 1900 C125 1600 1730 1730 1900 C126 0800 0830 0830 0830 0900 1000 1130
End Time Time of Day
Days
Conference Room (350) - 11 1610 Afternoon TR 2015 Afternoon W Classroom (110) - 9 1235 Morning M 1245 Morning F 1710 Afternoon TR 1710 Afternoon TR 1710 Afternoon MW 2010 Evening TR 2010 Evening TR 2045 Evening M 1850 Evening W Classroom (110) - 10 0945 Morning MW 1115 Morning MW 1245 Morning TR 1710 Afternoon MWF 1740 Afternoon TR 1845 Evening MW 1940 Evening TR 2015 Evening MW Teaching Laboratory (210) - 11 1715 Afternoon MW 1845 Evening TR 2015 Evening M 2010 Evening TR Classroom (110) - 17 1700 All Day S 1105 Morning MW 0945 Morning TR 1115 Morning F 1700 All Day S 1105 Morning MTWR 1245 Morning MWF
Section V. D., Page 3 of 7
No. of Stations
ASF
ASF per Station Enrollment
Section
285
15
19
BIO-216701 ECO-201701
5 15 558
16
35
CIS-110703 CIS-130701 ART-143702 ART-243702 BTE-100701 ART-143701 ART-243702 ECE-101701 ECE-102701
13 15 5 2 10 16 2 8 8 557
16
35
REA-090701 REA-060702 REA-030701 ACC-121701 CIS-155701 REA-090702 CIS-128701 MAT-112701
16 8 6 8 7 15 10 6 1,127
20
56
CIS-115701 CIS-110701 EDU-261701 REA-060701
13 12 6 12 719
CSL-268702 SOC-102702 ENG-121702 ART-110701 CSL-269701 MAT-030701 MAT-099701
32
22 1 6 22 8 11 31 29
Total Peak Weekly Course Section Hours
Total Weekly Student Contact Hrs (WSCH)
Total Hours in Use Student Station Occupancy %
Peak Weekly Course Section Hours
Weekly Student Contact Hrs
Hours in Use Student Station Occupancy %
4 1.00 2.75 16 0.00 0.50 1.33 1.33 0.33 4.33 4.33 2.75 0.83 14 0.00 2.50 1.75 0.33 1.33 2.50 3.33 2.50 7 0.50 2.50 2.75 1.33 30 0.00 1.08 2.00 1.25 0.00 4.33 3.00
46 5.00 41.25 127 0.00 7.50 6.65 2.66 3.30 69.28 8.66 22.00 6.64 128 0.00 20.00 10.50 2.64 9.31 37.50 33.30 15.00 69 6.50 30.00 16.50 15.96 611 0.00 6.48 44.00 10.00 0.00 134.23 87.00
7% 0.8% 6.5% 28% 0.0% 1.7% 1.5% 0.6% 0.7% 15.5% 1.9% 4.9% 1.5% 19% 0.0% 3.0% 1.6% 0.4% 1.4% 5.6% 5.0% 2.2% 12% 1.2% 5.4% 2.9% 2.9% 45% 0.0% 0.5% 3.3% 0.7% 0.0% 10.0% 6.5%
Δ of Applicable State Utilization Guidelines
Total Non-Peak Weekly Course Section Hours Non-Peak Weekly Course Section Hours
-61%
-52%
-49%
-68%
-23%
2 2.33 0.00 15 2.58 0.75 4.00 4.00 2.00 1.00 1.00 0.00 0.00 8 2.50 0.00 0.75 3.17 2.00 0.00 0.00 0.00 2 2.00 0.00 0.00 1.00 22 9.00 1.09 0.50 1.50 8.00 0.00 0.75
PCC Fremont Campus Data - Fall 2009 - List of Course Sections
Room ID Room Type (Room Use Code) - Average Enrollment Begin Time
End Time Time of Day
1130 1245 Morning 1300 1415 Afternoon 1300 1545 Afternoon 1430 1535 Afternoon 1600 1725 Afternoon 1600 1715 Afternoon 1730 1845 Evening 1730 1845 Evening 1900 2015 Evening 1900 2015 Evening C127 Classroom (110) - 19 0830 0945 Morning 0830 0945 Morning 1000 1115 Morning 1000 1245 Morning 1130 1245 Morning 1130 1245 Morning 1300 1415 Afternoon 1300 1515 Afternoon 1430 1545 Afternoon 1430 1715 Afternoon 1730 1845 Evening 1730 1845 Evening 1730 2015 Evening 1900 2015 Evening 1900 2015 Evening C128 Classroom (110) - 17 0830 0945 Morning 0830 1115 Morning 1000 1115 Morning 1130 1245 Morning 1300 1415 Afternoon 1300 1415 Afternoon 1430 1545 Afternoon 1430 1630 Afternoon 1730 1845 Evening Section V. D., Page 4 of 7
Days
Section
TR TR F MTWR MW TR MW TR MWF TR
MAT-060705 HIS-101701 HPR-178701 MAT-030702 BTE-225701 SOC-205701 CRJ-135701 MAT-030704 MAT-090703 ENG-122701
MW TR MWF S MW TR MW MW TR S MW TR F MW TR
ENG-090701 ENG-060701 MAT-090701 ENG-222701 ENG-090702 PSY-101701 HPR-108701 MAT-103701 LIT-115701 ENG-121705 COM-115703 PHI-111701 COM-115704 PSY-235702 PHI-114701
TR F MW MW MW TR MWF TR MW
BUS-216701 PSY-235701 ANT-111701 ENG-121701 ENG-121703 GEO-105701 MAT-090702 MAT-120701 ENG-121704
No. of Stations
ASF
ASF per Station Enrollment
23 25 10 22 6 9 17 11 18 16 719
32
22 25 31 25 9 21 25 26 17 7 8 15 14 19 31 14
612
24
26 11 30 12 21 24 16 23 9 21
Total Peak Weekly Course Section Hours
Total Weekly Student Contact Hrs (WSCH)
Total Hours in Use Student Station Occupancy %
Peak Weekly Course Section Hours
Weekly Student Contact Hrs
Hours in Use Student Station Occupancy %
1.75 1.50 0.00 3.16 0.83 0.50 2.50 2.50 3.50 2.50 30 0.00 2.00 3.75 0.00 2.50 1.75 2.50 4.25 1.75 0.00 2.50 2.50 1.75 2.50 2.50 29 2.00 1.25 2.50 2.50 2.50 1.50 1.75 2.00 2.50
40.25 37.50 0.00 69.52 4.98 4.50 42.50 27.50 63.00 40.00 620 0.00 62.00 93.75 0.00 52.50 43.75 65.00 72.25 12.25 0.00 37.50 35.00 33.25 77.50 35.00 481 22 38 30 52.50 60.00 24.00 40.25 18.00 52.50
3.0% 2.8% 0.0% 5.2% 0.4% 0.3% 3.2% 2.0% 4.7% 3.0% 46% 0.0% 4.6% 7.0% 0.0% 3.9% 3.3% 4.8% 5.4% 0.9% 0.0% 2.8% 2.6% 2.5% 5.8% 2.6% 48% 2.2% 3.7% 3.0% 5.2% 6.0% 2.4% 4.0% 1.8% 5.2%
Δ of Applicable State Utilization Guidelines
Total Non-Peak Weekly Course Section Hours Non-Peak Weekly Course Section Hours
-22%
-20%
0.75 1.00 2.75 1.17 2.00 2.00 0.00 0.00 0.25 0.00 11 2.50 0.50 0.00 2.75 0.00 0.75 0.00 0.25 0.75 2.75 0.00 0.00 1.00 0.00 0.00 10 0.50 1.50 0.00 0.00 0.00 1.00 2.00 2.00 0.00
PCC Fremont Campus Data - Fall 2009 - List of Course Sections
Room ID Room Type (Room Use Code) - Average Enrollment Begin Time
1730 1900 1900 2030 C129 0830 0830 1000 1000 1130 1130 1300 1300 1430 1730 1730 1730 1900 1900 C130 0830 1130 1430 1530 1730 1730 1900 1900 C131 1430 1430 1430 1730 1730 C134 0800
End Time Time of Day
Days
1845 Evening TR 2015 Evening MWF 2015 Evening TR 2135 Evening MTWR Classroom (110) - 18 0945 Morning TR 1115 Morning F 1115 Morning MW 1115 Morning TR 1245 Morning MWF 1245 Morning TR 1415 Afternoon MW 1415 Afternoon TR 1545 Afternoon TR 1845 Evening MW 1845 Evening TR 2015 Evening F 2015 Evening MW 2120 Evening TR Classroom (110) - 10 1105 Morning MW 1245 Morning MW 1545 Afternoon TR 2015 Afternoon F 1845 Evening MW 1845 Evening TR 2015 Evening MW 2145 Evening T Teaching Laboratory (210) - 10 1545 Afternoon TR 1715 Afternoon MW 1715 Afternoon MW 2015 Evening M 2015 Evening W Teaching Laboratory (210) - 10 1300 Morning MTWR
Section V. D., Page 5 of 7
No. of Stations
ASF
ASF per Station Enrollment
Section
MAN-128701 MAT-099702 MAT-060704 MAT-060703
4 15 19 17 613
24
26
COM-115701 PHI-112701 POS111701 CRJ-110701 MAT-121701 BUS-226701 COM-115702 ENG-090703 PSY-227701 PSY-102701 ENG-090704 AAA-090701 MAT-107701 BIO-204701
20 21 10 15 23 10 24 24 22 11 23 8 19 19 600
24
25
SOC-102702 ENG-122702 THE-111701 ECE-288701 PSY-249701 MUS-120701 HIS-201701 SWK-100701
6 16 10 5 9 8 18 9 875
12
73
ART-112701 ART-121701 ART-122701 LIT-255701 HUM-121701
12 12 2 12 12 867
Nursing Open Lab
10
87 10
Total Peak Weekly Course Section Hours
Total Weekly Student Contact Hrs (WSCH)
Total Hours in Use Student Station Occupancy %
Peak Weekly Course Section Hours
Weekly Student Contact Hrs
Hours in Use Student Station Occupancy %
2.50 3.50 2.50 2.00 31 2.00 1.25 2.50 2.50 3.00 1.75 2.50 1.50 1.00 2.50 2.50 1.00 2.50 4.00 17 2.17 2.50 1.75 1.00 2.50 2.50 2.50 2.00 12 1.75 2.50 2.50 2.75 2.75 18 8.00
10.00 52.50 47.50 34.00 550 40.00 26.25 25.00 37.50 69.00 17.50 60.00 36.00 22.00 27.50 57.50 8.00 47.50 76.00 181 13.02 40.00 17.50 5.00 22.50 20.00 45.00 18.00 122 21.00 30.00 5.00 33.00 33.00 170 80.00
1.0% 5.2% 4.7% 3.4% 55% 4.0% 2.6% 2.5% 3.7% 6.8% 1.7% 6.0% 3.6% 2.2% 2.7% 5.7% 0.8% 4.7% 7.5% 18% 1.3% 4.0% 1.7% 0.5% 2.2% 2.0% 4.5% 1.8% 24% 4.2% 6.0% 1.0% 6.5% 6.5% 61% 28.6%
Δ of Applicable State Utilization Guidelines
Total Non-Peak Weekly Course Section Hours Non-Peak Weekly Course Section Hours
-13%
-50%
-44%
-19%
0.00 0.25 0.00 2.33 8 0.50 1.50 0.00 0.00 0.75 0.75 0.00 1.00 1.50 0.00 0.00 1.75 0.00 0.67 8 3.00 0.00 0.75 3.75 0.00 0.00 0.00 0.75 7 0.75 3.00 3.00 0.00 0.00 33 12.00
PCC Fremont Campus Data - Fall 2009 - List of Course Sections
Room ID Room Type (Room Use Code) - Average Enrollment Begin Time
End Time Time of Day
Days
0800 1330 Morning F 1330 1500 Afternoon MTWRF 1500 2130 Afternoon F 1530 1730 Afternoon M 1530 1700 Afternoon W 1530 1745 Afternoon TR 1730 1845 Evening MW C135 Teaching Laboratory (210) - 10 0800 1200 Morning MR 0800 1130 Morning TW 0800 2200 All Day F 1530 1730 Afternoon M 1530 1700 Afternoon W 1600 2200 Evening TR 1730 1845 Evening MW C137 Classroom (110) - 17 0800 1200 Morning TR 0800 1600 All Day S 0900 1030 Morning MW 1130 1245 Morning MW 1300 1430 Afternoon TR 1400 1555 Afternoon MW 1800 2130 Evening MW 1800 2045 Evening R C138 Teaching Laboratory (210) - 24 0830 0945 Morning MW 0830 1020 Morning TR 1300 1420 Afternoon MW 1300 1415 Afternoon TR 1430 1625 Afternoon M 1430 1625 Afternoon T 1730 1845 Evening MW 1730 1845 Evening TR 1730 1925 Evening F 1900 2055 Evening R Section V. D., Page 6 of 7
No. of Stations
ASF
ASF per Station Enrollment
Section
Nursing Open Lab NUA-101702 Nursing Open Lab Nursing Open Lab Nursing Open Lab NUA-101701 SPA-101701
10 9 10 10 10 9 10 829
10
83
Nursing Open Lab Nursing Open Lab Nursing Open Lab Nursing Open Lab Nursing Open Lab Nursing Open Lab LAT-175701
10 10 10 10 10 10 10 640
28
23
NUR-109701 HPR-102701 NUR-206701 SOC-101701 NUR-112701 SCI-156701 EMS-126701 ECE-260701
24 9 18 20 25 6 1 16 1,214
GEY-111701 CHE-101701 BIO-202701 BIO-105701 BIO-202701 BIO-105701 BIO-105702 BIO-201701 BIO-105702 BIO-201701
28
43 16 19 23 26 23 26 27 27 27 27
Total Peak Weekly Course Section Hours
Total Weekly Student Contact Hrs (WSCH)
Total Hours in Use Student Station Occupancy %
Peak Weekly Course Section Hours
Weekly Student Contact Hrs
Hours in Use Student Station Occupancy %
1.00 4.00 0.00 0.50 0.00 1.50 2.50 16 3.00 2.00 1.00 0.50 0.00 7.00 2.50 18 7.00 0.00 1.00 2.50 2.00 2.91 6.00 2.75 10 0.00 0.00 0.67 0.50 1.42 1.42 2.50 2.50 0.00 0.92
10.00 36.00 0.00 5.00 0.00 13.50 25.00 160 30.00 20.00 10.00 5.00 0.00 70.00 25.00 347 168.00 0.00 18.00 50.00 50.00 17.46 6.00 44.00 258 0.00 0.00 15.41 13.00 32.66 36.92 67.50 67.50 0.00 24.84
3.6% 12.9% 0.0% 1.8% 0.0% 4.8% 8.9% 57% 10.7% 7.1% 3.6% 1.8% 0.0% 25.0% 8.9% 30% 14.3% 0.0% 1.5% 4.3% 4.3% 1.5% 0.5% 3.7% 33% 0.0% 0.0% 2.0% 1.7% 4.2% 4.7% 8.6% 8.6% 0.0% 3.2%
Δ of Applicable State Utilization Guidelines
Total Non-Peak Weekly Course Section Hours Non-Peak Weekly Course Section Hours
-23%
-38%
-47%
4.50 3.50 6.50 1.50 1.50 3.00 0.00 31 5.00 5.00 13.00 1.50 1.50 5.00 0.00 13 1.00 8.00 2.00 0.00 1.00 0.92 1.00 0.00 14 2.50 3.67 2.00 2.00 0.50 0.50 0.00 0.00 1.92 1.00
PCC Fremont Campus Data - Fall 2009 - List of Course Sections
Room ID Room Type (Room Use Code) - Average Enrollment Begin Time
End Time Time of Day
L109 Classroom (110) - 5 1730 2045 Afternoon 1730 2045 Afternoon L118 Library (430) - 9 1730 1820 Evening
Days
Section
MW TR
MAR-106701 MAT-155702
MW
ENG-030702
No. of Stations
ASF
ASF per Station Enrollment
169
6
28 6 4
285
15
19 9
Total Peak Weekly Course Section Hours
Total Weekly Student Contact Hrs (WSCH)
Total Hours in Use Student Station Occupancy %
Peak Weekly Course Section Hours
Weekly Student Contact Hrs
Hours in Use Student Station Occupancy %
Δ of Applicable State Utilization Guidelines
Total Non-Peak Weekly Course Section Hours Non-Peak Weekly Course Section Hours
13 6.50 6.50 2 1.67
65 39.00 26.00 15 15.03
26% 15.5% 10.3% 2% 2.4%
-42%
-66%
0 0.00 0.00 0 0.00
CLASSROOM UTILIZATION TOTALS AVERAGE CLASSROOM UTILIZATION
5,757 523
232 21
280 25
204 19
3,171 288
29%
-39%
98 9
TEACHING LABORATORY UTILIZATION TOTALS AVERAGE TEACHING LABORATORY UTILIZATION
4,912 982
80 16
342 68
63 13
778 156
37%
-43%
86 17
Section V. D., Page 7 of 7
PCC Fremont Campus Fall 2009 Classroom & Laboratory Utilizations Utilization Analysis by Room Capacity Main Building - Classrooms Room Capacity (Number of Stations)
Number of Rooms
Average Room Size (SF)
Average ASF per Station
Average Section Size (Enrollment)
Average Peak Weekly Room Hours
Hours in Use Student Station Occupancy
20 and Under
4
516
38
9
12
20%
21 to 30
4
617
25
16
26
38%
31 to 40
2
719
22
18
30
46%
41 to 50 51 to 60 61 to 75 76 to 100
Main Building - Teaching Laboratories Room Capacity (Number of Stations)
Number of Rooms
Average Room Size (SF)
Average ASF per Station
Average Section Size (Enrollment)
Average Peak Weekly Room Hours
Hours in Use Student Station Occupancy
20 and Under
4
925
75
11
14
39%
21 to 30
1
1,214
43
24
10
33%
31 to 40 41 to 50 51 to 60 61 to 75 76 to 100
Section V.E., Page 1 of 1
V.F.
ALTERNATIVE ENROLLMENT SPACE NEEDS AND UTILIZATION STUDIES
In the course of analyzing Fall 2009 space utilization for the Fremont Campus, the consultants studied information not only from academic FTE enrollment documented in the College’s databases, but also room use for special non-credit program offerings. With programs designed for senior adults and alternative high school students, as well as other community groups, the Fremont Campus hosts numerous class sessions for these groups concurrent with the standard academic calendar, with program scheduling matching the days/times of FTE students. Overall campus building scheduling is therefore coordinated to account for use by both FTE enrollment and non-FTE enrollment, particularly to accommodate the specialized activities, furnishings and equipment associated with these diverse groups. Though accounting of non-FTE enrollment is not covered in the Banner system, the College maintains record of non-FTE enrollment as required by the respective programs. The Consultants obtained their enrollment numbers from Fall of 2009, supplied by the Campus Dean and Campus Scheduler to ascertain a full representation of building use by the FTE and non-FTE populations, beyond the FTE-only enrollment figures mandated by the State’s reporting guidelines in the context of this Facilities Master Plan. The purpose of this exercise was to document and quantify the real-life utilization of these facilities, the competition for academic space between FTE and non-FTE, and to determine and address the College’s reported experiences of shortfall program space in some facilities, such as the Nursing Program. To achieve this, the Consultants prepared an alternative enrollment set of utilizations. This alternative set, designated “Set B” by the Consultants, comprised FTE enrollment by Banner + nonFTE (Senior Adults and Alternative High School program students). To determine a relative utilization figure for the non-FTE, the Consultants applied a similar formula, replacing the 42/28 guideline hours with the “reported hours/week occupied” of the course session and then added this to the actual hours beyond peak hours of FTE-only enrollment. In doing so, the consultants, having been made aware of numerous uses reported by the Campus Dean, staff and faculty of various rooms (both classroom and laboratory types) for use by non-credit course activities, as well as overenrolled credit courses and credit course activities which could not be accommodated properly in their assigned room - all undocumented by Banner - have duly accounted for actual use of the physical space. The following tables represent a comparison of the major space categories of the Fall 2009 Space Needs Analysis between the CCHE Approved Set and “Set B”. While guideline Academic Support Space and Auxiliary Space categories showed the same deficits for both sets, the guideline Academic Space category showed a significantly lower surplus for Set B, resulting in an overall Campus Master Plan deficit and a higher ASF/FTE (47) for the combined Academic + Academic Support categories over the CCHE Approved FTE-only (40).
Section V.F., Page 1 of 12
Additional Conclusions: The Set B Fremont Campus Space Needs Analysis for the Fall 2009 guidelines reported significantly higher assignable square footage (ASF) in the academic space categories: combined Set B Classroom/Service and Teaching Laboratory/Service was over 58% higher compared to the CCHE approved FTE-only. Likewise, student station occupancy (SSO) utilizations (%) and building analysis (%) for Set B were higher on average for both classrooms and teaching laboratories: Set B’s figures were 114% higher over FTE-only for classrooms and 146% higher over FTE-only for teaching laboratories, with building analysis at 114% higher over FTE-only for classrooms and 146% higher over FTE-only for teaching laboratories. Finally, utilization studies by Room Capacity showed Set B to be on average 77% higher over FTE-only for classrooms and 126% on average higher over FTEonly for teaching laboratories. It is important to note that Fremont’s Set B SSO figures were near the state’s optimum for classrooms and exceeded optimum for teaching laboratories, underscoring critical academic space needs. The space needs analysis and utilizations for the Set B alternative enrollment follow within this appendix.
Section V.F., Page 2 of 12
Space Needs Analysis - Fremont Campus Set B
Base Year Target Year Semester FTE
F2009
F2009 F2014 446
Space Category Academic Space Classroom & Service Teaching Laboratory & Service Open Laboratory & Service Academic Offices & Service Other Academic Space Academic Space - Subtotal
Academic Support Space Administrative Office & Service Library / Resource Center Assembly & Exhibit Space Physical Plant Other Administrative Space Academic Support Space - Subtotal
Auxiliary Space Student Lounge Fitness Center Health Clinic Bookstore / Merchandising Auxiliary Space - Subtotal
Campus Master Plan (ASF) Surplus/(Deficit) Inactive/Conversion Space Outside Organization Campus Master Plan (GSF/FTE)
Section V.F., Page 3 of 12
Existing ASF
Surplus / (Deficit) ASF
479
Guideline ASF ASF/FTE
Guideline ASF ASF/FTE
5,778 5,485 2,083 452 0
2,209 1,004 (103) (1,997) 0
3,569 4,481 2,186 2,449 0
8.00 10.04 4.90 5.49 0.00
3,831 4,811 2,347 3,099 0
8.00 10.04 4.90 6.47 0.00
13,798
1,113
12,685
28.43
14,088
29.41
2,357 2,716 0 1,465 1,202
907 276 (1,545) 94 (105)
1,450 2,440 1,545 1,371 1,307
3.25 5.47 3.46 3.07 2.93
1,600 2,644 2,876 1,732 1,343
3.34 5.52 6.00 6.00 3.62
7,740
(373)
8,113
18.18
10,195
21.28
544 0 0 770
(1,017) 0 0 (144)
1,561 0 0 914
3.50 0.00 0.00 2.05
2,100 0 196 914
4.38 0.00 0.41 0.41
1,314 22,852
(1,161)
2,475 23,273
5.55 52.16
6.70 57.40
3,105 7,745
3,105
6.96
3,210 27,493 (4,641) 1,105
37,007
37,608
84.28
40,772
85.12
(421)
2.31
PCC Fremont Campus Fall 2009 Classroom & Teaching Laboratory Utilizations Utilization Analysis by Building
Classroom and Teaching Laboratory Utilization Analysis Detail by Building
Building Main Building
Section V.F., Page 4 of 12
Set B
Number of Classrooms
Average Number of Stations per Classroom
Utilization Average for Classrooms
Number of Teaching Laboratories
Average No. of Stations per Teaching Laboratory
Utilization Average for Teaching Laboratories
11
21
62%
5
16
91%
PCC Fremont Campus Fall 2009 Classroom & Teaching Laboratory Utilizations Utilization Analysis by Function
Classroom Utilization Analysis Detail by Function
Room ID
Room Use Code
A105 C123 C124 C126 C127 C128 C129 C130 C137 L109 L118
350 110 110 110 110 110 110 110 110 110 430
Averages Totals No. of Rooms
Set B
ASF
No. of Stations
ASF per Station
Average Enrollment
Total Weekly Course Section Hours
Total Weekly Student Contact Hours
Total Hours in Use Student Station Occupancy %
285 558 557 719 719 612 613 600 640 169 285
15 16 16 32 32 24 24 24 28 6 15
19 35 35 22 22 26 26 25 23 28 19
11 9 10 17 19 17 18 10 18 5 9
6 35 26 44 42 39 39 25 23 13 2
61 251 263 793 792 657 702 232 438 65 15
67% 45% 64% 56% 60% 71% 75% 38% 68% 83% 60%
523 5,757 11
21 232
25
13
27
388 4,269
62%
Teaching Laboratory Utilization Analysis Detail by Function
Room ID
Room Use Code
C125 C131 C134 C135 C138
210 210 210 210 210
Averages Totals No. of Rooms Section V.F., Page 5 of 12
Set B
ASF
No. of Stations
ASF per Station
Average Enrollment
Total Weekly Course Section Hours
Total Weekly Student Contact Hours
Total Hours in Use Student Station Occupancy %
1,127 875 867 829 1,214
20 12 10 10 28
56 73 87 83 43
11 11 10 11 24
50 19 50 47 24
907 179 501 480 569
91% 78% 100% 102% 85%
982 4,912 5
16 80
68
13
38
527 2,636
91%
Notes:
Italicized text represents time(s) when a classroom or laboratory was used for a function other than an FTE course, i.e. alternative high school, open lab, ESL classes, etc. Light gray text represents courses with only one attendee. These courses are listed from informational purposes only and not included with the other data for that room. An enrollment number in red represents actual enrollment when it exceeds maximum enrollment for that course, see the summary at the end of this table. * indcates an individual course which represents a series of related coursework
PCC Fremont Campus Data - Fall 2009 - List of Course Sections
Room ID Room Type (Room Use Code) - Average Enrollment Begin Time
A105 1430 1730 C123 1000 1000 1130 1430 1430 1600 1730 1730 1800 1800 C124 0830 1000 1000 1130 1600 1600 1730 1800 1900 C125 0800 1600 1730 1730 1900
End Time Time of Day
Days
Conference Room (350) - 11 1610 Afternoon TR 2015 Afternoon W Classroom (110) - 9 1235 Morning M 1330 Morning T 1245 Morning F 1710 Afternoon TR 1710 Afternoon TR 1710 Afternoon MW 2010 Evening TR 2010 Evening TR 2045 Evening M 1850 Evening W Classroom (110) - 10 0945 Morning MW 1115 Morning MW 1300 Morning T 1245 Morning TR 1710 Afternoon MWF 1740 Afternoon TR 1845 Evening MW 1940 Evening TR 2015 Evening MW Teaching Laboratory (210) - 11 1600 All Day MTWRF 1715 Afternoon MW 1845 Evening TR 2015 Evening M 2010 Evening TR
Section V.F., Page 6 of 12
Set B No. of Stations
ASF
ASF per Station Enrollment*
Section
285
15
19
BIO-216701 ECO-201701
5 16 558
16
35
CIS-110703 Seniors CIS-130701 ART-143702 ART-243702 *BTE-100701 ART-143701 ART-243702 ECE-101701 ECE-102701
13 10 15 3 2 10 14 2 8 8 557
16
35
REA-090701 REA-060702 COMP 1003 7NC REA-030701 ACC-121701 CIS-155701 REA-090702 CIS-128701 MAT-112701
16 8 17 6 8 7 15 10 6 1,127
High Schoolers CIS-115701 CIS-110701 EDU-261701 REA-060701
20
56 20 13 12 6 12
Total Weekly Course Section Hours
Total Weekly Student Contact Hrs (WSCH)
Total Hours in Use Student Station Occupancy %
Weekly Course Section Hours
Weekly Student Contact Hrs
Hours in Use Student Station Occupancy %
6 3.33 2.75 35 2.58 3.50 1.25 5.33 5.33 2.33 5.33 5.33 2.75 0.83 26 2.50 2.50 3.00 2.50 3.50 3.33 2.50 3.33 2.50 50 40.00 2.50 2.50 2.75 2.33
61 16.65 44.00 251 33.54 35.00 18.75 15.99 10.66 23.30 74.62 10.66 22.00 6.64 263 40.00 20.00 51.00 15.00 28.00 23.31 37.50 33.30 15.00 907 800.00 32.50 30.00 16.50 27.96
67% 18.3% 48.2% 45% 6.1% 6.3% 3.4% 2.9% 1.9% 4.2% 13.5% 1.9% 4.0% 1.2% 64% 9.7% 4.9% 12.4% 3.7% 6.8% 5.7% 9.1% 8.1% 3.7% 91% 79.9% 3.2% 3.0% 1.6% 2.8%
Δ of Applicable State Utilization Guidelines
-1%
-23%
-4%
11%
PCC Fremont Campus Data - Fall 2009 - List of Course Sections
Room ID Room Type (Room Use Code) - Average Enrollment Begin Time
End Time Time of Day
C126 Classroom (110) - 17 0830 1105 Morning 0830 0945 Morning 0830 1115 Morning 1000 1105 Morning 1130 1245 Morning 1130 1245 Morning 1300 1415 Afternoon 1300 1545 Afternoon 1430 1535 Afternoon 1600 1725 Afternoon 1600 1715 Afternoon 1730 1845 Evening 1730 1845 Evening 1900 2015 Evening 1900 2015 Evening C127 Classroom (110) - 19 0830 0945 Morning 0830 0945 Morning 1000 1115 Morning 1000 1245 Morning 1130 1245 Morning 1130 1245 Morning 1300 1415 Afternoon 1300 1515 Afternoon 1430 1545 Afternoon 1430 1715 Afternoon 1730 1845 Evening 1730 1845 Evening 1730 2015 Evening 1900 2015 Evening 1900 2015 Evening C128 Classroom (110) - 17 0830 0945 Morning Section V.F., Page 7 of 12
Days
Section
MW TR F MTWR MWF TR TR F MTWR MW TR MW TR MWF TR
SOC-102702 ENG-121702 ART-110701 *MAT-030701 MAT-099701 MAT-060705 HIS-101701 HPR-178701 MAT-030702 BTE-225701 SOC-205701 CRJ-135701 MAT-030704 MAT-090703 ENG-122701
MW TR MWF S MW TR MW MW TR S MW TR F MW TR
ENG-090701 ENG-060701 MAT-090701 ENG-222701 ENG-090702 PSY-101701 HPR-108701 MAT-103701 LIT-115701 ENG-121705 COM-115703 PHI-111701 COM-115704 PSY-235702 PHI-114701
Set B No. of Stations
ASF
Enrollment*
719
22
32
22 25 31 25 9 21 25 26 17 7 8 15 14 19 31 14
612 BUS-216701
32
6 22 8 31 29 23 25 10 22 6 9 17 11 18 16 719
TR
ASF per Station
24
26 11
Total Weekly Course Section Hours
Total Weekly Student Contact Hrs (WSCH)
Total Hours in Use Student Station Occupancy %
Weekly Course Section Hours
Weekly Student Contact Hrs
Hours in Use Student Station Occupancy %
44 2.17 2.50 2.75 4.33 3.75 2.50 2.50 2.75 4.33 2.83 2.50 2.50 2.50 3.75 2.50 42 2.50 2.50 3.75 2.75 2.50 2.50 2.50 4.50 2.50 2.75 2.50 2.50 2.75 2.50 2.50 39 2.50
793 13.02 55.00 22.00 134.23 108.75 57.50 62.50 27.50 95.26 16.98 22.50 42.50 27.50 67.50 40.00 792 62.50 77.50 93.75 24.75 52.50 62.50 65.00 76.50 17.50 22.00 37.50 35.00 52.25 77.50 35.00 657 27.50
56% 0.9% 3.9% 1.6% 9.5% 7.7% 4.1% 4.4% 1.9% 6.7% 1.2% 1.6% 3.0% 1.9% 4.8% 2.8% 60% 4.7% 5.8% 7.1% 1.9% 4.0% 4.7% 4.9% 5.8% 1.3% 1.7% 2.8% 2.6% 3.9% 5.8% 2.6% 71% 3.0%
Δ of Applicable State Utilization Guidelines
-12%
-8%
3%
PCC Fremont Campus Data - Fall 2009 - List of Course Sections
Room ID Room Type (Room Use Code) - Average Enrollment Begin Time
End Time Time of Day
0830 1115 Morning 1000 1115 Morning 1130 1245 Morning 1300 1415 Afternoon 1300 1415 Afternoon 1430 1545 Afternoon 1430 1630 Afternoon 1730 1845 Evening 1730 1845 Evening 1900 2015 Evening 1900 2015 Evening 2030 2135 Evening C129 Classroom (110) - 18 0830 0945 Morning 0830 1115 Morning 1000 1115 Morning 1000 1115 Morning 1130 1245 Morning 1130 1245 Morning 1300 1415 Afternoon 1415 Afternoon 1300 1430 1545 Afternoon 1730 1845 Evening 1730 1845 Evening 1730 2015 Evening 1900 2015 Evening 1900 2120 Evening C130 Classroom (110) - 10 0830 1105 Morning 1130 1245 Morning 1430 1545 Afternoon 1530 2015 Afternoon 1730 1845 Evening Section V.F., Page 8 of 12
Days
Section
F MW MW MW TR MWF TR MW TR MWF TR MTWR
PSY-235701 ANT-111701 ENG-121701 ENG-121703 GEO-105701 MAT-090702 MAT-120701 ENG-121704 MAN-128701 MAT-099702 MAT-060704 *MAT-060703
TR F MW TR MWF TR MW TR TR MW TR F MW TR
COM-115701 PHI-112701 POS111701 CRJ-110701 MAT-121701 BUS-226701 COM-115702 ENG-090703 PSY-227701 PSY-102701 ENG-090704 AAA-090701 MAT-107701 BIO-204701
Set B No. of Stations
ASF
Enrollment*
30 12 21 25 16 23 9 21 4 15 19 17 613
SOC-102702 ENG-122702 THE-111701 ECE-288701 PSY-249701
24
26 20 21 10 15 23 10 25 24 22 11 23 8 19 19
600 MW MW TR F MW
ASF per Station
24
25 6 16 10 5 9
Total Weekly Course Section Hours
Total Weekly Student Contact Hrs (WSCH)
Total Hours in Use Student Station Occupancy %
Weekly Course Section Hours
Weekly Student Contact Hrs
Hours in Use Student Station Occupancy %
2.75 2.50 2.50 2.50 2.50 3.75 4.00 2.50 2.50 3.75 2.50 4.33 39 2.50 2.75 2.50 2.50 3.75 2.50 2.50 2.50 2.50 2.50 2.50 2.75 2.50 4.67 25 5.17 2.50 2.50 4.75 2.50
82.50 30.00 52.50 62.50 40.00 86.25 36.00 52.50 10.00 56.25 47.50 73.61 702 50.00 57.75 25.00 37.50 86.25 25.00 62.50 60.00 55.00 27.50 57.50 22.00 47.50 88.73 232 31.02 40.00 25.00 23.75 22.50
8.9% 3.2% 5.7% 6.8% 4.3% 9.3% 3.9% 5.7% 1.1% 6.1% 5.1% 7.9% 75% 5.4% 6.2% 2.7% 4.0% 9.2% 2.7% 6.7% 6.4% 5.9% 2.9% 6.2% 2.4% 5.1% 9.5% 38% 5.1% 6.6% 4.1% 3.9% 3.7%
Δ of Applicable State Utilization Guidelines
7%
-30%
PCC Fremont Campus Data - Fall 2009 - List of Course Sections
Room ID Room Type (Room Use Code) - Average Enrollment Begin Time
1730 1900 1900 C131 1430 1430 1430 1730 1730 C134 0800 0800 1330 1500 1530 1530 1530 1730 C135 0800 0800 0800 1530 1530 1600 1730 C137 0800 0900 1130 1300 1400 1800
End Time Time of Day
Days
1845 Evening TR 2015 Evening MW 2145 Evening T Teaching Laboratory (210) - 11 1545 Afternoon TR 1715 Afternoon MW 1715 Afternoon MW 2015 Evening M 2015 Evening W Teaching Laboratory (210) - 10 1300 Morning MTWR 1330 Morning F 1500 Afternoon MTWRF 2130 Afternoon F 1730 Afternoon M 1700 Afternoon W 1745 Afternoon TR 1845 Evening MW Teaching Laboratory (210) - 11 1200 Morning MR 1130 Morning TW 2200 All Day F 1730 Afternoon M 1700 Afternoon W 2200 Evening TR 1845 Evening MW Classroom (110) - 18 1200 Morning TR 1030 Morning MW 1245 Morning MW 1430 Afternoon TR 1555 Afternoon MW 2130 Evening MW
Section V.F., Page 9 of 12
Set B No. of Stations
ASF
ASF per Station Enrollment*
Section
MUS-120701 HIS-201701 SWK-100701
8 18 9 875
12
73
ART-112701 ART-121701 ART-122701 LIT-255701 HUM-121701
12 12 2 12 14 867
10
87
Nursing Open Lab Nursing Open Lab NUA-101702 Nursing Open Lab Nursing Open Lab Nursing Open Lab NUA-101701 SPA-101701
10 10 9 10 10 10 9 15 829
10
83
Nursing Open Lab Nursing Open Lab Nursing Open Lab Nursing Open Lab Nursing Open Lab Nursing Open Lab LAT-175701
10 10 10 10 10 10 14 640
NUR-109701 NUR-206701 SOC-101701 NUR-112701 SCI-156701 EMS-126701
28
23 24 18 20 25 6 1
Total Weekly Course Section Hours
Total Weekly Student Contact Hrs (WSCH)
Total Hours in Use Student Station Occupancy %
Weekly Course Section Hours
Weekly Student Contact Hrs
Hours in Use Student Station Occupancy %
2.50 2.50 2.75 19 2.50 5.50 5.50 2.75 2.75 50 20.00 5.50 7.50 6.50 2.00 1.50 4.50 2.50 47 8.00 7.00 14.00 2.00 1.50 12.00 2.50 23 8.00 3.00 2.50 3.00 3.83 7.00
20.00 45.00 24.75 179 30.00 66.00 11.00 33.00 38.50 501 200.00 55.00 67.50 65.00 20.00 15.00 40.50 37.50 480 80.00 70.00 140.00 20.00 15.00 120.00 35.00 438 192.00 54.00 50.00 75.00 22.98 7.00
3.3% 7.4% 4.1% 78% 13.2% 28.9% 4.8% 14.5% 16.9% 100% 40.0% 11.0% 13.5% 13.0% 4.0% 3.0% 8.1% 7.5% 102% 17.0% 14.9% 29.8% 4.3% 3.2% 25.5% 7.4% 68% 29.7% 8.4% 7.7% 11.6% 3.6% 1.1%
Δ of Applicable State Utilization Guidelines
-2%
20%
22%
0%
PCC Fremont Campus Data - Fall 2009 - List of Course Sections
Room ID Room Type (Room Use Code) - Average Enrollment Begin Time
End Time Time of Day
Days
1800 2045 Evening R C138 Teaching Laboratory (210) - 24 0830 0945 Morning MW 0830 1020 Morning TR 1300 1420 Afternoon MW 1300 1415 Afternoon TR 1430 1625 Afternoon M 1430 1625 Afternoon T 1730 1845 Evening MW 1730 1845 Evening TR 1730 1925 Evening F 1900 2055 Evening R L109 Classroom (110) - 5 1730 2045 Afternoon MW 1730 2045 Afternoon TR L118 Library (430) - 9 1730 1820 Evening MW
Set B No. of Stations
ASF
ASF per Station Enrollment*
Section
ECE-260701
16 1,214
28
43
GEY-111701 CHE-101701 BIO-202701 BIO-105701 BIO-202701 BIO-105701 BIO-105702 BIO-201701 BIO-105702 BIO-201701
16 19 23 26 23 26 27 27 27 27 169
6
28
MAR-106701 MAT-155702
6 4 285
15
19
ENG-030702
9
Total Weekly Course Section Hours
Total Weekly Student Contact Hrs (WSCH)
Total Hours in Use Student Station Occupancy %
Weekly Course Section Hours
Weekly Student Contact Hrs
Hours in Use Student Station Occupancy %
2.75 24 2.50 3.67 2.67 2.50 1.92 1.92 2.50 2.50 1.92 1.92 13 6.50 6.50 2 1.67
44.00 569 40.00 69.73 61.41 65.00 44.16 49.92 67.50 67.50 51.84 51.84 65 39.00 26.00 15 15.03
6.8% 85% 5.9% 10.4% 9.1% 9.7% 6.6% 7.4% 10.0% 10.0% 7.7% 7.7% 83% 50.0% 33.3% 60% 60.0%
Δ of Applicable State Utilization Guidelines
5%
15%
-8%
CLASSROOM UTILIZATION TOTALS AVERAGE CLASSROOM UTILIZATION
5,757 523
232 21
280 25
292 27
4,269 388
62%
-6%
LABORATORY UTILIZATION TOTALS AVERAGE LABORATORY UTILIZATION
4,912 982
80 16
342 68
190 38
2,635 527
91%
11%
Section V.F., Page 10 of 12
PCC Fremont Campus Data - Fall 2009 - List of Course Sections
Room ID Room Type (Room Use Code) - Average Enrollment Begin Time
End Time Time of Day
Days
Set B No. of Stations
ASF
ASF per Station Enrollment*
Section
Total Weekly Course Section Hours
Total Weekly Student Contact Hrs (WSCH)
Total Hours in Use Student Station Occupancy %
Weekly Course Section Hours
Weekly Student Contact Hrs
Hours in Use Student Station Occupancy %
Δ of Applicable State Utilization Guidelines
In order to accommodate student interest, the following courses were enrolled beyond the maximum enrollment or the capacity of the classroom/laboratory. In some cases, a lecture class was conducted in a lab space. In concurrent Art classes ART-121701 & ART-122701 the combined enrollment exceeded the space capacity. A105 Conference Room - Room Use Code 350 1730 2015 Afternoon W ECO-201701
285
C128 Classroom - Room Use Code 110 1300 1415 Afternoon MW
612
C129 Classroom - Room Use Code 110 1300 1415 Afternoon MW
15
24
613
24
C134 Nursing Lab - Room Use Code 210 1730 1845 Evening MW
10
867
829
10
67% 52.6%
39 3
657 75
71% 8.1%
3%
25
702 75
75% 8.0%
7%
25
39 3 19 6 3
179 84 42
78% 36.8% 18.4%
-2%
14 14
50 3
501 45
100% 9.0%
20%
15
47 3
480 42
102% 8.9%
22%
14
73
87
SPA-101701
C135 Classroom Lab - Room Use Code 210 1730 1845 Evening MW LAT-175701
61 48
26
COM-115702 12
6 3
-1%
16 26
ENG-121703
C131 Teaching Laaboratory - Room Use Code 210 875 1430 1715 Afternoon MW ART-121701 & ART-122701 1730 2015 Evening W HUM-121701
Section V.F., Page 11 of 12
19
83
PCC Fremont Campus Fall 2009 Classroom & Laboratory Utilizations Utilization Analysis by Room Capacity Main Building - Classrooms Room Capacity (Number of Stations)
Number of Rooms
Average Room Size (SF)
Average ASF per Station
Set B (All FTE & CETD) Average Hours in Use Weekly Room Student Station Hours Occupancy
Average Section Size (Enrollment)
20 and Under
4
516
38
9
20
65%
21 to 30
4
617
25
16
32
63%
31 to 40
2
719
22
18
43
58%
41 to 50 51 to 60 61 to 75 76 to 100
Main Building - Teaching Laboratories Room Capacity (Number of Stations)
Number of Rooms
Average Room Size (SF)
Average ASF per Station
Average Section Size (Enrollment)
Set B (All FTE & CETD) Average Hours in Use Weekly Room Student Station Hours Occupancy
20 and Under
4
925
75
11
42
73%
21 to 30
1
1,214
43
24
24
85%
31 to 40 41 to 50 51 to 60 61 to 75 76 to 100
Section V.F., Page 12 of 12