STATGRAPHICS – Rev. 9/16/2013
Partial Least Squares Summary ......................................................................................................................................... 1 Statistical Model ............................................................................................................................. 4 Analysis Summary .......................................................................................................................... 5 Model Comparison Plot .................................................................................................................. 7 Analysis Options ............................................................................................................................. 8 Regression Coefficients .................................................................................................................. 9 Coefficient Plot ............................................................................................................................. 10 Component Weights and Loadings ............................................................................................... 11 2D Component Plots ..................................................................................................................... 12 3D Component Plots ..................................................................................................................... 14 Predictions and Residuals ............................................................................................................. 15 Observed versus Predicted ............................................................................................................ 17 Leverages ...................................................................................................................................... 18 Residual Distance Graphs ............................................................................................................. 19 Save Results .................................................................................................................................. 20 Calculations................................................................................................................................... 20
Summary The Partial Least Squares (PLS) procedure is designed to construct a statistical model relating multiple independent variables X to multiple dependent variables Y. The procedure is most helpful when there are many factors and the primary goal is prediction of the response variables. PLS is widely used by chemical engineers and chemometricians for spectrometric calibration.
Sample StatFolio: pls.sgp Sample Data: The file spectra.sgd contains the observed spectra for n = 33 samples containing known concentrations of two amino acids, tyrosine and trytophan. The spectra are measured at k = 30 frequencies. A portion of the data, from McAvoy et al. (1989), is shown below: Sample 17mix35 19mix35 21mix35 23mix35 25mix35 27mix35 29mix35 28mix35 26mix35 24mix35
Tryptophan 0.00003000 0.00002970 0.00002925 0.00002850 0.00002700 0.00002250 0.00001500 0.00000750 0.00000300 0.00000150
Tyrosine 0.00000001 0.00000030 0.00000075 0.00000150 0.00000300 0.00000750 0.00001500 0.00002250 0.00002700 0.00002850
2013 by StatPoint Technologies, Inc.
f1 -6.215 -5.516 -5.519 -5.294 -4.600 -3.812 -3.053 -2.626 -2.370 -2.326
f2 -5.809 -5.294 -5.294 -4.705 -4.069 -3.376 -2.641 -2.248 -1.990 -1.952
f3 -5.114 -4.823 -4.501 -4.262 -3.764 -3.026 -2.382 -2.004 -1.754 -1.702
f4 -3.963 -3.858 -3.863 -3.605 -3.262 -2.726 -2.194 -1.839 -1.624 -1.583
f5 -2.897 -2.827 -2.827 -2.726 -2.598 -2.249 -1.977 -1.742 -1.560 -1.507
Partial Least Squares - 1
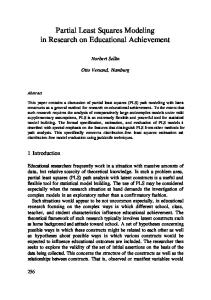
STATGRAPHICS – Rev. 9/16/2013 The leftmost column identifies each sample. The next 2 columns are known concentrations of the amino acids. The remaining 30 columns contain the measured spectra. Note: concentrations originally equal to 0 have been set to 1.0E-8 so that logarithmic transformations may be taken. The observed spectrum for a typical sample is shown below:
Spectrum for Selected Sample
Measurement
-3
-4
-5
-6
-7 0
10
20
30
Frequency
The first 18 samples will be used as a training set to estimate a predictive model. The model will then be tested on the remaining 15 samples.
2013 by StatPoint Technologies, Inc.
Partial Least Squares - 2
STATGRAPHICS – Rev. 9/16/2013
Data Input The data input dialog box requests the names of the columns containing the dependent variables Y and the independent variables X:
Y: one or more numeric columns containing the n observations for the dependent variables Y. Either column names or STATGRAPHICS expressions may be entered.
X: one or numeric columns containing the n values for the independent variables X.
Select: subset selection. Rows selected will be used as the training set. Rows not selected may be used as a test set to validate the fitted model.
In the example, base 10 logarithms of the concentrations have been used to create 2 dependent variables. All 30 frequencies have been entered in the Independent Variables field. The entry in the Select field will cause the first 18 rows to be used as the training set.
2013 by StatPoint Technologies, Inc.
Partial Least Squares - 3
STATGRAPHICS – Rev. 9/16/2013
Statistical Model As in multiple regression, the goal of PLS is to construct a linear model of the form Y = X + E
(1)
where Y is an n by m matrix containing the n standardized values of the m dependent variables, X is an n by p matrix containing the standardized values of the p predictor variables, is a p by m matrix of model parameters, and E is an n by m matrix of errors. Unlike multiple regression, the number of observations n may be less than the number of independent variables p. Rather than estimating directly, however, c components are first extracted. The coefficients are then calculated from the product of two matrices:
= WQ
(2)
where W is a p by c matrix of weights that transform X into a matrix of factor scores T according to T = XW
(3)
and Q is a matrix of regression coefficients (loadings) that express the dependence between Y and the factor scores: Y = TQ + E
(4)
The matrix of independent variables can also be represented in terms of a c by p factor loading matrix P as X = TP + F
(5)
where F is an n by p matrix of deviations. Part of the task in performing a PLS analysis is determining the proper number of components c. If c is set too low or too high, the model may not give good predictions for future observations.
2013 by StatPoint Technologies, Inc.
Partial Least Squares - 4
STATGRAPHICS – Rev. 9/16/2013
Analysis Summary The Analysis Summary shows information about the fitted model. The top section of the output summarizes the input data and displays an analysis of variance for each dependent variable. Partial Least Squares (FIRST(18)) Number of dependent variables: 2 Number of dependent variables: 30 Selection variable: FIRST(18) Number of complete cases: 18 Number of components extracted: 10 Cross-validation: test set of size 15 Analysis of Variance for LOG10(Tryptophan) Source Sum of Squares Df Mean Square Model 17.8939 10 1.78939 Residual 0.00768727 7 0.00109818 Total (corr.) 17.9016 17 Analysis of Variance for LOG10(Tyrosine) Source Sum of Squares Df Mean Square Model 23.6216 10 2.36216 Residual 0.180605 7 0.0258006 Total (corr.) 23.8022 17
F-ratio 1629.42
P-Value 0.0
F-ratio 91.5542
P-Value 0.0
Included in the output are:
Variable Summary: an indication of the number of X variables (p) and the number of Y variables (m).
Number of Complete Cases: the number of observations n in the training set.
Number of Components Extracted: the number of components c used to fit the model. c may not be greater than the smaller of p and (n – 1).
Cross-validation: the method used to validate the predictive model. Depending on Analysis Options, an internal or external test set may be used to help select the number of components.
Analysis of Variance: an ANOVA table for each of the dependent variables. Small Pvalues (less than 0.05 if operating at the 5% significance level) indicate that the model is statistically significant.
In the example above, 10 components have been extracted. The resulting models are significant predictors for the concentration of both amino acids, since both P-values are extremely small. The second part of the output illustrates the usefulness models with different numbers of components:
2013 by StatPoint Technologies, Inc.
Partial Least Squares - 5
STATGRAPHICS – Rev. 9/16/2013
Model for LOG10(Tryptophan) % Variation Component in Y R-Squared
1 2 3 4 5 6 7 8 9 10
89.2544 1.5555 2.72958 3.35486 2.34307 0.662132 0.0109937 0.0376265 0.00747959 0.00142102
89.2544 90.8099 93.5395 96.8943 99.2374 99.8995 99.9105 99.9482 99.9556 99.9571
Model for LOG10(Tyrosine) % Variation Component in Y R-Squared
1 2 3 4 5 6 7 8 9 10
33.0645 37.8953 15.5414 7.78511 2.66735 1.17416 0.639761 0.103256 0.186533 0.183816
33.0645 70.9599 86.5012 94.2863 96.9537 98.1279 98.7676 98.8709 99.0574 99.2412
Mean Square Prediction PRESS R-Squared
0.347775 0.707034 0.228176 0.411722 0.411939 0.393239 0.377131 0.431895 0.441894 0.403183
66.661 32.2211 78.1262 60.5307 60.5099 62.3026 63.8468 58.5969 57.6384 61.3494
Mean Square Prediction PRESS R-Squared
3.69937 0.665031 1.51629 0.545092 0.461777 0.415877 0.362297 0.341738 0.297217 1.01946
0.0 40.5959 0.0 51.3096 58.7517 62.8517 67.6378 69.4742 73.451 8.93679
For each dependent variable, the tables show:
% Variation in Y: the percentage of the total corrected sum of squares for the training set explained by each component as it is added to the fit.
R-Squared: the cumulative percentage of the total variation explained by models with the indicated number of components, on a scale of 0% to 100%.
Mean Square PRESS: the average prediction sum of squares, calculated from the cross-validation test set. This statistic is comparable to the residual mean square in the ANOVA table, except that it is calculated from predictions for observations when they are not used to fit the model. When selecting the number of components to extract, you should look for a model with a small mean square PRESS.
Prediction R-Squared: ratio of the Mean Square PRESS for the indicated number of components to the value when a model is fit with only a constant term. High values indicate good models.
The Prediction R-Squared peaks for LOG10(Tryptophan) at 3 components, and for LOG10(Tyrosine) at 9 components. The last section of the output displays a similar table for the percentage of total variation in the X and Y variables explained as the number of components is increased.
2013 by StatPoint Technologies, Inc.
Partial Least Squares - 6
STATGRAPHICS – Rev. 9/16/2013
Independent and Dependent Variables % Variation Cumulative % Component in X of X
1 2 3 4 5 6 7 8 9 10
81.0322 16.8495 1.85606 0.197979 0.0276934 0.0128011 0.00539246 0.00581347 0.00468166 0.00405589
81.0322 97.8816 99.7377 99.9357 99.9634 99.9762 99.9816 99.9874 99.9921 99.9961
% Variation in Y
Cumulative % of Y
Average Prediction R-Squared
61.1595 19.7254 9.13549 5.56999 2.50521 0.918146 0.325377 0.0704414 0.0970064 0.0926184
61.1595 80.8849 90.0204 95.5903 98.0956 99.0137 99.3391 99.4095 99.5065 99.5991
33.3305 36.4085 39.0631 55.9202 59.6308 62.5772 65.7423 64.0355 65.5447 35.1431
The last column shows the average Prediction R-Squared across all dependent variables. The average peaks at 7 components, suggesting that a model with seven components would be a good choice.
Model Comparison Plot The cumulative percent variation in X and Y and the average prediction R-squared displayed in the table above are plotted by the Model Comparison Plot.
Model Comparison Plot
100 X Y PRESS
Percent variation
80 60 40 20 0 1
2
3
4 5 6 7 Number of components
8
9
10
This plot is helpful in visualizing how many components need to be extracted. Note that the percent variation for PRESS increases through 7 components. Note: In the rest of this document, results will be shown for a model with 7 components.
2013 by StatPoint Technologies, Inc.
Partial Least Squares - 7
STATGRAPHICS – Rev. 9/16/2013
Analysis Options
Number of components: the number of components to include in the fitted model. This number cannot exceed the smaller of the number of independent variables or n – 1.
Validation Method: the method used to cross-validate the model. This consists of exercising the model to predict observations excluded from the model fit. The following methods may be used: 1. None – no cross-validation is performed. 2. Leave out one at a time – the modeling is refit n times, each time leaving out 1 of the observations and refitting the model using the other n – 1. The omitted observation is then predicted with the model from which it was excluded. 3. Leave out every k-th - this is similar to method #2, except that only every k-th observation is omitted and then predicted. This shortens the process on large data sets. 4. Leave out blocks of k – observations are removed in groups of k, the model refit, and the k observations predicted. 5. Use non-selected cases – if an entry was made in the Select field on the data input dialog box, the cases excluded by that entry are used as test cases.
In the example, the Select field chose the first 18 rows to use as a training set for the model, with the remaining 15 rows making up a test set.
2013 by StatPoint Technologies, Inc.
Partial Least Squares - 8
STATGRAPHICS – Rev. 9/16/2013
Regression Coefficients The Regression Coefficients table shows the estimated coefficients of the fitted models. Both standardized and unstandardized coefficients are displayed. A small section of the output is shown below: Regression Coefficients Standardized Coefficients LOG10(Tryptophan) Constant 0.0 f1 -0.160437 f2 0.1732 f3 -0.170751 f4 0.422583 … …
LOG10(Tyrosine) 0.0 1.27641 0.767133 2.07999 -3.19308 …
Unstandardized Coefficients LOG10(Tryptophan) Constant -4.85093 f1 -0.104881 f2 0.113427 f3 -0.126316 f4 0.406053 … …
LOG10(Tyrosine) -0.374954 0.962157 0.579294 1.77426 -3.53788 …
The unstandardized model shows the fitted equation in the metric of the original measurements. For example, the model for the first dependent variable is log(Tryptopan) = -4.851 – 0.105f1 + 0.113f2 – 0.126f3 + 0.406f4 + …
(6)
The standardized model reexpresses each of the variables in a standardized form by subtracting its sample mean and dividing by its sample standard deviation. Expressing the new variables as Y, X1, X2, and so on, the standardized model for the sample data is Y = – 0.160X1 + 0.173X2 – 0.171X3 + 0.423X4 + …
(7)
While the unstandardized model is useful for making predictions for new samples, the coefficients of the standardized model are more easily compared with each other when the predictor variables have different units.
2013 by StatPoint Technologies, Inc.
Partial Least Squares - 9
STATGRAPHICS – Rev. 9/16/2013
Coefficient Plot The Coefficient Plot displays either of two quantities: 1. The standardized regression coefficients for each dependent variable. 2. The component loadings Q for each dependent variable. The example below plots the ’s: PLS Coefficient Plot
2.8 LOG10(Tryptophan) LOG10(Tyrosine)
Stnd. coefficient
1.8 0.8 -0.2 -1.2 -2.2
f1 f2 f3 f4 f5 f6 f7 f8 f9 f10 f11 f12 f13 f14 f15 f16 f17 f18 f19 f20 f21 f22 f23 f24 f25 f26 f27 f28 f29 f30
-3.2
The coefficients provide a type of signature for each dependent variable. Note the large negative coefficients for f4 when predicting LOG10(Tyrosine). Pane Options
Y-axis: the quantity and value to plot on the vertical axis.
2013 by StatPoint Technologies, Inc.
Partial Least Squares - 10
STATGRAPHICS – Rev. 9/16/2013 First Y/Comp: the index of the first variable or component to include in the plot.
Last Y/Comp: the index of the last variable or component to include in the plot.
First X: the index of the first independent variable to include in the plot.
Last X: the index of the last independent variable to include in the plot.
Component Weights and Loadings The Component Weights and Loadings table identifies each of the components that was extracted from the data. A portion of the table is shown below: Component Weights and Loadings Dependent Variables LOG10(Tryptophan) LOG10(Tyrosine)
1 0.192348 -0.117072
Independent Variables 1 2 f1 -0.172149 0.403733 f2 -0.168901 0.414018 f3 -0.163081 0.403805 f4 -0.151243 0.372398 … … …
2 0.0570662 0.281668
3 0.391608 0.399816 0.290047 0.0731797 …
3 0.229545 0.547727
4 0.298026 0.327923 0.156741 -0.205695 …
4 -0.764634 1.16479
5 0.232811 0.181725 0.045198 -0.447595 …
5 1.69537 1.80889
6 -1.39671 1.85993
6 0.334922 0.00542026 -0.0121344 -0.61829 …
7 -0.294154 2.24394
7 -0.206403 -0.137708 0.689201 -0.515405 …
Included in the table are: 1. Q, the c by m matrix of loadings (regression coefficients) relating the factor score matrix T to the dependent variable Y: Y = TQ + E
(8)
2. W, the p by c matrix of factor weights, which create the factor scores from the standardized values of the independent variables according to T = XW
2013 by StatPoint Technologies, Inc.
(9)
Partial Least Squares - 11
STATGRAPHICS – Rev. 9/16/2013
2D Component Plots The 2D Component Plots option will display either the factor score matrix T or the component weight matrices W and P. In the case of the factor score matrix, the plot takes the following form: PLS Factor Scores Plot
4.9
Factor 2
2.9
0.9
-1.1
-3.1 -10
-7
-4
-1 Factor 1
2
5
8
Two factors are selected, one for each axis, and n points are plotted representing the n rows in the corresponding columns of T. In situations where the factors are interpretable, this plot shows each sample’s value for those factors. If the component weights are selected, the plot has the following form: PLS Com ponent Weight Plot
0.5
0.4
f2f3 f1 f4
f5 f6
Component 2
LOG10(Tyrosine) 0.3
LOG10(Tryptophan) f7
0.2 f8 0.1
f9 f10 f18 f20 f19 f17 f24 f23 f22 f21 f16 f11 f15 f14 f26 f29 f25 f12 f13 f27 f28 f30
0 -0.18
-0.08
0.02 Com ponent 1
0.12
0.22
Two components are selected, one for each axis, and p + m points are plotted representing the p independent variables and the m dependent variables. From this plot, it may be seen how each of the original variables affects the derived components. 2013 by StatPoint Technologies, Inc. Partial Least Squares - 12
STATGRAPHICS – Rev. 9/16/2013 Pane Options
Plot – Select columns of either the factor scores matrix T or the component weights matrix W.
X-Axis Component: Select one of the c components to plot on the horizontal axis.
Y-Axis Component: Select one of the c components to plot on the vertical axis.
2013 by StatPoint Technologies, Inc.
Partial Least Squares - 13
STATGRAPHICS – Rev. 9/16/2013
3D Component Plots The 3D Component Plots option parallels the 2D plot except that three components are selected. PLS Com ponent Weight Plot
f2 f1 f3
Component 3
LOG10(Tryptophan) f4 0.56
LOG10(Tyrosine) f5
0.36 0.16
f6
-0.04
f20 f18 f22 f21 f24 f23 f17 f19 f16 f25 f15 f26 f29 f27 f14 f28 f30 f13 f12 f7 f11 f10 f9 f8
-0.24
0.5 0.4
-0.44 -0.18
-0.08
0.02
Com ponent 1
0.12
0.3 0.2 0.1 Com ponent 2 0.22
0
Pane Options
Plot – Select columns of either the factor scores matrix T or the component weights matrix W.
X-Axis Component: Select one of the c components to plot on the horizontal axis.
Y-Axis Component: Select one of the c components to plot on the axis extending back into the screen.
Z-Axis Component: Select one of the c components to plot on the vertical axis.
2013 by StatPoint Technologies, Inc.
Partial Least Squares - 14
STATGRAPHICS – Rev. 9/16/2013
Predictions and Residuals The Predictions and Residuals pane will display information for observations in the training set, observations in the test set, and/or any new rows that have been added to the datasheet containing values for the independent variables but missing values for Y. The last option allows you to exercise the model and make predictions for observations not included in either the training or test set. The table below shows part of the output for the example data: Predictions and Residuals
Row 1 2 3 4 …
LOG10(Tryptophan) -4.52288 -4.52724 -4.53387 -4.54516 …
Predicted -4.49803 -4.5206 -4.57756 -4.52187 …
Residual -0.024852 -0.0066395 0.04369 -0.0232803 …
Standardized Residual -0.768533 -0.234679 1.73365 -0.622566 …
A separate table is included for each of the dependent variables. Included in the table are:
Row – the row number in the datasheet.
Y – the observed value of the dependent variable, if any.
Predicted – the predicted value Yˆ from the fitted model.
Residual – the residual value for the i-th observation of the j-th dependent variable is calculated from
eij Yij Yˆij
(10)
Standardized Residual – for cases in the training set, an internally Studentized residual calculated by dividing each residual by an estimate of its standard error, given by
rij
eij MSE j (1 hi )
(11)
where hi is the leverage of the i-th case.
2013 by StatPoint Technologies, Inc.
Partial Least Squares - 15
STATGRAPHICS – Rev. 9/16/2013 Pane Options
The rows displayed may include: 1. Unusual residuals in the training set: any rows in the training set with standardized residuals exceeding 2 in absolute value. 2. Entire training set: all rows in the training set. 3. Test set: all rows in the test set. 4. Rows with missing responses: rows with missing values for one or more of the dependent variables.
2013 by StatPoint Technologies, Inc.
Partial Least Squares - 16
STATGRAPHICS – Rev. 9/16/2013
Observed versus Predicted This plot shows the observed values of a selected dependent variable versus the values predicted by the fitted model: Observed versus Predicted Plot for LOG10(Tryptophan)
-4
Observed
-5
-6
-7
-8 -8
-7
-6 Predicted
-5
-4
If the model fits well, the points should line along the diagonal line. Pane Options
Select the desired dependent variable to plot.
2013 by StatPoint Technologies, Inc.
Partial Least Squares - 17
STATGRAPHICS – Rev. 9/16/2013
Leverages In fitting a PLS model, all observations do not have an equal influence on the coefficient estimates in the fitted model. Those with unusual values of the independent variables tend to have more influence than the others. The Leverages pane displays any observations that have unusually high influence on the fitted model: Leverages Row Leverage Average leverage of single data point = 0.388889
Leverage is a statistic that measures the influence of each observation on the final model. Observations are placed on the list if they have more than 3 times the leverage of an average point. Observations with high leverage should be examined closely to be sure that they are valid, since a high leverage point that is also an outlier can badly distort the estimated model. In the sample data, there are no high leverage points.
2013 by StatPoint Technologies, Inc.
Partial Least Squares - 18
STATGRAPHICS – Rev. 9/16/2013
Residual Distance Graphs The Residual Distance Graphs plot the distance from the origin to the X or Y residuals corresponding to each case in the training set. The plots may be used to determine which cases deviate most from the predicted values. Distance Plot for Y Residuals
0.06 0.05
Distance
0.04 0.03 0.02 0.01 0 0
3
6
9 Row
12
15
18
Distances are expressed as the sum of squares of the difference between the observed and predicted values of the standardized variables. For the Y variables, the residuals are elements of the n by m matrix E in the equation Y = X + E
(12) Distance Plot for X Residuals
0.02
Distance
0.016 0.012 0.008 0.004 0 0
3
6
9 Row
12
15
18
For the X variables, the residuals are elements of the n by p matrix F in the equation X = TP + F 2013 by StatPoint Technologies, Inc.
(13) Partial Least Squares - 19
STATGRAPHICS – Rev. 9/16/2013
Save Results The following results may be saved to the data sheet: 1. Predicted values – the predicted values of the dependent variable(s). 2. Y Residuals – the residuals for each dependent variable. 3. Standardized Y Residuals – the standardized residuals for each dependent variable. 4. PRESS residuals – the PRESS residuals for each dependent variable. 5. X Residuals – the residuals for each independent variable. 6. Leverages – the leverages for each of the n cases. 7. Y Distance – the residual Y distance for each of the n cases. 8. X Distance – the residual X distance for each of the n cases. 9. Component Weights – the weight matrix W. 10. Y Factor Loadings – the factor loading matrix Q. 11. X Factor Loadings – the factor loading matrix P. 12. Scores – the score matrix T.
Calculations The program uses the NIPALS (Nonlinear Iterative Partial Least Squares) algorithm to extract the components, after first transforming each variable so that it has a mean equal to 0 and a standard deviation equal to 1.
2013 by StatPoint Technologies, Inc.
Partial Least Squares - 20