ORIGINAL ARTICLE
Psychosocial Risk Factors Associated With Cyberbullying Among Adolescents A Population-Based Study Andre Sourander, MD, PhD; Anat Brunstein Klomek, PhD; Maria Ikonen, MA; Jarna Lindroos, BA; Terhi Luntamo, MD; Merja Koskelainen, PhD; Terja Ristkari, MNSc; Hans Helenius, MSc
Context: To our knowledge, no population study examining psychosocial and psychiatric risk factors associated with cyberbullying among adolescents exists. Objective: To study cross-sectional associations between cyberbullying and psychiatric and psychosomatic problems among adolescents. Design: Population-based cross-sectional study. Setting: Finland. Participants: The sample consists of 2215 Finnish adolescents aged 13 to 16 years with complete information about cyberbullying and cybervictimization. Main Outcome Measures: Self-reports of cyberbullying and cybervictimization during the past 6 months. Results: In the total sample, 4.8% were cybervictims only, 7.4% were cyberbullies only, and 5.4% were cyberbully-
T
Author Affiliations: Departments of Child Psychiatry (Drs Sourander and Luntamo and Mss Ikonen, Lindroos, and Ristkari) and Biostatistics (Mr Helenius), Turku University, Turku, and Department of Child Psychiatry, Helsinki University Central Hospital, Helsinki (Dr Koskelainen), Finland; and Department of Child and Adolescent Psychiatry, Columbia University, New York, New York (Dr Brunstein Klomek).
victims. Cybervictim-only status was associated with living in a family with other than 2 biological parents, perceived difficulties, emotional and peer problems, headache, recurrent abdominal pain, sleeping difficulties, and not feeling safe at school. Cyberbully-only status was associated with perceived difficulties, hyperactivity, conduct problems, low prosocial behavior, frequent smoking and drunkenness, headache, and not feeling safe at school. Cyberbully-victim status was associated with all of these risk factors. Among cybervictims, being cyberbullied by a same-sex or opposite-sex adult, by an unknown person, and by a group of people were associated with fear for safety, indicating possible trauma. Conclusions: Both cyberbullying and cybervictimization are associated with psychiatric and psychosomatic problems. The most troubled are those who are both cyberbullies and cybervictims. This indicates the need for new strategies for cyberbullying prevention and intervention.
Arch Gen Psychiatry. 2010;67(7):720-728
HE TERM CYBERBULLYING CAN
be defined as “an aggressive, intentional act carried out by a group or individual, using electronic forms of contact, repeatedly and over time against a victim who cannot easily defend him or herself.”1 The phenomenon appeared only a few years ago as the use of electronic devices such as computers and mobile telephones by young people increased. Existing surveys on the prevalence of cyberbullying show that it is common among adolescents. Previous school or telephone surveys from the United States and the United Kingdom show that the rates of being a victim of cyberbullying and being a cyberbully are in the range of 5% to 20%.1-4 In the US survey on Internet use among individuals aged 10 to 17 years, 12% reported being aggressive to someone online, 4% were targets of aggression, and 3% were both aggressors and targets.3 Many cybervictims are
(REPRINTED) ARCH GEN PSYCHIATRY/ VOL 67 (NO. 7), JULY 2010 720
also traditional victims, while many cyberbullies are also traditional bullies.3 There are discrepancies regarding sex differences in cyberbullying: some results show that girls are more likely to be cyberbullied, while other studies show no sex differences.1,5,6 While most self-report studies of being bullied in traditional ways show a decrease in prevalence after prepuberty, some studies suggest that older school-aged children are more often Internet aggressors.1,3 A substantial number of cybervictims report distress when they are the target of cyberaggression. Smith et al7 reported that picture or video clip bullying and telephone bullying were perceived as having a higher negative impact compared with traditional bullying. The UK study showed that cybervictims most often do not talk about being bullied, so adults may not be aware of it.1 Traditional bullying is commonly divided into physical (eg, hitting, kicking), verbal (eg, teasing, threatening), and indi-
WWW.ARCHGENPSYCHIATRY.COM
©2010 American Medical Association. All rights reserved. Downloaded From: http://archpsyc.jamanetwork.com/ on 01/25/2013
rect (eg, social exclusion, spreading rumors) bullying.8 There are several special features regarding cyberbullying when compared with traditional physical, verbal, or indirect bullying such as the difficulty of escaping from it, the breadth of the potential audience, and the anonymity of the perpetrator.1 Cyberbullying can reach particularly large audiences in a peer group compared with the small groups who are the usual audience in traditional bullying. Compared with most traditional forms of bullying, the person carrying out cyberbullying may be less aware or even unaware of the consequences of his or her actions. Without such direct feedback, there may be fewer opportunities for empathy or remorse and there may also be less opportunity for bystander intervention. On the other hand, nasty text messages or e-mails can simply be deleted and future messages can be blocked. Furthermore, cyberbullying does not cause actual physical harm. Research about cyberbullying is still in the early stage of investigation. Previous surveys are mostly descriptive, have examined only specific aspects of cyberbullying (eg, text messaging), have included a rather limited number of subjects, are not based on population-based samples, include only general questions about whether the student had been bullied (eg, by e-mails), or have been carried out as just one part of a larger research program. To our knowledge, no previous population-based study has examined associations between psychosocial, psychiatric, or psychosomatic problems and being a cyberbully or cybervictim. However, numerous cross-sectional and some longitudinal studies show associations between traditional bullying and victimization and psychiatric, psychosomatic, and physical health problems.9-16 The results of the Finnish 1981 birth cohort study show that frequent traditional bullying at age 8 years is associated with suicidality, psychiatric hospital treatment, psychopharmacological treatment, psychiatric disorders, and crime in late adolescence and early adulthood.17-22 Therefore, based on the findings from the studies on traditional bullying, it can be hypothesized that both cyberbullying and cybervictimization are associated with a wide range of psychiatric and psychosomatic problems. Furthermore, our hypothesis based on findings from studies examining traditional bullying is that those who are both bullies and victims, ie, cyberbully-victims, are at particular risk for psychiatric problems. The aims of this study are the following: (1) to report the rates of cyberbullying and describe characteristics of being victimized by cyberbullying, and (2) to study crosssectional associations between cyberbully, cybervictim, and cyberbully-victim status and a large number of possible associated factors based on previous studies on traditional bullying (age, sex, psychiatric symptoms, general functioning level, psychosomatic symptoms, substance use, traditional bullying and victimization, and school variables).
study population (a total of 2438 pupils) consisted of all children attending the seventh grade (age range, 13-14 years) and the ninth grade (age range, 15-16 years) in those cities, with the exception of children attending classes for the physically or mentally disabled. The study design was approved by the school authorities and the questionnaires were distributed to the children through their teachers. The pupils completed the questionnaires anonymously during a school lesson and placed them in a sealed envelope. Each teacher collected the sealed envelopes, placed them in a larger envelope, sealed the envelope in front of the pupils, and sent it to the researchers. Altogether, 2215 questionnaires (90.9% of the study population) were included in the statistical analysis and 223 questionnaires either were not returned (the pupils were absent on the day the questionnaires were distributed or did not complete the questionnaires) or were discarded because they were incompletely or inappropriately completed. The respondents included in the analysis were equally distributed between the sexes (50.0% girls and 50.0% boys) and the grades (51.6% seventh graders and 48.4% ninth graders). The mean (SD) ages were 14.4 (1.1) years for the boys, 14.4 (1.1) years for the girls, 13.4 (0.6) years for the seventh graders, and 15.4 (0.5) years for the ninth graders.
MEASURES OF CYBERBULLYING
METHODS
The children were asked to answer the questions according to their own situation at that moment or during the past 6 months. In the questionnaire based on previous work by Hinduja and Patchin,23 the definition of cyberbullying was as follows: “cyberbullying is when someone repeatedly makes fun of another person online or repeatedly picks on another person through e-mail or text messages or when someone posts something online about another person that they don’t like.”23 Two general questions about cyberbullying were asked: (1) during the past 6 months, how often have you been cyberbullied?, and (2) during the past 6 months, how often have you cyberbullied others? (with answers of 1 indicating never; 2, less than once a week; 3, more than once a week; or 4, almost every day; answers 2, 3, and 4 referred to bullying or being victimized at least sometimes). On the basis of these 2 questions, the sample was divided into 4 groups: (1) never a cyberbully or cybervictim; (2) cybervictim-only group (at least sometimes a cybervictim but never a cyberbully); (3) cyberbully-only group (at least sometimes a cyberbully but never a cybervictim); and (4) cyberbully-victim group (at least sometimes both a cybervictim and a cyberbully). Other questions about cyberbullying included the following. (1) How often have you been cyberbullied in these ways: ignored, disrespected, called names, had rumors spread by others, threatened by others, e-mail bombed, picked on by others, or ridiculed (altogether 8 questions)? (2) What was the location of cyberbullying: a virtual chat room, instant messaging service, e-mail, text message on a mobile telephone, discussion group, or chat room (each of the 6 questions included specific examples of the locations)? (3) By whom have you been bullied: girls, boys, adult women, adult men, persons unknown to you, or a group (altogether 6 questions)? (4) Have you been scared for your safety because of threats directed at you? Each of the 21 questions included answers of 1 indicating never; 2, less than once a week; 3, more than once a week; or 4, almost every day.
STUDY SAMPLE AND PROCEDURE
EXPLANATORY VARIABLES
The study was carried out in March and April 2008 in Finland (total population 5.3 million) in the cities of Salo (total population 25 825), situated in southern Finland, and Rovaniemi (total population 58 964), situated in northern Finland. The
In addition to the demographic variables, the questionnaire included data about the student’s general health and psychopathology, psychosomatic symptoms, traditional bullying behavior, substance use, and school environment.
(REPRINTED) ARCH GEN PSYCHIATRY/ VOL 67 (NO. 7), JULY 2010 721
WWW.ARCHGENPSYCHIATRY.COM
©2010 American Medical Association. All rights reserved. Downloaded From: http://archpsyc.jamanetwork.com/ on 01/25/2013
Demographic Variables Demographic variables included information about sex, age, grade, family composition (living in a family with both biological parents vs other family composition, eg, single, remarried, adoptive parents, grandparents, foster care), and ethnic background (being of Finnish origin or not).
General Health and Psychopathology Physical health was queried with the question, “Do you have an illness, disability, or other health-related problem?” The items mentioned in this connection were asthma, epilepsy, allergy, diabetes, and atopic eczema, with answers of no and yes as well as an answer option of “other, please specify.” For the statistical analysis, the item was dichotomized into having vs not having any illness, disability, or other health-related problem. Psychopathology was screened using the Strengths and Difficulties Questionnaire (SDQ), a self-report version of a screening instrument that can be administered to children and adolescents aged 11 to 16 years and has been shown to discriminate community and clinic samples satisfactorily.24-26 The SDQ has been validated in Finland.26 The SDQ consists of 25 items concerning both positive and negative behavioral traits. The items are divided into 5 scales: the hyperactivity-inattention scale, the emotional symptoms scale, the conduct problem scale, the peer problem scale, and the prosocial behavior scale (giving a score for positive prosocial behavior). Each scale consists of 5 items. The answers are scored 0 for not true, 1 for somewhat true, and 2 for certainly true, except for 5 items that are worded positively and thus have the answers scored in the opposite direction. The score for each scale ranges from 0 to 10 and the total difficulty score ranges from 0 to 40; the prosocial scale is not included in the total difficulty score. Based on the Finnish standardization, 90th-percentile cutoff points were used.26 The questionnaire also included the question, “Overall, do you think you have difficulties in any of the following areas: emotions, concentration, behavior, or getting along with other people?” The answers were 1 indicating no; 2, yes, minor difficulties; 3, yes, definite difficulties; and 4, yes, severe difficulties. For the statistical analysis, answers 3 and 4 were pooled together.
Psychosomatic Symptoms and Sleep Problems Headache was queried with the question, “During the past 6 months, have you experienced distracting headaches?” The answers were 1 indicating at least once a week; 2, at least once a month; 3, less frequently; and 4, hardly ever. For the statistical analysis, answers 3 and 4 were pooled together. Abdominal pain was queried with the question, “During the past 6 months, have you experienced recurring abdominal pain?” The answers were 1 indicating at least once a week; 2, at least once a month; 3, less frequently; and 4, hardly ever. For the statistical analysis, answers 3 and 4 were pooled together. Sleep problems were queried with the question, “During the past 6 months, have you experienced problems with falling asleep or sleeping?” The answers were 1 indicating every night or almost every night; 2, 3 to 5 times a week; 3, once or twice a week; 4, less than once a week; and 5, never or less frequently than once a month. For the statistical analysis, answers 1 and 2 as well as answers 4 and 5 were pooled together. Thus, all of these variables had 3 answer categories.
3, once a week or more. Smoking was queried with the question, “How often do you smoke cigarettes?” The answers were 1 indicating never; 2, rarely; 3, weekly; and 4, daily. For the statistical analysis, answers 3 and 4 were pooled together.
Information About Traditional Bullying In the questionnaire, the definition of traditional bullying (not including cyberbullying) was as follows: “A student is being bullied when he or she is exposed repeatedly over time to negative and hurtful actions on the part of 1 or more students. It is difficult for the student being bullied to defend himself or herself. Bullying may take place frequently or infrequently. Bullying can be verbal (eg, name-calling, threats), physical (eg, hitting), or psychological (eg, rumors, shunning/exclusion). It is bullying when someone is teasing repeatedly in a mean or hurtful way.” Information about traditional bullying was queried with the questions, “How often have you been bullied at school during the past 6 months?,” “How often have you been bullied outside school during the past 6 months?,” “How often have you been bullying others at school during the past 6 months?,” and “How often have you been bullying others outside school during the past 6 months?” The 2 questions about both victimization and bullying were pooled together. The answers for all of these questions were 1 indicating never; 2, less than once a week; 3, more than once a week; and 4, almost every day. Answers 2, 3, and 4 referred to being bullied or victimized at least sometimes. The sample was categorized into 4 groups: (1) never a bully or a victim; (2) victim-only group (at least sometimes a victim but never a bully); (3) bully-only group (at least sometimes a bully but never a victim); and (4) bully-victim group (at least sometimes both a victim and a bully). In our previous studies, these categories predicted later suicidality and other psychiatric outcomes in late adolescence and early adulthood.17-22
School Environment Two statements were proposed about how the school environment was experienced: “I feel safe at school” and “I feel that the teachers at my school care about me.” The answers were 1 indicating almost never; 2, sometimes; 3, often; and 4, almost always. For the statistical analysis, answers 1 and 2 as well as answers 3 and 4 were pooled together.
STATISTICAL ANALYSES The statistical significance of risk factors on outcome variables was tested with logistic regression analysis. Odds ratios (ORs) and 95% confidence intervals (CIs) were estimated using logistic regression. The logistic regression of the categorical outcomes for cyberbully groups (never, cybervictim only, cyberbully only, cyberbully-victim) was carried out by applying multinomial logistic regression analysis. The multinomial logistic regression analysis for a polychotomous response variable is a generalization of the method of logistic regression analysis for a dichotomous response variable.27 All analyses were adjusted for the effect of sex unless specified otherwise. Statistical computations were performed with SAS version 9.1 statistical software for Windows (SAS Institute, Inc, Cary, North Carolina). RESULTS
Substance Use Alcohol consumption to get drunk was queried with the question, “How often do you use enough alcohol to get drunk?” The answers were 1 indicating never; 2, once a month or more; and
PREVALENCE OF CYBERBULLYING In the total sample, 4.8% were cybervictims only, 7.4% were cyberbullies only, and 5.4% were cyberbully-victims. The
(REPRINTED) ARCH GEN PSYCHIATRY/ VOL 67 (NO. 7), JULY 2010 722
WWW.ARCHGENPSYCHIATRY.COM
©2010 American Medical Association. All rights reserved. Downloaded From: http://archpsyc.jamanetwork.com/ on 01/25/2013
Table 1. Associations Between Traditional Bullying Behavior and Cyberbully Groups a Boys
Total, No.
Behavior How often have you been bullied in the past 6 mo? Not at all Less than once a week More than once a week How often have you bullied others in the past 6 mo? Not at all Less than once a week More than once a week Bully-victim groups No Victim only
Girls
Cybervictim Only (n=37)
Cyberbully Only (n=97)
Cyberbully-victim (n=61)
Cybervictim Only (n=65)
Cyberbully Only (n=60)
Cyberbully-victim (n=50)
%
%
%
%
%
%
689 262
1.3 5.7
91
14.3
626 322
3.4 3.7
93
4.3
475 151
1.3 9.9
Bully only
213
1.4
Bully-victim
202
6.4
OR (95% CI)
4.8 (2.1-11.1) b 15.1 (6.2-36.9) b
1.3 (0.6-2.7) 2.3 (0.7-6.9)
8.8 (3.4-23.3) b 1.5 (0.4-5.9) 6.8 (2.5-18.3) b
9.6 9.9 5.5
4.3 14.9 23.7
4.2 4.6 21.6 11.9
OR (95% CI)
1.1 (0.7-1.8) 0.8 (0.3-2.0)
4.1 (2.5-6.8) b 9.7 (5.1-18.3) b
1.2 (0.5-3.0) 6.7 (3.8-11.6) b 3.8 (2.0-7.1) b
4.1 6.1 18.7
3.2 6.5 21.5
3.0 4.0 6.6 13.4
Total, OR (95% CI) No.
1.6 (0.9-3.1) 6.4 (3.3-12.3) b
2.4 (1.3-4.6) c 11.9 (6.0-23.6) b
1.5 (0.6-4.0) 2.9 (1.4-6.2) c 6.1 (3.1-11.9) b
738 254
1.9 13.8
85
17.7
795 226
6.5 4.9
56
1.8
595 200
2.0 20.0
143
1.4
139
7.2
OR (95% CI)
9.3 (4.9-17.7) b 13.8 (6.3-30.2) b
0.96 (0.5-1.9) 0.5 (0.1-4.0)
12.8 (6.6 25.1) b 0.9 (0.2-4.3) 5.7 (2.4-13.5) b
5.2 6.3 7.1
OR (95% CI)
1.6 (0.9-2.9) 2.0 (0.8-5.0)
2.0 9.1 14.1
OR (95% CI)
5.7 (2.9-11.2) b 10.3 (4.6-23.2) b
1.3 15.5
1.9 15.8 9.3 6.3 (7.7-32.6) b (3.2-12.5) b 26.8 41.4 25.0 25.7 (17.0-101) b (11.3-58.9) b 1.0 2.0
1.2 2.6 4.0 4.4 (0.7-9.2) (1.6-12.3) c 22.4 30.1 5.6 6.5 (12.3,73.8) b (2.3-18.2) b 13.0 20.4 19.4 26.2 (7.9-52.7) b (11.1-62.0) b
Abbreviations: CI, confidence interval; OR, odds ratio. a Results of logistic regression analyses. The overall 2 P value for sex difference was ⬍.001. Because sex⫻traditional bully-victim interactions for cyberbullying were significant, all analyses were done separately for boys and girls. b P⬍.001. c P⬍.01.
female and male prevalences were 6.0% and 3.5%, respectively, for being a cybervictim only, 5.6% and 9.3%, respectively, for being a cyberbully only, and 4.6% and 5.8%, respectively, for being a cyberbully-victim.
cates that some of the girls who are traditionally victimized tend to be both cyberbullies and cybervictims.
TRADITIONAL BULLYING AND CYBERBULLYING
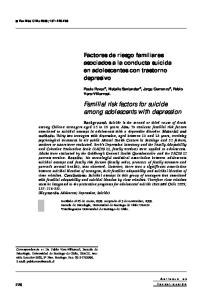
Table 2 shows the methods, locations, and perpetrators of cybervictimization. The most common locations were computer instant messages (18.0%) and discussion groups (13.8%). Both girls and boys reported being cyberbullied most frequently by their peers of the same age. However, 16.0% of girls reported being bullied by their opposite-sex peers, compared with only 5.0% of boys. In the total sample, 2.3% had been bullied by a samesex adult, 3.1% by an opposite-sex adult, 10.0% by an unknown person, and 5.1% by a group of people. In almost all of the variables, there was a significant sex difference, indicating that girls report higher prevalences of specific locations and methods of cybervictimization. Figure, A, shows the 10 most common cybervictim response profiles of how cybervictims were bullied. Namecalling only and being the target of rumors only were the most common response profiles among both sexes. Similarly, based on cybervictim response profiles, cybervictimization took usually place only in 1 or 2 sites (Figure, B). Finally, the most common cybervictim response profiles regarding who the perpetrator was usually included only 1 or 2 types of perpetrators (Figure, C). Being victimized by same-sex peers only was the most common response profile, while the second most common
Among both girls and boys, the 6-month prevalences of traditional bullying (31.5% and 33.8%, respectively; in the total sample, 33.0%) and traditional victimization (26.1% and 40.1%, respectively; in the total sample, 33.2%) were much higher than the prevalences of cyberbullying and cybervictimization. In the total sample, the sex⫻traditional bullying (P = .01) and sex ⫻ traditional bully-victim status (P=.03) interactions were significant for the cyberbully-victim status. Therefore, analyses of associations between traditional bully-victim status and cyberbullyvictim status were performed separately for boys and girls. As shown in Table 1, traditional victimization was associated with cybervictimization, while traditional bullying was associated with cyberbullying. The association was stronger among those who were traditionally bullied or were victimized frequently. Traditional bully-victim status was associated with cyberbully, cybervictim, and cyberbully-victim statuses in both sexes. Of girls who were traditional bully-victims, 39.6% were cyberbullies or cybervictims, while the respective figure for boys was 31.7%. Among girls but not boys, traditional victim-only status was associated with cyberbully-victim status. This indi-
METHODS OF CYBERBULLYING
(REPRINTED) ARCH GEN PSYCHIATRY/ VOL 67 (NO. 7), JULY 2010 723
WWW.ARCHGENPSYCHIATRY.COM
©2010 American Medical Association. All rights reserved. Downloaded From: http://archpsyc.jamanetwork.com/ on 01/25/2013
Table 2. Characteristics of Methods, Location, and Perpetrators Among Cybervictims Yes Answer Characteristic How often have you been cyberbullied in these ways? Ignored by others Disrespected by others Called names by others Had rumors spread by others Threatened by others E-mail bombed by others Picked on by others Ridiculed Scared for safety What was the location of cyberbullying? Virtual chat room (eg, Habbo Hotel) Instant messaging service E-mail Text message on mobile telephone Discussion group, eg, IRC-Galleria, Suomi24, MySpace Chat room, eg, IRC, Suomi24 Other By whom have you been bullied? Same-sex peer Opposite-sex peer Same-sex adult Opposite-sex adult Unknown person, not sure of sex or age Group, eg, group of friends, school class
Total, No.
Total Sample, % (n = 2215)
Boys, % (n = 1093)
Girls, % (n = 1094)
2 P Value
2136 2137 2136 2134 2135 2136 2135 2135 2135
7.6 10.4 17.7 13.8 6.9 8.5 13.3 9.7 4.2
4.9 7.9 16.0 10.4 8.3 7.7 12.8 8.9 4.3
9.9 12.5 18.7 16.8 5.1 8.8 13.7 10.0 3.9
⬍.001 ⬍.001 .10 ⬍.001 .003 .32 .54 .42 .65
2089 2095 2088 2093 2098 2083 1530
3.7 18.0 2.6 8.2 13.8 5.6 3.7
3.6 12.6 2.5 5.7 8.8 5.0 4.7
3.6 23.0 2.2 10.3 18.3 5.7 2.4
.95 ⬍.001 .63 ⬍.001 ⬍.001 .47 .02
2065 2063 2044 2047 2052 2044
20.1 10.5 2.3 3.1 10.0 5.1
16.4 5.0 2.6 2.1 8.9 5.0
23.7 16.0 2.1 4.0 10.7 4.9
⬍.001 ⬍.001 .46 .01 .16 .90
response profile was being bullied by both same-sex and opposite-sex peers. Opposite-sex victimization alone or in combination with other types of perpetrators was significantly more common among girls. FEAR FOR SAFETY AND CYBERBULLYING Of those who identified themselves as cybervictims, 22.8% reported that they had been scared for their safety, indicating possible trauma. The association between perpetrators and reports of feeling unsafe was studied among those who reported being cybervictims. As shown in Table 3, after adjustment with the effect of sex, grade, family structure, city, and ethnicity, being cyberbullied by a same-sex or opposite-sex peer was not associated with feeling unsafe after cybervictimization. However, being cyberbullied by a same-sex or opposite-sex adult, by an unknown person, and by a group of people were associated with being scared for their safety. Of those who had been cyberbullied by an adult, an unknown person, or a group, 30.6% to 46.2% reported being scared for their safety. RISK FACTORS ASSOCIATED WITH CYBERBULLY STATUS Table 4 shows the associations between psychosocial risk factors and cyberbully status when adjusted for the effect of sex, grade, family structure, city, and ethnicity. No significant sex interactions were found. Generally, a higher level of difficulties or symptoms had a stronger association with cyberbully status. School grade and belonging to an ethnic minority were not associated with any of the outcomes.
An additional model of explanatory variables included all SDQ scales controlled for sex and grade. Cyberbully-only and cyberbully-victim statuses were independently predicted by conduct (OR = 2.6; 95% CI, 1.5-4.5; P⬍.001; and OR=2.3; 95% CI, 1.2-4.4; P⬍.001, respectively) and hyperactivity problems (OR=2.4; 95% CI, 1.4-3.9; P ⬍ .001; and OR = 2.7; 95% CI, 1.6-4.7; P⬍.001, respectively). Furthermore, cyberbully-only status was predicted by prosocial problems (OR=2.3; 95% CI, 1.5-3.4; P⬍.001). Cybervictim-only and cyberbullyvictim statuses were predicted by emotional problems (OR=2.2; 95% CI, 1.2-3.9; P=.007; and OR=2.1; 95% CI, 1.1-3.6; P=.02, respectively) and peer problems (OR=4.8; 95% CI, 2.9-7.7; P⬍.001; and OR=1.8; 95% CI, 1.053.2; P=.03, respectively). When the SDQ scales were studied as linear variables, the results remained the same. COMMENT
To our knowledge, this study is the first population study examining psychosocial and psychiatric risk factors associated with cyberbullying among adolescents. The results have implications for public awareness, policy makers, educators, parents, and clinicians working in adolescent health services. Furthermore, the results have implications when planning antibullying programs and setting guidelines for misuse of mobile telephones and the Internet. The results show that about 7.4% of adolescents have cyberbullied others but have not been targets of cyberaggression, while 4.8% have been targets only and another 5.4% have been both cyberbullies and cybervictims. These
(REPRINTED) ARCH GEN PSYCHIATRY/ VOL 67 (NO. 7), JULY 2010 724
WWW.ARCHGENPSYCHIATRY.COM
©2010 American Medical Association. All rights reserved. Downloaded From: http://archpsyc.jamanetwork.com/ on 01/25/2013
70
A
Girls
Pupils, No.
60
Table 3. Association Between Perpetrator and Being Scared About Safety Among Cybervictims a
Boys
50 40
Been Scared for One’s Safety
30 20
By whom have you been bullied?
10 0
Ignored by others Disrespected by others Called names by others Rumors spread by others Threatened by others E-mail bombed by others Picked on by others Ridiculed Scared for safety P value (binomial test, exact)
Pupils, No.
B
Pupils, No.
– – – + – – – – –
+ – – – – – – – – .004
– – – – – – – + –
– – – – – + – – –
– – + + – – – – – .01
80 70 60 50 40 30 20 10 0
Virtual chat room Instant messaging service E-mail Text message of mobile telephone Discussion group Chat room Other P value (binomial test, exact) C
– – + – – – – – –
– – + – – – + – –
Girls
– + – –
– – – –
– + – –
– + + – – – – – – .02 .004
+ – – – – –
+ + – – – –