0021-972X/04/$15.00/0 Printed in U.S.A.
The Journal of Clinical Endocrinology & Metabolism 89(3):1267–1272 Copyright © 2004 by The Endocrine Society doi: 10.1210/jc.2003-031239
Determinants of Insulin Sensitivity and Secretion in Very-Low-Birth-Weight Children ´ LICA ALEGRÍA, ENRICA PITTALUGA, ALEJANDRA A ´ VILA, RODRIGO A. BAZAES, ANGE ´ N I´N ˜ IGUEZ, AND VERO ´ NICA MERICQ GERMA Institute of Maternal and Child Research (R.A.B., A.Av., G.I., V.M.), Faculty of Medicine, University of Chile, Santiago 8360160, Chile; and Neonatology Unit (A.Al., E.P.), So´tero del Rı´o Hospital, Santiago 8207257, Chile In prepubertal children, low birth weight is related to reduced insulin sensitivity, particularly if a history of rapid postnatal weight gain is present. We sought to determine whether these associations were also evident in premature, very-low-birthweight (VLBW) children. We studied 60 VLBW prepubertal children aged 5–7 yr (mean age 5.7 ⴞ 0.7 yr). Birth weights ranged from 690 to 1500 g (mean 1195 ⴞ 31 g), with gestational ages between 25 and 34 wk (median 29 wk). A short iv glucose tolerance test was carried out to assess fasting insulin sensitivity and glucose-stimulated insulin secretion. The effects of current body mass index, birth weight (SD scores), postnatal growth rates, and indicators of postnatal morbidity were evaluated by analysis of covariance. Twenty children were born small for gestational age, and 40 were appropriate for gestational age. Ninety-eight percent of
L
OW BIRTH WEIGHT (LBW) is associated with an increased risk for a number of conditions arising in adulthood, such as type 2 diabetes and cardiovascular disease (1, 2). Moreover, it has been recognized that reduced insulin sensitivity, a hallmark in most LBW-related conditions, may be present as early as the first year of life (3–9). It has been proposed that a reduced insulin sensitivity in LBW subjects results from the adaptation to adverse in utero conditions during a critical period of development (2). In this model, birth weight is assumed to be a proxy for the prenatal environment. However, it is well known that LBW newborns are also exposed to stressful conditions postnatally, which are reflected in higher neonatal morbidity and mortality (10, 11). This has led to the hypothesis that postnatal morbidity may as well contribute to the metabolic modifications observed in LBW children, independently of the adequacy of their birth weight to gestational age. Additional concerns have been raised since in frequently cited studies, based on historical cohorts, either LBW was assessed regardless of gestational age or preterm infants were excluded (1, 12, 13). If early postnatal morbidity is Abbreviations: AGA, Appropriate for gestational age; AUC, area under the curve; BMI, body mass index; CUG, catch-up growth; HOMAIR, homeostasis model assessment insulin resistance index; IGFBP-1, IGF binding protein-1; IUGR, intrauterine growth retardation; LBW, low birth weight; SDS, sd scores; SGA, small for gestational age; sIVGTT, short iv glucose tolerance test; VLBW, very low birth weight. JCEM is published monthly by The Endocrine Society (http://www. endo-society.org), the foremost professional society serving the endocrine community.
them had attained a height within target range. Children who were small for gestational age had lower insulin sensitivity than children who were appropriate for gestational age (homeostasis model assessment insulin resistance index 1.24 ⴞ 0.17 vs. 0.94 ⴞ 0.08, P < 0.05). Moreover, birth weight SD scores correlated significantly with homeostasis model assessment insulin resistance index (r ⴝ ⴚ0.326, P ⴝ 0.01). This effect persisted after adjustment for current body mass index, gestational age, and perinatal morbidity. In addition, fasting and postload insulin secretion during the short iv glucose tolerance test correlated significantly with early postnatal growth rates, independently of birth weight SD scores. Our findings in a cohort of VLBW prepubertal children indicate that growth in utero as well as postnatal growth rates are independent determinants of subsequent insulin sensitivity and secretion. (J Clin Endocrinol Metab 89: 1267–1272, 2004)
relevant in conditioning long-term metabolic changes, prematurity may be an important confounding factor (10, 11). So far, an effect of LBW independent of gestational age remains to be clearly dissected. In this study, our first aim was to determine whether intrauterine growth retardation (IUGR) and postnatal morbidity are independent determinants of insulin sensitivity in prepubertal children. We have taken advantage of a contemporary cohort of very-low-birth-weight (VLBW) children born prematurely, who have been closely followed up from birth up to 7 yr of age. Additionally, it has been suggested that the metabolic consequences of LBW may be mediated by an accelerated rate of postnatal growth [catch-up growth, CUG)] (14), which allows up to 90% of small-for-gestational-age (SGA) infants to reach their target height. Recently we have shown in a prospective cohort of SGA infants born at full term that fasting and postload plasma insulin levels are directly related to the extent of centile-crossing in weight and height during the first year of life (7). Our second aim, therefore, was to determine whether these correlations hold true for children born prematurely. Owing to periodic anthropometric measurements, our cohort is particularly suitable for the study of early postnatal growth rates and their relationship with metabolic changes later in life. Subjects and Methods Subjects Subjects participating in this study were recruited from a follow-up clinic for VLBW children at Hospital Dr. So´tero del Rı´o in Santiago,
1267
The Endocrine Society. Downloaded from press.endocrine.org by [${individualUser.displayName}] on 22 January 2017. at 17:29 For personal use only. No other uses without permission. . All rights reserved.
1268
J Clin Endocrinol Metab, March 2004, 89(3):1267–1272
Chile. Between 1994 and 1996, a total of 371 children weighing less than 1500 g were born at this hospital, all of them coming from medium- to low-income families. At the expected date of delivery (corrected age ⫽ 0), 240 surviving infants were enrolled in this follow-up clinic. They were assessed monthly up to 1 yr of corrected age, every 3 months up to age 2 yr, and every 6 months thereafter. At age 5–7 yr, a total of 118 children still attending the follow-up clinic were invited to participate in this study. Sixty children (31 boys and 29 girls) with a mean age of 5.7 ⫾ 0.7 yr (range 4.7 to 7.4 yr) were enrolled. None of them displayed signs of pubarche or pubertal development. Written consent was obtained from all parents, and protocols and consent forms were approved by the institutional review board at Hospital Dr. So´ tero del Rı´o. All children in this study were delivered prematurely (median gestational age 29 wk, range 25–34 wk) and weighed less than 1500 g (mean weight 1195 ⫾ 236 g, range 690-1500 g). Three twin-pairs were included, with all the remaining subjects born from singleton pregnancies. Exclusion of twins from the analyses did not alter the results significantly. Twenty (33.3%) children were born SGA (birth weight ⬍10th percentile) and 40 (66.7%) were appropriate for gestational age (AGA) according to local normative criteria (15). Birth weight [in sd scores (SDS)] and current body mass index (BMI, in SDS) of participating children were not different from those of children not enrolled in this study. Weekly anthropometric measurements, as well as clinical data related to morbidity and therapies received during the neonatal period, were obtained from records kept in the clinic’s database. Feeding practices during the first weeks of postnatal life have been described elsewhere (16).
Assessment of insulin sensitivity and secretion A short iv glucose tolerance test (sIVGTT) was subsequently carried out after an overnight fast (mean duration of fast: 9 h). Two venous accesses were established in contralateral antecubital veins. Glucose (25% dextrose solution) was administered at a 0.5 g/kg (maximum 35 g) dose by continuous infusion over 3 min. Blood samples were obtained at ⫺5, 0, 1, 3, 5, and 10 min (where t ⫽ 0 is the start of glucose infusion) for determination of glucose and insulin levels. Glucose was measured immediately, whereas samples for insulin were kept on ice, centrifuged within 30 min, and sera frozen at ⫺20 C. In the ⫺5-min sample, Cpeptide, cholesterol, triglycerides, leptin, SHBG, and IGF binding protein-1 (IGFBP-1) levels were also measured.
Assays Blood glucose concentration was determined using a commercial glucometer (Accutrend Sensor Comfort, Roche Diagnostic Inc., Basel, Switzerland), which yields values 8 ⫾ 5% (mean ⫾ sd) higher than standard enzymatic methods with a correlation coefficient of 0.987 for glucose concentrations between 2.2 and 8 mmol/liter. Serum insulin was measured using a commercial RIA from Diagnostic Systems Laboratories (DSL, Webster, TX). This assay has a crossreactivity of 27.5% with proinsulin and 25% with insulin-32, 33. The sensitivity of this assay is 5.6 pmol/liter. Plasma lipids were measured using routine clinical laboratory methods. Serum C-peptide levels were determined by RIA, using kits supplied by Diagnostic Products Corp. (Los Angeles, CA). Serum IGFBP-1 and SHBG were measured by immunoradiometric assays from DSL. Intraassay coefficients of variation were 3.8% for insulin, 4.1% for Cpeptide, 3.5% for IGFBP-1, and 3.1% for SHBG. Interassay coefficients of variation were 4.7% for insulin, 5.6% for C-peptide, 4.2% for IGFBP-1, and 5.4% for SHBG.
Analysis of insulin sensitivity and secretion Insulin sensitivity was estimated using basal insulin levels, which have been shown to be reliable in nondiabetic children (17). In addition, the homeostasis model assessment insulin resistance index (HOMA-IR) was calculated using the HOMA-CIGMA Calculator program version 2.00 (Diabetes Research Laboratories, Oxford, UK). Because blood glucose levels were within the normal range in all children, using either the HOMA IR index or fasting insulin levels yielded equivalent results. Insulin secretion during the sIVGTT is expressed as the incremental
Bazaes et al. • Insulin Sensitivity in VLBW Children
insulin area under the curve (AUC, calculated using the trapezoidal rule) (18).
Calculations and statistical analysis Weight and length at birth were converted into SDS to adjust for gestational age using local normative data (15), developed recently in a population of premature infants. These standards were constructed using strict criteria to exclude all those cases in which a condition related to IUGR was present. Thereafter, SDS for weight and length were based on the National Center for Health Statistics (NCHS) growth curves, using corrected age (age ⫽ 0 at the expected date of delivery) for calculations. These growth curves have been found to be applicable to Chilean children (19). Midparental height was based on self-reported statures. BMI (SDS, according to NCHS curves) was used as an estimate of adiposity. CUG during the first 2 yr of postnatal life was initially evaluated as the change in weight SDS between birth and corrected ages 0, 12, and 24 months (20). However, early changes in weight correlated strongly with birth weight SDS (see Results). Because a separate evaluation of the effects of birth weight and early CUG on insulin sensitivity and secretion was desirable, a complementary approach was used. For each child, postnatal age (to avoid the weight loss observed in VLBW infants in the first 2 wk after birth) was plotted against time. The resulting curve was fitted to a fifth-order polynomial model, yielding r2 values higher than 0.990. The first derivative of this model was used to calculate instant growth rates (expressed as grams per day) at postnatal ages 3, 4, 6, and 8 wk. Results are shown as mean ⫾ sem. Basal insulin, HOMA IR, and insulin AUC values were normalized by log transformation to use parametric statistics. Differences between groups were assessed by ANOVA except for variables showing extremely skewed distributions (i.e. days of hospitalization, oxygen support, mechanical ventilation, and parenteral nutrition), in which Mann-Whitney U was used. Pearson’s correlation coefficients were obtained to evaluate the relationship between quantitative variables. Furthermore, general linear models were developed to estimate the contribution of different confounding parameters on insulin sensitivity and secretion. Independent variables included birth weight SDS and current BMI SDS (as continuous variables) as well as several indicators of perinatal morbidity, such as prenatal corticoid use, pregnancy hypertension, gestational diabetes, premature rupture of membranes, gestational age at birth, postnatal sepsis, intraventricular hemorrhage and length of postpartum hospitalization, oxygen support, and parenteral nutrition. Special care was taken not to include colinear independent variables in a single model. All statistics were run on SPSS 10.0 for Windows (SPSS Inc., Chicago, IL).
Results Perinatal data
In this cohort of 60 VLBW children, 20 were born SGA and 40 were AGA (Table 1). Mean absolute birth weights were similar in both groups, with shorter gestational ages in AGA children (Table 1). As expected, hypertension was more prevalent in SGA pregnancies, whereas premature rupture of membranes tended to be more frequently associated with AGA deliveries (Table 1). Prenatal use of corticoids, however, was similar in both groups. Data on pre- and postnatal morbidity are shown in Table 1. After birth, SGA and AGA infants were admitted in the neonatal unit for similar periods of time until a target weight of approximately 2 kg was reached. AGA infants, who were more premature, displayed a trend toward higher requirements for mechanical ventilation and parenteral nutrition than SGA infants (Table 1). The same tendency was observed for the age at start of exclusive enteral feeding and requirements for oxygen supplementation (not shown).
The Endocrine Society. Downloaded from press.endocrine.org by [${individualUser.displayName}] on 22 January 2017. at 17:29 For personal use only. No other uses without permission. . All rights reserved.
Bazaes et al. • Insulin Sensitivity in VLBW Children
J Clin Endocrinol Metab, March 2004, 89(3):1267–1272 1269
TABLE 1. Clinical and anthropometric data at birth
Prenatal history Midparental height (SDS) Parity Pregnancy hypertension (%) Gestational diabetes (%) Premature rupture of membranes (%) Prenatal corticoid use (%) Cesarean section (%) At birth Birth weight (g) Birth weight (SDS) Ponderal index (g/cm3) Gestational age (wk) Apgar ⬍3 at 5 min (%) Postnatal Duration of hospitalization (d) Mechanical ventilation (%) Mechanical ventilation (d) Parenteral nutrition (%) Parenteral nutrition (d) Data are shown as either mean ⫾
SEM
SGA (n ⫽ 20)
AGA (n ⫽ 40)
⫺1.13 ⫾ 0.25 2 (1–5) 75.0 10.0 10.0 80.0 79.4
⫺0.91 ⫾ 0.18 2 (1–5) 43.8 0 25.0 67.6 93.8
n.s. n.s. ⬍0.05 n.s. n.s. n.s. n.s.
1153 ⫾ 60 ⫺2.28 ⫾ 0.15 2.17 ⫾ 0.06 31.1 ⫾ 0.6 0
1207 ⫾ 36 ⫺0.24 ⫾ 0.13 2.39 ⫾ 0.11 28.3 ⫾ 0.3 0
n.s. ⬍0.001 n.s. ⬍0.001
50.8 ⫾ 4.9 31.6 10.3 ⫾ 4.1 52.6 12.0 ⫾ 2.5
62.5 ⫾ 5.8 44.7 14.2 ⫾ 5.7 73.0 10.9 ⫾ 0.8
n.s. n.s. n.s. n.s. n.s.
P
or median (range). n.s., Not significant.
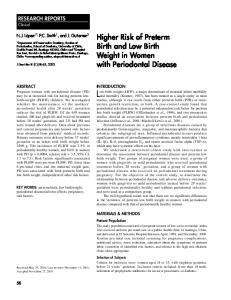
FIG. 1. Postnatal growth patterns in SGA (n ⫽ 20) and AGA (n ⫽ 40) VLBW children. A, Weight (SDS, adjusted for age and sex) at birth and at corrected ages 0, 12, and 24 months. B, Length (SDS, adjusted for age and sex) at birth and at corrected ages 0, 12, and 24 months. Data are shown as mean ⫾ SEM. *, P ⬍ 0.05; **, P ⬍ 0.01; ***, P ⬍ 0.001.
Postnatal growth
At recruitment (mean age 5.7 ⫾ 0.7 yr; range 4.7–7.4 yr), five children (8.3%) had a height below ⫺1 sd for age and gender. However, only one of them had failed to reach a stature within the target height range (defined as ⫾ 0.5 sd from midparental height). As shown in Fig. 1, most of the height deficit present at corrected age 0 in both SGA and AGA children was compensated before 12 months of corrected age. The most rapid gain in weight SDS was observed between birth and the expected date of delivery (Fig. 1). During this period, SGA children gained weight at 0.119 ⫾ 0.028 SDS/ wk, whereas AGA children gained only 0.002 ⫾ 0.016 SDS/wk (P ⬍ 0.001). Moreover, this early weight gain displayed a strong negative correlation with birth weight SDS (r ⫽ ⫺0.498, P ⬍ 0.001), indicating that SGA infants tend to gain weight and then recover at a higher rate. In contrast, instant growth rates calculated during the first 8 wk of postnatal life did not correlate significantly with birth weight SDS (not shown). On the other hand, these instant growth rates were inversely related to indicators of postnatal morbidity (length of hospitalization and requirements for ventilatory support and parenteral nutrition, not shown). Therefore, in-
stant growth rates were used in further analyses as independent indicators of early postnatal growth. At the time of recruitment, BMI SDS was similar in SGA and AGA children, and the same was observed for the proportion of children with BMI greater than 2 SDS in each group (Table 2). BMI SDS at this age correlated significantly with instant growth rates at 3, 4, and 6 wk postnatal age (r ⫽ 0.306, 0.325, and 0.326 respectively, all P ⬍ 0.05). Intravenous glucose tolerance test
During the sIVGTT, girls displayed significantly higher fasting insulin levels than boys (38.1 ⫾ 3.0 pmol/liter vs. 29.0 ⫾ 3.4 pmol/liter, P ⬍ 0.05). There was also a strong correlation between fasting insulin levels and BMI (SDS) (r ⫽ 0.445; P ⬍ 0.001). The gender effect was thus explained by a tendency toward higher BMI in girls (1.23 ⫾ 0.34 SDS vs. 0.54 ⫾ 0.35 SDS); accordingly, these differences in fasting insulin disappeared after adjusting for BMI. Fasting insulin sensitivity was significantly different between AGA and SGA children (Table 3 and Fig. 2). SGA children showed higher basal insulin and C-peptide values than AGA children, despite similar fasting glucose levels, and the same was observed for the HOMA-IR index (Table
The Endocrine Society. Downloaded from press.endocrine.org by [${individualUser.displayName}] on 22 January 2017. at 17:29 For personal use only. No other uses without permission. . All rights reserved.
1270
J Clin Endocrinol Metab, March 2004, 89(3):1267–1272
Bazaes et al. • Insulin Sensitivity in VLBW Children
3 and Fig. 2). When treated as a continuous variable, birth weight SDS correlated inversely with both fasting insulin and HOMA-IR values (r ⫽ ⫺0.318 and ⫺0.326, respectively; both P ⫽ 0.01 after controlling for BMI and sex). Serum IGFBP-1 and SHBG as well as plasma cholesterol and triglyceride levels were not different between SGA and AGA children (Table 3). IGFBP-1 levels correlated negatively with fasting insulin (r ⫽ ⫺0.456, P ⬍ 0.001). To evaluate the possible confounding effect of perinatal morbidity on insulin sensitivity, different general linear models were built, using either fasting insulin or HOMA-IR as dependent variables. Independent variables included in these models were birth weight (SDS), gestational age, and current BMI (SDS) (as continuous variables), and sex as well as a number of indicators of perinatal morbidity (listed in Subjects and Methods). An example is shown in Table 4, with HOMA-IR as the dependent variable: current BMI (SDS) and birth weight (SDS) were the only significant determinants of fasting insulin sensitivity. Nevertheless, BMI explained a higher proportion of the variance in insulin sensitivity than did birth weight, as shown by F values (Table 4). Addition of other indicators of postnatal morbidity to this model yielded similar results (data not shown). HOMA-IR correlated marginally with weight gain (in SDS) between birth and the expected date of delivery (corrected age ⫽ 0; r ⫽ 0.257, P ⫽ 0.05). However, this correlation did not persist after controlling for birth weight SDS or BMI SDS because of their strong colinearity with change in SDS during this period. Remarkably, HOMA-IR also correlated with instant growth rates both 4 and 6 wk after birth (r ⫽ 0.292, P ⬍ 0.05 and r ⫽ 0.332, P ⬍ 0.01, respectively). These correlations persisted after adjusting for birth weight SDS but disappeared after controlling for BMI SDS (not shown). Regarding postload insulin secretion, SGA children displayed a clear tendency toward higher values for insulin AUC, but this effect did not reach statistical significance after adjusting for BMI and sex (Table 3 and Fig. 2). However, TABLE 2. Anthropometric data at first assessment
Chronological age (yr) Height (SDS) BMI (SDS) Obese (%)
SGA (n ⫽ 20)
AGA (n ⫽ 40)
P
5.7 ⫾ 0.8 0.09 ⫾ 0.22 1.01 ⫾ 0.54 26.3
5.7 ⫾ 0.7 0.07 ⫾ 0.11 0.81 ⫾ 0.26 25.0
n.s. n.s. n.s. n.s.
n.s., Not significant.
normalized insulin AUC values did show a negative correlation with birth weight SDS (r ⫽ ⫺0.278, P ⬍ 0.05 adjusted for BMI and sex). In addition, insulin AUC correlated significantly with weight gain (in SDS) between birth and the expected date of delivery (corrected age ⫽ 0) (r ⫽ 0.318, P ⫽ 0.018). This correlation did not persist after controlling for birth weight SDS. Nonetheless, insulin AUC also correlated with instant growth rates both 3 and 4 wk after birth (r ⫽ 0.386 and 0.398, respectively, both P ⬍ 0.01). These correlations persisted after adjusting for birth weight SDS and fasting insulin sensitivity (expressed as HOMA-IR) but not after correcting for current BMI SDS (not shown). Discussion
Data from a number of recent studies suggest that the metabolic consequences of LBW can be identified in prepubertal children. Bavdekar et al. (3) found in a group of 8-yrold children from India that LBW and current obesity interact in determining a reduced sensitivity to insulin. Similar findings have been replicated in populations with different genetic backgrounds and feeding practices (4, 6 –9, 21, 22). In this report, we have been able to extend these associations to premature, VLBW children. Not surprisingly, we found that, when studied at a mean age of 5.7 ⫾ 0.7 yr, adiposity is the main determinant of insulin sensitivity and secretion. However, an independent association with early life events was also identified. Fasting insulin sensitivity correlated significantly with birth weight SDS, a proxy for intrauterine environmental conditions. Remarkably, this was independent of gestational age, perinatal morbidity, and early requirements for ventilatory and nutritional support. Other indicators of hepatic insulin sensitivity, such as serum IGFBP-1 and SHBG levels, were not correlated with birth weight SDS, suggesting that they may not be sensitive enough to study metabolic changes related to variations in prenatal growth rates. Moreover, both insulin sensitivity and postload insulin secretion correlated with early instant postnatal growth velocity, independently of size at birth. Remarkably, these correlations did not hold after adjustment for current BMI (SDS), perhaps indicating that the effect of postnatal growth rates on insulin sensitivity and secretion is mediated by a tendency to higher adiposity in those children gaining weight more rapidly after birth (20). Correlations also disappeared after
TABLE 3. Laboratory data from the sIVGTT
Fasting glucose (mmol/liter) Fasting insulin (pmol/liter) HOMA IR Fasting C-peptide (nmol/liter) AUC glucose (mmol䡠min/liter) AUC insulin (pmol䡠min/liter) IGFBP-1 (pmol/liter) SHBG (nmol/liter) Total cholesterol (mg/dl) LDL cholesterol (mg/dl) HDL cholesterol (mg/dl) Triglycerides (mg/dl) a
SGA (n ⫽ 20)
AGA (n ⫽ 40)
Pa
4.77 ⫾ 0.08 40.1 ⫾ 5.2 1.24 ⫾ 0.17 0.42 ⫾ 0.03 158.8 ⫾ 6.8 3352.2 ⫾ 421.5 32.8 ⫾ 2.4 84.2 ⫾ 5.6 147.5 ⫾ 5.6 85.4 ⫾ 5.2 44.5 ⫾ 2.3 86.6 ⫾ 12.4
4.79 ⫾ 0.07 30.5 ⫾ 2.4 0.94 ⫾ 0.08 0.30 ⫾ 0.02 147.6 ⫾ 4.1 2969.8 ⫾ 295.4 36.9 ⫾ 2.6 84.0 ⫾ 3.7 159.7 ⫾ 5.4 96.6 ⫾ 5.4 46.6 ⫾ 1.8 76.8 ⫾ 5.3
n.s. ⬍0.05 ⬍0.05 ⬍0.01 n.s. n.s. n.s. n.s. n.s. n.s. n.s. n.s.
Adjusted for sex and BMI SDS. n.s., Not significant.
The Endocrine Society. Downloaded from press.endocrine.org by [${individualUser.displayName}] on 22 January 2017. at 17:29 For personal use only. No other uses without permission. . All rights reserved.
Bazaes et al. • Insulin Sensitivity in VLBW Children
J Clin Endocrinol Metab, March 2004, 89(3):1267–1272 1271
FIG. 2. Serum insulin levels during a sIVGTT in SGA (n ⫽ 20) and AGA (n ⫽ 40) VLBW children aged 5–7 yr. A, Insulin profiles during the sIVGTT in SGA and AGA children. B, Fasting insulin levels (mean of values at times ⫺5 and 0). C, Postload insulin secretion, evaluated as the insulin AUC. Results are expressed as mean ⫾ SEM. *, P ⬍ 0.05. TABLE 4. General linear model using HOMA-IR as a dependent variable Source
F
P
Corrected model Intercept Sex Birth weight (SDS) Gestational age Pregnancy hypertension Days of 02 support Current BMI (SDS)
4.127 1.096 3.255 4.394 0.453 0.011 0.128 10.153
0.003 0.302 0.079 0.043 0.505 0.916 0.722 0.003
r2 ⫽ 0.395 (adjusted r2 ⫽ 0.299). Significant values are shown in bold.
adjustment for indicators of postnatal morbidity, probably because of their strong colinearity with early growth rates. It is noteworthy that these observations were carried out in a cohort of VLBW children from a well-defined area in Santiago, Chile. As a consequence of the strong geographical stratification in this city, this is an excellent indicator of ethnical and socioeconomical homogeneity in our study group (23). Furthermore, none of the children displayed clinical or laboratory signs of adrenarche or puberty, and only one of them had failed to catch up in height. This latter feature is related to the population from which our sample was selected, namely VLBW children attending a follow-up clinic with no endocrine bias whatsoever. A particular strength of our study was the analysis of early postnatal growth using a parameter (instant growth rate) that is independent of size at birth. As pointed out by Lucas et al. (24), this is essential if a separate assessment of the effects of LBW and CUG is desired. The association between birth weight SDS and fasting insulin sensitivity in our cohort highlights the relevance of IUGR, rather than postnatal adverse conditions, for long-
term metabolic modifications. This is in accordance with findings by Gray et al. (11) in a group of premature neonates, whose insulin sensitivity during an oral glucose tolerance test was related to birth weight SDS, regardless of gestational age. Moreover, Leipa¨ la¨ et al. (10) also found in VLBW premature infants that the reduction in insulin sensitivity induced by corticoid therapy was observed only in SGA newborns. Fewtrell et al. (25), in a large group of 9- to 12-yr-old children born preterm, also found that smallness at birth is associated with decreased glucose tolerance, independent of gestational age. Taken together, these data provide strong support to Barker’s (2) model of prenatal programing of insulin sensitivity. In particular, our findings suggest that this programing may occur before the last quarter of pregnancy. In our cohort, no correlation was found between size at birth and midparental height, but we cannot rule out the contribution of other genetic factors. Most SGA pregnancies presented with hypertension, a condition associated with variable degrees of insulin resistance (26). Such a trait could be inherited, and manifest phenotypically as both failure to grow in utero and reduced insulin sensitivity in childhood (27). Interestingly, we also found a significant correlation between early postnatal growth rates and insulin sensitivity and secretion in childhood. Our observations in a prospective cohort of SGA and AGA infants born at full term indicate that both basal and first-phase insulin release during an sIVGTT are highly correlated with the extent of centile crossing in weight and length during the first year of life (7). This is also in accordance with the early work by Colle et al. (28), showing a direct correlation between longitudinal growth velocity and first-phase insulin release in 6-month-old infants. Insulin is an important growth factor during infancy,
The Endocrine Society. Downloaded from press.endocrine.org by [${individualUser.displayName}] on 22 January 2017. at 17:29 For personal use only. No other uses without permission. . All rights reserved.
1272
J Clin Endocrinol Metab, March 2004, 89(3):1267–1272
and insulin secretion could be relevant for fat deposition and weight gain shortly after birth (29). This accelerated weight gain may in turn lead to the later development of obesity (20), thus contributing to the appearance of insulin resistance. Alternatively, variations in insulin secretion might reflect higher IGF-I levels in those children growing more rapidly (30). IGF-I has been shown to enhance -cell mass and function in vivo (31), but its relevance for normal islet development in humans remains to be determined (32). In summary, we have found significant associations between early life events and subsequent metabolic modifications in a contemporary cohort of VLBW children. Owing to our study design, we have been able to identify birth weight SDS and postnatal growth velocity as independent determinants of insulin sensitivity and secretion. In addition, we have shown that adverse perinatal events do not explain the association between LBW and reduced insulin sensitivity. It remains to be elucidated whether early postnatal interventions could modify the course of metabolic changes associated with LBW and rapid CUG (33). Acknowledgments
Bazaes et al. • Insulin Sensitivity in VLBW Children
10. 11. 12. 13. 14. 15. 16. 17. 18. 19.
The authors are indebted to Dr. David Dunger for his thoughtful comments on the manuscript. 20.
Received July 17, 2003. Accepted December 8, 2003. Address all correspondence and requests for reprints to: Vero´nica Mericq, M.D., Institute of Maternal and Child Research, University of Chile, P.O. Box 226-3, Santiago, Chile. E-mail:
[email protected]. This work was supported by Grant 2010049 from FONDECYT, Chile. R.A.B. is supported by a doctoral fellowship from Fundacio´ n Andes, Chile.
References 1. Eriksson JG, Forsen T, Tuomilehto J, Jaddoe VW, Osmond C, Barker DJ 2002 Effects of size at birth and childhood growth on the insulin resistance syndrome in elderly individuals. Diabetologia 45:342–348 2. Barker D 2002 Fetal programming of coronary heart disease. Trends Endocrinol Metab 13:364 3. Bavdekar A, Yajnik CS, Fall CH, Bapat S, Pandit AN, Deshpande V, Bhave S, Kellingray SD, Joglekar C 1999 Insulin resistance syndrome in 8-year-old Indian children: small at birth, big at 8 years, or both? Diabetes 48:2422–2429 4. Dwyer T, Blizzard L, Venn A, Stankovich JM, Ponsonby AL, Morley R 2002 Syndrome X in 8-y-old Australian children: stronger associations with current body fatness than with infant size or growth. Int J Obes Relat Metab Disord 26:1301–1309 5. Hofman PL, Cutfield WS, Robinson EM, Bergman RN, Menon RK, Sperling MA, Gluckman PD 1997 Insulin resistance in short children with intrauterine growth retardation. J Clin Endocrinol Metab 82:402– 406 6. Li C, Johnson MS, Goran MI 2001 Effects of low birth weight on insulin resistance syndrome in caucasian and African-American children. Diabetes Care 24:2035–2042 ´ vila A, I´n˜iguez G, Ong KK, Dunger 7. Soto N, Bazaes RA, Pen˜a V, Salazar T, A DB, Mericq V 2003 Insulin sensitivity and secretion are related to catch-up growth in small-for-gestational-age infants at age one year: results from a prospective cohort. J Clin Endocrinol Metab 88:3645–3650 8. Veening MA, Van Weissenbruch MM, Delemarre-Van De Waal HA 2002 Glucose tolerance, insulin sensitivity, and insulin secretion in children born small for gestational age. J Clin Endocrinol Metab 87:4657– 4661 9. Wilkin TJ, Metcalf BS, Murphy MJ, Kirkby J, Jeffery AN, Voss LD 2002 The relative contributions of birth weight, weight change, and current weight to
21. 22. 23. 24. 25. 26. 27. 28. 29. 30.
31. 32. 33.
insulin resistance in contemporary 5-year-olds: the EarlyBird Study. Diabetes 51:3468 –3472 Leipala JA, Raivio KO, Sarnesto A, Panteleon A, Fellman V 2002 Intrauterine growth restriction and postnatal steroid treatment effects on insulin sensitivity in preterm neonates. J Pediatr 141:472– 476 Gray IP, Cooper PA, Cory BJ, Toman M, Crowther NJ 2002 The intrauterine environment is a strong determinant of glucose tolerance during the neonatal period, even in prematurity. J Clin Endocrinol Metab 87:4252– 4256 Eriksson JG, Forsen T, Tuomilehto J, Winter PD, Osmond C, Barker DJ 1999 Catch-up growth in childhood and death from coronary heart disease: longitudinal study. BMJ 318:427– 431 Forsen T, Eriksson J, Tuomilehto J, Reunanen A, Osmond C, Barker D 2000 The fetal and childhood growth of persons who develop type 2 diabetes. Ann Intern Med 133:176 –182 Cianfarani S, Germani D, Branca F 1999 Low birthweight and adult insulin resistance: the “catch-up growth” hypothesis. Arch Dis Child Fetal Neonatal Ed 81:F71–F73 Pittaluga E, Diaz V, Mena P, Corvala´n S 2002 Curva de crecimiento intrauterino para prematuros entre 23 a 36 semanas de edad gestacional. Rev Chil Pediatr 73:135–141 Pittaluga E, Vernal P, Mena P, Figueroa A, Henrı´quez MT, Toha´ D, Vega S 1998 Postnatal growth of very low birth weight infants. Rev Chil Pediatr 69:47–55 Huang TT, Johnson MS, Goran MI 2002 Development of a prediction equation for insulin sensitivity from anthropometry and fasting insulin in prepubertal and early pubertal children. Diabetes Care 25:1203–1210 Allen HF, Jeffers BW, Klingensmith GJ, Chase HP 1993 First-phase insulin release in normal children. J Pediatr 123:733–738 Youlton R, Valenzuela C 1990 Growth patterns in height and weight in children aged 0 to 17 years and cranial circumference in children aged 0 to 2 years from medium-high and high socioeconomic status in Santiago. Comparison with growth in children from medium-low and low status in the Northern area of Santiago. Rev Chil Pediatr Spec No:1–22 Ong KK, Ahmed ML, Emmett PM, Preece MA, Dunger DB 2000 Association between postnatal catch-up growth and obesity in childhood: prospective cohort study. BMJ 320:967–971 Bennett F, Watson-Brown C, Thame M, Wilks R, Osmond C, Hales N, Barker D, Forrester T 2002 Shortness at birth is associated with insulin resistance in pre-pubertal Jamaican children. Eur J Clin Nutr 56:506 –511 Yajnik C 2000 Interactions of perturbations in intrauterine growth and growth during childhood on the risk of adult-onset disease. Proc Nutr Soc 59:257–265 Cifuentes L, Valenzuela CY, Cruz-Coke R, Armanet L, Lyng C, Harb Z 1988 Genetic characterization of the hospital population of Santiago, Chile. Rev Med Chil 116:28 –33 Lucas A, Fewtrell MS, Cole TJ 1999 Fetal origins of adult disease-the hypothesis revisited. BMJ 319:245–249 Fewtrell MS, Doherty C, Cole TJ, Stafford M, Hales CN, Lucas A 2000 Effects of size at birth, gestational age and early growth in preterm infants on glucose and insulin concentrations at 9 –12 years. Diabetologia 43:714 –717 Solomon CG, Seely EW 2001 Brief review: hypertension in pregnancy: a manifestation of the insulin resistance syndrome? Hypertension 37:232–239 Ong KK, Dunger DB 2000 Thrifty genotypes and phenotypes in the pathogenesis of type 2 diabetes mellitus. J Pediatr Endocrinol Metab 13(Suppl 6):1419 –1424 Colle E, Schiff D, Andrew G, Bauer CB, Fitzhardinge P 1976 Insulin responses during catch-up growth of infants who were small for gestational age. Pediatrics 57:363–371 Mayor F, Cuezva JM 1985 Hormonal and metabolic changes in the perinatal period. Biol Neonate 48:185–196 Kajantie E, Dunkel L, Rutanen EM, Seppala M, Koistinen R, Sarnesto A, Andersson S 2002 IGF-I, IGF binding protein (IGFBP)-3, phosphoisoforms of IGFBP-1, and postnatal growth in very low birth weight infants. J Clin Endocrinol Metab 87:2171–2179 Withers DJ, Burks DJ, Towery HH, Altamuro SL, Flint CL, White MF 1999 Irs-2 coordinates Igf-1 receptor-mediated beta-cell development and peripheral insulin signalling. Nat Genet 23:32– 40 Woods KA, Camacho-Hubner C, Savage MO, Clark AJ 1996 Intrauterine growth retardation and postnatal growth failure associated with deletion of the insulin-like growth factor I gene. N Engl J Med 335:1363–1367 Singhal A, Fewtrell MS, Cole TJ, Lucas A 2003 Low nutrient intake and early growth for later insulin resistance in adolescents born preterm. Lancet 361:1089 –1097
JCEM is published monthly by The Endocrine Society (http://www.endo-society.org), the foremost professional society serving the endocrine community.
The Endocrine Society. Downloaded from press.endocrine.org by [${individualUser.displayName}] on 22 January 2017. at 17:29 For personal use only. No other uses without permission. . All rights reserved.