EPA600lR-921226 January 1993
LIFE CYCLE DESIGN GUIDANCE MANUAL Environmental Requirements and The Product System Gregory A. Keoleian Dan Menerey National Pollution Prevention Center University of Michigan Ann Arbor, MI 48109-1115
Cooperative Agreement #817570 Project Officer Mary Ann Curran Pollution Prevention Research Branch Risk Reduction Engineering Laboratory Cincinnati, Ohio 45268
RISK REDUCTION ENGINEERING LABORATORY OFFICE OF RESEARCH AND DEVELOPMENT US ENVIRONMENTAL PROTECTION AGENCY CINCINNATI, OH 45268
The information in this document was funded wholly by the United States Environmental Protection Agency (EPA) under Cooperative Agreement #817570 to the University of Michigan. It has been subjected to the Agency's peer and administrativereview and has been approved for publication as an EPA document. This approval does not necessarily signify that the contents reflect the views and policies of the US EPA. Mention of trade names or commercial products does not constitute endorsement or recommendation for use.
This guidance manual was developed as part of the US Environmental Protection Agency's Pollution Prevention Research Program. Through such research the EPA seeks to facilitate the development of technologies and products that result in reduced aggregate generation of pollutants across all media. The Life Cycle Design project was initiated to reduce environmental impacts and health risks through product and process design and development. For the last two decades the life cycle framework has been used principally for environmental analysis of products. Resource use and the generation of residuals or wastes have been quantified by performing inventory analyses of product life cycle systems. The basic methodology for inventory analysis is documented in Product Life-Cycle Assessment: Inventory Guidelines and Principles (EPA/600/R-921036) which was published by the Risk Reduction Engineering Laboratory of the EPA. Life cycle design is the application of the life cycle framework to product system design. The product system includes product, process, distribution, and managementhnformation components. This project has been organized into two phases: Phase I - preparation of the first edition of this manual and Phase II - life cycle design demonstration projects. In Phase I , an investigation of the design literature and interviews with design professionals contributed to the development of goals, principles and a framework for life cycle design. Life cycle design is a proactive approach for integrating pollution prevention and resource conservation strategies into the development of more ecologically and economically sustainable product systems. Cross media pollutant transfer and the shifting of other impacts can be avoided by addressing the entire life cycle, which includes raw materials acquisition, materials processing, manufacturing and assembly, use and service, retirement, disposal and the ultimate fate of residuals. The goal of life cycle design is to minimize aggregate risks and impacts over this life cycle. This goal can only be attained through the balancing of environmental, performance, cost, cultural, legal, and technical requirements of the product system. Concepts such as concurrent design, total quality management. cross-disciplinary teams, and multi-attribute decision making are essential elements of life cycle design that help meet these goals. The complexity of product system design is a function of the conflict between various classes of design criteria, self-interests of the life cycle participants, and the time-cycles affecting product system development and implementation. Consequently, design activities to reduce aggregate environmental impacts and risks must be coordinated using a systems-oriented approach. The framework for life cycle design was developed to be applicable for all product domains. Individual f m s are expected to interpret the manual for their own specific applications. The manual was written to assist not only design professionals but all other constituents who have an important role in life cycle design including corporate executives, product managers, production workers, distributors, environmental health and safety staff, purchasers, accountants, marketers, salespersons, legal staff, consumers, and government regulators. A coordinated effort is required to institute changes needed for successful implementation of life cycle design. iii
Both AT&T Bell Labs and Allied Signal are participating in Phase II: Life Cycle Design Demonstration Projects. The purpose of these projects is to demonstrate the efficacy of life cycle design, and encourage its use by other f m s . The University of Michigan research group also welcomes comments and suggestions from other readers. Please direct your comments to Dr. Greg Keoleian at the address given below. National Pollution Prevention Center University of Michigan Dana Building 430 E. University Ann Arbor, Michigan 48109-1115
Greg Keoleian and Dan Menerey December 1992
This document seeks to promote the reduction of environmental impacts and health risks through a systems approach to design. The approach is based on the product life cycle, which includes raw materials acquisition and processing, manufacturing, uselservice, resource recovery, and disposal. A life cycle design framework was developed to provide guidance for more effectively conserving resources and energy, preventing pollution, and reducing the aggregate environmental impacts and health risks associated with a product system. This framework addresses the product, process, dishbution, and management/infonnation components of each product system. Concepts such as concurrent design, cross-disciplinary teams, multi-objective decision making, and total cost assessment are essential elements of the framework. Life cycle design emphasizes integrating environmental requirements into the earliest phases of design and successfully balancing these requirements with all other necessary performance, cost, cultural, and legal criteria. A multi-layer requirements matrix is proposed to assist the design team in identifying design requirements and resolving the conflicts between them. Design strategies for meeting environmental requirements are then provided. Finally, environmental analysis tools and life cycle accounting methods are presented for evaluating design alternatives. This report was submitted in fulfillment of Cooperative Agreement #I817570 by the University of Michigan under the sponsorship of the US Environmental Protection Agency. Research for this report covers the period from January 1991 to December 1991. A draft report was submitted in April 1992. and the final report was completed in December 1992.
CHAPTER 1 INTRODUCTION 2
1.1 New Demands on Design
Public Opinion ....................................................................- 3
Competition and Costs ........................................................ 4 ................................. 5 The Environment ................... ...... 6 1.2 Description of the Manual Purpose .............................................................................6 Scope ................................................................................. 6 Audience .......................................................................... 7 Content and Organization ................................................... 8
CHAPTER 2 LIFE CYCLE DESIGN BASICS 12 Life Cycle Stages .............................................................. 13 2.2 Product System Components 16 Product .................................... .. ..................................... 16 Process ...................................................................... 1 7 Distribution ........................................................................17 Management .................................................................. 1 7 2.3 Goals 18 Resource Conservation..................................................... 18 Pollution Prevention .......................................................... 19 Environmental Equity ........................................................19 Sustainable Ecosystems ......................... . . ................... 19 Viable Economic Systems ................................................. 20 2.1 The Llfe Cycle Framework
CHAPTER 3 THE DEVELOPMENT PROCESS 3.1 Development Acthrlties 22 Management .................................................................... 24 Needs Analysis ................... ......................................... 32 Requirements ................................................................... 34 Design Phases .................................................................. 35 Implementation ................................................................. 37 Limitations ...................................... ................................... 37
. .
CHAPTER 4 DESIGN REQUIREMENTS 4.1 Formulating Requirements
40 Key Elements .................................................................... 40 Scope and Detail ...............................................................41 Use of Requirements Matrix ..............................................43 4.2 Types of Requirements 46 Environmental ..................... ... .... .................................46 Performance ................................................................... 49 Cost .................................................................................. 50 Cuttural ................... . . . ....................................................50 Legal Requirements .......................................................... 51 Example of Partial Matrix ..................................................52 4.3 Ranking and Weighing 57 Organizing ........................................................................ 57 Resolving Conflicts ............................................................ 58
CHAPTER 5 DESIGN STRATEGIES 5.1 Ovewlew 5.2 Product System Life Extension
62 63 Appropriately Durable ....................................................... 64 Adaptable ..........................................................................66 Reliable ............................................................................. 67 Serviceable ....................................................................... 68 Remanufacturable .............................................................70 Reusable ........................................................................... 72 5.3 Material Life Extension 73 Recycling .......................................................................... 73 5.4 Material Selection 79 Substitution ....................................................................... 79 Reformulation.................................................................. 80 5.5 Reduced Material intensiveness 81 5.6 Process Management 81 Process Substitution ....................................................... 81 Process Control ................................................................ 84 improved Process Layout .................................................. 84 inventory Control and Material Handling ...........................84 Facilities Planning ............................................................. 85 Treatment and Disposal ................................................. 86 5.7 Efficient Distribution 87 Transportation ................................................................... 87 Packaging .........................................................................88
vii
5.8 Improved Management Practices 91 Office Management ........................................................... 91 Phase Out High Impact Products ......................................92 Choose Environmentally Responsible Suppliers or Contractors .................................................................... -92 Information Provision ........................................................ 92
CHAPTER 6 ENVIRONMENTAL ANALYSIS TOOLS 6.1 Elements of Deslgn Analysls
98
Scope of the Analysis ......................................................100
6.2 inventory Analysis
102
Identifying Streams and Constituents ..............................103 Quantification .................................................................. 104 Limitations .......................................................................107 108 6.3 Impact Assessment Resource Depletion......................................................... 109 Ecological Effects ............................................................110 Human Health and Safety Effects ................................... 113 Limitations ....................... . ............................................ 116
CHAPTER 7 LIFE CYCLE ACCOUNING 7.1 Tradltlonal Accounting Practices
1 20 Financial Cost Structures ........................................... 1 2 0 Unidentified Costs ............................. . .........................121 Externalities .................................................................... 121 122 7.2 Life Cycle Accounting Usual Costs ..................................................................... 125 Hidden Costs .............................................................. 1 2 6 Liability Costs ................................................................ 126 Less Tangible Costs ............................. . . ...................... 128 Limitations ...................................... ............................. 128 Appendix A. Sources of Additional Information Appendix B. Sumary of Major Federal Environmental Laws Appendix C Overview of Environmental Impacts Appendlx D. Decision Making Appendix E. Environmental Labeling Appendlx F. Glossary
.
viii
131 1 34 150 165 176 1 79
TABLES Table 5.1 . Generation and Material Recovery of MSW in Millions of Tons. 1988 ........................................................................76 Table 7.1
.
Incandescent and Fluorescent Life Cycle Costs for
9000 Hours of Illumination.................................................. 122
FIGURES Figure 2.1 . The Product Life Cycle System ...........................................14 Figure 2.2 . Material Downcycling: One Way Life Cycles of 3 Product Systems May Be Linked ......................................................15 Figure 2.3 . Interrelationship of Life Cycle Design Goals ........................18 Figure 3.1 . Life Cycle Design Process ................................................... 23 Figure 3.2 . Relative Time Scales Affecting Hypothetical Product System ................................................................... 30 Figure 4-1. Product Development Costs ............................................... -42 Figure 4.2 . Conceptual Requirements Matrices ..................................... 44 Figure 4 3. Example of Subdivided Rows for Environmental Requirements Matrix ........................................................... 45 Figure 6.1 . Limited Life Cycle Flow Diagram for Hypothetical Detergent Product System ............................................ 103 Figure 6-2. Single Stage Fbw Diagram ............................................... 104 Figure 6-3. Impact Assessment Process ............................................. 108 Figure 7.1 . Assigning L i e Cycle Costs to Specific Product Systems ...123 Figure 7.2 . L i e Cycle Costs in Product Devebpment .......................... 124
A review of design methodologies and a series of interviews with the following design profes-
sionals helped identify current approaches to environmental impact reduction and major bamers to adoption of life cycle design. We also thank Dr. Jonathan W. Bulkley and Doug Moody of the National Pollution Prevention Center at the University of Michigan and Teresa Harten, Lisa Brown, and Jordan Spooner from the EPA RREL for reviewing the manual. Views contained in this document may not necessarily reflect those of the individuals interviewed or the reviewers. Brad Agry Henry Dreyfuss Associates
Charles Jones Haworth Inc.
Marilyn Perchard Ford Motor Company
Robert Rrunner Apple Computer
Greg Jones General Electric Company
Earl N. Powell Design Management Inst.
R. Lee Byers ALCOA
Linda Keefe 3M Company
Dcnnis B. Redington Monsanto Company
Joel B. Charm Allied Signal Inc.
Howard Klee Amow Corporation
Frank Cassidy Digital Equipment Corp.
Rudolph Krolopp Motorola Inc.
T. Michael Rothgeb Procter & Gamble
Lewis T. Dixon Ford Motor Company
John Paul Kusz Safety-Kleen Corp.
V. Wayne Roush Shell Oil Company
Terry Duncan Duncan Industrial Design
Eric Larson Dupont
Allen Samuels The University of Michigan
Greg Eyring US Congress, Office of Technology Assessment
Joseph A. L i d s l y The Dow Chemical Company
George Simons Steelcase. Inc.
Don McCloskey Black and Decker
Budd Steinhilber Industrial Designers Society of Arneric a
Harry Fatkin Polaroid Corporation Bob Ferrone Digital Equipment Corp. Dennis Foley Herman Miller Werner Glantschnig AT&T Bell Labs Andy Glickman Chevron Corporation
Tom Newhouse Thomas J. Newhouse Design Kathleen Nicholson General Motors Rick Noller Fitch RichardsonSmith Charles Overby Ohio University Bruce Paton Hewlett Packard Co. X
Ted Tuescher Smith & Hawken J.C. van Weenan University of Amsterdam William W. Walton US Consumer Product Safety Commission John Wesner AT&T Bell Laboratories
Chapter I
INTRODUCTION
1.1 NEW DEMANDS ON DESIGN
Environmental criteria are often not considered until the end of a development ~roiect.As a result. coipanies spend too much time fixing problems instead of preventing them.
Innovative firms are adopting environmental design policies. But without clear definitions, these policies may not translate into suocessful design programs.
Most environmental impacts result from design decisions made long before manufacture or use. Yet environmental criteria often are not considered at the beginning of design when it is easiest to avoid adverse impacts. Waiting until the end of a project to think about environmental matters reflects past practice. Until recently, most environmental impacts were reduced through end-of-pipe controls and process design rather product design. By tolerating poor coordination between product and process design, many companies still spend too much time fixing problems rather than preventing them. Critical environmental impacts may be all too easy to overlook when design proceeds through a series of isolated groups. One experience at 3M shows the pitfalls of this linear design approach. In the mid-seventies, 3M designed an instant fm extinguisher for jet airplane cockpits. The product worked very well, but failed to receive a permit from the EPA because it harmed fish and other aquatic life. In only a week, 3M scientists identified the toxic chemicals in their first design and found substitutes that were one fortieth as harmful. The new product was just as effective, and actually cost less to produce [I]. If environmental experts had participated in design, regulatory action might have been avoided. 3M's noted Pollution Prevention Pays program is founded on the lessons learned from this incident. In the past fifteen years, many f m s have begun to focus more on pollution prevention. Some innovative businesses are already responding to new challenges by adopting ambitious environmental design policies. But translating these policies into action is a major challenge. Without proper support, many "green" design programs can founder. Similar problems develop when environmental design projects lack specific objectives, definitions, or measurements. Unless a development team can clearly define what it is hying to accomplish, and has the support of management, they may find it difficult to reduce the environmental impacts of their designs.
Introduction
Not all new design methods take a broad view. In contrast to the ambiguity of "green" design, programs such as design for recyclability are specific strategies. A restricted design strategy can be beneficial, but it may not be ideal. The net results of product development can be obscured when design teams focus on a single environmental aspect. For example, a product that is easy to recycle may reduce solid waste after customer use, but it may not reduce overall impacts. If the ultimate goal is environmental preservation, such projects may be pointless. There is thus a need for designs that reduce total environmental impacts while also satisfying other criteria. The life cycle framework provides the most complete environmental profile of goods and services. The life cycle consists of each step in the life of a product from acquisition of raw materials through processing, manufacture, use, and final disposal of a l l residuals. Designers who use this broad framework help ensure that the environmental impacts of their products are discovered and reduced, not merely shifted to other places. A life cycle, or "cradle to grave" approach is systematic. Building on this systems base, life cycle design also draws on ideas such as concurrent development and cross-disciplinary teams. Each is needed to successfully balance environmental issues with cost, performance, cultural, and legal criteria. As emphasis shifts from end-of-pipe controls and remedial actions to pollution prevention, design will play an increasingly important role in preserving our environment.
Public Opinion Is there a demand for low-impact products? Even though people may behave differently from how they describe themselves in a poll, surveys can still be useful. A nationwide Wall Street Journal/NBC poll conducted in the summer of 1991 found that 80% of Americans describe themselves as environmentalists. Fifty percent of respondents claimed to be strong environmentalists [2]. Most people polled said they recognize the need for substantial changes in their habits and are not waiting for future technological fixes. Manufacturers can help translate such environmental awareness into demand for lower-impact products by producing and marketing improved designs. Designers who embrace environmental quality will be at the center of this activity. Future environmental progress depends on designers' ability to improve the environmental performance of products. Of course, many other people involved in making and marketing products play a vital role in achieving environmental quality. For ex-
The life cycle framework recognizes each step in product development from extraction of raw materials through final disposal of all residuals. Life cycle design focuses on discovering and reducing environmental impacts, not merely shuffling them between various media or activities.
Chapter 1 ample, education will increasingly be needed to overcome the confusion surrounding environmentally responsible design. Advertising can help meet this need. Rather than misrepresenting products as "environmentally friendly" or "green", the benefits of a design improvement can be clearly described, thus enabling customers to make informed choices.
Competition and Costs
Environmental quality can be critical to product success. Reducing environmental "defects" may also lower costs.
A prudent development program recognizes that environmental factors are increasingly considered part of product quality. In the current competitive climate, all companies know that quality products are critical to success. As Taiichi Ohno, former VP of Toyota said, "Whatever an executive thinks the losses of poor quality are, they are actually six times greater" [3]. Ignoring the environmental dimensions of quality could be a major disadvantage to companies in competitive markets. Best-in-class manufacturers already recognize that there is no "optimal" level of quality in terms of cost: the fewer defects the lower the costs. Business and industry may also discover that reducing environmental "defects" produces similar benefits. Total cost assessment can help companies determine development costs with more accuracy [4,5]. This type of accounting adds hidden, liability, and less tangible environmental costs to those costs usually identified by standard methods. Such costs are generally not included in development projects, but they can be substantial. In addition, some conventional environmental costs, such as those for pollution abatement and control, are expanding. In 1989, $91.3 billion was spent in the US for this purpose, and the US EPA estimates that annual expenditures for abatement and control will rise to $200 billion by 1995 [6]. Chapter 7 contains a more detailed discussion of life cycle accounting methods useful in product design. Forlunately, many strategies for preventing damage before it occurs are cost effective. INFORM,INC.documented the results from 139 source reduction activities at 22 chemical plants [7]. Box 1-A shows what 15 activities at 4 large chemical plants accomplished. Source reductions outlined in the full study include changes in processes, operations, equipment, and products, as well as chemical substitutions.
Introduction
Products with minimal environmental impacts are also well suited to the global marketplace. Sound environmental practices result in designs that meet or exceed regulations in all countries where they will be sold or produced. When a product meets all regulations, costly changes or delays that might affect market penetration can be avoided. This helps ensure long-term corporate viability in a rapidly changing world. Legislation in Germany provides an example of the issues global companies may soon face in many locations. Manufacturers will be required to retain responsibility for disposal of products after they are retired by users. The German Minister of the Environment has also urged customers to remove unnecessary packaging from products and let merchants pay for discarding this waste. Companies wishing to make a profit selling products in Germany will have to make the needed adjustments. In this new context. only those products consistent with changing laws and public demand are likely to be successful.
The Environment Understanding the range of impacts caused by human activity puts the need for responsible product development in perspective. Every product causes multiple environmental impacts. To begin with, producls consume both renewable and nonrenewable resources. The consequences of extracting resources can be severe. For example, rare plants and mimals may become extinct, or nonrenewable resources, such as petroleum, may be exhausted. Other impacts accompany resource use. Both nonhazardous and hazardous wastes are generated during product development and use. Many wastes are released directly to the environment in the form of air emissions or water discharges, while others are disposed in landfills. Pollution and waste in all forms degrade ecosystems and h m human health. Effects range from acute to long term and can occur on local, regional, or global scales. Greenhouse warming and ozone depletion are examples of
Every product causes multiple environmental impads- Understanding the range Of these impacts underscores the need for life cyde design.
Chapter 1 long-term effects with severe global consequences. Environmental issues that designers should understand are discussed further in Appendix C. Environmental objectives for design that reflect current and future environmental problems help promote sustainable resource management and also ensure environmental quality for future generations.
1.2 DESCRIPTION OF THE MANUAL
Purpose The main purposes of this manual are to: Reduce total environmental impacts and health risks caused by product development Encourage the inclusion of environmental requirements at the earliest stage of design rather than focusing on end-of-pipe solutions Integrate environmental, performance, cost, cultural, and legal requirements in effective designs
This manual focuses on environmental requirements for product design. In life cycle design, products are defined as systems that include the following components: the product processing steps by which products are made, used, and retired distribution networks (packaging and transportation) management The design framework discussed in the manual can be applied to: improvements, or minor modifications of existing products or processes; new features associated with developing the next generation of an existing product or process; and innovations characteristic of new product and process design.
The life cycle framework addresses upstream and downstream consequences of all activities related to a product system, not just those im-
Introduction
pacts resulting from production and use. When design considers each stage of the life cycle from raw material extraction to final disposal and fate of residuals, full product impacts can be understood and reduced. No single design method or set of rules applies to all types of products. For that reason, this manual provides general guidelines and tools rather than prescriptions. Design professionals should use the manual to develop specific tools best suited to their projects. Environmental design is complex; there are rarely easy solutions. Ideally, designers could use a database or a simple procedure to select environmentally preferred materials. Unfortunately. no such database exists, and there is no simple procedure for evaluating materials. Architecture and similar areas of design are not specifically addressed in this manual, although the life cycle approach for reducing environmental impacts and risks applies to many disciplines.
Audience All partners in product development have an important role to play in achieving impact reduction. The manual is primarily intended for the following decision makers: product designers industrial designers process design engineers packaging designers product development managers managers and staff in accounting, marketing, distribution, strategy, environmental, health and safety, legal. purchasing, and service The manual assumes some familiarity with design, but it may also be read by individuals with no prior knowledge of design. A glossary of important terms is provided in Appendix F.
When design considers all stages of the life cycle from raw material extraction to final disposal and fate of residuals, the full consequences of products development can be understood and acted on.
This manual provides general guidelines rather than prescriptions. Design professionals should use the manual to develop tools best suited to their specific projects.
Chapter 1
Content and Organization Chapter 1. lntroductlon Chapter 2. Life Cycle Design Baslcs Three basic elements of life cycle design are introduced. First, the life cycle system is outlined. Then the product system used for design is defined. Finally, the goals of life cycle design are presented. Chapter 3. The Development Process Discussion begins by introducing concurrent design and total quality programs as a management function of life cycle design. Management also plays a vital role in project success by setting policies, strategies, and measures of success that are compatible with life cycle goals. Design projects typically begin with a needs analysis. Requirements, the key element in design, are next set to translate needs into products. Design then proceeds through several interactive phases that integrate environmental criteria with traditional cost, performance, cultural, and legal criteria. Chapter 4. Environmental Requirements The most important stage of design is developing requirements. Construction and use of a multi-layer matrix is recommended for formulating environmental requirements. Other classes of requirements are briefly discussed as part of integrated design. Chapter 5. Design Strategies After the design team develops requirements, they choose strategies to satisfy those requirements. General life cycle design strategies discussed in this chapter include product life extension, material life extension, material selection, reduced resource use, process management, efficient distribution, and improved management practices. Chapter 6. Environmental Analysis Tools This chapter describes a method for evaluating environmenlal criteria in life cycle design. Key elements of inventory analysis and impact assessment are presented and discussed.
Introduction
Chapter 7. Life Cycle Accounting Life cycle environmental accounting is contrasted with traditional accounting practices. Aspects of life cycle accounting are introduced and suggestions made for assessing the comprehensive costs and benefits of development projects. Appendix A. Sources of AddRbnai information Appendix B. Summary of Major Federal Environmental Laws Appendix C. Overview of Environmental impacts Appendix D. Decision Making Two major decision-making methods for establishing requirements and evaluating design alternatives are briefly introduced. Appendix E. Environmental Labeiing Several third-party programs are outlined. Appendix F. Glossary
Chapter 1
References 1. W i n , Edward 0. 1984. Biophilia. Cambridge, MA: Harvard University Press. 2. Gutfeld, Rose. 2 August 1991. Shades of Green. The Wall Streel Journal, Midwest Edition. A. 1. 3. Taguchi. Genichi, and Don Clawing. 1990. Robust Quality. Harvard Buiness Review January-February: 65-75. 4. US EPA. 1989. Pollution Prevenhn BenefJs Manual (Drqi). US Environmental Protection Agency, Office of Policy, Planning, and Evaluation & Office of Solid Waste, Washington. DC. 5. White, Allen L.,Monica Becker, and James Goldstein. 1992. Tofal Cost Assessment: Accelerating Industrial Pollution Prevention Through Innovative Project Financial Analysis, US Environmental Protection Agency. Office of Pollution Prevention and Toxics, Washington. DC. 6. Rutledge. Gary L.. iind Mary L. Leonard. 1991. Pollution Abatement and Control Expenditmes. Swvey of Cwrent Business 71 (1 1): 46-50. 7. Dorfman. Mark H..Wmen R. Muir, and Catherine G. Miller. 1992 Emironnrenkd Dividends: Cutting More Chemical W d e . New York: Inform, Inc.
Chapter 2
LlFE CYCLE DESIGN BASICS
Life cycle design is rooted in systems analysis.
Several key elements form the foundation of life cycle design. First, design takes a systems approach based on the life cycle frarnework. This expanded view considers all upstream and downstream effects of design actions. Every activity related to making and using products is included in design. As a result, the product is combined with processing, distribution. and management to form a single system for design. The full consequences of a development project are thus identified so environmental objectives can be better targeted.
2.1 THE LlFE CYCLE FRAMEWORK
Lie cycle design couples the product development cycle used in business with the physical life qcle.
The term life cycle sometimes causes confusion because it has been applied to both business activities and material balance studies. In business use, a product life cycle begins with the first phases of design and proceeds through the end of production. Research. marketing, and service to support products are also included in the life cycle. Retirement and disposal of products are generally not considered. Businesses track costs, estimate profits, and plan strategy based on this type of product life cycle. In contrast, environmental inventory and impact analysis follows the physical system of a product. Such life cycle analysis tracks material and energy flows and transformations from raw material acquisition to the ultimate fate of residuals. Life cycle analysis produces Resource and Environmenlal Profile Analyses, Life Cycle Assessmenu, or cradlelo-grave sludies [e.g. 1-31. Life cycle design combines the standard business use of a life cycle with the physical system. In this manual, the life cycle of a product begins with raw material acquisition and includes all activities through final dispersal of residuals. The life cycle framework is a system for assessing the full environmental, economic, and social consequences of design. In its most complete form, life cycle design evaluates total inputs, outputs, and effects for all stages of the life cycle.
Life Cycle Framework and Principles
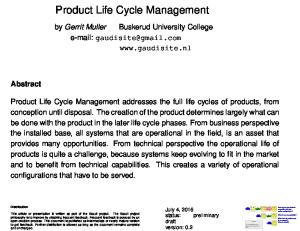
Life Cycle Stages The product life cycle can be organized into the following stages: raw material acquisition bulk material processing engineered and specialty materials production manufacturing and assembly use and service retirement disposal These stages represent one scheme for classifying activities over a product life cycle. All stage. may not apply to every product system. Figure 2-1 is a general flow diagram of the product life cycle. As this figure shows, a product life cycle is circular. Designing and using products consumes resources and converts them into residuals that accumulate in the earth and biosphere. Most products require a wide range of direct and indirect materials. Direct materials are used to make the product; indirect materials in the life cycle framework are incorporated in facilities and equipment. Either type of material may come from primary (virgin) or secondary (recycled) sources. Raw marerials acquisirion includes mining nonrenewable material and harvesting biomass. These bulk marerials are processed into base materials by separation and purification steps. Examples include flour milling and converting bauxite to aluminum. Some base materials are combined through physical and chemical means into engineered and specialty marerials. Examples include polymerization of ethylene into polyethylene pellets and the production of high-strength steel. Base and engineered materials are then manufactured through various fabrication steps, and parts are assembled into the final product. Products sold to customers are consumed or used for one or more functions. Throughout their use, products and processing equipment may be serviced to repair defects or maintain performance. Users eventually decide to refire a product. After retirement, a product can be reused or remanufactured. Material and energy can also be recovered through recycling, composting, incineration, or pyrolysis. Materials can be recycled into the same product many times (closed loop) or used to form other products before eventual discard (open loop). Some residuals generated in all stages are released directly into the environment. Emissions from automobiles, waste water discharges from
Product systems consume resources and converts them into residuals that accumulate in the earth and biosphere.
Chapter 2
I (Acquisition
recycling Material downcyding into another producl system
I
Y The Earlh and Blosphem
Fugitive and untreated residuals Airborne, waterborne, and s d i residuals
,.... .:::::.:...
Material, energy, and labor inputs for Process and Management
4
Transfer of materials between stages for Product indudes transportation and packaging (Distribution)
Flgure 2-1. The Product Llfe Cycle System
some processes. and oil spills are examples of direct releases. Residuals may also undergo physical, chemical or biological treatment. Treatment processes are usually designed to reduce volume and toxicity of waste. The remaining residuals, including those resulting from treatment are then typically disposed in landfills. The ultimate form of residuals depends on how they degrade after release. When a product is retired, its materials or parts can enter other product life cycles. Figure 2-2 illustrates how one type of material can be recovered and used for different applications. The choices made in design strongly influence whether this type of material recovery can actually take place.
6 Disposal
The Earth and Biosphere
Raw Material Aqulsirion
Product B
Maorid
downcyding inm anothu PdM aystrm
Treatment 8 Disposal
Retirement
Use 8 Service
The Earth and Biosphere
Raw Material Aqubttlon
Bulk P d n g
Engineered Ispedaltty Materlala
Manufacture 8 Assembb
Product C
Flgure 2-2. Material Downcycllng: One Way Life Cycles of 3 Product Systems May Be Linked
Bulk Procesdng
ISpedality Materials
Product A
Chapter 2
2.2 PRODUCT SYSTEM COMPONENTS Life cycle design relies on an expanded definition of a product. All activities needed to make, use, and retire products are considered a single unit. Design then addresses this entire product system.
Life cycle design also relies on an expanded definition of a product. All activities needed to make, use, and retire products are considered a single unit. Design then addresses the entire product system, not just isolated components. This is the most logical way to reduce total environmental impacts. A short description of each component in the product system follows.
Product
The product component consists of all materials in the final product.
The product component consists of all materials in the final product. Every form of these inputs in each life cycle stage is included. For example, the product component for a simple wooden spoon consists of the tree, stumpage, and unused branches from raw material acquisition; lumber and waste wood from milling; the spoon, wood chips, and sawdust from manufacturing; and the discarded spoon in a municipal solid waste landfill. If this waste is incinerated, gases, water vapor, and ash are produced. The product component of a complex product such as an automobile consists of a wide range of materials. These may be a mix of primary (virgin) and secondary (recycled) materials. The materials in new or used replacement parts are also included in the product component. Some materials, such as plastics, contain energy that could be recovered by combustion. This energy is embodied in the material. The remaining three components of the product system share common categories of subcomponents:
-
Facility or plant Unit operations or process steps Equipment and tools Labor Direct and indirect material inputs Energy
Labor is not just manual work. It also includes all physical and mental tasks that earn wages.
Life Cycle Framework and Principles
Process Processing transforms materials and energy into a variety of interProcessing transforms mediate and final products. The process component includes direct and indirect materials used to make a product. Catalysts and solvents are ex- materials and energy into a variety of intermediate and amples of direct process materials. They are not significantly incorpofinal products. rated into the final product. Plant and equipment are examples of indirect material inputs for processing. Resources consumed during research, development, testing, and product use are included in processing.
Distribution Distribution consists of packaging systems and Lransportation networks used to contain, protect, and transport products and process mate rials. Transportation networks include modes and routes. Trains, trucks, ships, airplanes, and pipelines are some major modes of transport. Material transfer devices such as pumps and valves, carts and wagons, and material handling equipment (forklifts, crib towers, etc.) are part of the distribution component. Storage facilities, such as vessels and warehouses are necessary for distribution. Selling a product is also considered part of distribution. This includes both wholesale and retail activities. The distinction between process and distribution may not always be clear. For example, it may be more logical to classify a pipe within a single piece of process equipment as part of the process component. Also, cement mixing is a process that takes place in a truck during delivery.
Management Management responsibilities include administrative services, financial management, personnel, purchasing, marketing, customer services, legal services, and training and education programs. Office equipment, such as computers and photocopiers, supports management functions. The management component also develops information and provides it to others in the life cycle. Information is a key element of life cycle design. Even so, its importance is often overlooked. Reducing environmental impacts and risks depends on developing and using accurate information. The need for information extends throughout design. Marketing, labeling, and similar activities are included in information provision.
Materials and energy are transferred between life cycle stages and locations via distribution.
Chapter 2
f
1
Resource Conservation
i.,i I
Pollution Prevention
Sustainable Ecosystems
[
Viable Economic Systems
Environmental Equity
Figure 2-3. lnterrelatlonshlpof Llfe Cycle Design Goals
2.3 GOALS The primary environmental objective of life cycle design is to reduce the total impacts and health risks caused by product development and use. This objective can only be achieved in concert with other life cycle design goals. Life cycle design seeks to:
Lie cycle design seeks to reduce the total environmental burdens associated with product systems.
Conserve resources Prcvent pollution Support environmental equity Preserve diverse, sustainable ecosystems Maintain long-term, viable economic systems Figure 2-3 demonstrates how the goals of life cycle design are linked.
Resource Conservation There could be no product development or economic activity of any kind without available resources. Except for solar energy, the supply of resources is finite. Efficient designs conserve resources. In this way, impacts caused by material extraction and related activities throughout the life cycle are also rcduced.
Life Cycle Framework and Principles
Pollution Prevention Pollution is any by-product or unwanted residual produced by human activity. In contrast to managing pollution after it has been produced, pollution prevention focuses on reducing or preventing pollution at the source. This is the most direct means of reducing the complex impacts caused by pollution. Pollution prevention is a multi-media means of reducing impacts. It preserves the quality of air, land, and water simultaneously. Pollution prevention can often be cost effective because it minimizes raw material losses, the need for expensive end-of-pipe solutions, and long-term liability. Designing pollution out of product systems also reduces the possibility that impacts will be shifted between media or life cycle stages.
Environmental Equity Enormous inequities in the dismbution of resources continue to exist between developed and less-developed countries. Inequities also occur within national boundaries. A significant fraction of the world has only limited access to the basics needed for survival. This sometimes happens even when resources are locally abundant. Pollution and other impacts from production are also unevenly distributed [4]. Studies show that low-income communities in the US are often exposed to higher health risks from industrial activities than are higher-income communities [5]. Inconsistent regulations in the US lead to different definitions of acceptable risk levels for workers and consumers [6]. In addition, acceptable levels of environmental impacts and health risks vary greatly in different countries. Short-sighted corporations add to inequities when they locate manufacturing operations in less-developed countries to take advantage of inadequate environmental regulations. Inequities may also develop over time. Wasting resources or heedlessly creating pollution can burden future generations with the impacts of past consumption. Inequities can easily be created between generations when resources and functioning ecosystems are only assigned present value.
Sustainable Ecosystems Resource conservation, pollution prevention, and equitable distribution of risks help preserve diverse, sustainable ecosystems. In general,
Pollution is most effectively prevented in the earliest Stages of design.
Chapter 2 sustainability measures the ability of a system to maintain itself over time. Sustainable ecosystems are the planet's life support system. It is a mistake to believe that basic human needs can be met without relying on healthy, functioning ecosystems. Sufficient food, potable water, clean air, and adequate shelter and clothing are all derived from the biosphere.
Viable Economic Systems A heavily polluted, resource poor. ecologically degraded world in which human health is severely compromised cannot be considered sustainable in any sense. Products should therefore be designed to balance human resources, natural resources, and capital in order to achieve pollution prevention, resource conservation, and ecosystem sustainability. Limited-growth economies and stable or declining populations may well be a necessary condition for economically sustainable systems [7]. From a long-term perspective, increasing the value added to products is far wiser than promoting increased production and consumption. Material goods and other traditional aspects o f wealth may be a poor substitute for the physical and emotional well being of individuals within society.
References 1. Sellers. V. R., and J. D. Sellers. 1989. ComparativeEnergy and h i r o n mental Impactsfor Soft Drink Delivery Systems, Franklin Associates.
Prairie Village, KS. 2. Arthur D. Little. 1990. Disposable versus Reusable Diapers: Health, Environmental and Economic Comparisonr, Arthur D. Little. Inc.. Cam-
bridge, MA. 3. Mekel. 0.C. L.. and G. Huppes. 1990. Envirolvnental Effects qfDifferent Package S y s t mfor Fresh Milk Center for Environmental Studies. University of Leiden, Leiden,The Netherlands. 4. US EPA. 1992. Environmental Equicy: Reducing Rkk for AIICommunities, Volwne I : WorkgroupReport to Administrator, US Environmental Protection Agency, Washington, DC EPA230-R-92-008. 5. US EPA. 1992. Environmental Equity: Reducing Risk for A11 Communities, Volume2: Supporting Document, US Environmental Protection Agency. Washington. DC. EPA230-R-92-008A. 6. Rodricks, Joseph V., and Michael R. Taylor. 1989. Comparison of Risk Management in US Regulatory Agencies. Journal of Hazardous Maerials 21: 239-253. 7. Meadows, Donella H. 1992. Beyond Limits: Co@onting GIobal Collapse, Envisioning a Sustainable Future. Mills. VT:Chelsea Green.
Chapter 3
THE DEVELOPMENT PROCESS
Lie cycle design is a framework, not a set of rules. Designers are invited to adapt the ideas and guidelines contained here to their own styles
Design actions translate life cycle goals into high-quality, low-impact product systems. A seemingly infinite number of design methods have been proposed [ l , 21. Supporters of formal methods assume that following a detailed process results in better design, but no one seems to have actually tested this belief [2]. In practice, each designer chooses comfortable tools and combines various design procedures as they see fit. Recognizing that no single method has universal appeal, this manual offers guidelines rather than prescriptions. Life cycle design is a framework, not a set of rules that everyone must follow in precisely the same way. Development teams interested in reducing the environmental impacts of their designs are invited to adapt the ideas and guidelines contained here to their own styles.
3.1 DEVELOPMENT ACTIVITIES
Unless life cycle goals are embraced by devebpment teams. true life cycle design is impossible.
As Figure 3-1 shows, product development is complex. Many elements in the diagram feed back to others. This emphasizes the continual search for improvement. Life cycle goals are located at the top to indicate their fundamental importance. Unless these goals are embraced by the entire development team, true life cycle design is impossible. Management exerts a major influence on all phases of develop ment. Both concurrent design and total quality management provide models for life cycle design. In addition, appropriate corporate policy, strategic planning, and measures of success are needed to support design projects. Research and development discovers new approaches for reducing environmental impacts. The state of the environment provides a context for design. In life cycle design, current and future environmental needs are translated into appropriate designs. A typical design project begins with a needs analysis, then proceeds through formulating requirements, conceptual design, preliminary design, detailed design, and implementation. During the needs analysis, the purpose and scope of the project are defined, and customers are clearly identified.
The Development Process
1
LIFE CYCLE FRAMEWORK ANDGOALS
5(Chapter 2 )
MANAGEMENT (Chapter 3 )
Concurrent design Life cycle quality Measures of success
Team coordination Policy and strategy
TECHNICAL DEVELOPMENTS
LIFE CYCLE STRATEGIES (Chapter 5 )
H
STATE OF ENVIRONMENT
Environmental (Chapter 6 )
(discontinue
Cost (Chapter 7 )
Decision Making
(-)discontinue +
Figure 3-1. Llfe Cycle Design Process
)-(-t
Chapter 3 Needs are then expanded into a full set of design criteria that includes environmental requirements. Design alternatives are proposed to meet these requirements. Strategies for satisfying environmental requirements are presented in chapter 5. The development team continuously evaluates alternatives throughout design. Environmental analysis tools are presented in chapter 6. If studies show that requirements cannot be met or reasonably modified, the project should end. Successful designs balance environmental, performance, cost, cultural, and legal requirements. Critical decisions must be made when developing requirements and evaluating designs. Appendix D presents two popular decision-making models. Finally, designs are implemented after final approval and closure by the development team. The following discussion of the development process begins with management before outlining other key activities shown in the shaded boxes in figure 3- 1.
Management Successful life cycle design projects depend on commitment from all levels of management. Innovative managers already follow practices that are fundamental to life cycle design, but some may need to expand their actions to include environmental factors. Because life cycle design is compatible with the best management practices, these slight modifications should ultimately benefit the company.
The Development Process Concurtent Design Life cycle design is a logical extension of concurrent manufacturing, a procedure based on simultaneous design of product features and manufacturing processes. In contrast to projects that isolate design groups from each other. concurrent design brings participants together in a single team [3]. By having all actors in the life cycle participate in a projecl from the outset, problems that develop between different disciplines can be reduced. Product quality can be improved through such cooperation. Efficient teamwork can also reduce development time and lower costs. Assembling a multi-discipline p u p at the beginning of a project makes it easy to gather information from many sources as early and often as necessary during design. Life cycle design does not require that all team members keep in daily contact. The participation of individual members will vary substantially during the course of a project. Some individuals may only offer advice or assist with reviews. Even so, insights offered by these team members can be vital to project success. When the skills and knowledge of many disciplines are available during all stages of a project, members of the development team are not overwhelmed by the task of including environmental criteria in their design. Box 3-A shows how various members of the design team can participate.
By involving all life cycle actors in design, problems that develop different disciplines can be
Chapter 3
BOX3-A .
ROLE OF PARTICIPANTS IN LIFE CYCLE DESIGN
LIFE CYCLE PARTICIPANTS
Accounting
Assign environmental costs to products accurately; calculate hidden, liability, and less tangible costs
Advertising
Inform customers about environmental attributes of product
Community
Understand potential impacts and benefits; define and approve acceptable plans and operations Design distribution systems that limit packaging and transportation while ensuring protection and containment
Environmental, Health and Safety staff
Ensure occupational, consumer, and community health and safety; provide environmental information for other participants
Government regulators, Standards organizations
Develop policy, regulations, and standards that support life cycle design goals
Industrialdesigners
Create a design concept that meets environmental criteria while also satisfying all other important functions
Legal
Interpret statutes and promote pollution prevention to minimize cost of regulation and possible future liability
Management
Establish corporate environmental policy and translate into operational programs; establish measures for success; develop corporate environmental strategy
Like TOM, life cycle design focuses on long-term goals
Life Cycle Quality Life cycle design considers environmental aspects to be closely linked with quality. Companies who look beyond quick profits to focus on customers, multidisciplinary teamwork, and cooperation with suppliers provide a model for life cycle design. The life cycle framework expands these horizons to include societal and environmental needs. It may thus either build on total quality management, or be incorporated in a TQM program. Because the evolution of total quality management has interesting parallels to environmental design, a brief history may be instructive. Prior to World War 11, most industries assured quality through vigorous inspection. Such efforts reduced the number of defective products sold to customers. However, by waiting to find defects until after manufac-
The Development Process
BOX3-A. (continued) ROLE OF PARTICIPANTS IN LIFE CYCLE DESIGN LIFE CYCLE PARTICIPANTS
Give designers feedback on existing products and demand for alternatives; promote design of low-impact products Process engineers
Design processes to limit resource inputs and pollutant outputs
ProcurementPurchasing
Select suppliers with demonstrated low- impact operations; assist suppliers in reducing impacts of their operations to ensure steady supply at lower costs
Production workers
Maintain process efficiency; ensure product quality; minimize occupational health and safety risks Provide information about needs and environmental preferences; offe feedback on design alternatives
Research and Development staff
Perform basic and applied research on impact reduction technology c product innovations
Service
Help design product system to facilitate maintenance and repair
Suppliers
Provide manufacturers with an environmental profile of their goods
Waste Management Professionals
Offer information about the fate of industrial waste and retired consumer products and options for improved practices
ture, inspection produced scrap and rework that wasted materials, energy, and money. One of the first statistical quality control methods for improving normally operating processes was developed and tested in the 1930s [4]. This method was more efficient than inspection, and was soon applied to manufacturing. Interest in evolving statistical methods was greatest in Japan during the fifties [5]. Although process control is still important, it quickly became apparent that quality required more than conlrols. Models for an expanded vision of total quality were developed by innovative Americans in the 1950s and thereafter [6-81. These focused attention on management's crucial role in cutting the costs of poor quality and delivering appropriate products to satisfied customers. Unfortunately, this work received little attention in the US until recenlly.
Chapter 3
Designing waste out of products conserves resources and reduces costs and liabilities.
In life cycle design, the environment is also seen as a customer. Continuous improvement and satisfaction of all customers are key principles of life cycle design.
A successful design project draws on the skills of all team members while balancing their diverse interests.
Methods for creating quality products have been refined over time. Japanese experts added an emphasis on teamwork and continual assessment and improvement. Quality function deployment, which makes the customer the prime driver in product development, also contributed to the total quality movement [9, 101. TQM increasingly focuses on ensuring quality and value at the earliest stages of design [11.12]. Efforts to protect the environment followed a similar evolution. End-of-pipe controls and clean-up strategies echo the early testing and inspection programs for quality assurance. Statistical quality controls are much like waste minimization; both concentrate on improved processing rather than product changes. The advent of TQM with its expanded interest in other aspects of the business suggests the broad scope of pollution prevention. Through emphasis on designing quality into products, the latest versions of TQM prepare the way for life cycle design. In life cycle design, the environment is also seen as a customer. Pollution and other impacts are quality defects that must be reduced. Because the environment supports all life, pursuing harmful actions for short-term gain threatens a firm's existence. Ultimate success depends on preserving environmental quality while satisfying traditional customers and employees. For this reason, environmental requirements are integrated into life cycle design at the very beginning of a project.
Team Building and Coordination Team building may seem beyond the reach of small companies at first. However, genuine teamwork provides dividends for firms of all sizes. Teams do not have to be large, and organization need not be complex or formal. Unless a company is fortunate enough to have a single individual who extracts and refines materials; designs, makes, and assembles all parts and products; and then manages to perform marketing and dismbution duties, design requires working with many others. This cooperation takes place both within and outside every company, regardless of size. Skillfully managing the diverse talents involved in a design project is the f i t step toward achieving excellence. Beyond ensuring that a design project is well-run, managers also set policy, develop measures of success, and plan strategy. Policy Company policies that support pollution prevention, resource conservation, and other life cycle principles foster life cycle design. Although a step in the right direction, vague environmental policies may not be much help. To benefit design projects. a firm's environmental policies must be specific and clearly stated. Management should offer
The Development Process objectives and guidelines that are detailed enough to provide a practical framework for the actions of designers and others in the company.
strategy Strategic planning positions companies for the future. Planners can support life cycle design through an awareness of programs that help their company reach its environmental goals. Government agencies are now forming partnerships with companies in several areas that affect corporate strategy. The US EPA's 33/50 Program and Green Lights Program are examples of this new approach. There can be many advantages to such voluntary pollution prevention programs. By meeting regulations proactively, firms avoid time consuming and expensive command-and-control actions. Life cycle design can be a key element in improved relations between regulators and companies. Strategic planning that promotes life cycle design should also: Identify and plan reduction of a company's environmental impacts Include all impacts before and after development in planning Discontinue/phase out product lines with unacceptable impacts Invest in research and development of low-impact technology Invest in improved facilities/equipment Recommend regulatory policies that assist life cycle design Educate and train employees in life cycle design Details of these activities will not be discussed here. Each requires several layers of planning. For example, a decision to cease production can also include job placement and refraining programs. Labor should have an active role in such planning. Government and other players in the life cycle can also ease transitions and help prevent permanent job loss. Beyond the duties mentioned above, strategic planners need to balance current and anticipated demands. For example, planning hazardous waste disposal capacity begins with knowing current generation rates. Estimates of future waste generation require calculating the effect pollution prevention actions will have on reducing waste from anticipated production. Knowledge gained through this process may point the company in new directions. Strategic planning for life cycle design can seem overwhelming when different time cycles affecting product system components are considered. The relative frquency and phase of some of these cycles are shown in Figure 3-2 for a hypothetical case.
~ ~policies ~ should be clear and specific. Proper guidelines support life cycle designs.
i
Chapter 3
Business Cvcle recovery
inflation
recession
Product Life Cycle
R & D production
termination
service
lnventow Turnover
Process Life
Equipment Life maintenance cycle
Facility Life
Useful Life of Product
Cultural Trends (fashion obsolescence)
Regulatory Change
-
Technological Innovation
Environmental Impacts acute
chronic
Figure 3-2. Relative Time Scales Affecting Hypothetical Product System
The Development Process Environmental impacts and health effects from pollution occur on different time scales. Acute exposures to toxics generally produce immediate effects within 24 hours, while chronic exposures may not cause demonstrable illness for several years. Similarly, global environmental consequences such as ozone depletion and climate change cannot be assessed immediately. In the case of raw material supplies, certain nonrenewable resources may only be available for several decades. The consequences of present profligacy may thus be transferred to future generations. Because times scales are incongruous for different elements of the product system, successful design is a complex activity. Although challenging, understanding and coordinating time scales can be a key element in improved design. More traditional aspects of strategy a h affect a Iife cycle design project. Effective planning requires correctly assessing company strengths, capabilities, and resources [13]. Companies must have access, either within or outside the f m ,to the required technology and skills before embarking on a project. In addition, successful products must fit a firm's management, production, and sales and distribution abilities [14]. Lofty plans for low-impact products will not benefit a fm unless they can actually be implemented. Many companies are also under pressure to shorten development times. This is due in part to competition to continuously bring new products to market. Strategic planning must balance these factors with the need to meet life cycle goals.
Because time scales are incongruous for different aspects of a product, it is important to properly coordinate time scales in design.
Measures of Success The progress of design projects should be clearly assessed with appropriate measures to help members of the design team pursue environmental goals. To ensure accuracy, measures for life cycle design should include both environmental and financial indicators. Consistent measures of impact reduction in all phases of design help make analysis more accurate. The key to assessing specific impacts and assigning costs properly is a tracking system that identifies and quantifies material flows for each product. Such systems for impact analysis and accounting procedures are discussed in chapters 6 and 7. Companies may measure progress toward stated goals in several ways. Verbal estimates can quaIify results, or results can be calculated with numbers. In either case, life cycle design is likely to be more successful when environmental aspects are part of a f m ' s incentive and reward system. Even though life cycle design can cut costs, increase performance, and lead to greater profitability, it may still be necessary
Measures of success should include both environmental and financial indicators. Some rewards and promotions have to be based on environmental performance, or people will focus on other areas of the business.
Chapter 3 to include discrete environmental aspects when measuring an individual's performance. If companies claim to follow sound environmental policies, but never reward and promote people for reducing impacts, managers and workers will naturally focus on other areas of the business.
Needs Analysis
Adding the environment to an exploration of customer needs helps designers focus on appropriate actions.
Life cycle design seeks to satisfy significant customer and societal needs in a sustainable manner. Avoiding confusion between trivial desires and actual needs is a key function of life cycle design.
A development project should fmt clearly identify customers and their needs. Design can then focus on meeting those needs. Ideas that lead to design projects come from many sources. In some companies, research and development provide discoveries that may prompt a needs analysis. Many successful companies base ideas for new or improved products on research into customer desires. When customer satisfaction drives design, projects begin in several ways. Marketing clinics or surveys gather vital feedback on current products that can be used in new designs. Clinics also offer opportunities to test new, lower-impact products. In addition, ongoing product reviews within a company can help evaluate performance, market share, and other key factors such as fashion changes. Environmental audits or regulatory reviews are also sources of ideas for design projects. Either process can uncover opportunities for impact reduction. Environmental audits can range from a full life cycle analysis to an assessment of a single process. Major impacts identified through audits can then be targeted for design improvement. Proposed or anticipated regulations may also prompt a design project. However, projects focusing solely on compIiance can be inefficient. For this reason, it is wise to balance all needs in a design project.
Identifying significant needs Unless life cycle principles shape the needs analysis, development projects may not create low-impact products. By including the environment in the set of customers that must be satisfied, designers will be motivated to focus on appropriate actions. For example, designs based on continued high levels of consumption and material use are contradictory to life cycle design goals and are best not pursued. Elevating perceived convenience over all other needs also invites environmental hann. In addition, improvement of a high-impact products that at best satisfy minor needs is not the most productive use of life cycle design. Instead, a needs analysis may recommend discontinuing such products.
The Development Process After all, environmental impacts can be substantially reduced by ending production of questionable product lines. Life cycle development projects properly focus on filling significant customer and societal needs in a sustainable manner. Avoiding confusion between trivial desires and actual needs is a major challenge of life cycle design.
Define Scope of Design Project Once significant needs and initial ideas for a design project have been identified, the project's scope can be defined. This entails choosing system boundaries, characterizing analysis methods, and establishing a project time line and budget. Although later discoveries may modify the original plan, it is useful at this early stage to decide whether the project will focus on modifying an existing product, creating the next generation model. or developing a new product. In choosing an appropriate system boundary, the development team must initially consider the full life cycle from raw material acquisition to the ultimate fate of residuals. More resmcted system boundaries may be justified by the development team. Beginning with the most comprehensive system, design and analysis can focus on the:
Defining the project scope indudes choosing system boundaries, characterizing analysis techniques, and establishing a project timeline and budget.
full life cycle, partial life cycle, or individual stages or activities. Choice of the full life cycle system will provide the greatest opportunities for impact reduction. In some cases, the development team may confine analysis to a partial life cycle consisting of several stages, or even a single stage. Stages can be omitted if they are static or not affected by a new design. As long as designers working on a more limited scale are aware of potential upstream and downstream impacts, environmental goals can still be reached. Even so, a more restricted scope will reduce possibilities for design improvement. A decision about the type of environmental analysis needed for the project should accompany the choice of system boundaries. Regardless of the life cycle system chosen, analysis can be both quantitative or qualitative. Detailed analysis can proceed through all life cycle stages, or less rigorous methods can be used. Ultimately, the development team's ability to evaluate design alternatives will depend directly on the accuracy and thoroughness of the environmental analysis. Further details on project scope and environmental analysis are given in chapter 6.
Design and analysis of the full life cyde system will provide the greatest opportunities for impact reduction.
Chapter 3 After a project has been well-defined and seems worth pursuing, a project time line and budget should be proposed. Life cycle design requires funds for environmental analysis of designs. Managers should recognize that budget increases for proper environmental analysis can pay dividends in avoided costs and added benefits that outweigh the initial investment. Establish Baseline Life Cycle Data Comparative analysis, also referred to as benchmarking, shows whether a design is an improvement over the competition. Benchmarking typically compares cost and performance; in life cycle design it includes environmental criteria. To be useful, the life cycle framework and type of analysis used for benchmarking should match those chosen during the needs analysis. Environmental analysis tools are discussed in chapter 6.
Requirements Requirements may be the most critical aspect of design. They define the expected outcome and help designers translate needs into effective products.
Successful development teams place requirements before design. Rushing into design before objectives are fully defined by requirements invites failure.
Formulating requirements may well be the most critical phase of design. Requirements define the expected outcome. Whenever possible, requirements should be stated in detail to help the design team translate the needs statement into an effective solution. Design usually proceeds more efficiently when the solution is clearly bounded by wellconsidered requirements. In later phases of design, alternatives are evaluated on how well they meet requirements. Although some designers are ready to produce concepts before fully understanding project objectives or customer needs, successful development teams place requirements before design. It is important to spend enough time to develop proper requirements. Rushing to set requirements before research discloses suitable design functions can easily produce incomplete or vague requirements that lead to product failure [15]. All requirements do not have to be stated in the same detail at the beginning. It may be best to develop critical design functions into prototypes before stating final requirements. While work in critical areas proceeds, less vital requirements may remain in written form. This spiral model of development allows more flexibility and can produce better results [16]. Similarly, decisions made during the needs analysis can be modified during the more detailed requirements phase. Such feedback and iteration is a necessary element of design.
The Development Process This manual focuses on environmental requirements. Incorporating environmental requirements into the earliest stage of design can reduce the need for later corrective action. This proactive approach enhances the likelihood of developing a lower-impact product. Pollution control, liability, and remedial action costs can be greatly reduced by developing environmental requirements at the outset of a project. Life cycle design seeks to integrate environmental requirements with traditional performance, cost, cultural, ind legal requirements. All requirements must be properly balanced in a successful product. A lowimpact product that fails in the marketplace benefits no one. The next chapter discusses requirements in more detail.
Design Phases
This manual focuses on environmental requirements.
Early integration of environmental requirements is the key to life cyde design. All requirements must be properly balanced in a successful product. A lowimpact product that fails in the marketplace benefits no one.
The remaining phases of development are familiar to designers. They are not significantly altered by the environmental aspects of life cycle design. During these phases, the development team synthesizes requirements into a coherent design. Because life cycle design is based on concurrent practices, these phases are not fully distinct. Activities in several phases will be occuning at the same time. Diagrams help members of the development team understand what is happening in other disciplines. Charts and other graphics normally used by the various groups can be shared with the whole team to aid evaluation. Box 3-B shows a few examples of the types of graphics that can assist design teams.
BOX3-8. TYPES OF Energy & Material balance flowsheets Organizationalchart
I
DIAGRAMS USEFUL IN PRODUCT SYSTEM DEVELOPMENT
Show the composition and rate of material and energy flows Identifies members of the development team and shows their responsibilities
Plot plan
A map of the geographical location of life cycle stages and substages used for siting facilities, identifying suppliers, and planning distribution networks
Process control
Details the basic instrumentation and control elements
Process flowsheet
Tracks material and energy flows through a sequence of process steps or unit operations
Chapter 3 Concepts In the concept phase, innovative ways to meet requirements are proposed. Even in improvement projects, creative insights should be encouraged to avoid basing all design activity on past experience. Concepts generated in this phase are then screened to determine their feasibility. Preliminary Design More detailed synthesis and analysis are required to select the best concepts. During this phase, design is decomposed into product system components and life cycle substages. Details of the design can only be fixed with enough certainty to carry out rigorous analysis after several alternatives have been developed in sufficient detail. At this point, life cycle analysis of competing solutions can proceed in various depths. Depending on product complexity, prototypes of either parts or an entire product may be constructed in this phase of design to aid evaluation. If significant problems develop during preliminary design, backtracking to the concept stage may be necessary. Knowledge gained during this phase may also reveal conflicting aspects of the initial requirements that are difficult to resolve. When this occurs, a return to the requirements phase for additional research or modified ranking helps clarify issues and increases the chances of a successful outcome. Detailed Design The final details of the best alternative are worked out in this stage. Detailed drawings, engineering specifications, and final process design are then completed. Advice from manufacturing employees and customers can be particularly useful during detailed design, especially when prototypes are available for examination. Such reviews help ensure that design objectives have been translated correctly or modified to meet changing conditions. Before implementation, the design is compared to benchmark products. Final evaluation should clearly identify both strengths and weaknesses that are likely to impact on product success. Minor problems revealed at this point can still be corrected. Formal closure occurs when all life cycle participants support and approve a final detailed design.
The Development Process
Implementation After formal approval, designs are implemented. Implementation includes production and distribution along with marketing and labeling. Building or planning infrastructure and recommending policy changes to regulators is also a part of implementation. As figure 3-1 shows, design actions don't end at this point. Product development is a continuous process. Existing products, even if newly implemented, should be viewed as the starting point for new initiatives.
Limitations Several factors present barriers to the full pursuit of life cycle design. As discussed in chapter 6, lack of data and models for determining life cycle impacts make analysis difficult. In addition, lack of motivation may also limit life cycle design. Public pressure, regulatory requirements, competitive advantage, and avoiding liability provide incentives for reducing impacts within that portion of the life cycle controlled by individual players, but interest can rapidly dwindle when the scope is broadened to other participants. Similarly, a design action that reduces total impacts may increase local impacts. Under these circumstances, it may be very difficult for an individual participant to justify bearing the consequences while others benefit. This can be particularly true when shareholders, local interests, or regulators are not aware of the design's full life cycle benefits.
Chapter 3 References Jones. J. Christopher. 1980. Managing Design Methoh. New York: John Wiley and Sons. Finger. Susan, and John R. Dixon 1989. A Review of Research in Mechanical Engineering Design. Part I: Descriptive, Prescriptive, and ComputerBased Models of Design Processes. Research in Engineering Design 1: 51-67. Whitney, D. E. 1988. Manufacturing by Design. Harvard Business Review Jul-Aug: 83-91. Shewhart, Walter A. 1986. Statistical Method From the Viewpoint of Quality Control. New York: Dover. (originally published 1939 by USDA) Derning, W. Edwards. 1952. Elementary Principles of the Statistical Control of Quality: A Series of h t u r e s . Tokyo: Nippon Kaguku Gijutsu Remmei. -. 1982. Quality, Productivity and CompetitivePosition. Cambridge. MA: MIT Center for Advanced Engineering Study. Juran, J. M. 1988. Jurm on Planning for Quality. New York: McMillan. Feigenbaum. A. V. 1991. Total Qualify Control. New York: McGraw-Hill. Ishikawa, Kaoru . 1986. Guide to Quality Control. Tokyo: Asian Productivity Organization. Kogure. Masao. and Yoji Akao. 1983. Quality Function Deployment and CWQC in Japan. Quality Progress 16 (10): 25-29. Akao, Yoji. Akira Harada. and Kazuo Malsumoto. 1990. Quality Function Deployment and Technology Deployment. Quality Function Deployment: Integrating Customer Requirements Into Product Design, editor. Yoji Akao. 149-179. Cambridge, MA: Productivity Press. Shindo, Hisakazu, Yasuhiko Kubota, and Yuritsuga Toyourni. 1990. Using the Demanded Quality Deployment Chart. Quality Function Deployment: Integrating Customer Requirements Into Product Design, editor. Yoji Akao, 2749. Cambridge. MA: Productivity Press. Oakely, Mark. 1984. Managing Product Design. New York: Wiley Hollins, Bill. 1989. Successful Product Design: What to Do Md When. Boston: Butteworth. Cause, Donald G., and Gerald M. Weinberg. 1989. Requirements: Quality Before Design. New York: Dorset House. Boehm, Barry W. 1988. A Spiral Model of Software Development and Enhancement. Cornpurer 221 (5): 61-72.
Process
..
INPUTS OUTPUTS
Distribution
..
WUTS OUTPUTS
Chapter 4
DESIGN REQUIREMENTS 4.1 FORMULATING REQUIREMENTS Requirements define product systems that satisfy societal needs efficient'yand equ'aMy. They are the crucial bridge between the needs statement and later design actions.
In life cycle design, requirements define product systems that satisfy societal needs efficiently and equitably. Requirements are the crucial bridge between the needs statement and later design actions. A well-conceived set of requirements translates project objectives into a solution space for design. In addition lo setting the boundaries for design, requirements are also used to evaluate alternatives. Environmental aspects are critical to overall product system quality. For this reason, environmental requirements should bc developed at the same time as performance, cost, cultural, and legal criteria.
Key Elements Requirements in life cycle design, as in other forms of design, contain the following elements [I]: Requirements should state what a design does, not how this is accomplished.
People knowledgeable about each area of the aid product in developing requirements. Such diversity often results in fewer casual assumptions.
Functions describe what a successful design does. Functions should state what a design does, not how it is accomplished. Attributes are descriptions of design functions in more detail. Constraints are conditions that the design must meet to satisfy project goals. Constraints are limits that restrict the design search to manageable areas.
Proper requirements are the result of considerable research and analysis. A clkar focus on customer and societal needs usually produces better products. People knowledgeable about each area of the product system should aid in developing requirements. Such diversity often results in fewer casual assumptions. Teamwork also makes it easier to address all critical aspects of the product system. Requirements may be developed more quickly when the design team splits into groups that concentrate on just one area, such as cost or performance. When smaller groups are formed, all team members . should maintain close communication. Periodic meetings of the entire team are necessary to review proposed requirements. Customers and
Design Requirements other players in the life cycle should also be included during some reviews. This helps ensure that customer needs have not been obscured by assumptions or poor interpretations. Designers use many different methods to develop proposed requirements. Some groups feel comfortable with brainstorming sessions, while others choose to develop black box scenarios (given these conditions or inputs, the design will do x). In any case, a blend of rational analysis and creative thinking helps identify critical functions.
Scope and Detail The level of detail expressed in requirements depends on the scope of the design project. Proposed requirements for a new product are usually less detailed than requirements adopted for improving an existing product. The life cycle framework adds another dimension to project scope. Development teams should consider the full life cycle when proposing requirements. Research during the needs analysis and requirements phase should explore preferred life cycle scenarios for the design. By sketching out the expected, best-case. and worst-case pathways from acquisition of natural resources to the ultimate fate of product system residuals, requirements can be developed that favor the lowest-impact scenarios. When appropriate, requirements may then focus on only a portion of the life cycle. The Dividends of Thoroughness Regardless of the project's nature, the expected design outcome should not be overly restricted or too broad. Requirements defined too narrowly eliminate attractive designs from the solution space. On the other hand, vague requirements lead to misunderstandings between potential customers and designers while making the search process inefficient [I]. Details of all necessary design functions will not be known when requirements are first developed. Discoveries made during later stages of design should be used to modify the original requirements statement. This type of feedback can be critical to project success. Although it may be necessary to rely on many qualitative descriptions when formulating preliminary requirements, the design team should not cut comers in this phase. It can be dangerous to assume that major oversights will be dealt with later. When too little time is devoted to developing excellent requirements, a design project can proceed along a mistaken path. Such false starts delay the discovery of
Requirements for a new product are usually less detailed than those set to for an improvement project. But regardless of project type, teams should consider the full life cycle when proposing requirements.
Details of all necessary design functions will not be known when requirements are first developed. Discoveries made during later stages of design should be used to modify original requirements.
Design teams should not cut corners in the requirements phase. Oversights are far more common and likely to be disastrous when requirements are set too quickly.
critical elements. Mistaken assumptions may also shape design until it is too late or too expensive to develop the proper product [I, 21. Surprises are unavoidable in any development project, but they are far more common and likely to be disastrous when requirements are compiled too hastily. Activities through the requirements phase typically account for 1015%of total product development costs [3]. Yet decisions made at this point can determine 50- 70% of costs for the entire project [3,4]. Figure 4-1 provides one version of how product development costs are allocated. Box 4-A shows how costs in development can be cut by proper requirements. This software example uses different terminology for design phases than found here. Yet it still demonstrates the benefits of discovering and solving problems at the earliest stage of development.
Sales
Market Research 7%
L
Manufacturing
45.5%
Flgure 4-1. Product Development Costs Source: [3]
Design Requirements
BOX4-A.
RELATIVE COST TO FIX AN
ERROR AT VARIOUS POINTS
Requirements Design Coding Development Tests Acceptance Tests Operation
I
1 3-6 10 15-40 30-70 40-1000
Source: [5]
Use of Requirements Matrix Matrices allow product development teams to study the interactions between life cycle requirements. Matrices are also an effective means of organizing data for later analysis and evaluation. Using the same types of matrices to develop requirements and later evaluate designs makes each task simpler. Information presented in a consistent manner may also seem clearer. This can be a key aid in good design. Figure 4-2 shows a multi-layer matrix for developing requiremenls. The matrix for each type of requirement contains columns that represent life cycle stages. Rows of each matrix are formed by the product system components described in Chapter 2: product, process, distribution, and management. Each row is subdivided into inputs and outputs. Elements canthen be described and tracked in as much detail as necessary. The requirements matrices shown in Figure 4-2 are strictly conceptual. Practical matrices can be formed for each class of requirements by further subdividing the rows and columns of the conceptual matrix. For example, the manufacturing stage could be subdivided into suppliers and the original equipment manufacturer. The distribution component of this stage might also include receiving, shipping, and wholesale activities. Retail sale of the final product might best fit in the distribution component of the use phase. There are no absolute rules for organizing matrices. Development teams should choose a format that is appropriate for their project. Figure 4-3 is a further illustration of how categories in the matrix can be subdivided. This example shows how each row in the environmental matrix can be expanded to provide more detail for developing requirements.
Requirements may focus on only a podion of the cycle, when appropriate.
Chapter 4
Design Requirements Product
Inputs Materials Energy (embodied) outputs Products, co-products, 8 residuals
Process
Inputs Materials direct: process materials indirect: 1st level (equipment 8 facilities) 2nd level (capital 8 resources to produce 1st level) Energy: process energy (direct 8 indirect) People (labor) outputs Materials (residuals) Energy (generated)
Dlstributlon
Inputs Materials packaging transportation direct (e.g. oil 8 brake fluid) indirect (e.g. vehicles and garages) Energy packaging (embodied) transportation (BtuRon-mile) People (labor) outputs Materials (residuals)
Management
Inputs Materials, office supplies, equipment 8 facilities Energy People Information outputs Information Residuals
Flgure 4-3. Example of Subdivided Rows for Environmental Requirements Matrix 45
Chapter 4
4.2 TYPES OF REQUIREMENTS
Environmental Environmental requirements should minimize: Environmental goals should be translated into clear requirements that help identify and constrain environmental impacts.
raw materials consumption energy consumption waste generation health and safety risks ecological degradation By translating these goals into clear functions, environmental requirements help identify and constrain environmental impacts and health risks. As discussed in chapter 2, environmental requirements should also address environmental equity. Box 4-B lists issues that can help development teams define environmental requirements. This manual cannot provide detailed guidance on environmental requirements for each business or industry. Although the lists in Box 4-B are not complete, they introduce many important topics. Depending on the project, teams may express these requirements as numbers or verbal descriptions. For example, it might be useful to state a requirement that limits solid waste generation for the entire product life cycle to a specific quantity or weight. In addition to criteria discovered in the needs analysis or benchmarking, government policies can also be used to set requirements. For example, the Integrated Solid Waste Management Plan developed by the EPA in 1989 targets municipal solid waste disposal for a 25% reduction by 1995 [6]. Other initiatives, such as the EPA's 33/50 program are aimed at reducing toxics. It may benefit companies to develop requirements that match the goals of this program. It can also be wise to set environmental requirements that exceed government statutes. Designs based on such proactive requirements offer many benefits. Major modifications dictated by regulation can be costly and time consuming. In addition, such changes may not be consistent with a firm's own development cycles, creating even more problems that could have been avoided.
Design Requirements
Box 4-8 ISSUES TO CONSIDER
WHEN DEVELOPING ENVIRONMENTAL REQUIREMENTS
Materials Amount (intensiveness) Type Direct product related process related Indirect fixed capital (bldg. & equipment) Source Renewable forestry fishery agriculture Nonrenewable metals nonmetals
Character Virgin Recovered (Recycled) Reusable/Recyclable Useful Life Resource base factors location locally available regionally available scarcity - threatened species - reserve base quality composition - concentration managemenVrestoration practices - sustainability
-
Impacts associated with extraction, processing, and use Residuals Energy Ecologicalfactors Health and safety
-
Energy
Amount (energy efficiency) T~pe Purchased Process by-product Embodied in materials
Source Renewable wind solar hydro geothermal biomass Nonrenewable fossil fuel nuclear
Character Resource base factors location scarcity quality managemenvrestoration practices Impacts associated with extridction. pmssing, and use Materials Residuals Ecologicalfactors Health and safety Net energy
Chapter 4 OX 4-8 ( CN.)
ISSUES TO CONSIDER WHEN DEVELOPlffi ENVIRONMENTAL REQUIREMENTS
Residuals
Type Solid waste solid semi-solid liquid Air emissions gas aerosol particulate Waterborne dissolved suspended solid emulsified chemical biological
Characterization Nonhazardous constituents amount Hazardous constituents toxicity concentration amount Radioactive potencyhalf life amount concentration
Environmentalfate Containment Degradability (physical, biological, chemical) Bioaccumulation MobilitylTransport mechanisms atmospheric surface water subsurfacelgroundwater biological Treatment~Disposal impacts - residuals - energy - materials - health & safety effects
Ewlogical Factors
Type of ewsystems impacts Physical (disruption of habitat) Biological Chemical
Ewlogical stressors Diversity Sustainability Rarity Sensitive species
Scale Local Regional Global
Human Health and Safety
Populatbn at risk Workers Users Community
Toxicologicalcharacterization Morbidity Mortality Exposure routes - inhalation skin contact - ingestion duration frequency
-
Nuisance effects Odors Noise Accidents TYP~
Design Requirements
Performance Performance requirements define the functions of product systems. Functional requirements range from size tolerances of parts to time and motion specifications for equipment. Typical performance requirements for an automobile include fuel economy, maximum driving range, acceleration and braking capabilities, handling characteristics, passenger and Performance requirements define the functions of storage capacity, and ability to protect passengers in a collision. product systems. Compatibility of components should also be addressed in performance. This includes making sure component interfaces fit and do not cause harmful reactions. Life cycle designs need to offer a high level of performance to satisfy customer needs. However, desired performance is limited by technical factors. Practical performance limits are usually defined by best available technology. Absolute limits that products may strive to achieve are set by thermodynamics or the laws of nature. Noting the technical limits on product system performance provides designers with a frame of reference for comparison. Other limits on performance also need to be understood. In many cases, process design is constrained by existing facilities and equipment. This affects many aspects of process performance. It can also limit product performance by restricting possible materials and features. When this occurs, the success of a major design project may depend on upgrading or investing in new technology. Useful life of product systems is often a key element of performance. In many cases, useful life strongly influences how well product Useful life is often a key element of performance. systems meet life cycle goals. Environmental impacts of a design should be measured per unit of service or time. When impacts are normalized on this basis, products with widely varying useful lives can be properly compared. Designers should also be aware that customer behavior and social trends affect product performance. Innovative technology might increase performance and reduce impacts, but possible gains can be erased by increased consumption. For example, automobile manufacturers Inadequate products are doubled average fleet fuel economy over the last twenty years. Howretired quickly for more ever, gasoline consumption in the US remains nearly the same because capable ones. Development programs more vehicles are being driven more miles. that fail to produce Although better performance may not always result in environmenproducts with superior tal gain, poor performance usually produces more impacts. Inadequate performance therefore products are retired quickly in favor of more capable ones. Developcontribute to excess waste ment programs that fail to produce products with superior performance generation and resource therefore contribute to excess waste generation and resource use. This use.
Chapter 4 is true even when environmental criteria are integrated into the earliest stages of development
Cost
Most people will not choose a low-impact product unless it is offered at an attractive price. Cost requirements should therefore help designers add value to the product system.
Meeting all performance and environmental requirements does not ensure project success. Regardless of how environmentally responsible a product may be, most people will choose another if it cannot be offered at a competitive price. In some cases, a premium can be charged for significantly superior environmental or functional performance, but such premiums are usually limited. Modified accounting systems that fully reflect environmental costs and benefits are important to life cycle design. With more complete accounting, many low-impact designs may show financial advantages. Chapter 7 discusses methods of life cycle accounting that can assist in developing requirements. Cost requirements should help designers add value to the product system. These requirements can be most useful when they include a time frame (such as total user costs from purchase until final retirement) and clearly state life cycle boundaries. Parties who will accrue these costs, such as suppliers, manufacturers, and customers should also be identified. Cost requirements need to reflect market possibilities. Value can be conveyed to customers through estimates of a product's total cost over its expected useful life. Total customer costs include purchase price, consumables, service, and retirement costs. In this way, quality products are not always judged on least fust cost, which addresses only the initial purchase price or financing charges.
Cultural
Cultural requirements define the shape, form, color, texture, and image that a product projects. Successful cultural requirements enable the design itself to promote an awareness of how it reduces impacts.
Cultural requirements define the shape, form, color, texture, and image that a product projects. Low-impact designs must satisfy cultural requirements to be successful. Material selection, product finish, colors, and size are guided by consumer preferences. These choices have direct environmental consequences. However, because customers usually do not know about the environmental consequences of their preferences, creating pleasing, environmentally superior products is a major design challenge. Successful cultural requirements enable the design itself to promote an awareness of how it reduces impacts.
Design Requirements Cultural requirements may overlap with others. Convenience is usually considered part of performance, but it is smngly influenced by culture. In some cultures, convenience is elevated above many other functions. Cultural factors may thus determine whether demand for perceived convenience and environmental requirements conflict.
Legal Requirements Local, state, and federal environmental, health, and safety regulations are mandatory requirements. Violation of these requirements leads to fines, revoked permits, criminal prosecution, and other penalties. Both companies and individuals within a firm can be held responsible for violating statutes. In 1991, people convicted of violating environmental regulations served prison terms totaling 550 months [7]. Firms may also be liable for punitive damages. Federal regulations are administered and enforced by agencies such as the Environmental Protection Agency (EPA), Food and Drug Administration (FDA), and the Consumer Product Safety Commission (CPSC). Appendix B contains a brief overview of the major federal environmental laws. The responsibility for enforcing many federal programs has been delegated to the states; the federal government grants this authority and maintains oversight. Individual states may also have their own set of environmental statutes that must be met in design. Environmental professionals, health and safety staff, legal advisors, and government regulators can identify legal issues for life cycle design. Principal local, state, and federal regulations that apply to the product system provide a framework for requirements. Specific details can be defined as other design requirements are fixed. Legal requirements vary in complexity depending on the type of product system. For example, hwmdous materials are subject to many statutes over a life cycle. To begin with, chemical manufacturers of hazardous substances must file a Premanufacture Notification (PMN) under the Toxic Substances Control Act (TSCA) as part of the application process for approval of new chemical products. Environmental releases from subsequent manufacturing are mainly regulated under the Resource Conservation and Recovery Act (RCRA), Clean Air Act (CAA). Clean Water Act (CWA), and Emergency Planning and Community Right to Know Act (EPCRA). Transporters of hazardous materials must then comply with the Hazardous Materials Transportation Act
Regulations are must requirements.
Chapter 4
Legal requirements must meet or exceed all applicable laws where the product will be sold. They should also address both pending and proposed regulations likely to be enacted.
developed joinlly by EPA and the Department of Transportation. Finally, consumer products must meet the Federal Hazardous Substances Labeling Act. In addition to such national programs in the US, political boundaries may also affect regulations. For example, some cities have imposed bans on certain materials and products. Regulations also vary dramatically among countries. For this reason, legal requirements should meet and exceed all applicable laws where the product will be sold. Although essential, familiarity with the full range of applicable regulations may not be enough to ensure excellent legal requirements. Whenever possible, legal requirements should also take into account pending and proposed regulations that are likely to be enacted. Such forward thinking can prevent coslly problems during manufacture or use while providing a competitive advantage.
Example of Partial Matrix The following example illustrates how part of a requirements matrix might be filled in. Requirements in this hypothetical example are proposed for the next generation of a consumer refrigerator. Only requirements for the use stage of the life cycle are shown in Boxes 4-C through G. This is just a sample of possible requirements. In this example, requirements are slated generally without numerical constraints. An actual project would likely set more requirements in greater detail. The requirements outlined here demonstrate some of the conflicts that arise in design. For example, increasing insulation in the walls and door reduces energy use, but it can also increase material use and waste on disposal while reducing usable space. If cultural requirements dictate that refrigerators must fit in existing kitchens and maintain a certain usable space, energy-saving actions that increase wall thickness might be precluded. Also, CFCs are usually more efficient than alternatives that do not deplete ozone. Replacing CFCs might increase energy use.
Design Requirements
hx 4-C. SOME USE~SERVICEREQUIREMENTS FOR REFRIGERATORS ENVIRONMENTALMATRIX Product Material type 4 a s e d on a materials inventory of componentslparts (refrigeratorhezer compartments, refrigeration system, compressor, condenser, evaporator, fans, electric components) eliminate high impad materials: substitute for CFC-12 with lower ozone depleting potential and global warming potential alternatives Material amount reduce material intensiveness: specdy Ibs of material Residual~pecifiedin Retirement stage Process Energy reduce energy use: specify energy consumption for compressor, fans, anti-sweat heaters (average yearly energy use) Pecple noise: specify frequency and maximum loudness Residuals reduce waste: specify systems for recovering refrigerant during service; specify level of refrigerant loss during normal use and service; requirements for reuse, remanufacture, recycle of components are stated in Retirement Stage Distribution Material type reduce impacts associated wlh packaging materials: specify low impact materials Material amount reduce material intensiveness of packaging: specify Ibs of material Energy conserve transportation energy: specify constraints on energy associated with delivery Residuals reduce packaging waste: specify reusable, recyclable packaging reduce product waste: specify maximum amount of damaged products during distribution
Management Information provide consumers with information on energy use: meet DOE labeling requirements for energy efficiency
Chapter 4
3 0 4-D. ~ SOME USE/SERVICE REQUIREMENTS FOH REFRIGERATORS PERFORMANCE MATRIX Product Material dimensions: H x W x D; capacity - cu. ft.; shelf area; usable storage space features: ice making; meat keeping; crisper humidity Process Material identify best available technology for refrigeration system components as a practical limit to performance specify useful life of product and components specify reliability specify durability Energy identify thermodynamic limits to performance (e-g. maximum efficiency determined by temperatures inside and outside the refrigerator) specify temperature control: balance, uniformity, compensation Dlstrlbutlon Material specify product demand specify installation time and equipment requirements specify packaging requirements for protection and containment Energy specify location of retail outlets relative to market Management Informathn specify minimum information requirements for owner's manual specify warranty period
Design Requirements bx 4-E. soME US~SERVICEREQUIREMENTS FOR REFRIGERATORS COST MATRIX Product Material Retail price Cost for replacement parts Process Material and Labor Service costs (cost for service and parts) Energy Electricity ($ - kWh/yr) Distribution Material, Energy and Labor Delivery and installation cost Residuals Packaging disposal cost Management Information Manufacturer's guarantee Payback period to user for purchasing more expensive energy efficient unit
-
OX
-
4-F. SOME US~SERVICEREQUIREMENTS FOR REFR~GERATORS CULTURAL MATRIX Product Material Color preferences Size (dependent on frequency of shopping/convenience) Finishes and materials (affects cleaning, appearance) Process Material Manual vs. automatic defrost Compartmentalization ability to organize food Residuals Food spoilage - ability to control temperature
-
Management Information instructions clearly written
Chapter 4
)OX 4-G. SOME USE/SERVICE RMUIREMENTS FOR REFRIGERATORS
LEGAL MATRIX Product Material Consumer Product Safety Commission Montreal Protocolfor discontinuing the use of CFCs. TSCA (Refrigerants meet regulations for use) Process Energy National Appliance Energy Conservation Act--January 1.1993 (maximum energy consumption rate = E = 16.0 AV + 355 kWhQr (AV = adjusted volume of top mounted refrigerator)) Distrlbutlon Residuals Packaging: German Take Back Legislation; Community recycling ordinance Management information FTC guidelines on environmental claims DOE labeling requirements for energy efficiency
Design Requirements
Organizing When the review process concludes that all necessary functions of the design have been described and false assumptions or omissions have been avoided, priority should be assigned to the various requirements. Ranking and weighting distinguishes between critical and merely desirable traits. After assigning requirements a weighted value, they should be ranked and separated into several groups. An example of a useful classification scheme follows:
Ranking and weighting distinguishes between criiical and merely desirable traits.
Must requirements are conditions that designs have to meet. No design is acceptable unless it satisfies all must requirements. Want requirements are less important. but still desirable traits. Want requirements help designers seek the best solution. not just the frrst alternative that satisfies mandatory conditions. These criteria play a critical role in customer acceptance and perceptions of quality.
Ancillary functions are low-ranked in terms of relative importance. They are relegated to a wish list. Designers should be aware that such desires exist. But ancillary functions should only be expressed in design when they do not compromise more critical functions. Customers or clients should not expect designs to reflect many ancillary requirements. Once must requirements are set, want and ancillary requirements can be assigned priority. There are no simple rules for weighting requirements. Assigning priority to requirements is always a difficult task, because different classes of requirements are stated and measured in different units. Judgements based on the values of the design team must be used to arrive at priorities. The process of making trade-offs between types of requirements is familiar to every designer. Asking How important is this function to the design? or What is thisfunction worth (to society, customers, suppliers, etc.)? is a necessary exercise in every successful development project. Even when all team members actively help set priorities, there is no guarantee that final requirements will accurately reflect project objectives. As an example, customers or other life cycle players may claim that virtually everything they want is absolutely necessary. Similarly,
There are no simple rules for weighting requirements. Assigning prioriiy to requirements is always a difficult task, because different classes of requirements are stated and measured in different units.
Chapter 4
The ranking process helps designers be more productive by defining where the design effort should be concentrated.
some team members might strongly favor requirements in their own area of expertise while downgrading others. Cooperation during the requirements phase helps reduce these difficulties. Systematic methods for decision making can assist the design team with vital ranking duties. Two commonly used decision-making methods are briefly presented in Appendix D. After requirements have been ranked, an assessment of the results will reveal how successful the development team has been in properly defining the expected project outcome. This ranking process helps designers be more productive by defining where the design effort should be concentrated. Most design projects seek to reduce requirements to minimum. A limited set of design functions is easier to understand and translate into final products. However, this necessary duty should not be canied to excess. Design may be easier with few requirements, but the resulting product is more likely to fail because critical functions have been overlooked.
Resolving Conflicts
Development teams can expect conflicts b h w e n requirements. The absence of amflicts usually indicates that requirements are defined too loosely.
Development teams can expect conflicts between requirements. If conflicts cannot be resolved between must requirements, there is no solution space for design. When a solution space exists but it is so restricted that little choice is possible, must requirements may have been defined too narrowly. The absence of conflicts usually indicates that requirements are defined too loosely. This produces cavernous solution spaces in which virtually any alternative seems desirable. Under such conditions, there is no practical method of choosing the best design. In all of these cases, design teams need to redefine or assign new priorities to requirements. If careful study still reveals no solution space or a very restricted one, the project should be abandoned. It is also risky to proceed with overly broad requirements. Only projects with practical, well-considered requirements should be pursued. Successful requirements usually result from resolving conflicts and developing new priorities that more accurately reflect customer needs.
Design Requirements
CONFUCTS
Substituting plastics for steel in automobiles may produce conffis between , requirements for fuel economy, safety, solid waste generation, and durability. This example will focus on fuet economy md solid waste. Reduction in vehicle size and weigbt account for roughly haw the improvement in new car fuel economy achieved since 1974 (fuel economy increased from 14 mpg in 1973 to 28 mpg in 1991). A 10% weight redudion results in an estimated 7% increase in fuel economy on the highway and a 4% improvement in the city (81. An increased number of parts made of plastic rather than stesl helped drive some of this decline in vehicle weight Reduction in material intensiveness . and downsizing are atso responsible for weight reduction, The curb weight of an average car declined 25% since 1974, from over 4,100 Ibs to abauf 31 00 Ibs. 191 Plastics are estimated to account for 7% of total automobile weight, or abut 230 pounds. Atthough plastics help reduce vehicle weight, many automotive plastics are not recovered at present. Plastic use thus contributes to increasedsolid waste generation on . disposal The plasticcontentof autamobile shredder residue or Y luff" has been increasing steadily. If plastics cannot be practically recovered before or during shredding, Increased plastic content in automobile hulks muld make shredding uneconomical, especially if fluff is dassified as a hazardous waste. Without shredding operations, waste praduced from aufo disposal will greatly Increase. '
Chapter 4 References 1. Gause, Donald G., and Gerald M. Weinberg. 1989. Requirements: Q w l i f y
Bt$ore Design. New York: Dorset House. 2. Oakely, Mark. 1984. Managing Product Design. New York: Wiley 3. Hollins. Bill. 1989. Successful Product Design: What to Do and When. Boston: Butterworth. 4. Fabrycky, Wolter J. 1987. Designing For the L i e Cycle. Mechanicul Engineering 109 (1): 72-74. 5. Boehm. Bany W. 1981. S o m e Engineering Economics. Englewood Cliis, NJ: Prentice-Hall. 6. Municipal Solid Waste Task Force. 1989. The Solid Wasre Dilemma: An Agenda for Action, US EPA Office of Solid Waste, Washington, DC. 7. Allen, Frank Edward 9 December 1991. Few Big F i Get Jail Time for Polluting. The Wall Street Journa&B, 1. 8. Bleviss. Deborah L. 1988. The New Oil Crisis and Fuel Economy Technologies. Westport C T Quorum Books. 9. National Highway Traffic Safety Administration. 1991. Automotive Fuel Economy Program, Fifteenth Annual Report to Congress, US Department of Transportation. Washington, DC.
Chapter 5
DESIGN STRATEGIES 5.1 OVERVIEW Effective strategies can only be selected after project objectives are translated into requirements. Deciding on a course of action before the destination is known can be an invitation to disaster. Strategies fbw from requirements, not the reverse.
Shartcuts for bw-impact designs may focus on a favorite strategy, such as recycling. In life cyde design, no coned answer is assumed for all projects. Appropriate strategies satisfy the entire set of design requirements.
One strategy is not likely to satisfy the full set of requirements. For that reason, most development projects should adopt a range of strategies.
Presented by themselves, strategies may seem to define the goals of a design project But effective strategies can only be selected after project objectives are translated into requirements. Although it may be tempting to pursue an inmguing strategy for reducing environmental impacts at the outset of a project, deciding on a course of action before the destination is known can be an invitation to disaster. Strategies flow h m requirements, not the reverse. Shortcuts for low-impact designs may focus on a favorite strategy, such as recycling. In life cycle design, no correct answer is assumed for all projects. Appropriate strategies satisfy the entire set of design requirements, thus promoting integration of environmental requirements into design. For example, essentid product performance must be preserved when design teams choose a strategy for reducing environmental impacts. If performance is degraded, the benefits of environmentally responsible design may only be illusory. In addition, impacts on the health and safety of workers and customers must also be considered when choosing a strategy. Design teams need to investigate health and safety effects throughout the product life cycle so they can avoid inadvertently increasing these risks while pursuing other environmental goals. The following general strategies may be followed to fulfill environmental requirements: Product System Life Extension Material Life Extension Material Selection Reduced Material Intensiveness Process Management Efficient Distribution Improved Management Practices
Most of these strategies reach across product system boundaries. Product life extension strategies can also be applied to equipment used
Design Strategies in processing, distribution, and management. Similarly, process design strategies are not limited to manufacturing operations. They are also useful when product use depends on processes. For example, the drive train of an automobile functions like a miniature industrial plant with a reactor, storage tanks, electric power generator, and process control equipment. Process strategies can thus lower environmentat impacts caused by automobile use. The following sections present impact and risk reduction strategies. It is unlikely that a single strategy will be best for meeting all environmental requirements. One strategy is even less likely to satisfy the full set of requirements. For that reason, most development projects should adopt a range of strategies. Examples offered here demonstrate specific strategies; they do not necessarily ill us^ the best life cycle design practices.
Examples offered here demonstrate specific Smtegies; they do not necessarily illustrate the best life cycle design pradicas.
5.2 PRODUCT SYSTEM LIFE EXTENSION Extending the life of a product can directly reduce environmentat impacts. In many cases, longer-lived products save resources and generate less waste, because fewer units are needed to satisfy the same needs. Before pursuing this strategy, designers should understand useful life. Usefd life measures how long a system will operate safely and meet performance standards when maintained properly and not subject to stresses beyond stated limits [I]. Measures of useful life vary with function. Some common measures are: number of uses or duty cycles length of operation (i.e. operating hours, months, years, or miles) shelf life The life of products such as clothes washers or switches that perform standard functions during each operation is best described by number of uses. This helps distinguish between two products of equal age that have experienced different numbers of duty cycles. Length of operation is a more accurate method of defining useN life for products that operate continually with little variation, such as water heaters. Operating time also is the best measure for products with unpredictable duty cycles. such as light bulbs. Similarly, useful life of automobiles can be measured in miles driven. Chemicals, adhesives, and some consumables can degrade before they perform any useful function. Shelf life may be the most appropriate measure of useful life for such products.
Extendingthe lie of a product can directly reduce environmental impacts. In many cases, bnger-lived products save and generate less waste, because fewer units are needed to satisfy the same needs.
Rerirement is the defining event of useful life. Reasons why products are no longer in use include: technical obsolescence fashion obsolescence degraded performance or structural fatigue caused by normal wear over repeated uses environmental or chemical degradation damage caused by accident or inappropriate use A product may be retired for fashion or technical reasons, even though it continues to peaform its design functions well. Clothing and furniture are often retired prematurely when fashions change. Technical obsolescence is common for electronic devices. Users may also be forced to retire a product for functional reasons. Normal wear can degrade pedormance until the product no longer serves a useful puxpose. Repeated use can also cause structural deformation and fatigue that finally result in loss of function. Some products are exposed to a wide variety of environmental conditions that cause corrosion or other types of degradation. Such biological or chemical stresses can reduce performance below a critical level. This type of decay may also cause products to be retired for aesthetic reasons, even though they continue to perform adequately. Accidents or incorrect use also cause premature retirement. Poor design or failure to consider unlikely operating conditions may lead to accidents. Some of these events can be avoided through better operaring instructions or warnings. Understanding why products are retired helps designers extend product system life. To achieve a long service Me, designs must successfully address issues beyond simple wear and tear. A discussion of specific strategies for product life extension follows. A durable product continues to satisfy customer needs over an extended life. Impacts caused by products should be divided by estimated useful life. Such normalized figures allow designers to properly compare competing products.
Appropriately Durable Durable items can wirhsrand wear, stress, and environmental degradation over a long useful we.
A durable product continues to satisfy customer needs over an extended life. Some design actions may make a product more durable without the use of additional resources. However, enhanced durability may depend on increased resource use. When this happens, impacts that result from using more resources should be divided by the estimated in-
Des@nStrategies rrease in useful life. Impacts are thus assigned on a per use or time basis. Designerscan then comparethese normalized figures with thoseh m competing products to assess whether total impacts are reduced. Chapter 6 discusses such analysis tools in more detail. Development teams should enhance durability only when appropriate. Designs that allow a product or component to last well beyond its expected useful life are usually wasteful. Products based on rapidly changing technology may not always be proper candidates for enhanced durability. If a simple product will soon be obsolete, making it more durable could be pointless. In complicated products subject to rapid change, adaptability is usually a better saategy. For example, modular consauction allows easy upgrading of fastchanging components without replacing the entire product. In such cases, useful life is expected to be short for certain components, so they should also not be designed for extreme durability. In addition, materials should only be as durable as needed. Some materials that increase product life by resisting decay may increase waste and other impacts on disposal. Understanding the ultimate fate of materials helps designers avoid choosing permanent materials for temporary functions, unless they can be recovered for continued use. Durable designs must also meet other project requirements. When least first cost is emphasized, durable products may encounter market resistance. Even so, durability is often associated with highquality products. For example, garden m l s with reinforced construction can withstand higher stresses than lowerquality alternatives and thus generally last longer. Although these tools are initially more expensive, they may be cheaper in the long run because they do not need to be replaced as frequently. Enhanced durability can be part of a broader strategy focused on marketing and sales. For some durable products, leasing may be more successful than sale to customers. Leasing can be viewed as selling services while maintaining control over the means of delivering those services. Durabiity is an integral part of all profitable leasing. Original equipment manufacturers who lease their products usually have the most to gain from durable designs.
Chapter 5
Adaptable Adaptable designs either allow continual updating or they perform several different functions. Modular components allow single-function products to evolve and improve as needed. Adaptability can extend the useful life of products that quickly become obsolete. To reduce overall environmental impads, a sufficient portion of the existing product must usually remain after obsolete parts are replaced.
As previously mentioned, adaptability can extend the useful life of products that quickly become obsolete. Products with several parts are the best candidates for adaptable design. To reduce overall environmental impacts, a sufficient portion of the existing product must usually remain after obsolete parts are replaced. Adaptable designs rely on interchangeable components. Interchangeability controls dimensions and tolerances of manufactured parts so that componentscan be replaced with minimal adjustments or on-site modifications [I]. Thus. fittings, connectors, or information formats on upgrades are consistent with the original product. For example, an adaptable s m g y for a new razor blade design would ensure that blades mount on old handles so the handles don't become part of the waste stream. Adaptable design may be particularly beneficial for processes and facilities. ?his strategy allows rapid response to changing conditions through continual upgrades. Such adaptable manufacturing may make it much easier to offer low-impact products that meet customer demands. A well-designed system helps save suitable plant and equipment for continued use.
Desgn Strategies
Reliable Reliability is often expressed a s a probability- It measures the ability of a system to accomplish its design mission in the intended environment for a certain period of time. Reliability is a major aspect of quality. Reliable designs thus have a better chance for market success. Environmental impacts are also related to reliability. Unreliable products or processes, even if they are durable, are often quickly retired. Customers will not tolerate untrustworthy performance, inconvenience, and expense for long. Unreliable designs can also present safety and health hazards. The number of components, the individual reliability of components, and configuration are important aspects of reliability. Parts reduction and simplified design can increase both reliability and manufacturability. Simpler designs may also be easier to service. AU these factors can reduce resource use and waste. Aside from environmental benefits, producers and customers can save money with reliable products. Reliability cannot always be achieved by reducing parts or making designs simple. In some cases, redundant systems must be added to provide needed backup. When a reliable product system requires parallel systems or fail-safe components, costs may rise significantly. As always, reliable designs must meet a l l other project requirements. Reliability should be designed into products rather than achieved through later inspection. Screening out potentially unreliable products after they are made is wasteful because such products must either be repaired or discarded. In both cases, environmental impacts and costs increase.
Reliability is a major aspect of quality. Unreliable products or processes, even if they are durable. are often quickly retired.
Reliability should be designed into p d u d s rather than achieved through later inspection.
Chapter 5
Serviceable A serviceable system can be adjusted for optimum performance under controlled conditions. This capacity is retained over a specjfied life.
Many complex products designed to have a long useful life require service and support. When designing serviceable products. the team should first determine who will provide the service. Any combination of original equipment manufacturers, dealers, private business, or cusWhen designing tomers may service a product. Designers should target service needs to sewiceable products, the team should first determine the appropriate group. Types of tools and the level of expertise needed who will provide the to perform tasks strongly influences who is capable of providing service. service. In any case, simple procedures are an advantage. Design teams should also recognize that equipment and an inventory of parts are a necessary investment for any service network. Service activities may be broken into two major categories: maintainability and repairability. MalntalnaMe The relative difficulty or time required to maintain a certain level of system performance determines whether that system can be practically maintained.
Maintenance includes periodic, preventative, and minor corrective actions. Proper maintenance helps to conserve resources and prevent pollution. For example, tuning an automobile engine improves fuel economy while reducing toxic tailpipe emissions. On the other hand, delaying or ignoring maintenance can damage a product and shorten its useful life. Designers wishing to create product systems that are easy to maintain should address the following topics: downtime, tool availability, personnel skills complexity of required procedures potential for error accessibility to parts, components, or system to be maintained frequency of designdictated maintenance This is not an exhaustive list, but it identifies some key factors affecting maintenance. Most of these criteria are interrelated. If maintenance is complex, speclaltzed personnel are required, downtime is likely
Des@nStrategies to be long, and the potential for error increases. Speciality tools also make maintenance less convenient Similarly, if parts or components are not readily accessible, complexity and costs can increase. Spatial arrangement is the key to easy access. Critical parts and assemblies within a piece of equipment should be placed so they can be reached and the necessary procedures performed. Simpler designs are usually easier to maintain. Maintenance schedules should balance a variety of requirements. For an automobile, changing motor oil every 500 miles would obviously be wasteful, but changing oil every 50,000 miles would damage the engine. Customers usually believe that the less often maintenance is required the better, so designs that preserve peak performance with minimal maintenance are likely to be more papular. In addition, lowmaintenance deigns are more likely to stay in service longer than less robust designs. Products dependent on continual readjustments for an acceptable level of performance are generally considered lowquality. Such products can be wasteful, and they are not likely to gain much market share.
Repairable Repairability is determined by the feasibility of replacing dysfwctional parts and returning a system to operating condition. A two-step process is usually followed when a product needs repair. First, a diagnosis identifies the defect Then, several questions critical to resource management should be asked:
Should the product be repaired or retired? Are other components near the end of their useful life and likely to fail soon? Should the defective component be replaced with a new, remanufactured, or used part? Answers to these questions should take into account life cycle consequences. Factors relating to downtime, complexity, and accessibility are as important in repair as they are in maintenance. Easily repQired products also rely on interchangeable and standard parts. Interchangeabilityusually applies to parts produced by one manufacturer. Standardization refers to compatible parts made by different manufacturers. Standardization makes commonly used parts and assemblies conform to accepted design standards [I].
Chapter 5
Use of standard parts designed to codes established by numerous manufacturers greatly aids repair. Designs that feature unique dimensions for common parts can confound normal repair efforts. Speciality parts usually require expanded inventories and extra training for repair people. In the burgeoning global marketplace, following proper standards enables practical repair. Cost also determines repairability. If normal repair is too expensive, practical repairability does not exist. Labor, which is directly related to complexity and accessibility, is a key factor in repair costs. When labor is costly, only relatively high-value items will be repaired. However, a substantial purchase price is not enough to promote repairability. Designs that impede repair may still be retired prematurely regardless of initial investment. As in maintenance, infrequent need, ease of intervention, and a high probability of success lower operating costs, increase customer satisfaction, and translate directly into perceptions of higher quality. Repairable designs need proper after-sale support. Firms should offer information about trouble-shooting, procedures for repair, tools required, and the expected useful life of components and parts.
Remanufacturable Remanu&cnving is an industrial process that restores worn products to like-new condition. In afactory, a retired product isfirst completely disassembled. Its usable p m s are then cleaned, rejkbished, and put into inventory. Finally, a new product is reassembled from both old and new parts, creating a unit equal in performance and expected life to the original or a currently available alternative. In contrast, a repaired or rebuilt product usually retains its identity, and only those parts that have failed or are badly worn are replaced [5]. Industrial equipment or expensive not subject to rapid change are the best candidates for remanufacture.
Other
Industrial equipment or other expensive products not subject to rapid change are the best candidates for manufacture. Typical remanufactured products include jet engines, buses, railcars, manufacturing equipment, and office furniture. Viable remanufacnning systems rely on the following factors [6]: a sufficient population of old units (cores) an available trade-in network low collection costs storage and inventory inhstruchlre
Desgn Strategies Design teams must fmst determine if enough old units will exist to support remanufacturing. Planning for proper marketing and collection after retirement helps ensure a sufficient population of cores. To remain competitive with new products, the cost of cores must be low. 'Costs for collecting cores includes transport and a trade-in to induce customer re-
m. Systems for collecting and storing the needed number of cores at competitive prices support remanufacturing. But no remanufacturing program can succeed without design features and strategies such as: ease of disassembly sufficient wear tolerances on Qitical parts avoiding irreparable damage to parts during use interchangeability of parts and components in a product line Designs must be easy to take apart if they are to be remanufactured. Adhesives, welding, and some fasteners can make this impossible. Critical parts must also be designed to survive normal wear. Extra material should be present on used parts to allow refinishing. Care in selecting materials and arranging parts also helps avoid excessive damage during use. Design continuity increases the number of interchangeable parts between different models in the same product line. Common parts make it easier to remanufacture products.
Chapter 5
Reusable Reuse is the a d d i t i o ~ use l of an item after it is retiredfrom a clearly defined duty. Reformulation is not reuse. However, repair, cleaning. or refurbishing to maintain integrity may be done in transitionfrom one use to the next. When applied to products, reuse is a purely conrparative term. Products with no single-use analogs ore considered to be in service until discarded.
Products only become reusable when a singleuse alternative exists.
The environmental profile of a reusable product does not always depend on the number of expected uses. If the major impacts occur before reuse, increasing the number of uses will reduce total environmental impacts. However, when most impacts occur between uses, increasing the number of duty cycles may have little effect on impacts.
Products only become reusable when a single-use altemative exists. diapers, cloth diapers were not reused as Before the advent of -sable defined above. Rather, they were laundered after wearing, like other clothes. Similarly, cameras wae origmally in use until disposal. They only became reusable when a camera designed to exposejust one roll of film was marketed. Finally, parts in a product may be reused regardless of how the entire product is defined. So, although an automobile is not reused each time it is driven or changes owners, its parts may be recovered for reuse when it is finally retired. Items that will be reused must first be collected after completing their function. They are then retumed to the same or less demanding service without major alterations. Reusable products may undergo some minor processing, such as cleaning, between services. For example. dishware or glass bottles can be washed before reuse. The environmental profile of a reusable product does not always d e pend on the number of expected uses. If the major impacts occur in manufacturing and earlier stages, increasing the number of uses will reduce total environmental impacts. However, when most impacts are caused by cleaning or other steps between uses, increasing the number of duty cycles may have little effect on overall impacts. Convenience is often cited as a major advantage of single-use products. However, customers usually fail to consider the costs and time of purchasing, storing, and disposing single-use products. Single-use products often cost more per use than reusable products. Several environmental comparisons between reusable and singleuse products have been done. These are mostly coflmed to life cycle inventories, which are discussed in the next chapter. Appendix A also provides references of such life cycle analyses. Results are sometimes controversial, but these studies can be consulted by designers exploring a reuse strategy.
Desbn Strategies
5.3 MATERIAL LIFE EXTENSION Recycling Recycling is the reformation or reprocessing of a recovered material. The EPA defines recycling as, "the series of activities,including collection, separation, and processing, by which products or otkr materials are recovered from or otherwise divertedfrom the solid waste stream for use in the form of raw materials in t k mangacture of new products o t k r thanfuel" Ell]
.
Many designers, policy makers, and consumers believe recycling is the best solution to a wide range of environmental problems. Recycling does divert discarded marerial from landfills, but it also causes other impacts. Before designers focus on maldng products easier to recycle, they
Recyding diverts discarded material from landfills, but it also causes other impacts. Before designers focus on making products easier to recycle, they should understand several recycling basics.
Chapter 5 should understand several recycling basics. Types of recovered material, pathways, and infrastructure provide a framework for understanding
recycling. Types of Recycled Material Material available for recycling can be grouped into the following three classes:
home .scrap preconsumer postcomumer
Premnsumer material is usually high quality. P o s t c a ~ ~ m material er is often a much less desirable input for subsequent products.
Home scrap consists of materials and by-products generated and commonly recycled within an original manufacturing process [l 11. Many materials and products contain home scrap that should not be advertised as recycled content. For example, mill broke (wet pulp and fibers) is easily added to later batches of product at paper mills. This material has historicaIly been used as a pulp substitute in paper making rather than discarded, so it is misleading to consider it recycled content. Preconsumer material consists of overmns, rejects, or scrap generated during any stage of production outside the original manufacturing process [ll]. It is generally clean, well-identified, and suitable for highquality recovery. Preconswner material is now recycled in many areas. Postconsumer material has served its intended use and been discarded before recovery. Although many people believe recycling is a postconsumer activity, postconsumer material can be a relatively lowquality source of input for future products.
Recycling Pathways Development teams choosing recycling as an attractive way to meet requirements should be aware of the two major pathways recycled material can follow. closed loop open loop In closed-loop systems, recovered materials and products are suitable substitutes for virgin material. They are thus used to produce the same part or product again. Some waste is generated during each reprocessing, but in theory a closed-loop model can operate for an extended period of time without virgin material. Of course, energy, and in some cases process materials, are required for each recycling.
Desgn Strategies Solvents and other industd process ingredients are the most common materials recycled in a closed loop. Postconsumer material is much more difficult to recycle in a closed loop, because it is often degraded or contaminated. Designs that anticipate closed-loop recycling of such waste may thus overstate the likely benefits. Open-loop recycling occurs when recovered material is recycled one or more times before disposal. Most postconsumer material is recycled in an open loop. The slight variation or unknown composition of such mateaial usually causes it to be downgraded to less demanding uses. Some materials also enta a cascade open-loop model in which they are degraded several times before final discard. For example, used white ledger paper may be recycled into additional ledger or computer paper. If this product is then dyed or not de-inked. it will be recycled as a mixed grade after use. In this form, it could be used for paperboard or packing, such as frays in produce boxes. At present, the fiber in these products is not valuable enough to recover. Ledger paper also enters an open-loop system when it is recycled into facial tissue or other products that are disposed after use.
~nftastnrcture Types of recycled materials, and the major routes they follow provide an introduction to recycling. Infrashucture is the key to understanding how r e c y h g actually occurs. Suitable programs must be in place or planned to ensure the success of any recycling system. Key considerations include: recycling programs and participation rates collection and reprocessing capacity quality of recovered material economics and markets It is not enough to choose materiaIs advertised as recyclable. Such materials may be suitable for theoretical products but little else if recycling programs do not exist. As a first step, people must have access to recycling. When available, recycling programs vary from frequently scheduled curbside collection to public drop-off sites. In most cases. convenience leads to greater participation rates. Industrial recycling also depends on ease and cost. Recycling may be mare likely when it can be done in-house, rather than through off-sitetransfers. Information about participation rates helps designers predict the fate of retired materials. Collection and reprocessing systems are needed to support recycling. Estimates of present and future capacity should be made in regions
it is not enough to choose materials advertised as recyclable. Such materials may be suitable for theoretical produds but little else if recycling programs do not exist.
Chapter 5 where the design will be sold This information also helps designers detennine the likelihood of recovery for the materials they choose. Statistics about actual recycling practices are a quick way to estimate the impacts of recyclable designs. Recovery rates for materials generated in MSW during 1988 are given in Table 5-1. Some materials, such as plastic, are presently recovered at a very low rate. This is due in part to plastic not being collected as frequently as other items. Until plastic recycling is better established, recyclable designs based on polymers may produce much more postconsumer waste than predicted. Quality of recovered material plays a key role in viable recycling. When recycled material is low quality, demand will falter. Recycling may thus not be possible even if material is delivered to potential users
free. Separation techniques have a major impact on the quality of recovered material. Careful sorting before collection usually produces top quality material. Source separation is easiest for preconsumer material. Achieving the same level of purity for postconsumer material requires a very committed public. Most public programs allow different materials to be mixed, or even try to recover material from unsorted solid waste. Recovery from a mixed source may produce only relatively lowquality material.
Table 51. Generation and Material Recovery of MSW In Miiiions of Tons, 1988 GENERA^
MATERWCLASS
%OFTOTAL
RECOVERED '
Paper, Paperboard Glass Metals Ferrous Aluminum Other Nonferrous Total Metals Plastics Rubber, Leather Textiles Wmd
0.2 0.1
neg. 0.0
Source: [I 21
76
Generated
Desgn Strategies In addition, products or components made of several different materials, each practically recyclable by itself, may present problems. Such products can be impossible to recycle unless individual materials are segregated after reeirement. The recycling rate of several materials combined in a single item is almost never additive. Because many mixed material products are composites, or joined in a complex manner, they cannot easily be recycled. Economic and market factors f d y determine whether a material will be recycled. Markets for some secondary materials may be easily saturated. Recycling programs and high rates of participation address only collection; unless recovered material is actually used, no recycling has occurred. In addition, if a material is not one of the few now targeted for public collection, recovery could be mcult. It may not be possible to create a private collection and reprocessing system that competes with virgin materials. However, if demand for recovered material increases in the future, this will greatly aid collection efforts.
Design Considerations Recycling can be a very effective resource management tool. Under ideal circumstances, most materials would be recovered many times until they became too degraded for further use. Even so, design for recyclability is not the ultimate strategy for meeting all environmental requirements. As an example, studies show that refillable glass bottles use much less life cycle energy than single-use recycled glass to &liver the same amount of beverage (131. When suitable infrastructure appears to be in place, or the develop ment team is capable of planning it, recycling is enhanced by: ease of disassembly material identification simplification and parts consolidation material selection and compatibility
Products may have to be taken apart after retirement to allow recovery of materials for recycling. However, easy disassembly may conflict with other project needs. As an example, snapfit latches and other joinings that speed assembly can severely impede disassembly. In some products, easy disassembly may also lead to theft of valuable components. Material identification markings greatly aid manual separation and the use of optical scanners. Standard markings are most effective when they are well-placed and easy to read. Symbols have been designed by
Recycling can be a very effective resource managementtool- Even SO* design recydability is not the ultimate strategy for meeting all e,.,,,ironmental requirements.
Chapter 5
Waste exchange can be considered a form of recycling. Waste exchange is a computer and catalog network that returns waste materials to manufacturing by matching companies generating specific wastes with companies that can use those wastes as inputs.
the Society of the Plastics Industry (SPI) for commodity plastics. The Society of Automotive Engineers (SAE) has developed markings for engineered plastics. Of course, marked material must still be valuable and easy to recover or it will not be recycled. In addition, labeling may not be useful in systems that rely on mechanical or chemical separation, although it can be a vital part of collection systems that target certain materials or rely on source separation. SimpMc.on and parts wnsolidation can also make products easier to recycle. This is an attractive strategy for many other reasons. As previously mentioned, simple designs also ease assembly and may lead to more robust, higher-quality products. In most projects, material selection is not coordinated with environmental strategies. As a result, many designs contain a bewildering number of materials chosen for combined cost and performance attributes. There may be little chance of recovering material from such coinplex products unless they contain large components ma& of a single, practically recyclable material. When one type of material cannot be isolated in discrete design features, recycling is more likely if all the materials in the feature are compatible. During qmcessing, compatible materials present in moderate amounts do not act as serious contaminants in the final product. Automobile recycling provides a useful example of compatible materials. Steel rolled into thin sheets for auto Wes must be formulated within relatively narrow tolerances. If some ingredients change modestly during recycling, secondary steel can only be used for casting or other less demanding duties. Because aluminum acts as a flux in steel making, it is compatible for recycling when present in moderate amounts. Recycled steel that contains some aluminum can usually still be used for sheeting. On the other hand, copper and tin produce brittleness in steel. Small amounts of copper or tin in recycled steel make it unsuitable for sheeting. Of course, many other criteria need to be considered before making a design choice based solely on compatibility. Some polymers and other materials are broadly incompatible. If such materials are to be recycled for similar use again, they need to be meticulously separated for high purity. Even without separation, some mixtures of incompatible or spe cialty materials can be downcycled At present, several means are available to form incompatible materials into composites. However, the resulting products, such as plastic lumber, may have limited appeal. Designers can aid recycling by reducing the number of incompatible materials in a product For example, a component containing parts composed of different materials could be designed with parts made from the
Desgn Strategies same material. This strategy also applies within material types. Formulations of the same material might have such different properties that they are incompatible during recycling. Designers wiu usually have to make trade-offs when selecting only compatible materials for a product. Making single-material or compatible components may be possible in some cases but not in others.
5A MATERIAL SELECTION Because material selection is a fundamental part of design, it offers many opportunities for reducing environmental impacts. In life cycle design, material selection begins by identifying the nature and source of raw materials. Then environmental impacts caused by material acquisition, processing, use, and retirement are estimated. Depth of analysis. and the number of life cycle stages considered varies with project scope. Finally, proposed materials are compared to determine best choices. When designing modest improvements of existing products or the next generation of a line, material choice may be constrained. Designers may also be restricted to certain materials by the need to use existing plant and equipment. This type of m e s s limitation can even affect new product design. Substantial investment may then be needed before a new material can be used. On the other hand, material substitutions may fit current operations and actually reduce costs. In either case, material choice must meet all project requirements. Reformulation is also an option when selecting materials. Most materials or products may be reformulated to reduce impacts, even when material choice is constrained.
Because material selection is a fundamental part of design, it offers many opportunitiesfor reducing environmental impacts. In life cyde design, material selection begins by identifyingthe nature and source of raw materials. Then environmental impacts caused by material acquisition. processing, use, and retirement are estimated.
Substiiution For a variety of m n s , a currently used material may have to be replaced in design. In most cases, substitutes can readily be found that reduce life cycle impacts but do not conflict with either cost or performance requirements. However, before making a final choice, substitutes must be analyzed for environmental impacts This helps avoid shifting impacts to other life cycle stages. Careful screening can also uncover significant new impacts in other areas that might have been overlooked. Material substitutions can be made for product as well as process materials, such as solvents and catalysts. For example, water-based solvents or coatings can sometimes be substituted for high-VOC alternatives during processing. On the other hand, materials that don't require
Substitutes can frequently be found that reduce life cycle impacts but do not conflict with either cost or performance requirements.
Chapter 5 coating, such as some metals and polymers, can be substituted in the product itself. These material substitutions can address a wide range of issues, such as replacing rare tropical woods in furniture with native species. Of course, the effect of some substitutions may not always be immediately obvious. In addition to changing a product's environmental profile related to material use, many material substitutions may also require process modifications that result in both upstream and downstream consequences.
Reformulation Reformulation is an appropriate strategy when a high degree of continuity must be maintained with the original product.
Reformulation is a less drastic alternative than substitution. It is an appropriate strategy when a high degree of continuity must be maintained with the original product. Consurnablesand other products that must fit existing standards may limit design choices. Rather than entirely replace one material with another, designers can alter percentages to achieve the desired result. Some materials can also be added or deleted if characteristics of the original product are still preserved.
Desgn Strategies
5 5 REDUCED MATERIAL INTENSIVENESS Resource conservation can reduce waste and directly lower environmental impacts. A less material-intensive product may also be Lighter, thus saving energy in distribution or use. Designing to conserve resources is not always simple. Reduced material use may affect other requirements in complex ways. In some cases,using less material affects no other requirements and thus clearly lowers impacts. When the reduction is very simple, benefits can be determined without a rigorous life cycle assessment. However, careful study may be needed to ensure that significant impacts have not been created elsewhere in the life cycle. In addition, impacts might have been reduced further by using another material, rather than less of the current choice.
Resource conservation can reduce waste and directly lower environmental impacts.
5.6 PROCESS MANAGEMENT A variety of process management strategies can be used to reduce environmental impacts. Although process design is an integral part of product development in this manual, process improvements can be pursued outside product development.
Process Substitution Processes that create major environmental impacts should be replaced with more benign ones. This simple approach to impact reduction can be very effective. As always, substitutes should be evaluated within the life cycle M e w o r k to make sure that total impacts are reduced. The effect of process changes on cost and performance must also be assessed.
Akhough process design is an integral part of product development in this manual, process improvements can be pursued outside product development.
Chapter 5
Pmcesses that create major environmental impacts should be replaced with more benign ones. As always, substitutes should be evaluated within the life cycle framework to make sure that total impacts are reduced.
As a first step in reducing impacts, designers should be familiar with the best available technology and equipment to accomplish a processing step. Engineers and designers should also consider chemical, biological, and mechanical alternatives. For example, it may be possible to replace a chemical process with a mechanical one that reduces impacts. Process alternatives should be tested theoretically before they are selected. For chemical processes, this includes determining the stoichiometric balances of reactions to indicate the minimum ratio of byproduct to desired product. Once this information is known, alternative pathways that reduce waste generation or by-product toxicity can be explored The US EPA has published several pollution prevention manuals far specific industries. Each manual reviews strategies for waste reduction and provides checklists. Many of these strategies focus on process substitution. Appendix A contains a list of these resources. More efficient use of process energy and materials are also part of a process substitution strategy.
Desgn Strategies
Process Energy Efficiency Process designers should always consider energy conservation. For example, waste heat can be used to preheat process streams or do other useful work. In addition, energy requirements for pumping may be reduced by using larger diameter pipes to cut down frictional losses. Energy use in buildings may aIso be reduced through more efficient heating, cooling, ventilation, and lighting systems. Architects should design these improvements into new buildings or add them during renovation. Building design is briefly discussed later in this section, under facilities planning. In addition, simcant amounts of energy can be saved by efficient process equipment. Both electric motors and refrigeration systems are prime candidates for improvement. Electric motors alone consume 65 to 70 percent of industrial electricity and more than half the electricity gem erated in the US [21]. Operating a typical motor usually costs from 10 to 20 times the total capital costs of the motor per year. Equipment choices have a major influence on energy use. Highefficiency motors and adjustable-speed drives for pumps and fans are two means of reducing energy consumption. Maintenance and proper sizing of motors can also greatly reduce energy use.
Process Material Efficlency Processes designed to use materials in the most efficient manner reduce both material inputs and waste outputs. The same actions that r e duce material use in products can also produce similar results in process design.
Chapter 5
Process Control Welldesigned process controls can prevent pollution and conserve resources.
Control systems are an integral part of process design. Welldesigned process controls can prevent pollution and conserve resources. Three basic requirements of a control system are: suppressing the influence of external disturbances ensuring process stability keeping process performance within environmental constraints Mathematical models for control can be developed on any scale from the entire life cycle to a single piece of equipment. These models
can then be adjusted to meet environmental needs. Processing can generate a significant amount of waste when products do not fit specifications. Setting appropriate tolerances improves accuracy, thus directly reducing environmental impacts and costs. Several methods can help keep processing defects and waste to a minimum [24,25]. These statistical experiments reveal proper tolerances and allow much more effective process control. Other much less complex actions can also reduce impacts. Installing control devices that switch off equipment not in use is one simple method of conserving resources.
Improved Process Layout Planning the best arrangement of processes within a facility is a complicated task. Layout is the key to achieving efficient operations and reducing risks 6om accidents. The spacing of processing units d a ermines material and energy transfer distances and thus affects efficiency. Layout also influences the success of loss prevention programs by affecting worker health and safety risks. The extent of damage h m industrial fires, explosions, and chemical releases also depends on spatial arrangement. Layout also influences the nature and effectiveness of emergency response. Pollution prevention activititx do not eliminate the need for contingency plans related to industrial accidents. Emergency response is a critical factor in pIant layout and process design.
Inventory Control and Material Handling Improved inventory control and material handling reduces waste from ovefsupply, spills, or deterioration of old stocks. This increases ef-
Desgn Strategies ficiency and prevents pollution. Proper inventory controls also ensure that materials with limited shelf lives have not degraded. Processes can thus run at peak efficiency while directly reducing waste caused by reprocessing. On-demand generation of hazardous materials needed for certain processes is an example of innovative material handling that can reduce impacts. Storage facilities are also an important element of inventory and handling systems. These facilities must be properly designed to ensure safe containment of materials. They should also provide adequate capacity for current and projected needs.
Facilities Planning Environmental strategies for product design can also be applied to facilities and equipment. Extending the useful life of facilities and processes by making them appropriately durable or adaptable is one example. Flexible manufacturing can be a very effective life extension strategy for facilities and equipment. Resource conservation in facility design can also help reduce impacts. Several sources of information are available on the environmental aspects of building and lighting design. The American Institute of Architects offers the Environmental Resource Guide Subscription [27l.
Chapter 5 This quarterly publication covers energy efficiency, indoor air quality, and natural resource issues. The EnvironmentalResource Guide also analyses common construction materials. When possible, findings are based on life cycle assessments. The focus is on energy use, toxic emissions, resource management after retirement, and waste. Government can also aid in facilities planning. For example, through its Green Lights program. the EPA helps companies conserve energy. Participants are recruited and educated about new lighting techniques that save money and reduce impacts by increasing efficiency. In addition to saving resources, buildings should be designed to reduce health and safety risks. Such factors as structural integrity, explosion venting, adequate normal ventilation, fire walls, emergency exits, and proper drainage help reduce risks to human health and safety. At a minimum, a building must satisfy the National Building Code and National Electrical Code. Geographic location is also an issue in facilities planning. When siting a new building, it is important to determine whether adequate utilities, transportation, infrasaucme, and emergency response are available. The possibility of natural disturbances such as earthquake and floods should also be considered. These events can damage facilities and cause releases that are a risk to nearby residents. In addition, location is the key to determining community risks from accidents or other human errors within the facility. Finally, available resources and the impacts of using them help detennine facility location. For example, industries requiring large quantities of process water should not be sited in drought-stricken regions.
Treatment and Disposal After strategies for pollution prevention and waste minimization have been exhausted, process residuals must be treated and disposed. Environmental impacts and health risks can still be reduced at this stage. Treatment and disposal will not be discussed here. Development teams exploring this vital topic can consult a variety of readily available textbooks.
Des@nStrategies
5.7 EFFICIENT DlSTRlBUTlON Both transportation and packaging are required to transfer goods between locations. A life cycle &sign project benefits from distribution systems that are as efficient as possible.
Transportation Life cycle impacts caused by transportation can be reduced by several means. Approaches that can be used by designers include:
Choose an energyefficient mode Reduce air pollutant emissions from transportation Maximize vehicle capacity where appropriate Backhaul materials Ensure proper containment of hazardous materials Choose routes carefully to reduce potential exposure from spills and explosions . Trade-offs between various modes of transportation will be neces-
sary. TranspoRation efficiencies are shown in box 5-A. Time and cost considerations, as well as convenienceand access, play a major role in
Box 5-A. TRANSPORTATION EFFICIENCIES
Waterborne Class 1 Railroad All Pipelines1 Crude oil pipeline Truck Ai$
365 465 886 259 2671 3460 18809
-
'Average figure; ranges from 236 Btunon mile for petroleum to approximately 2550 Btunon mile for coal slurry and natural gas. 2Allcargo aircraft only. Belly freight carried on passenger airlines is considered "free" because energy used to transport it is credited to passengers. Thus, the efficiency figure for all air freight is a misleading 9548 Btu/ton-mile. Source: 128,291
A life cyde design project benefits from distribution systems that are as efficient as possible.
Chapter 5 choosing the best transportation. When selecting a transportation system, designers should also consider infrastructure requirements and their potential impacts.
Packaging
To avoid unnecessary impacts, products and packaging should be designed to compliment each other.
Packaging must contain and protect goods during transport and handling to prevent damage. Regardless of how well-designed an item might be, damage during distribution and handling may cause it to be discarded before use. To avoid such waste, products and packaging should be designed to compliment each other. The concment practices of life cycle design are particularly effective in reducing impacts from packaging. As a first step, products should be designed to withstand both shock and vibration. When cushioned packaging is required, members of the development team need to collaborate to ensure that cushioning does not amplify vibrations and thus damage critical parts [30]. Cooperation between design specialities can greatly reduce such product damage. The following strategies may be used to design packaging within the life cycle framework. Most of these strategies also result in significant cost savings. Pockoging Reduction elimination: dislribute appropriate products unpackaged reusable packaging product modifications material reduction Material Substitution recycled materials degradable materials
-
Packaging ReductJon Shipping items without packaging is the simplest approach to impact reduction. In the past, many consumer products such as screwdrivers, fasteners, and other items were offered unpackaged. They can still be hung on hooks or placed in bins that provide proper containment while allowing customer access. This method of merchandising avoids unnecessary plastic wrapping, paperboard, and composite materials. Wholesale packaging can also be eliminated. For example, furniture! manufacturers commonly ship furniture uncartoned. U n m n e d furniture is protected with blankets that are returned after delivery to the dislribution center.
DesQn Strategies Reusable packaging systems are also an atnactive design option. Wholesale items that require packaging are commonly shipped in reusable containers. Tanks of all sizes, wire baskets, wooden shooks, and plastic boxes are frequently used for this purpose. Necessary design elements for most reusable packaging systems include: collection or return infrastructure pmxdures for inspecting items for defects or contamination repair, cleaning and refurbishing capabilities storage and handling systems Unless such measures are in place or planned, packaging may be discarded rather than reused. Manufacturers and disaibutors cannot reuse packaging unless i&asmcture is in place to collect, return, inspect, and restore packaging for another service. Producers can reduce these in6rastructure needs by offering their product in bulk. Some system will still be required for reusable wholesale packaging, but it should be much less complex than that needed to handle consumer packaging. When products are sold in bulk, customers control all phases of reuse for their own packaging. Even so, waste generation and other environmental impacts are only reduced when customers reuse their container several times. Customers who use new packaging for each bulk purchase generally consume more packagmg than customers who buy prepackaged products. This is particularly true of items distributed in single-use bulk packaging [31]. Product modification is another approach to packaging reduction. Shudy products require less packaging and may also prove more robust in service. Depending on the delivery system, some products may safely be shipped without packaging of any kind Even when products require primary and secondary packaging to ensure their integrity during delivery, product modifications may decrease packaging needs. Designers can further reduce the amount of packaging used by avoiding unusual product features or shapes that are difficult to protect. Reformulation is another type of product modification that may be possible for certain items. Products that contain ingmhents in diluted form may be dismbuted as concena-ates. In some cases, customers can simply use concentrates in reduced quantities. A larger, reusable container may also be sold in conjunction with concentrates. This allows customers to dilute the product as appropriate. Examples of product concentrates include frozen juice concentrates, and concentrated versions of liquid and powdered detergent.
Product modification is one approach to packaging r e t h h n . Sfurdy products less padtqing and may also prove more robust in senrice.
Chapter 5
Material reduction may also be pursued in packaging design. Many packaging designers have already managed to reduce material use while maintaining performance. Reduced thickness of cormgated containers (board grade reduction) provides one example. In addition, aluminum, glass, plastic, and steel containers have continually been redesigned to require less material for delivering the same volume of product
~ a t e Substitution r ~ As discussed, material substitution can reduce impacts in other areas of design. One common example of this strategy in packaging is the substitution of more benign printing inks and pigments for those containing toxic heavy metals or solvents. The less harmful inks are usually just as effective for labels and graphic designs. When some propemes depend on toxic constituents, designers can develop new images that are compatible with sounder pigments, inks, and solvents. Whenever possible, designers can create packaging with a high recycled content. Many public and private recycling programs currently focus on collecting packaging. As a direct consequence, firms are being encouraged to increase the recycled content of their packaging. However, using recycled material in packaging design cannot be thought of as a complete strategy in itself. Opportunities for material reduction and packaging reduction or elimination should still be investigated. Recycling and recycled materials were discussed in more detail earlier in this chapter. Degradable materials are capable of being broken down by biological or chemical processes, or exposure to sunlight. At first glance, package designs based on degradable material appear to be an attractive solution to the mounting problem of waste disposal. But the lack of sunlight, oxygen, and water in modem landfills severely inhibits degradation. Degradable materials thus provide only limited benefits in packaging that will be properly disposed. This may change if cornposting of municipal waste becomes more widespread. In any event, degradability is a desirable trait for litter deposited in aesthetically pleasing natural areas. In particular, polymers or other materials that are normally resistant to decay are less of a nuisance if they can be formulated to quickly break down. Degradable materials may also benefit some aquatic species that encounter litter. Various mammals, birds, and fish can die fiom entrapment in such items as six-pack rings and plastic sacks. Even so, it may be difficult to determine whether degradable packaging is an asset, or just encourages irresponsible behavior.
Desgn Strategies Previously resistant materials that are now designed to decay may
also cause unanticipated problems. Degradable polymers can impede recycling efforts by acting as a contaminant in recovered materials. Questions have also been raised about the environmental impacts of degraded polymers. Degradation can liberate dyes, fillers, and other potentially toxic constituents from a material that was previously inert.
5.8 IMPROVED MANAGEMENT PRACTICES Most product and process design strategies apply to management activities. For example, life extension should be considered when purchasing business equipment Some additional strategies related to management and information provision follow.
Office Management Designing new business procedures and improving existing methods
also plays a role in reducing environmental impacts. Business management strategies apply to both manufacturing and senrice activities. Examples of strategies for impact reduction in this area include:
Specify double-sided photocopying Use single spacing for final copies Reduce paper requirements by circulating memos and articles with a muting list Use backs of single-sided copies for note and memo pads. Order envelopes without cellophane or plastic window panes Use FAX stickers rather than full transmission cover sheets Recycle office paper, containers, and all other suitable materials Purchase products made with recycled materials Reuse toner and ribbon cartridges for printers Use electronic and voice mail Use computer networks for sending documents Tum off electronic equipment when not in use Keep confidential materials in networks, or shred old hard copies for recycling Retrofit buildings with high-efficiency climate control and lighting systems Illuminate only that space currently in use
Several brands of laser printers print a tale sheet by default every time the machine is turned on. Such systems waste paper and encourage owners to leave machines on for extended periods of time, consuming excess electricity. Default printing can be permanently turned off via a software switch, thus substantially reducing paper waste.
Chapter 5
Phase Out High Impact Products Discontinuing the manufacture and sale of wasteful or harmful products is the most direct action a corporation can take to eliminate Iife cycle impacts. Products may be discontinued through recall, gradual phase out (sunsetting), or ceasing production immediately. A large American electronics company has developed a Supplier Environmental Evaluation Questionnaire to ensure that suppliers comply with laws and regulations and manage their businesses in an environmentally sound manner.
Choose Environmentally Responsible Suppliers or Contractors Suppliers and contractors should be carefully selected to reduce upstream environmental consequences. This requires life cycle impact data on raw materials and parts. However, critical data is usually not readily available. So decisions must be b e d on material safety data sheets, TRI data, and other environmental records requested from the supplier or contractor.
Information Provision Information transfer accompanies the flow of materials and energy throughout the life cycle of a product. Roper information encourages the use of maten'als and products with reduced environmental impacts and health risks. Labeling Identm Ingredients Materials flowing through the product system change significantly through life cycle stages. Complex mixing,chemical reactions, and other processes change material composition and fom. Labels that identify materials and provide concentrations of each constituent in a product are important for health and safety reasons. lnstmctions and Warnings Users of goods and services, and processes operators need clear and detailed guidance about proper procedures. Clear instructions can increase performance and help reduce resource use through greater efficiency. Products that are used properly can last longer and provide more satisfaction to the user. Well-operated processes and products can also reduce the likelihood of accidents. Significant environmental impacts may result from accidental releases or misuse.
Design Strategies General Infomation Labels can be a primary means of informing customers about the environmental attributes of a product. Some third party environmental label programs are outlined in Appendix E. Federal Trade Commission guidelines and other issues that affect this aspect of labeling are discussed next. Advertlslng Envimnmental Claims Many manufacturers take advantage of public concern about environmental issues by launching advertising campaigns that confuse or mislead. Environmental claims should not be made unless they are specific, substantive, and supported by reliable scientific evidence [32]. For example, many products are labeled "recyclable", even though suitable collection and processing systems are not widely available, and no substantial markets exist for the recovered material. The FTC issued guidelines in 1992 for environmental advertising and labeling. These guidelines can help reduce consumer confusion and prevent the fake and misleading use of terms such as recyclable, degrodable, and enviro~nentatlyfriendly[33]. Advertisers must also be cautious about comparative claims. Some of these claims are based on life cycle analyses done by consulting b s . Results from these studies may be difficult to interpret because methods vary and details are rarely publicly disclosed. In addition, most studies seem to favor the client, so questions may be raised about objectivity.
Chapter 5
Desgn Strategies References 1. Moss. Marvin A. 1985.Designing For Minimal M a h a w m e & m e . New York Marcel Dekka. 2 BUrlin, M. 1989. Swiss CasGStudiesof Product Durability Strategy. Vmlag van het VVM/KIRVlT/RMNO Symposilrm,7 Septemk ,42-50. 3. M o m l a 1991. Centrmm Series. Schaumberg,IL: Motorola Inc. RC-13-9. 4. Wheeler, Roy. 1991. Design Far Reliability Reshapes Designing.Elecsrmk Design39 (2): 121-132 5. Lmd, R o k T. 1984. Remanufacturfng. Technology Review 87: 18-23+. 6. Haynsworth, H. C., and R Tim Lyons. 1987. Rernanufactuxing by Design. the MissYlg Link. Productivity and Inventory Mmgement 28: 2A29. 7. Kirkland, CarL 1986. Remanufactuxingvs Buying New: One Molder's Comparison P k i c s Techabgy 32 (10): 91-93. 8. Kusz, John Paul. 1990. Envinnunental Integrity and Econamic Viability. J o d of IndustriolDesign Sockty of America Summer.25-27. 9. Bell, Carole 0.. and Erica Gutlman. 1990. Design For Disposal. J o u r d of Idustrial Design Smieiy 4America Summer:8-10. 10. Popllar Science.1992 Best of What's New. Popvlm Science 241(6): 65-88. 11. US EPA 1991. GuidanceFor the Use of the Terms "Recycled" and "Recyclable" and the Recycling Emblem in EnviromnentalMareting Claims. Fedmal Regisrer 56 (191): 49992-50000. 12. . 1 9 9 0 . CharacterizationofSolid Waue in the UniredStates: 1990 Update, US Environmcsltal Protection Agency, OBce of Solid Waste. Washington,DC EPA 53MW-90-042A. 13. Sellas, V. R and J. D. Sellers. 1989. Carlpmmive Energy and Environmental Impacts For Soft Drink Delivery Systems. Franklin Associates, Rairie Viage. KS. 14. US EPA. 1991. Pollution Prevention 1991: Progresr on Reducing I d u s t d Pollutants, US Eminmmental htection Age~lcy.Office of Pollution Revention, Washington DC EPA 21P-3003. 15. 1990. Tough Air-Quality Goals Spur Quest Ebr Transpartation Fuel Changes. Oil imd GmJoumal88 (23): 33-34-t. 16. Waste Re&ctionTask Force. 1991. Finol Report. Eminrmnental Defense Fund and McDonald's Corporation. 17. Hmm, J. S.. and D. M.Benforado. 1987. Life Cycle Approach to Effective Waste Mimimization Journal of the Air Pollution Control Assochian 37 (10): 1206-1210. 18. SuppeIsa.A B.. and H. F. Liehman. 1991. SuazwfuZ lmpleneentotim 4 ChedLcrop Semi-Aqrceorrs Clecming. Momla, Inc.. Plantation, FL. 19. Hurnblett, Gregory W.. and G l m W. Larsson. 1989. Te7pndAqueous Clecming, CalCcnnp, Hudson.NH. 20. Binger, Robert P. 1988. Pollution PreventionPlus. Pollution Engineering 20. 84-89. 21. Fickett, b l d P.. Clark W. Gellings. and Amory B. Lovins. 1990. Efficient Use of Electricity. Scienh'fic America 263 (3): 65-74.
22. G& Leslie A. 1990. Applicability of Low Solids FIry AT&T Bell Labs, Princeton, NJ. 23. Zosel. Thomas W.1990, How 3M Makes Pollution Prevention Pay Big Dividends. P o U h Preventbm Rev& Winta: 67-72 24. Bhote, Keki R. 1991. World Chss Quality:Using Experimenrs to Moke it Happen. New York. American Management Association. 25. Taguchi. Mchi 1987. Sysrenr~of Eqmimenral D m i w Engineering M e h x k to Oprtnize Qunlity and Minimize Cost. Dearbnn,MI: Amaican Supplier Institute. 26. Ember. Lois R. 1991. Strategies For Reducing Po11ution at the Source Are Gaining Ground. Chemical and Enginesing News 69 (27):7-16. 27. ALL 1992. E n v i r d Resourcep Guide Subscription. Amaican Institute of Architects, Washington.DC.(available by subsniption. published quarterly) 28. Davis, Stacy C.. and Patricia S. H u 1991. TranspoFfationEnergy Data Book: Edirion 11. Oak Ridge National Laboratory, Oak Ridge, TN 0-9. 29. Minx, M. M., and A. D. Vyas. 1991. Fmecas ofTrmrrportcrtior,Energy Demand Through the Year 2010, Argonne National Laboratory. Argonne, IL. 30. Bresk Frank C. 1992. Using a TransporrLaboratory to Design Intelligent Packaging for Dismiutia World Packaging Conference, Sevilla. Espaiia. 27 January 1992, Lansmont Corpodon. Montaey, C k 31. Keoleian. Gregory. and Dan Menerey. 1992. Packaging and Process Improvements: Three Source Reduction Case Studies. J o d of Environm~lltalSyskw~ 21 (1): 21-37. 32. Attorneys General Task Force. 1991. T k Green Rqort: Findings and Preliminary Recommendationsfor Rapovrrible EnvkomnentOIAdverrining,St PauL MN. 33. ?TC. 1992. G& for the Use of E n v i r o ~ d M m k e t i n gC k ,Federal Trade Commission. Washington. DC.
Chapter 6
ENVIRONMENTAL ANALYSIS TOOLS Information must be gathered and analyzed from the beginning of a development project Proper tools for both these tasks allow effective evaluation of design choices. Only a brief outline of environmental analysis tools is presented here. More detailed guidance can be found in the references at the end of this chapter [l- 71 and in Appendix A.
6.1 ELEMENTS OF DESIGN ANALYSIS Environmental analysis plays a key role in: needs analysis benchmarking design evaluation Strategic planning and product labeling also benefit from environmental analysis. Before selecting the proper tools and beginning analysis, objectives should be clearly defined. As part of this process, development teams must also decide who will participate in the analysis and whether outside experts are needed. Once these basic decisions have been made, analysis tools are applied to the first task of a design project, which is exploring customer needs. During this phase, preliminary environmental analysis may identify potential problem areas that warrant further attention or uncover conflicts between perceived need and environmental impacts. If these conflicts are severe, the design team may decide to redefine or abandon the project. As a design project progresses, increasingly detailed information must be developed for benchmarking. Analysis tools are then used to evaluate design alternatives based on stated requirements. Finally, during implementation, analysis tools help assess environmental performance and target needed improvements. To receive full benefits from environmental analysis, businesses should develop tools suited to their own needs. This does not necessarily require major investment. Firms can realize both cost and decision-
EnvironmentalAnalysis Tools making benefits from constructing a single data collection system for both internal analysis and external reporting. Environmental analysis methods discussed in this chapter are based on life cycle analysis. A Society of Environmental Toxicology and Chemistry (SETAC) workshop held on 18 August 1990, ascribed three elements lo life cycle assessment: inventory analysis, impact assessment, and improvement analysis [4]. Unfortunately, many aspects of life cycle assessment are still in their infancy. Life cycle inventories have been performed for over twenty years, but full impact analyses have not yet been done. Improvement analyses recommend specific actions that target priority impacts. Improvements take place within the life cycle framework, so upsueam and downstream consequences are addressed. However, the effect of these actions on other design requirements is usually not emphasized in improvement analysis. Because improvement analyses depend on both inventory and impact assessments, this aspect of life cycle assessment has also not been fully explored. Continuous improvement is an integral part of life cycle design, so environmental analysis in this manual includes only the following two components:
The two major environmental analysis tools used in life cycle design are: inventory analysis impact assessment
Inventory analysis Impact analysis An inventory analysis identifies and quantifies inputs and outputs. In life cycle design, this inventory tracks materials, energy, and waste through each product system. Without further assessment, data gathered during the inventory analysis may be misunderstood. For this reason, an impact analysis is required to interpret inventory data. Impact analyses identify the main impacts associated with a product. Whenever possible, impacts are then characterized so different designs can be compared. To fully understand an impact, the pathways, fate, and effects of residuals must be tracked; the environmental mobility of residuals in various media, their bioaccumulation potential, and their toxicity are all used to determine impact. Life cycle design should not be confused with life cycle assessment. Rather than concentrating on only analytical tasks, life cycle design provides a framework and guidelines for integrating environmental requirements into product development. Life cycle assessment may improve environmental evaluation, but all environmental, performance,cost, cultural, and legal requirements must still be balanced in successful products.
Product system inputs and outputs are tracked through an inventory analysis. Interpreting this inventory requires an impact analysis
L i e cycle design should not be confused with life cycle assessment. Analysis is only one function of design.
Chapter 6
Scope of the Analysis A full life cycle assessment may not be essential for all design activities. Scope can vary from complete quantificationof all outputsl and their impacts to a qualitative description of inventories and impacts.
The development team will ideally base design and analysis on the full life cycle. Choice of more limited system boundaries should be justified.
In some cases, items that account for less than 1% of total inputs or outputs can be ignored. However, this 1O/O rule can lead to an inaccurate impact analysis when applied to highly toxic trace releases.
Before development teams begin gathering data for an environmental analysis, the scope of analysis should be agreed on. As previously discussed, the scope of environmental analysis varies for different design applications. A full life cycle assessment is not essential for all design activities; analysis can vary from complete quantification of all inputs, outputs, and their impacts to a simple verbal description of inventories and impacts. Scope for a particular purpose is determined by choice of system boundaries and depth of analysis.
System Boundaries Boundaries for environmental analysis are provisionally set during the needs analysis when project objectives are defined. Boundaries used in environmental analysis should be consistent with those chosen for design. Ideally the development team will base design and analysis on the full life cycle system. The development team may in some cases decide to restrict system boundaries. Instead of a full life cycle system, boundaries may be restricted to a partial life cycle or even an individual life cycle stage. In addition, boundaries may be further narrowed by limiting the number of product system components (product, process, distribution, management). System boundaries, however, should not be arbitrarily reduced without justification or proper testing of assumptions. System boundaries can be narrowed to streamline analysis. For example, if the premanufacturing impacts for two competing designs are the same, the design team may decide to restrict the analyses to life cycle stages from manufacturing and use to the ultimate fate of the residuals. Care must be exercised when basing a project on narrow analysis. An analysis limited to a single stage does not account for impacts that are produced upstream or downstream from the stage. This analysis may show a reduction in impacts for the stage under investigation, but the total life cycle impacts associated with the product system may have increased. Opportunities for improvement are also limited by the scope of the analysis. Rules for testing which activities to include within system boundaries have been proposed, but there are many exceptions to these rules. One rule of thumb suggests neglecting items that account for less than 1% of total inputs or outputs. This is reasonable in most cases. How-
Environmental Analysis Tools ever, blindly following the 1% rule can create later problems. Ignoring highly toxic trace releases leads to an inaccurate impact analysis. Depth of Analysis After life cycle endpoints are decided, the project team should define how analysis will proceed. Depth of analysis determines how far back indirect inputs and outputs will be traced. Facility and equipment form the first level of indirect inputs for analysis. Materials, energy, and labor required for their production are included in this first level. Facilities and equipment have traditionally been neglected in life cycle assessments, because they often make up less than 5% of all process inputs and outputs [8]. Under these circumstances, inventories from capital plant can be less than 1% of life cycle totals. However exceptions can occur. Drill bits used for extracting oil can account for 25% of total energy use in this stage [8]. Analysis may also proceed to the next level. This second level accounts for the facilities and equipment needed to produce items on the first level. A second level analysis would include inputs and outputs associated with machine tools and facilities for manufacturing such items as process pumps. Under normal circumstances, these effects are even less significant than first level items. Contributions from successive layers quickly become negligible. For this reason, proceeding to the second level or beyond in analysis is of more theoretical than practical interest. The following factors should also be considered when determining scope:
-
Faciliies and equipment have traditionally been neglected in life cycle assessments, because they often make up less than 5% of all process inputs and outputs. However exceptions can occur. Drill bits used for extracting oil can a m u n t for 25% of total energy use in this stage
Basis Temporal Boundaries (Time scale) Spatial Boundaries (Geographic)
Basis Selecting the proper basis for analysis allows accurate comparison of alternative designs. In general, the basis for analysis should be equivalent use, defined as the delivery of equal amounts of product or service. Equal use estimates can be based on number, volume, weight, or distance. For example, a worthwhile comparison of single-use and reusable diapers should be based on the number of diapers needed to care for an infant over a certain time period. Similarly, toothpaste containers can best be compared on the basis of an equal number of brushings. Because delivery efficienciesor amounts used may vary between two competing containers such as tubes and pumps, total volume of the dispenser may not be a useful basis for analysis.
In general, the basis for analysis should be equivalent use. The delivery of equal amounts of product or service is the best basis for comparing designs.
Chapter 6 It may not always be obvious how patterns of use can be normalized between several alternatives, so some investigation may be required. For example, basing a comparison of liquid and powdered laundry detergent on weight or volume would be pointless. Analysis in this case should be based on how much of each type of detergent is required to wash an equivalent number of identical loads.
The time frame or c m d i t h s under which data were gathered should be clearly identified.
The same activity can have quite different impacts in different places. For example, water use in arid regions has a greater resource depletion impact than in areas where water is abundant.
Temporal Boundaries The time frame or conditions under which data were gathered should be clearly identified. Past statistics may not reflect current practice, so it is best to base analysis on the most recent information. In addition, results from the start-up or shut-down of an industrial process usually vary from those under normal operation. For this reason, the design team may choose to collect data that reflects average system performance. However, impacts such as accidental releases or residuals from abnormal operating conditions also affect analysis and should not be excluded simply because they are irregular. Whenever possible, it is useful to report worst- and best-case scenarios. Spatial Boundarles The same activity can have quite different impacts in different places. For example, water use in arid regions has a greater resource depletion impact than in areas where water is abundant. The location of life cycle stages affects environmental impacts in other ways. Energy use and related impacts for distribution will be lower for local systems than widely separated ones. Once scope has been clearly defined, both inventory and impact analysis can then proceed.
6.2 INVENTORY ANALYSIS A full inventory analysis consists of two main tasks:
Identifying the elements in each material and energy input and output stream Quantifying these inputs and outputs In this section, procedures for an inventory analysis are outlined. For more detailed guidance, see Life Cycle Assessment: Inventory Guidelines and Principles [7].
EnvironmentalAnalysis Tools
Identifying Streams and Constituents A flow diagram helps identify important inputs, outputs, and mnsformations of the product system. Figure 6-1 is an example of a limited flow diagram that identifies general processing steps and material and energy streams. This diagram lists only a few of the residuals created in detergent production. Many more residuals would have to be noted and measured for a useful inventory analysis.
pWastekManagement ziq Figure 6-1. Limited Life Cycle Flow Diagram for Hypothetical Detergent Product System
Chapter 6 To fully track inputs and outputs, complex systems have to be decomposed into a series of subsystems that reveal more detail. Using templates makes data gathering more efficient. In life cycle design. it may be best to use a different template for each product system component. Within each component, further distinctions can then be made. Figure 6-2 demonstrates the type of diagram that can help development teams gather more specific inventories at the single stage or substage level.
Quantification Once the inputs and outputs associated with each activity are described, they can be measured. First, development teams note the amount and concentration of inputs entering the system. Then, useful outputs, which include products and co-products, are measured. Finally. the team measures residuals leaving the system as releases to air, water, and land. Inputs and outputs should not be grouped for reporting unless their impacts are precisely the same. For example, a single number should not be used to report air emissions of sulfur dioxide, carbon dioxide, and
Process Materii. Reagents, Solvents, ICatalysts (including Energy
1 +
Product Materlal Inputs (Including
reuse B recycle from another stage)
Single Stage or Unit Operation
reuse 8 recycle from another stage)
-t
Prlmary Product
*
Useful Coproduct Fughive & Untreated
Waste
Treatment I Disposal
Figure 6-2. Single Stage Flow Diagram
Environmental Analysis Tools benzene. Each of these three gases produces a very different impact. Reporting that an activity produced x pounds of all three lumped together would be meaningless. However, outputs that have the same general effect can be grouped. Emissions of greenhouse gases can be reported as a single figure in pounds of carbon dioxide equivalents. Other types of information that assist an impact analysis should also be compiled during the inventory analysis. Items that may be required for an impact analysis include physical properties such as temperature, pressure, and density. For example, the effect of an effluent stream discharged to surface water may depend on temperature. Also, the extent of physical disturbance helps determine the impact of raw material acquisition. Assumptions Assumptions used in analysis should be clearly documented. The significance of these assumptions should also be tested. Sensitivity analyses can reveal how changing assumptions affect results. This allows development teams to identify critical assumptions, and make sure they reflect reality. Allocation of Inputs and Outputs Product systems do not exist in isolation. Many complex processes cut across multiple product system boundaries. Allocation problems usually occur in processes with multiple useful outputs. In such cases, design teams should follow logical procedures for assigning inventories to individual products. When a process produces several outputs with economic value, allocation may be based on [2]: The total weight of the main product relative to the co-products The total economic value of the main product relative to the coproducts The total energy value of the main product relative to the co-products The EPA recommends apportioning multiple outputs by weight in most instances [7]. As an example, if a certain processing step yields 40% by weight of a material used to fabricate product A and 60% other materials that are then converted to additional products, 40% by weight of all the materials, energy, and residuals associated with this activity are allocated to product A.
Inputs and outputs should not be grouped for reporting unless their impacts are precisely the same. For example, emissions of carbon dioxide and sulfur dioxide should not be lumped together in a single figure because they cause different impacts.
Assumptions used in analysis should be clearly documented. Critical assumptions can then be tested to make sure they reflect reality.
Chapter 6
Data should be qualified with methods of measurement, uncertainties, limits of detection, and sources. This helps other members of the development team make better evaluations.
Data Sources Data for a process at a specific facility are often the most useful for analysis. However, when materials or parts come from different sources, compiling specific data for each can be time consuming. In many cases, the only data available may be averages for an entire indusQ'. Another issue for the design team is method of measurement. Inventory data may either be compiled directly or indirectly. Indirect means include modeling and other theoretical methods. In any event, data should be qualified with methods of measurement. uncertainties, limits of detection, and sources. This helps other members of the development team make better evaluations. Development teams may be able to generate their own data for inhouse activities. But detailed information from outside sources will be necessary for other life cycle stages. Sources of data for an inventory analysis include:
-
Predominantly In-House purchasing records utility bills regulatory record keeping accident reports test data and material or product specifications Public Data industry statistics government reports statistical summaries regulatory reports and summaries material, product, or industry studies publicly available life cycle analyses material and product specifications test data from public laboratories Suppliers and customers are usually the most accessible outside sources of data, particularly when they are part of the development process. For a full life cycle analysis, data will have to be gathered from other outside sources. Firms that do not have a stake in the project can be approached, but they may not be cooperative. Government reports and statistical summaries present an alternative source. However, the data they contain might be outdated. In addition, data in such reports are often presented as an average. Broad averages may not be suitable for accurate analysis. Journal articles, textbooks,
Environmental Analysis Tools and proceedings from technical conferences are other sources of information for an inventory analysis, but again they may be tm general or dated. Other useful sources include trade associations and testing laboratories. Many public laboratories publish their results. These reports cover such issues as consumer product safety, occupational health issues, or aspects of material performance and specifications. Design teams may also look for conclusions rather than raw data. When a life cycle study of an appropriate process or product exists, it can greatly simplify analysis. Most existing life cycle analyses have been conducted by private research organizations for specific clients. Many of these studies are for internal use and are unavailable to the public. Others may be obtained by contacting either the sponsor or research company. Even when available, these studies are unlikely to cover all necessary aspects of a design project. Private life cycle studies may also not be ideal because their sources can be difficult to verify. This can lead to questions about the reliability of data and conclusions. In addition, results from different studies often conflict because of different methodologies.
Limitations As just discussed, data quality is an ongoing concern in life cycle analysis. This problem may be due in part to the newness of the field and the limited number of studies completed to date. Additional difficulties include:
Lack of data or inaccessible data Time and costs constraints for compiling data There are considerable gaps in data either because it has not been measured or it is inaccessible. Very few data bases similar to those for industry standards or materials specifications exist for life cycle information. Preliminary attempts in this area can be incomplete. The level of detail required for an inventory analysis can create other problems. Existing data from outside firms may be withheld for proprietary reasons. The design team may thus not have access to engineering and regulatory reports or detailed specifications for critical design elements. Given the current nature of life cycle data, compiling a full profile of baseline data and conducting an inventory of design alternatives can be costly and time consuming. As a result, benchmarking and life cycle
Chapter 6 analyses of designs will often be limited by project time lines and budgets. Establishing a n inventory Database Performing a life cycle analysis is complex, but the time and expense required for this ask might be reduced in the future. A public database for a wide variety of materials, processes, and industries would promote life cycle design. In the meantime, companies committed to reducing the environmental impacts of their activities can perform life cycle inventories and create their own in-house database. When a sufficient number of companies offer environmental data about their products in a form similar to the Material Safety Data Sheets now mandated for hazardous materials, preparing an inventory for life cycle design will be much easier. An Environmental Profile Sheet could be constructed that protects company privacy and also preserves accuracy. 'Ihis information could then be included in product or material specifications available to all life cycle players. Whether f m s are conducting studies for themselves or helping create a broader database, results from inventory analyses should be peer reviewed before they are released to the public. This helps establish credibility.
6.3 IMPACT ASSESSMENT The final result of an impact analysis is an environmental profile the produd system. Data from the inventory analysis is evaluated to determine the potential environmental effects associated with inputs and outputs.
An impact assessment evaluates impacts caused by design activities. The final result of an impact analysis is an environmental profile of the product system. Inventory data can be translated into environmental impacts through many different models. Most impact models are centered on hazard and risk assessment. Figure 6-3 presents a simple diagram of this process. On the most basic level, resources are depleted and residuals generated for each product system. Resource depletion and the related creation of residuals degrades both ecosystem and human health.
Inventory Data Model Parameters
-b
Environmental Impact Assessment Models
Flgure 6-3. Impact Assessment Process 108
Environmental Effects or Impacts
Environmental Analysis Tools Environmenlal impacts can be organized into the following categories: resource depletion ecological degradation human health effects other human welfare effects Other human welfare effects includes such issues as loss of recreational value or scenic beauty. These issues can have a major impact on quality of life. Although other human welfare effects can be a vilal topic in impact analysis, they are not discussed here. The type of models needed to evaluate impacts depends on the final goal of the analysis. For example, releases of CFCs deplete stratospheric ozone, which can lead to increased levels of ulmviolet radiation reaching the earth's surface. Such increases can cause skin cancer and cataracts in humans, disrupt agriculture, and affect the growth of phytoplankton in the oceans. Complex models are needed to evaluate the ozone-depleting potential of CFCs. Equally complex models must be employed to predict the related human health effects. In many projects, a simple estimate of the ozone-depleting potential of a chemical may be enough to compare competing designs. Impact analysis is one of the most challenging aspects of life cycle design. Current methods for evaluating environmenlal impacts are incomplete. Even when models exist, they can be based on many assumptions or require considerable data. Despite these problems, some form of impact assessment helps designers and planners understand the environmental consequences of a design more fully. The following sections describe several aspects of impact assessment and their limitations.
Resource Depletion The quantity of resources extracted and eventually consumed can be measured relatively accurately. The environmental and social costs of resource depletion are much more difficult to assess. In the end, the availability of resources depends on the resource base and extraction technology. Current and projected global demand determines when resources will be exhausted. One method for evaluating the potential for depletion expresses product system resource use as a fraction of global demand.
Impact analysis is one of the most challenging aspects of life cycle design. Current methods for evaluating impads are incomplete.
Chapter 6 Resources and reserves are defined as:
The environmental and social costs of resource depletion are difficult to assess. Depletion of nonrenewable resources limits their availability to future generations. us* faster than they can be replaced are actually nonrenewable.
The amount and availability of resources are ultimatelv determined by geological and energetic constraints, not human ingenuity.
Resource - A solid, liquid, or gas in the biosphere that is in the proper form or sufficient amount for practical extraction now or in the future. Reserve Base - The part of a resource that meets minimal criteria for current mining and production practices. Actual Reserves - The part of a reserve base that can be economically, technically, and legally extracted at present.
Depletion of a nonrenewable resource limits its availability to future generations, but because future generations are unable to bid on the price of current resources, exploitation may proceed beyond human ability to supply alternatives. Renewable resources used faster than they can be replaced are actually nonrenewable. Given recent history, this may not seem very important. In the past two hundred years, human activity has exhausted actual reserves of some natural resources that were vital at the time. When this happened, replacements were quickly found. Most of these new resources were both cheaper and more suitable for advancing industry. However, it would be unwise to assume that infinite abundance will be characteristic of the future. It may be true that no critical shortages have yet developed in the very brief history of intensive human resource use, but the amount and availability of resources are ultimately determined by geological and energetic constraints, not human ingenuity. Another aspect of resource depletion important for impact assessments is resource quality. Resource quality is a measurement of the concentration of primary material in a resource. In general, as resources become depleted their quality declines. Using low-quality resources may require more energy and other inputs while producing more waste.
Ecological Effects Impact and risk reduction activities have largely focused on human health and welfare rather than on ecosystems. This position may be slowly changing as decision makers recognize the strong links between human health and the health of forests, wetlands, estuaries, and oceans. These four main types of ecosystems have a limited capacity to assimilate waste created by humans. If they are degraded by further intrusions, this will eventually impact human health and welfare.
Environmental Analysis Tools Ecological risk assessment is patterned after human health risk assessment but is more complex. As a first step in analysis, ecological stressors are identified; then the ecosystem potentially impacted is determined. Ecological stress agents can be categorized as chemical (e.g., toxic chemicals released to the environment), physical (e.g., habitat destruction through logging), and biological (e.g., introduction of an exotic species). The Ecology and Welfare Subcommittee of the US EPA Science Advisory Board developed a method for ranking ecological problems [9]. Their report provides a valuable discussion of ecological risk assessment. The Subcommittee's approach was based on a matrix of ecological stress and ecosystem types [lo]. Risks were classified according to: type of ecological response intensity of the potential effect time scale for recovery following stress removal spatial scale (local, regional, biosphere) transport media (air, water, terrestrial). The rate of recovery of an ecosystem to a stress agent is a critical part of risk assessment. In the extreme case. an ecological stress leads to permanent changes in community structure or species extinction. The subcommittee classified ecosystem responses to stressors by changes in: biotic community structure (alterations in the food chain and species diversity) ecosystem function (changes in rates of production and nutrient cycling) species population of particular aesthetic or economic value potential for the ecosystem to act as a route of exposure to humans (bioaccumulation) Determining potential risks and their likely effects is the first step in ecological impact assessment. Many stressors can be cumulative, finally resulting in large-scale problems. Both habitat degradation and atmospheric change are examples of the types of ecological impacts that gain wide attention.
Human and ecosystem health are strongly linked. Ecosystems have a limited capacity to assimilate waste created by humans. If they are degraded by further intrusions, this will eventually impact human health and welare.
Chapter 6
Human activities affect many ecosystems by destroying habitat. When is the survival of interrelated species is threatened.
Habitat Degradation Human activities affect many ecosystems by destroying habitat. When habitat is degraded, the survival of many interrelated species is threatened. The most drastic effect is species extinction. Habitat degradation can be measured by losses in biodiversity, decreased population size and range, and decreased productivity and biomass accumulation. Standard methods of assessing habitat degradation focus on species of direct human interest: game fish and animals, songbirds, or valuable crops [l 11. Insects or soil organisms may be a more accurate ecological indicator in many systems, but the rapid decline or even extinction of these species generates little public interest. For this reason, impact assessments generally rely on popular species. Ecological degradation does not result from industrial activity alone. Although beyond the scope or control of design, rapid human population growth creates residential sprawl and can convert natural areas to agriculture. Both are a major source of habitat degradation. As in other aspects of product development, improved design practices must be coupled with changes in societal values and individual behavior to achieve life cycle goals.
Regional and local effects of pollution on the atmosphere include acid rain, and smog. Largescale effects include global climate change caused by releases of greenhouse gases and increased uRraviolet radiation from ozone-depleting gases.
Atmospheric Change A full impact assessment includes all scales of ecological impacts. Impacts can occur on local, regional, or global scales. Regional and local effects of pollution on the atmosphere include acid rain and smog. Large-scale effects include global climate change caused by releases of greenhouse gases and increased ultraviolet radiation from ozone-depleting gases. A relative scale is a useful method for characterizing the impact of emissions that deplete ozone or lead to global warming. For example, the heat-trapping ability of many gases can be compared to carbon dioxide. This is a logical frame of comparison because carbon dioxide is the main greenhouse gas. Similarly, the ozone depleting effects of emissions can be compared to CFC-12 [12]. Using this common scale makes it easier for others to interpret results. An example of how such scales can be used is in Appendix C. Environmentai Fate Modeling Specific ecological impacts caused by pollution depend on toxicity, degradation rates, and mobility in air, water, or land. Atmospheric transport, surface water, and groundwater uansport models help predict the fate of chemical releases, but they can be extremely complex. Although crude, equilibrium partitioning models offer one relatively
Environmental Analysis Tools simple approach for predicting the environmental fale of releases. Factors useful for predicting environmental fate include:
BCF (bioconcentration factor) - chemical concentration in fish/ chemical concentration in water Vapor pressure Water solubility Octanol/water partition coefficient - equilibrium chemical concentration in octanol phase/equilibrium chemical concentration in aqueous phase Soillwater partition coefficients - chemical concentration in soil/ chemical concentration in aqueous phase Once pathways through the environment and final fate are determined, impact assessment focuses on effects. For example, impacts depend on the persistence of releases and whether they degrade into further hazardous by-products.
Human Health and Safety Effects In addition to resource depletion and ecological degradation, product development can impact human health and safety in many ways. Impacts can be assessed for individuals and small populations, or risks can be determined for whole systems. In any event, impacls on human health and safety are usually determined by following these steps: Hazard identification - identify the hazardous agent, ils chemical and physical characteristics, and harmful effecls Risk assessment establish the dose-response relationship (what dose of the agent is needed to produce a certain health effect) Exposure assessment - determine the route (ingestion, inhalation, skin contact, parenteral administration). frequency. and duration of the exposure Risk characterization - estimate the risk from exposure to a particular agent
-
Determining health risks from many design activities can be very difficult. Experts, including toxicologists, industrial hygienists, and physicians, should be consulted in this process. Data sources for health risk assessment include biological monitoring reports, epidemiological studies, and bioassays. Morbidity and mortality data are available from
Atmospheric transport, surface water, and groundwater transport models help predict the fate of chemical releases. but they can be extremely complex.
Chapter 6 sources such as the National Institute of Health, the Center for Disease Control, and the National Institute of Occupational Safety and Health. The following list describes a few ways to assess health impacts: TLV-TWA (threshold limit value-time-weighted average): This is the time-weighted average concentration for a normal 8-how workday and 40-hour workweek to which nearly all workers may be repeatedly exposed, day after day, without adverse effect 1131. LDso (median lethal dose): The quantity of a chemical estimated to be fatal to 50% of test organisms when applied directly [13]. LC50 (median lethal concentration): The concentration of a chemical estimated to be fatal to 50% of test organisms when present in their environment. LC50 is used to estimate acute lethality of chemicals to aquatic organisms and air-borne chemicals to terrestrial organisms [13]. NOEL (no obsemed effect level) NO AEL (no observed adverse effect level)
Impacts on humans also include safety. Unsafe activities cause particular types of health problems. Safety generally refers to physical injury caused by a chemical or mechanical force.
Other methods can be used to compare health impacts of residuals. One approach divides emissions by regulatory standards to arrive at a simple index [2]. These normalized values could be added or compared if the emission standard for each pollutant was based on the same level of risk. However, this is usually not true. In addition, such an index reveals neither severity nor whether effects are acute or chronic. Properly assessing the impact of various releases on human health usually requires more sophistication than such a simple index. Impacts on humans also include safety. Unsafe activities cause particular types of health problems. Safety generally refers to physical injury caused by a chemical or mechanical force. Sources of safety-related accidents include malfunctioning equipment or products, explosions, fires, and spills. Safety statistics are compiled on incidences of accidents, including hours of lost work and types of injuries. Accident data are available from industry and insurance companies. In addition, health and safety risks to workers and users depend on ergonomic factors. In the case of tools and similar products, biomechanical features, such as grip, weight. and field of movement influence user safety and health.
Assessing System Risk Human error, poor maintenance, and interactions of products or systems with the environment produce consequences that should not be overlooked. Although useful for determining human health and safety
Environmental Analysis Tools effects, system risk assessments apply to all other categories of impacts. For example, breakdowns or accidents waste resources and produce pollution that can lead to ecological damage. Large, catastrophic releases may have different impacts than continual, smaller releases of pollutants. When assessing risk, predicting how something can be misused is often as important as determining how it is supposed to function. Methods of risk assessment can either be relatively simple or quite complex. The most rigorous methods are usually employed to predict the potential for high-risk events in complex systems. Risk assessment models can be used in design to achieve inherently safe products. Inherently safe designs result from identifying and removing potential dangers rather than just reducing possible risks [14]. A very brief outline of popular risk assessment methods follows. Simple Risk Assessmenr Procedures Preliminary Hazard Analysis Checklists WHAT-IF Analysis A Preliminary Hazard Analysis is well-suited for the earliest phases of design. This procedure identifies possible hazardous processes or substances during the conceptual stage of design and seeks to eliminate them, thereby avoiding costly and time-consuming delays caused by later design changes [15]. Checklists ensure that requirements addressing risks have not been overlooked or neglected. Design verification is best undertaken by a multi-disciplinary team with expertise in the appropriate areas [16]. A WHAT-IF analysis predicts the likelihood of possible events and determines their consequences through simple, qualitative means. Members of the development team prepare a list of questions that are then answered and summarized in a table [17]. Mid-Level Risk Assessmenr Procedures Failure Mode and Effects Analysis (FMEA) Hazard and Operability Study (HAZOP) The Failure Mode and Effects Analysis is also a qualitative method. It is usually applied to individual components to assess the effect of their failure on the system. The level of detail is greater than in a WHAT-IF analysis [18]. Hazard and Operability Studies systematically examine
Human error, p r maintenance, and interactions of products or systems with the environment produce consequences that should not be overlooked.
Chapter 6 designs to determine where potential hazards exist and assign priorities. HAZOPS usually focus on process design [19]. Relatively Complex Risk Assessment Procedures Fault Tree Analysis (FTA) Event Tree Analysis (ETA) Fault Tree Analysis is a structured, logical modeling tool that examines risks and hazards to precisely determine undesirable consequences. FTA graphically represents the web of actions leading to each event. Analysis is generally confined to a single system and used to produce a single number representing the probability of that system's failure. FTA does not have to be used to generate numbers; it can also be done qualitatively to improve understanding of how a system works and may fail [21]. Event Tree Analysis studies the interaction of multiple systems or multiple events. It provides a spectrum of possible outcomes for a sequence of events. ETA is frequently used with FTA to provide quantitative risk assessments [20]. Event trees are also employed to assess the probability of human errors occumng in a system. Human Reliability Analysis (HRA) can be a key factor in determining risks and hazards, and also in evaluating the ergonomics of a design. HRA can take a variety of forms to provide proactive design recommendations [21].
Limitations Impact assessment inherits all the problems of inventory analysis. These include lack of data and time and cost constraints. Although there are many impact assessment models, their ability to predict environmental effects varies greatly. Fundamental knowledge in some areas of this field is still lacking. In addition to basic inventory data, impact analysis requires much more information. The often complex and time-consuming task of making further measurements also creates barriers for impact analysis. Even so, impact analysis is an important part of life cycle design. For now, development teams will have to rely on simplified methods. Analysts should keep abreast of developments in impact analysis so they can apply the best available tmls that meet time and cost constraints.
Environmental Analysis Tools References 1. Hunt, Robert G.. Jere D. Sellers, and W i E. Franklin. 1992. Resource and Environmental Profile Analysis: A Life Cycle Environmental Assessment for Products and Procedures. Environmental Impact Assessment Review Spring. 2. Assies, Jan A. 1991. InfroductionPoper. SETAC-EuropeWorkshop on Environmental Life Cycle Analysis of Products. Leiden. Netherlands. 2 December 1991, Leiden, Netherlands: Centre of Environmental Science (CML). 3. Heijungs. R.. J. B. Guide, G. Huppes, R. M. Lankreijer, A. M. M. Anserns. P. G. Eggels. R. van Duin, and H. P. daoede. 1991. Munuol For the Environmental Life Cycle Assessment of Products, Centre of Environmental Science (CML, Leiden), Dutch Organization for Applied Scientific Research (TNO. Apeldoom), and Fuels and Raw Materials Bureau (B&G, Rotterdam), Netherlands. 4. SETAC. 1991. A Technical Framework for Life-CycleAssessment. Workshop of the Society of Environmental ToxicoIogists and Chemists. Smugglers Notch, VT. 18 August 1990, SETAC Foundation for Environmental Education, Washington. DC. 5. Boustead. Ian. 1991. Ecobalances. Automotive Materials and the Environment, Stein am Rhein, Germany, 12 November 1991. 6. World Wildlife Fund. 1990. Product Life Assessments: Policy Issues and Implicafions,Summary of Forum, Washington, DC,14 May 1990, Washington, DC:World Wildlife Fund and The Conservation Foundation. 7. Battelle and Franklin Associates. 1992. Life Cycle Assessment: Inventory Guidelinesand Principles. US Environmental Protection Agency, Risk Reduction Engineering Laboratory, Office of Research and Development, Cincinnati. OH EPA/600/R-92/086. 8. Boustead, Ian. and G. F. Hancock. 1979. Handbook of Indlcstrial Energy Analysis. New YoTk: Wiey. 9. Science Advisory Board. 1990. The Report of the Ecobgy and Welfare Subcommittee, Rehtive Risk Reduction Project. Environmental Rotection Agency, Washington, DC SAB-EC-90-021A. 10. Hanvell, M. A., and J. R. Kelly. 1986. Workrhop on Ecobgical Effectsfrom Environmental Stresses. Ecosystems Research Center. Comell University. Ithaca, NY. 11. Suter, Glenn W. 11. 1990. Endpoiits for Regional Ecological Risk Assessment. Environmental Management 14 (1): 9-23. 12. Assessment Chairs for the Parties to the Montreal Protocol. 1991. Synthesis of the Reports of the Ozone Scientr~,Environmental Effects, and Technology and Economic Assessment Panels, W P ,New York. 13. Hodgson. Ernest, Richard B. Mailman. and Janice E. Chambers. 1988. McMillan D i d i o ~ l yof Toxicology. New York: Van Nostrand Reinhold .
Chapter 6 Greenberg. Harris R., and Joseph J. Cramer. 1991. Risk asses^ and Risk Management fw the Chemical Process I-. New York: Van Nostrand Reinhold. Hessian, Robert T. Jr.. and Jack N. Rubin. 1991. Preliminary Hazards Analysis. Risk Assessment and Risk Management for the Chemical Process Inh r y , editors. Harris R. Greenberg, and Joseph J. Cramer, 48-56. New York: Van Nosnand Reinhold -. 1991. Checklist Reviews. Risk Assessment and Risk Management for the Chemical Process Industry, editors, Harris R. Greenberg. and Joseph J. Cramer. 3047. New York: Van Nosnand Reinhold Doerr. William W. 1991. WHAT-IF Analysis. Rkk Assessmenf and Risk Managementfor the Chemical Process Industry, editors. Harris R. Greenberg. and Joseph J. Criuner, 75-90. New York: Van Nostrand Reinhold. O'Mara, Robert L. 1991. Failure Modes and Effects Analysis. Risk Assessment and Risk Management for the Chemical Process Industry, editors. Harris R. Greenberg. and Joseph J. Cramer. 91-100. New York: Van Nostrand Reinhold. Sherrod, Robert M.. and William F. Early. 1991. Hazard and Operability Studies. Risk Assessment and Risk Management for the Chemical Process Industry, editors. Harris R. Greenberg. and Joseph J. Cramer. 101-126. New York: Van Nosnand Reinhold. Greenberg. Harris R.. and Barbara B. Salter. 1991. Fault Tree and Event Tree Analysis. Risk Assessment and Risk Managemeafor the Chemical Process1ndum-y. editors. Harris R. Greenberg. and Cramer Joseph J.. 127166. New York: Van Nosuand Reinhold. Stoop, J. 1990. Scenarios in the Design Process. Applied Ergonomics 21 (4): 304-3 10.
Chapter 7
LIFE CYCLE ACCOUNTING Accounting practices need to be modified to reflect the actual costs of product development.
Products must be offered at an attractive price to be successful. Fortunately, some strategies for reducing environmental impacts can also lower costs while meeting all other critical requirements. However. an environmentally preferable design may not be the lowest-cost option when measured by standard accounting methods. To assist in life cycle design, accounting practices need to be modified to reflect the actual costs of development.
7.1 TRADITIONAL ACCOUNTING PRACTICES Life cycle design projects rely on an accurate estimate of environmental costs, but these costs are not always readily provided by standard accounting practices. Costs can be distorted when accounting systems are based on existing financial methods or they fail to identify the full range of environmental costs, including externalities. A brief discussion of these problems follows.
Financial Cost Structures Accounting serves the following two functions in most firms:
Environmental costs are commonly gathered on the facility level and added to overhead. Specific product systems are then assigned a portion of overhead costs for management accounting purposes.
Financial accounting: reports on the financial status of a firm for shareholders and the government Management accounting: provides cost analysis for internal decision-making and strategic planning At present, most costs systems used in business and industry are based on financial accounting. This focus reflects the increased importance of external reporting over the last 100 years [3]. Because many accounting systems are designed to serve financial rather than management purposes, pollution and waste management costs are usually gathered on the facility level. These environmental costs are commonly added to overhead. Specific product systems are then assigned a portion of overhead costs for management accounting purposes. When only one or a few products are made in a facility, overhead costs can be properly assigned on the basis of labor, unit volume, or
Life Cycle Accounting floor space [3]. However, such simple allocation schemes are less accurate in complex facilities. Poor decisions can result from methods that conceal or distort product costs [4]. Many companies are now adopting activity-based costing (ABC) to improve their decisions. ABC offers a more accurate method of deriving product costs in complex situations [5,6]. But the choice of cost drivers and assumptions in ABC must reflect actual costs to be more effective than standard accounting methods [7,8]. Rather than attempting to improve allocation methods, future accounting may take advantage of advances in hardware and software to gather product-specific costs. Going to the source avoids the need for complex disaggregation schemes. Yet trade-offs may continue to exist between costing methods. It may still be cheaper to allocate general costs. The time and expense required for any accounting system should always be weighed against its ability to improve decisions and increase profits.
Simple allocation methods can be inaccurate. Rather than attempting to improve allocation methods, future accounting may take advantage of advances in hardware and software to gather product-specific costs.
Unidentified Costs Many environmental costs are not considered in design, regardless of the management accounting tools used. These include hidden costs, liabilities, and less tangible costs [I]. In some cases, low-impact designs are not pursued because full costs and benefits remain unknown. Customer awareness of unidentified costs also plays an important role in life cycle design. Retail price often drives purchasing decisions, but customers can benefit from a more complete analysis. Life cycle costing is a useful model for estimating user costs. Equipment purchases in many f m s are already evaluated on the basis of life cycle costing methods [9]. Direct life cycle costs beyond purchase price include service costs not covered under warranty, cost of consumables such as fuel or electricity, and possible disposal costs. Table 7-1 shows the difference that can exist between initial price and life cycle costs. Many additional costs are borne by consumers in the form of externalities.
Many environmental costs are not amsidered in design. In some cases, low-impad designs are not pupued because full costs and benefits remain unknown.
Externalities The current economic system often does not reflect full environmental costs. Many such costs remain externalities. Externalities are costs borne by society rather than those involved in a transaction. The cost of disposal for many products is not included in the initial purchase price.
are not borne by those involved in a transadion.
Chapter 7 Table 7-1. Incandescent and Fluomcent Llfe Cycle Costs for 9000 Hours of lllumlnatlon
Expected Life Number of Bulbs Cost of Bulbs Wattage Electricity Use Over Life Cost of Electricity (at $0.1 OIKWh)
'
Total Costs
Fluorescent ' Incandescent 9000 hrs 1000 hrs 9 1 $30.00 $4.50 27W lOOW 243 Kwh 900 Kwh $24.30 $90.00 I
t54-30
1
f 94.50
'For the fluorescent case: reusable base ($18.00) and replaceable bulb ($12.00)
The cost of disposal for many products is not included in the initial purchase price. Society pays indirectly for the cost of disposal through taxes that support municipal waste services.
Society pays indirectly for the cost of disposal through taxes and fees that support municipal waste services. Pollution is also a major externality. Firms are not charged for a majority of chemical releases that contribute to serious environmental consequences. Impacts of pollution include ozone depletion, global warming, and habitat degradation. If the cost of pollution is less than the cost of prevention, decision makers may choose to pollute. If most follow this path. the effect can be devastating. Society assumes and widely distributes many environmental costs among individuals. This presents a bamer to life cycle design. Costs that are not concentrated where they actually occur make product evaluation difficult. Prices for goods that fully reflect life cycle costs would allow customers to easily compare products and make better choices.
7.2 LIFE CYCLE ACCOUNTING Material and energy flows identified during the inventory analysis provide a detailed template for assigning costs to individual products.
An accurate estimate of costs to develop and use a product are central to life cycle design. Material and energy flows identified during the inventory analysis provide a detailed template for assigning costs to individual products. In an effort to be more complete, life cycle accounting also uses an extended time scale. For example, equipment life and useful product life are important factors that can be evaluated for their impact on costs. Costs for monitoring closed hazardous waste sites and similar long-term activities should also be included in the analysis.
Life Cycle Accounting The extent of analysis will vary, depending on the application. Detailed design of new products usually demands specific costs; the same rigor is rarely needed during the concept or preliminary design. Cost analysis can also vary between types of projects. When modifying a current design. an estimate of incremental costs will usually be all that is needed. As previously noted, gathering product-specific costs for management accounting is not the norm. Although detailed engineering cost models suitable for life cycle design were developed in the late 1800s, they were largely untested. Instead, much simpler financial accounting methods were adopted, and these proved suitable for the production of that era [3]. Simple methods of assigning general costs to specific products are still used at many firms. By making this process more accurate, activity-based costing can promote life cycle design. However, full life cycle accounting requires more detailed costs for management decisions. The EPA approach for evaluating pollution prevention costs provides a basic model for life cycle accounting [l]. This and related indusvial accounting models are referred to as total cost assessment [2]. Figure 7-1 shows how costs are broken out from general categories for single products. Total cost assessment recognizes several costs not usually considered by standard systems. Adding hidden, liability, and less tangible costs broadens the scope of accounting sufficiently to match the range of activities included in life cycle design. Time scales are also expanded to include all future costs and benefits that might result from design.
Life cycle accounting is based on product-specific costs that occur within the life cycle framework. Extent of analysis varies, depending on project needs.
Total cost assessment provides the foundation for life cycle accounting. Full costs are determined by adding hidden, liability, and less tangible costs to usual costs. Time scales are expanded to include all future costs and benefits.
Division or Production Facility
Product
Regulatory Costs
Product
Tangible Costs
Flgure 7-1. Assigning Llfe Cycle Costs to Specific Pmduct Systems 123
Chapter 7
Each player in the life cycle experiences the costs of product development in different ways. Many of these costs overlap and span several life cycle stages. In the end, all product development costs are assumed by society.
The total cost model does not favor one set of requirements over another. For example, there can be instances when environmental improvements thal appear attractive using standard accounting are shown to be too cosUy when evaluated with the total cost method [2]. Each player in the life cycle experiences the costs of product development in different ways. Many of these costs overlap and span several life cycle stages. For example, user costs include all service and consumable~required for the product during its useful life. Purchase price, an important element in user costs, is the result of costs incurred in manufacturing and earlier stages. Some costs of manufacturing, such as liability, extend through use. retirement, and final disposal of residuals. In the end, all product development costs are assumed by society. Figure 7-2 shows how costs spread out through some major life cycle players until they are finally absorbed in society. The four main types of costs considered in life cycle analysis are briefly outlined in the following sections.
Figure 7-2. Llfe Cycle Costs in Product Development 124
Life Cycle Accounting
Usual Costs Life cycle accounting first identifies standard capital and operating expenses and revenues for product systems. Many low-impact designs offer benefits when evaluated solely by usual costs. These savings result from eliminating or reducing pollution control equipment, non-hazardous and hazardous waste disposal costs, and labor costs. In addition, pollution prevention and resource conservation design strategies can reduce material and energy costs.
Many low-impact designs offer benefits when evaluated solely by usual costs.
SOME EXAMPLESOF USUAL COSTS [I] Capital Costs Buildings Equipment
Expenses Disposal Utilities Raw materials -Supplies Labor
-
,
COMPANY
USUAL &ST
Revenues Primary products Marketable byproducts
S A W G S FROM POLLUTION PREVENTION
'OPERA~NGCHANGE
ENEFIT
AT&T
Redesignedcircuit-board cleaning process
Stopped using ozone-dapletlng dremhf, cut cleaning costs by $3 million annually
Carrier
Revamped metal cutling, and redesigned air conditionet parts -
Eliminatedtoxic solvents, cut manufacturingcost $1.2 million Cinnually
Clairoi
SMched from water to foam balls io flush pipes iq haircare product manufactwing
3M
Developed Wlesive for bx-sealing tapes that doesn't require solvent
Eliminatedthe need for $2 milliun wtth of pollutioncontrol equipment
Polaroid
Streamlined phatographlc chemical plants
Cut waste generation 31%; and disposal costs by $250,000 a year
~ e ~ r h l Metals ds
Replacedsohrenf-based ink with water-based in packaging plants
Cut emissions 85%, saved $30 million in pollution equipment .
Source: [lo]
'
Reduced waste watw 70%. =&ing $240,000 annually In disposal costs
Chapter 7
Hidden Costs
Hidden costs are mainly related to regulation. They are usually gathered for whole facilities and added to overhead. Life cycle design can reduce these costs.
Many hidden costs are gathered for entire plants or business units and assigned to general overhead. Hidden costs are mainly related to regulation associated with product development. Design projects based on pollution prevention and resource conservation can reduce such regulatory costs.
SOME EXAMPLES OF HIDDEN & REGULATORY COSTS [I]
Capital Costs Expenses Monitoring equipment Notification Reporting Preparedness and protective MonitoringAesting equipment Additional technology Record keeping Planning/studies/modeling Other Training Inspections Manifesting Labeling Preparedness and protective equipment Closure/post closure care Medical surveillance Insurance/specialtaxes
Liability Costs Liability costs include fines due to non-compliance and future liabilities for forced cleanup, personal injury, and property damage. POOr Liability costs include fines design may cause damage to workers, consumers, the community, or the and future liabilities for forced cleanup, personal ecosystem. injury, and property Avoiding liability through design is the wisest course. However, damage. liability when potential environmental problems do occur, f m s should disclose through design is the this information in their financial smtements. The Financial Accounting wisest course. Standards Board Statement number 5, Accounting for Contingencies, provides a framework for reporting environmenml liabilities [l 11. Because estimating potential environmental liability costs is difficult, these costs are often understated [12]. The accounting staff must work closely with other members of the development team to estimate liability costs.
Life Cycle Accounting
After a Denver cornpays subsidiary sold a building mdajning asbestos for $20 million dollars. a shareholder initiated a lawsuit. seeking damages, claiming that by not disclosing the asbestos problem the company managed to look profidable enough to issue new stock and debentures and inflate its stock price. At the same time the building's purchaser also sued, winning a $9,125,000 judgement which included punitive damages [I 11.
In addition to private lawsuits, companies face public liability. Governments set penalties for violating various regulations. Superfund cleanup costs provide a vivid example of such liability costs. Box 7-A shows the number of Superfund sites that are awaiting action. Total costs for cleaning these sites are estimated to be between $300 and $700 billion dollars [13]. SOME EXAMPLES OF LIABILITY COSTS [I] Legal Staff or Consultants Penalties and Fines Future Liabilitiesfrom Hazardous Waste Sites Soil and waste removal and treatment Groundwater removal and treatment Surface sealing Personal injury (health care, insurance ramifications) Economic loss Real property damage Natural resource damage Other costs treatment or storage in tanks transportation disposal in landfills other Future Liabilitiesfor Customer Injury
6 0 7-A. ~ TYPE AND ESTIMATED NWBER OF SUPERWO CLEANUP S W S TYPE
Priiate Government Current action Underground tanks Source: (131
NUMBER
9,000 5,000-10,000 , 2,000-5.000 350.000-400,OQO
Chapter 7
Less Tangible Costs
Estimating intangibles such as corporate image or worker morale is difficult. Yet addressina " such matters during design can still be beneficial. There may well be instances when less tangible costs are the difference between a successful product and an unattractive one. -
Many less tangible costs and benefits are related to usual costs, hidden regulatory costs, and liabilities. Estimating intangibles such as corporate image or worker m o d e is difficult. How these affect market share or customer loyalty may not be clear, yet addressing such matters during design can sill be beneficial. There h a y well be instances when less tangible costs are the difference between a successful product and an unattractive one. At present, less tangible environmental costs are rarely considered in development projects. Yet, ignoring less tangible costs because they are difficult to project may be a mistake. For example, it may not be enough to simply comply with all regulations. If a f m is also identified as one of the largest sources of TRI releases, its image can be damaged and profits reduced. TRI data are often reported in the media, and receive much attention. Health and safety risks caused by production or use can also have a major effect on corporate image and product acceptance. In addition, some members of society are concerned about intergenerational inequities that may result from resource depletion and ecological degradation. Such concerns can harm sales of certain products. SOME EXAMPLES OF LESS TANGIBLE COSTS [I] Consumer Acceptance Customer Loyalty Worker MoraleIUnion Relations Corporate Image Community relations
Limitations Although opportunities exist for improved accounting, barriers must be recognized. A full design evaluation requires identifying and measuring usual, hidden. liability, and less tangible costs. Determining costs for many nontraditional items and assigning these costs to specific products is a major challenge. Just estimating usual costs can be difficult. Regardless of how advanced the costing system, business services, amount of effort devoted to the project by management and design personnel. and other overhead items can usually not be measured with any accuracy.
Life Cycle Accounting In addition, externalities are beyond the scope of most accounting methods. As long as the costs for pollution, resource depletion, and other externalities do not accrue to firms, accounting systems will not reflect these costs. Cost analysis will only be complete when all environmental costs and benefits are routinely gathered for management and financial accounting.
References US EPA. 1989. Pollution Prevention B e 4 t s Manual. US Environmental Protection Agency. Office of Policy, Planning, and Evaluation & Office of Solid Waste. Washington, DC. White. Allen L.. Monica Becker, and James Goldstein. 1992. Told C O ~ Assessment: Accelerating Inahtrial Pollution Prevention Through INLOv a h e Project Financial Analysis. US Environmental Protection Agency, Office of Pollution Prevention and Toxics, Washington, DC. Johnson. H. Thomas, and Robert S. Kaplan. 1987. Relevance Lost: The Rise (utd Fall of Management Accouaing. Boston, MA: Harvard Business School Press. Kaplan. Robert S. 1989. Management Accounting for Advanced Technological Environments. Science 245: 819-823. Cooper, Robin, and Robert S. Kaplan. 1988. Measure Costs Right: Make the Right Decision. Harvard Business Review Scp-Oct: 96-103. -. 1991. Profit Priorities &om Activity-Based Accounting. Harvard Business Review May - J m 130- 135. Roth, Harold P., and A. Faye Borthick. 1991. Are You Distorting Costs by Violating ABC Assumptions? Management Accounting 73 (5): 3942. Noreen. Eric. 1991. Conditions Under Which Activity-Based Cost Systems Provide Relevant Costs. Journal of Management Accounting Research 3: 159-168. Wilkinson. John. 1986. Life Cycle Costing. Process Engineering 67 (2): 42+. Naj, Amal Kumar. 24 December 1990. Some Companies Cut Pollution by Altering Production Methods. The Wall Street J o u r ~ lA, , l+. Zuber, George R., and Charles G. Berry. 1992. Assessing Environmental Risk. Journal of Accountancy 173 (3): 4348. Surma, John P., and Albert A. Vondra. 1992. Accounting For Environmental Costs: A Hazardous Subject. Journal ofAccountancy 173 (3): 51-55. Passel, Peter. 1 September 1991. Experts Question Staggering Costs of Toxic Cleanups. The New York Times. A. 1.
APPENDIX A: SOURCES OF ADDITIONAL INFORMATION Pollution Prevention and Waste Minimization US EPA. 1991. Pollution Prevention 1991: Progress on Reducing I & f d Pollutants, US Environmental Protection Agency, Office of Pollution Prevention, Washington, DC. EPA 21P-3003. f
t
. 1991. Industrial Pollulion Prevention Opportunitiesfor the 1990s, US EPA Office of Research and Development, Washington, DC.EPA/600/8-91/052.
. 1989. Pollurion Prevention Benefts Munual (Draft),US Environmenral Protection Agency, Office of Policy. Planning, and Evaluation & Office of Solid Waste, Washington, DC. f
US EPA. 1990,91. Guides to Pollution Prevention, various industries. US Environmental Protection Agency, EPA /625/7-90,9 1:4 17.
. 1988. Waste Minimization OpportmUIUty Assessment Manual, US EPA Hazardous Waste Engineering Research Laboratory, Cincinnati,OH. EPA 625/7-88/003.
-1992. Facility Pollution Prevention Guide, US EPA Risk Reduction Engineering
Lab. Cincinnati, OH, EPA/600/R-92/088.
t
. 1991. Achievements in Source Reduction and Recycling for Ten Industries in the United States, EPA/600/2-911052.
J
. 1990.9 1. Environmental Research Briefs (waste minimbation assessments for variety of manufacturers), EPA/600/M-90117,and EPA/600/M415 through 025; 044-047.
7 Available h m : Center for Enwonmental Research Information 26 W. Martin Luther King Drive Cincinnati, OH 45268
Federal Laws and Regulations /~nvironmental Law Institute, 1989. Environmental Law Deskbook. Washington, DC: \ Environmental Law Institute.
Government Institurn Inc.. 1991. Environmental Law Handbook.Rockville, MD: G o v e m e n ~Institutes. Inc.
I
Appendix A
Life Cycle Analysis and Decision Making Battelle, and Franklin Associates, Ltd. 1991. Product Life Cycle Assessment: Inventory Guidelinesand Principles, Draft prepared for US EPA Risk Reduction E n g k a i n g Laboratory, Office of Research and Development, Cincinnati, OH. Hunt, Robert G., Jere D. Sellers, and WilliamE. Franklin. 1992. Resource and Environmental Profile Analysis: A Life Cycle Environmental Assessment for Products and Procedures. Environmental Impact Assessment Review Spring. SETAC. 1991. A Technical Framework for Life-Cycle Assessment, The Society for Environmental Toxicology and Chemistry, Washington, DC. Assies. Jan A 1991. Introduction Paper. SETAC-Europe Workshop on Environmental Life Cycle Analysis of Products, Leiden. Netherlands, 2 December 1991. Leiden, Netherlands: Centre of Environmental Science.
Heijungs, R.. J.B. Guinte, G. Huppes. R.M. Lankreijer, A.M.M. Ansems, P.G. Eggels, R. van Duin, and H.P.de(;oede. 1991. Manuul For the Enviornmental Life Cycle Assessment of Products, Centre of Environmental Science (CML, Leiden). Dutch Organization for Applied Scientific Research (TNO, Apeldoorn), and Fuels and Raw Materials Bureau (B&G. Rotterdam), Netherlands. Kepner, Charles H.. and Benjamin B. Tregoe. 1965. The Rational Manager. New York: McGraw-Hill. Saaty, Thomas L. 1980. The Analytical Hierarchy Process. New York: McGraw-Hill.
-. 1982. Decision Making for Leaders. Belmont. CA: Wadsworth. Saaty, Thomas L.. and Kevin P. Kearns. 1985. Analytical Planning. Elmsford, NY: Pergamon.
Life Cycle Case Studies [~rthur D. Little. 1990. Disposable versus Reusable Diapers: Health, Environmental and Economic Comparisons,Arthur D. Little, Inc.. Cambridge. MA.
Mekel, O.C.L.,and G. Huppes. 1990. Environmental Effects of DifferentPackage Systems for Fresh Milk, Center for Environmental Studies,University of Leiden, ?he Nelherlands.
Franklin Associates. 1990. Resource andEnvironmental Profile Analysis of Polyethylene and Unbleached Paper Grocery Sacks, Franklin Associates. Prairie Village, Kansas.
Sellers, VR., and J.D. Sellers. 1989. Comparative Energy and Environmental Impactsfor Soft Drink Delivery Systems. Franklin Associates, Prairie Village, Kansas.
Sources of Additional Information
Industry Standards F
\
American National Standards Institute (ANSI), Catalog of American National Standards, ANSI, New York. Annual publication, lists 8000 current ANSI standards. American Society for Testing and Materials (ASTM), Book of ASTM Standards, ASTM, Philadelphia, PA. Annual. lists more than 8000 standards.
Information Handling Services, Industry Standards and Engineering Data, Information Handling Services,Englewood, CO. U p dated bimonthly.
Information Handling Services,International and Non-US National Standark, Information Handling Services, Englewood, CO. Updated bimonthly. Information Handling Services. Military Specijications and Standards Service, Information Handling Services, Englewood, CO. Updated bimonthly. Underwriters Laboratory, Catalogfor Sdefy, Underwriters Laboratory, Northbrook, IL. Semiannual publication.
Occupational Safety and Health American Conference of Governmental and Industrial Hygienists (ACGIH). Cincinnati OH. TLVs- Threshold Limit Valuesfor Chemical Substances in Work Air. Updated annually. TLVIBEI Booklet. Published semiannually. Documentarion of Threshold Limit Values and Biological Exposure Indices, 5th ed., 1990. American Industrial Hygiene Association (AIHA). Workplace Environmental Exposure Level Guides (WEEL Guides), New York. 188 in all, published periodically.
Cook. M.A. 1987. Occupational Exposure Limits- Worldwide. New York: American Industrial Hygiene Associalion.
Occupational Safety and Health Administration, US Department of Labor. Washington, DC.can be contacted for regulations and publications. Twenty- one states and two temlories currently administer and enforce OSHA provisions; in these locations, employers are essentially subject to just the state OSHA agency: Alaska. Arizona, California, Hawaii, Indiana, Iowa, Kentucky, Maryland, Michigan, Minnesota, Nevada, New Mexico. Norlh C a r e h a , Oregon, Puerto Rico, South Carolina, Tennessee, Utah, Vermont, Virgin Islands, Virginia, Washington, Wyoming.
APPENDIX B: SUMMARY OF MAJOR FEDERAL ENVIRONMENTAL LAWS
ACTS
Legislation established by Congress describing a policy or program. The Act generally designates an agency, department or commission which has more expertise than Congress to develop specific details of the program. Some provisions of the Act apply directly to the public. Laws are generally implemented through regulations, guidance documents, policy statements, and enforcement, Regulations are published in the Federal Register. Each year. they are compiled and placed in the Code of Federal Register.
Background
CLEAN AIR ACT Administeredby US EPA
The Federal Clean Air Act was enacted in 1970, substantially amended in 1977. and significantly expanded in 1990. The 1970 act contained three titles: Title I dealt with stationary sources, Title I1 dealt with mobile sources such as cars, and Title I11 provided definitions and standards for judicial review and citizen suits. The 1977 amendments retained this structure, adding special provisions for areas with cleaner air in subtitle C of Title I, and nonattainment areas in subtitle D. The 1990 amendments overhauled the nonattainment provisions in subtitle D of Title I, added comprehensive technology-based regulations of toxic air pollutants in a rewritten section 112, added Title IV to deal with acid rain (focused on the power plants thought to be the primary source of these emissions), and added Title V to greatly strengthen enforcement provisions and set much stricter requirements for nonattainment areas and emissions from mobile sources. Title VI was also include to mandate the phase-out of chlorofluorocarbons (CFCs).
Key Provisions
-
Sec. 3 National Ambient Air Quallty Standards (NAAQS) Establishes NAAQSs to protect public health and also secondary NAAQSs to protect public welfare.
Sec.4 - State lmplementatlon Plan (SIP) Each state has primary responsibility for assuring air quality within its borders by submitting a state implementation plan (SIP) specifying how primary and secondary NAAQSs will be achieved and maintained. SIPs are subject to EPA approval. They require reduction of emissions from existing stationary sources to comply with NAAQSs.
-
Sec. 5 New Source Performance Standard Federally-formulated, technology-based emission standards for new or modified stationary sources in various industry categories are covered in this section. Also provides requirements for solid waste combustion. Sec. 6 - Prevention of Significant Deterloration Program (PSD) Requires each state's SIP to contain emission limitations and any other necessary requirements to prevent significant deterioration of air quality. This statute establishes a three-tiered classification system for certain public lands and regions with air quality levels for sulfur oxides and particulates better than NAAQSs, and limits allowable increases in both these pollutants for each classification. More stringent requirements than NSPS and NAAQS are imposed in these regions, and in no case may allowable concentrations of any pollutant exceed NAAQSs.
-
Sec. 7 Nonaltalnment areas SIPs must provide that nonattainment areas achieve compliance with NAAQSs. In NAAs, permits must be obtained for the construction and operation of new or modified stationary emission sources. Technology -based limitations more stringent than NSPs (the lowest achievable emission rate or (LAER)) are imposed. Permits will be granted only if total emissions from existing sources and the proposed new source will be less than existing emissions before the application. This is the offset requirement. Existing sources in NAAs are required to use reasonably available control technology PACT). Standards were significantly tightened by the 1990 amendments.
CLEAN AIR ACT Administered by the US EPA
Appendix B
-
CLEAN AIR ACT Administered by the US EPA
Section 8 Natbnai Emission Standards for Hazardous Air Pollutants (NESHAPs) Addresses particularly hazardous air pollutants that may not be covered by NAAQSs. Pollutants covered in this section "may reasonably be anticipated to result in an increase in mortality, or an increase in serious irreversible. or incapacitating reversible illness." Standards are imposed on both new and existing sources for 189 listed hazardous air pollutants or categories of pollutants. Section 9 - Acid rain provisions Addresses the Title IV acid rain program and imposes regulations on fossil-fueledpower plants.
-
Section 10 New permitting requirements Explains Title V's new permit program for stationary sources and new regulations imposed on those sources. Section 11- Mobile source and fuel requirements Addresses the mobile source and fuel requirements of the 1990 amendments of Title 11.
-
Section 12 Otone protection Requires the phase-out of CFCs and other substances thought to destroy the ozone layer.
Background CLEAN WATER ACT Administered by the US EPA
In 1972 Congress passed the Federal Water Pollution Control Act; the act was amended and renamed the Clean Water Act in 1977 and its regulatory focus changed to control of toxic pollutants. In 1987, extensive amendments were added to the act to improve water quality in areas where existing minimum discharge standards were insufficient to assure attainment of stated water quality goals. The objective of the CWA is to restore and maintain the chemical, physical, and biological integrity of the nation's waters.
Summary of Major Federal Environmental Laws
Key Provisions Grants for construction of treatment works Provides for the application of the best practicable technology, and states that waste treatment management should be on an areawide basis, addressing both point and nonpoint sources. National Pollutant Discharge Elimination System (NPDES) This is the primary mechanism for imposing limitations on pollutant discharges. Under the NPDES program, discharge of any pollutant from public or private point sources requires a permit. In addition, the National Pollution Discharge Elimination System requires all dischargers to disclose the volume and nature of their discharges and report on compliance with mandated limitations. Effluent standards are derived through two methods: Technology -based effluent limitations require that point sources of toxic, nonconventional, and conventional pollutants must comply with effluent limitations based on the best available technology economically achievable (BAT) for toxic and nonconventional sources, and best conventional pollution control technology (BCT) for conventional sources. Water quality-related effluent limitations. If, after application of technology-based limits, effluent discharges interfere with attainment or maintenance of water quality, additional effluent limitations may be established. Water quality standards and implementation plans Establishes procedures for reviewing and modifying existing state water quality standards and issuing new standards. Each state is required to have a continuing planning process that incorporates areawide waste treatment management and total maximum daily loads to maintain water quality. New source performance standards (NSPS) Creates and regulates new source performance standards. Toxlc and pretreatment effluent standards Provides for additional requirements on discharges of toxic chemicals and provides for special situations such as oil spills.
CLEAN WATER ACT Administered by the US EPA
Appendix B
Background
CERCLA AND SUPERFUND AMENDMENT AND FEMmmmTlON ACT (SARA) Administered by the US EPA
The Comprehensive Emergency Response, Compensation and Liability Act (CERCLA) was enacted 1980. Significant revisions to CERCLA were made through SARA in 1986. SARA substantially expanded the scope and complexity of CERCLA, but it is part of the original act, not a replacement. The goal of this legislation is to provide funding and enforcement authority for cleaning up thousands of hazardous waste sites in the US and responding to hazardous substances spills. Funding for these activities is derived from special taxes on the petrochemical and chemical industry, domestic and imported crude oil, and other basic industries such as automobile, aircraft, and electronics manufacturers. The act covers all environmental media (air, water, land). Federally permitted releases under the Clean Air Act and Clean Water Act are exempt from emergency response. Other than these exemptions, CERCLA response or liability is broadly triggered by the release or threat of release of a hazardous substance or pollutant or contaminant.
Definition of hazardous substance Any substance designated as hazardous under the Clean Air Act, Clean Water Act. Toxic Substances Control Act, or any RCRA hazardous waste. By 1990, there were about 720 hazardous substances and 1500 radionuclides on the list. Actions can be triggered by any concentration of a listed substance, and this substance does not have to be a waste; it can be a product or classified in some other manner. Thus, waste that is judged to be RCRA nonha7zdous may come under CERCLA jurisdiction.
Key Provisions National Contingency Plan (NCP) States that a NCP shall be published by the President to provide for efficient and coordinated action and establish priorities for various releases.
Summary of Major Federal Environmental Laws
Liability of responsible parties and financing optlons for remedlai actlons Parties who may be responsible - past owners or operators of the site
CERCLA AND SUPERFUND AMENDMENT AND ACT (SARA) Adminisfered by fhe US EPA
Background This legislation was enacted as a freestanding provision of the Superfund Amendments and Reauthorization Act (SARA) of 1986. The December 1984 release of methyl isocyanate in Bhopal, India which killed thousands of people was the major impetus for this act.
Key Provisions Subtitle A -Emergency response and notification for extremely hazardous substances Section 302 and 304 Compels state and local governments to develop plans for responding to unanticipated environmental releases of a number of chemical substances identified as extremely hazardous. When the law was written, 402 extremely hazardous substances (EHSs) were listed. Mandates creation of State Emergency Response Commissions (SERCs) and Local Emergency Planning Committees (LEPCs). Requires facilities containing EHSs in excess of specified Lhreshold planning quantities (TPQs) to notify state and local emergency planning entities of the presence of those substances and to report on the inventory and environmental releases (planned and unplanned) in excess of specified reportable quantities (RQs) of hose substances. Releases of certain substances requires emergency notification to state and local commissions and the EPA.
EMERGENCY PLANNING AND COMMUNITY RIGHT TO KNOW ACT (EPCRA) (SARA TITLE Ill) Adminisrered by fhe US EPA
Appendix B
-
Subtitle B Reporting and notification requirements for toxic and hazardous substances
EMERGENCY PLANNING AND COMMUNITY RIGHT TO KNOW ACT (EPCRA) (SARA TITLE Ill) Administered by the US EPA
Section 3 1 1 and 3 12 - Hazardous chemical provisions Inventories and site-specific information on chemicals considered physical or health hazards under OSHA's Hazard Communication Standard must be provided through material safety data sheets (MSDS) to state and local authorities, including fire departments. Section 3 13 - Toxic chemical release repatting Applies to certain manufacturing facilities or operators with 10 or more employees in SIC codes 20 - 39 manufacturing or using listed chemicals in excess of specified threshold quantities. The purpose of section 3 13 reporting is to inform government officials and the public about releases of toxic chemicals in the environment. Facilities must compile a toxic chemical release inventory (TRI) which identifies how many pounds of chemicals identified as a concern were released to air, water, or land or transferred off site (chemicals shipped off site may be sent to RCRA-regulated treatment, storage, and disposal facilities, to public sewage treatment plants, or Lo other disposal sites). In 1989,22,569 facilities reported releases of 5.7 billion pounds of the 322 listed chernicals/chemical categories. 74% of this total was released on site to air, water, and land; 26% was transferred off site. 25 chemicals accounted for 83% of TRI releases in 1989. The chemical industry accounted for 48% of total releases. Threshold reporting limit was lowered from 75,000 lbs in 1987 to 25,000 Ibs in 1989 for facilities manufacturing or processing listed chemicals. Facilities otherwise using listed chemicals in excess of 10,000 lbs per year are also required to submit TRI forms.
Summary of Major Federal Environmental Laws This act requires that all pesticides, fungicides, and rodenticides be registered with the EPA. Manufacturers must follow proper labeling procedures and provide information demonstrating the absence of unreasonable adverse effects on the environment when the substance is used. As part of the registration process, EPA classifies each substance as being for general use, reslricted use, or both.
FEDERAL INSECTICIDE, FUNGICIDE, AND RODENTICIDE ACT (FIFRA)
Also includes the Forest and Rangeland Renewable Resource Planning Act
Key Provision Establishes procedures for the sale of forest timber. Mandates Department of Agriculture to maintain a Renewable Resource Program to protect the quality of soil, air, and water in the National Forest System while managing and developing forest resources. Management plans provide for multiple use, sustained yield of products and services that ensure consideration of environmental consequences and restrict intensive management systems and clear cutting. Sale of timber from each national forest is limited to a quantity that can be removed annually in perpetuity on a sustained-yield basis.
Background Adopted in 1970, the Occupational Health and Safety Act seeks to ensure that "no employee will suffer material impairment of health or functional capacity" from a lifetime of occupational exposure to workplace conditions. The act covers health hazards which are largely chemical in nature (noise is also included in this category) and safety hazards which are largely electrical and mechanical in nature. In 1990, the only amendment to the law was adopted. This provision increases penalties for certain classes of violations. Conflicts between the Occupational Health and Safety Administration (OSHA) and EPA over commonly regulated substances are not
NATIONAL FOREST MANAGEMENT ACT Adminisfered by Deparfment of Agriculture
OCCUPATlONAL HEALTH AND SAFETY ACT (OSHA) Adminisfered by OccupafionalHealth and Safety Adminisfrafion(Depf.of Labor)
Appendix B
OCCUPATIONAL HEALTH AND S A F W ACT (OSHA)
Administered by OccupafionalHealth and Safety Adminisfrafion(Deparhnenf of labor)
common because EPA's mandate extends over land, water, and air, while OSHA's jurisdiction is limited to conditions existing in the workplace. OSHA is enforcement oriented and its roles include: Setting safety and health standards. Enforcing standards through federal and state inspectors Providing public education and consultation.
Adoption of Standards Standards may be adopted in the following three ways:
Section 6(a) Allowed OSHA to adopt "national consensus standards" to get start-up provisions on the books expeditiously. Although this authority expired on April 28, 1973, considerable use of this provision was made while it was in effect. As a result, the vast majority of current OSHA standards were adopted under Section 6(a). Sect Ion 6(b) Applies to all permanent standards (to remain in effect more than six months). Regulatory actions may be instigated by reports, studies, and other publications; trade association standards; National Institute of Occupational Safety and Health bulletins; or standards fiom independent safety and health organizations. Requires advanced notification of OSHA intent to promulgate a regulation and allows for public comment. which may include hearings. Cost and technological feasibility are examined before regulations are issued. Sectlon 6(c) Permits the adoption of "emergency temporary standards" where a grave danger exists and emergency action is necessary to protect employees from harm. Section 6(c) standards expire 6 months after adoption. This authority is very limited and rarely used.
Employer Duties OSHA Standards, rules, regulations and orders Employers must comply with all health and safety standards promulgated under the OSHA, including rules, regulations, and orders
Summary of Major Federal Environmental Laws
pursuant to the act. Penalties can be imposed by the government on employers but not employees. Both record keeping and adherence to specific standards is covered.
General Duty Clause Included in the act to fill gaps that might exist in standards, and intended to cover only hazardous conditions that are obvious and admitted by all concerned.
Inspection and Enforcement Approximately 2,500 federal and state OSHA inspectors stationed at 100 locations nationwide conduct over 50,000 inspections annually. All employees are covered by the act, except those covered under existing occupational health and safety laws at the time of the act's adoption, and federal and state employees. Governments may adopt measures similar to OSHA. If the employer does not consent to an inspection voluntarily, OSHA must obtain a warrant. Employers in noncompliance are issued a written citation describing the exact nature of the violation. If the violation is not corrected within a fixed time, a penalty is proposed.
-
Key Standard
-
Hazard Communication Standard (HCS) Worker Right to Know Rule OSHA's HCS went into effect in 1985 for manufacturers. In 1987 it was applied to all employers. The HCS alerts employees to the existence of possibly dangerous substances in the workplace and the proper means of protection. Unlike most OSHA standards, it does not impose mandatory limitations or requirements on conditions, but rather focuses on information. List of all hazardous chemicals on the premises must be prepared. A material safety data sheet (MSDS) must be on hand or prepared for each hazardous material. This includes information about chemical composition of a substance, physical characteristics, health and safety hazards, and precautions for safe handling and use.
OCCUPATKINAL HEALTH AND SAFETY ACT (OSHA) Administered by Occupational Health and Safety Administration (Deparmtent of labor)
Appendix B
OCCUPAmAL HEALTH AND SAFETY ACT (OSHA)
Each container of hazardous material must be properly labeled with hazard identification and warning along with the name and address of the manufacturer or responsible party. Workers must be trained and educated about chemical risks. A written program for observing the HCS must be prepared and maintained for each worksite.
Background POLLUTION PREVENTION ACT OF 1990 Administered by the US EPA
This act greatly expands the EPA's role in encouraging pollution prevention (source reduction) in all its programs and activities. The act addresses the historic lack of attention to source reduction and states that "source reduction is fundamentally different and more desirable than waste management and pollution control". As a matter of US policy, the act establishes the following hierarchy: pollution prevention. recycling, treatment, and finally disposal or release, all to be accomplished in an environmentally safe manner.
Key Provisions Section 6604 Creates an office within EPA (as of 1992 the Office of Pollution Prevention and Toxics) to coordinate all agency pollution prevention activities. Mandates adoption of a strategy to adopt multi-media prevention approach in all programs, offices, and activities. As a result of this provision, the EPA established the 33/50 program. This program targets 17 chemicals reportable under TRI for a 33% reduction in releases and transfers by 1992, and a 50% reduction by the end of 1995, compared to 1988. This is a voluntary program aimed at industries reporting the largest releases and transfers of the 17 high-priority chemicals.
Section 6605 Establishes a grants program to the states so technical assistance and training in pollution prevention can be made available to business and industry. Grants in this program are limited to 50% of total costs; states must provide the remainder.
Summary of Major Federal Environmental Laws
Section 6606 Requires the establishment of a source reduction clearinghousc to compile and actively disseminate information on source reduction and serve as a technology transfer resource. The Pollution Prevention Information Clearinghouse (PPIC) now serves this function. The EPA also established the Pollution Prevention Information Exchange System (PIES),a computerized information database available to the public which permits entry and retrieval of material on industrial source reduction, technology transfer, and education.
POLLUTION PRWENTION ACT OF 1990
Section 6607 Mandates that EPA collect data on source reduction, recycling, and treatment of all chemicals listed on TRI reporting forms. In 1991, facilities are required to report the following information on TRI forms: the amount of reported chemicals entering any waste stream prior to recycling, treatment, or disposal; the percentage change from the previous year; and estimates for the next 2 years. The amount of reported chemical recycled on or off site. the process used, and percentage change from the previous year. The quantified results of source reduction practices by various categories, and the techniques used to identify source reduction opportunities.
Administered by the US EPA
Appendix B
Background
RESOURCE CONSERVATK)N AND RECOVERY ACT (RCRA) Administered by the US EPA
In 1965, the Solid Waste Disposal Act (SWDA) was enacted to ensure the environmentally sound management of solid wastes. RCRA was enacted in 1976, and the Hazardous and Solid Waste Amendments of 1984 expanded the act. The goals of RCRA are to urotect human health and the environment, reduce waste and conserve energy and natural resources, and reduce or eliminate the generation of hazardous waste as expeditiously as possible. All hazardous waste produced is to be treated, stored, and disposed of so as to minimize the present and future threat to human health and the environment. RCRA imposes full life cycle management controls on hazardous waste by addressing generators, transporters, and operators of treatment, storage, and disposal (TSD) facilities.
Key Provisions Subtitle C - Hazardous Waste Program Section 3001- Identificatbn and listing Lists particularly hazardous wastes subject to regulation and standards applicable to generators, transporters, and owners and operators of hazardous waste treatment, storage, and disposal (TSD) facilities. Hazardous waste identified as ignitable, corrosive, reactive, or toxic is listed one of three ways: non-specific source wastes, specific source wastes, and commercial chemical products. Action is based on threshold concentrationsof listed wastes. Provides that all those generating or handling listed hazardous wastes notify the EPA of the nature and location of their activities. Section 3002,3003 - Generator and transporter provisions Establishes record keeping, labeling and manifest systems. and proper handling methods for generators and transporters. Transporters must also comply with regulations regarding the delivery of substances to designated TSD facilities, as well as Department of Transportation requirements. The amendments of 1984 significantly expanded coverage to include more than 200.000 companies which produce less than 1,000 kg of hazardous waste per month. Over 500,000 companies and individuals who generate hazardous waste must comply with RCRA regulations.
Summary of Major Federal Environmental Laws
Section 3004, 3005 - TSD facilities requirements Requires permits to be granted for treating, storing, or disposing listed hazardous wastes. Also imposes standards applying to financial aspects, groundwater monitoring, minimum technology usage, and closure procedures. Disposal of untreated hazardous waste is subject to a phased-in ban. Establishes interim status provisions for existing TSD facilities. Sections 3007, 3008 - Site inspection and enforcement Authorizes site inspections and provides enforcement capabilities Uuough both administrative and civil actions. Criminal actions may be brought which carry a penalty of up to $50,000 per day or from 2 to 5 years in jail. Section 30 12,3006 - State inventories and state authority Each state must compile an inventory describing the hazardous waste storage and disposal sites within the state. RCRA encourages States to take over the responsibility for program implementation and enforcement from the Federal Government.
-
Subtltle D Solld Waste Program Establishes guidelines and minimum requirements for state solid waste plans as well as procedures for developing and implementing such plans. Prohibits open dumping.
-
Subtltle I Underground Storage Tanks Program Regulates underground storage tanks and mandates each owner of such a tank for regulated substances to notify the appropriate state or federal agency of the tank's existence and describe its function. Amendments of 1984 include tanks containing hazardous waste or petroleum, affecting hundreds of thousands of facilities.
RESOURCE CONSERVATION AND RECOVERY ACT (RCRA) Administered by the US EPA
Appendix B
Key Provisions
SURFACE MINING CONTROL AND RECLAMATION ACT Administered by the Department of the Interior
Abandoned mine reclamation Establishes the abandoned mine fund with fees paid by coal mine operators and user charges to reclaim and restore land and water resources adversely affected by past mining and to prevent and control other impacts associated with mining. Coal mine operators are required to pay a quarterly reclamation fee and submit statements about their mining operations. Regulation of surface coal mining's environmental impacts Performance standards are set for surface coal mining and reclamation activities. = Permits for surface and underground coal mining operations require operators to implement measures to restore land, manage wastes, and prevent subsidence.
Background TOXIC SUBSTANCES CONTROL ACT (TSCA) Administered by the US EPA
Enacted in 1976, TSCA allows EPA to acquire sufficient infonnation to identify and evaluate potential hazards from chemical substances and to regulate the production, use, distribution, and disposal of such substances where necessary. The act may also be used to regulate biotechnology and genetic engineering.
Key Provisions Testing Manufacturers and processors are required to test certain substances to determine whether they present an unreasonable risk of injury to health or the environment. Based on these tests, EPA may require manufacturing notices, develop regulations regarding distribution and handling, or initiate civil action to address an imminent hazard. Manufacture and processing notification for new substances Manufacturers must notify EPA 90 days before producing a new chemical substance and submit any required test data. This is referred to as a premanufacturing notice (PMN).
Summary of Major Federal Environmental Laws
When no testing is required, manufacturers must submit information such as molecular structure, categories of use, amounts of production, description of by-products, disposal methods and all existing data concerning the environmental and industrial health effects of each substance to demonstrate that the substance will not present an unreasonable risk. If information is insufficient, EPA may issue a proposed order restricting manufacture until further information is developed.
Regulation For substances that present an unreasonable risk, rules may be issued prohibiting or limiting manufacture,or regulating use and disposal. Imminent hazards Substances identified as imminent hazards by EPA may be seized through civil action. Other actions such as mandatory notification and recall by manufacturers and processors may be required. Reporting Regulations apply to record keeping procedures and reporting requirements. Manufacturers and processors are mandated lo keep inventories and mainrain records of significant adverse reactions caused by their substances. The EPA compiles a list of each chemical substance produced in the US from these records.
References Govenunent Institutes, Inc., 1991. Environmental Law Handbook. Rockville. MD: Government Institutes, Inc. Environmental Law Institute, 1989. Environmental Lmu Deskbook. Washington, DC: Environmental Law Institute.
TOXIC SUBSTANCES CONTROL ACT (TSCA)
Administered by the US EPA
APPENDIX C: OVERVIEW OF ENVIRONMENTAL lMPACTS Before development teams begin a life cycle design project, they should understand the range of impacts caused by human activity. Such an undersmding underlines the need for life cycle design. Environmental, health, and safety impacts include: habitat and species destruction potential health risks to present and future generations availability of resources for future generations distribution of resources among populations distribution of risks among affected populations Every product and service contributes to multiple environmental impacts. For example, use of agricullural pesticides results in hazardous waste generation from manufacture. health risks to production workers and applicators, groundwater contamination. ecological degradation through bioaccumulation, and human health risks from pesticide residue in food. There are many ways to set environmental design priorities. Emphasis will vary among product groups and companies. Because impacts occur on a local, regional. and global scale, priorities must also address scope. Local and regional concerns may appear more important to some development teams than global impacts, but a broader focus may be indicated in many life cycle design projects. Priorities based on a global view of environmental impacts may differ from those addressing strictly local issues. Priorities for environmental impacts se1 by the Ecology and Welfare Subcommiltee of the Science Advisory Board of the US EPA [l] provide an example of ranking with a global perspective:
Relatively High-Risk Problems Global climate change Habitat alteration and destruction Species extinction and overall loss of biological diversity Stratospheric ozone depletion Relatively Medium-Risk Problem Acid deposition Airborne toxics Herbicidesfpesticides Toxics, nutrients, biochemical oxygen demand, and turbidity in surface waters Relatively Low-Risk Problems Acid runoff to surface waters Groundwater pollution Oil spills Radionuclides Thermal pollution Items within the three groups are ranked alphabetically, not by priority. The EPA undertook this study to target environmental protation efforts on the basis of opportunities for the greatest risk reduction. In developing the hierarchy, EPA considered reducing ecological risk as important as reducing human health risk. The following sections contain an overview of some major environmental problems. This will help design teams gain a better understanding of environmental impacts.
Munlcipai Solid Waste (MSW) The rate of municipal solid waste generation may be related to relative wealth, but it can also measure how efficiently a society consumes resources. In the United States, mountains of lost resources are accumulating as waste generation rates continue to rise. Increasing amounts of solid waste provide a reminder of the consequences of single-use products and profligate resource consumption. In addition to being unsightly and unpopular, landfills may require indefinite monitoring and treatment even after closure. The US generated nearly 180 million tons of MSW in 1988, or 4 pounds per person per day. This compares to 2.65 Ibs generated per person per day in 1960. By 2010 per capita daily generation is expected to reach 4.9 pounds [2]. As Figure 1 shows, both gross and net discards have been trending upward for the last thirty years. Although material recovery for recycling increased to 13%of generated MSW in 1988
Appendix C
Milllon
Tons
..,.,.
1960
1965
1970
1975
..-. Net Discards'
-......
1980
1885
1990
'Material recovery only: no incineration
Source: [2,3]
Figure 1. Trends In Gross and Net Discards of US Municipal Solid Waste (MSW)
compared to 7% in 1960, net discards without incineration nearly doubled during the same period. Net MSW discards after material recovery amounted to 156 million tons, or 400 million cubic yards, in 1988. Tables 1-3 show the composition of this waste stream and the relative importance of various management activities. Industrial Waste and Toxic Releases Consumer products and packaging are a significant fraction of municipal solid waste. But industrial production of goods and services generates the vast majority of this nation's solid and hazardous waste. US industries annually create 10.9 billion tons of nonhazardous waste as reported under the solid waste management provisions of the Resource Conservation and Recovery Act (RCRA). Although classified as solid, wastewater accounts for approximately 70% of this total. Figure 2 shows the major nonhazardous solid waste generating sectors in the US. Industries also generate 700 million tons of hazardous waste each year [4]. RCRA defines hazardous waste as either explosive, corrosive, reactive, or toxic.
Overview of Environmental Impacts
Table 1. Management of MSW, 1988 -
-
ACTIVITY
~
-
AMOUNT (MILLION TONS)
Landfill Material Recovery Incineration
130.5 23.5 25.5
~
-
-
PERCENT OF TOTAL 72.7 13.1 14.2
Source: [2]
Table 2. Products Generated in MSW, 1988
Containers/Pckg. Nondurable Goods Durable Goods Yard Waste Food Wastes Other
56.8 50.4 24.9 31.6 13.2 2.7
31.6 28.1 13.9 17.6 7.4 1.5
Source: [2]
Table 3. Welght and Volume of Materials Discarded In MSW, 1988
Paper Yard Waste Plastics Food Wastes Glass Ferrous Metals Wood Other Rubber, Leather Textiles Aluminum Source: [2]
Appendix
C
Oil and Gas 1.4 (12.8%)
other .13 (12%) MSW .18 (1.6%)
Total Generated: 10.9 Billion tons. Utility coal combustion accounts for the other category. Mining wastes exclude mineral processing. Source: [9]
Figure 2. Annual US Nonhazardous Waste Generation In Bllllon Tons
Another program, the Toxic Release Inventory (TRI)provision of the Emergency Planning and Community Right to Know Act (EPCRA), provides information on 322 listed chemicals and chemical categories defined as toxic. In 1989.22.569 facilities reported releases totaling 5.7 billion lbs (2.85 million tons) of TRI chemicals. Of this total, 74% were released on site to air, water, and land, while 26% were transferred off site. Twenty-five of these chemicals accounted for 83% of TRI releases in 1989 [5] (see Box A). Box B provides the percentage of TRI releases to each medium. The environmental impacts of a chemical releases depend on exposure and the chemical's mobility, persistence, and toxicity. Ecologlcal Degradation Human activities result in ecosystem destruction and a loss of the planet's biodiversity. The assault on tropical rain forests in the interest of short-term goals is one of the most notorious recent examples of the impacts caused by excessive resource use and poor management. This "development" causes soil loss and degradation, local climate changes, and disruption of native people. Destroying tropical rain forests also critically affects biodiversity. Although only about 6% of the earth's surface is covered by moist tropical forests, they contain at least half of all the world's species. As an extreme example, one survey in Kalimantan, Indonesia counted more
Overview of Environmental Impacts
Box A. THE 25 MAJOR TRI CHEMICALS
Ammonium sulfate Hydrochloric acid Methanol Ammonia Toluene Sulfuricacid Acetone Xylene (mixed isomers) 1.I ,1-Trichloroethane Zinc compounds Methyl ethyl ketone Chlorine Dichloromethane
Manganese compounds Carbon disutfide Phosphoric acid Nitric acid Ammonium nitrate (solution) Freon 113 Glycol ethers Ethylene glycol Zinc (fume or dust) Copper compounds Chromium compounds n-Butyl alcohol
&X
B. 1989 TRI RELEASES TC VARIOUS MEDIA
Air Underground Transfer off-site Public sewage Land Surface Water
Source: [5]
Source: [5] than 700 species of trees. The study area contained only 10 selected 1 hectare plots. One hectare equals 2.47 acres, so the total area surveyed was slightly less than 25 acres. For comparison. all of North America also contains about 700 native tree species 161. Many species in moist tropical forests are not yet catalogued, so their natural histories remain unknown. Continued habitat destruction may result in their extinction before they are discovered or studied. Even if we value other species only for their potential benefits to us, actions that lead to significant species extinction are unwise. Unless sufficient areas are preserved, useful, perhaps even critical, substances may be permanently removed from possible discovery. Tropical rain forests have already been reduced to 55% of their original cover, and deforestation continues at an annual rate of approximately 100,000 square kilometers, or 1% of the total remaining cover [6]. Although extremely rich in species diversity, these ecosystems are fragile and susceptible to long-term damage from human actions. Deslruction of habitat is not confined to high-profile ecosystems. Vast areas in all parts of the globe have been greatly altered by expanding human populations. In the United States, old-growth forests of the Pacific Northwest now cover only about 10%of their original range. Continued rapid destruction of these areas threatens species such as yew trees which grow in the understory of old-growth forests. The drug taxol, a promising medication for treating cancer, is produced from such uees.
43% 21% 16% 10%
8% 3%
Exploitation of NonsustalnableResources Products should not depend on materials derived from rare plant and animal species or scarce minerals. In addition to causing degradation of natural habitats, exploitation of many potentially renewable resources is proceeding at rates well in excess of their regenerative capacity. Use of these valuable resources at the current pace cannot continue indefinitely.
Energy Use Energy consumption is the most obvious example of human reliance on nonrenewable resources. Product systems consume energy in all life cycle stages. Energy also becomes embodied in some materials. For example, energy contained in plastics could be released by combustion. In this way, the energy content of the petroleum used as a feedstock might not be lost. However, if the material is disposed in a landfill, its energy content will be a form of waste. At present, the world depends on fossil fuels for 88%of all purchased energy. Each year, 500 million road vehicles consume half the world's oil, or 19% of total energy demand [7]. Industrial processes consume another 40% of world energy demand each year [8]. Table 4 shows how energy supplies are exploited. Population increased 3.5 times and total world power use increased 13 times during the last 100 years [9]. Figure 3 demonstrates these trends. Calculations are based on total power use (energy per unit time). Traditional biomass fuels such as wood, crop wastes, and dung are included in Figure 3. Fossil fuel use rose by a factor of 20 during this period. Although citizens of the developed countries are only about 23% of world population, they use two-thirds of the world's total energy. The proportion is higher when purchased fuels alone are considered. By consuming 6.8 times more power per capita than people in less developed countries (7.5 kW vs. 1.1 kW),each citizen of the developed world annually uses the equivalent of about 35 barrels of oil [9]. Climate Change Combustion of fossil fuels for energy produces carbon dioxide, a greenhouse gas that traps heat and can lead to global warming. Human activity in the last two hundred years has dramatically increased atrnospheric concentrations of the greenhouse gases carbon dioxide, methane, nitrous oxide, and halocarbons. Human activity causes methane release from rice fields, cattle, landfills, and fuel production. Nitrous oxide emissions result from fertilizer use and soil dynamics in agricultural and
Overview of Environmental Impacts Table 4. Purchased World Energy Consumption, 1988
Oil Coal Natural Gas Hydroelectric Nuclear
121 96 20 22 17
38% 30% 20%
7,000 150,0OOC 8,000
60 1,500 120
7% 5%
A quad is one quadrillion (1015)British thermal units (Btus). One Btu is the heat required to raise one pound of water one degree F. One billion barrels of oil contain 5.8 quads of energy. Emnomically recoverable: includes known and estimated undiscovered reserves. "Undiscovered coal reserves are estimated at more than ten times known reserves; undiscovered reserves of oil and gas are estimated at less than half known reserves. a
0
1890
1910
1930
1950
1970
1990
Source: (151
Figure 3. Trends In World Population and Power Use
Appendix C disturbed areas, with some contribution from combustion. Halocarbons containing chlorine and bromine serve as propellants, refrigerants, blowing agents, and solvents (chlorofluorocarbons). Bromine-containing halons are used as frre retardants [Ill. Clouds and various aerosols in the earth's atmosphere reflect about one third of incoming solar radiation. Greenhouse gases allow the remaining short-wave solar radiation to pass through the atmosphere, but they partially absorb outgoing long-wave radiation emitted by warm earth surfaces. Absorbed radiation is then re-emitted back to the surface, causing warming. Table 5 shows some characteristics and concentrations of various greenhouse gases capable of causing global warming. Ozone is also an effective greenhouse gas, especially in the troposphere (the lower 10-15 km of the atmosphere). Because of its short lifetime in the troposphere and chlorine-induced destruction in the stratosphere (the atmosphere above 15 km), its global warming effects are not well known. Other processes caused by pollution influence global warming. Sulfur aerosols reflect incoming solar radiation from the earth, resulting in cooling. The effect of such aerosols on possible climate change is largely unknown. However, the atmospheric residence time of sulfur aerosols is much shorter than greenhouse gases, ranging from days in the troposphere to several years in the stratosphere. Decreases in sulfur
Table 5. Characteristics of Major Greenhouse Gases TOTAL HUMAN AVERAGE EMISSIONS/YR. RESIDENCE (MIUION TONS) TIME Carbon Dioxide Methane Nitrous Oxide Halocarbons
6000 300-400 4-6 1
50-200 yrs. 10 yrs. 150 yrs. 65-130yrs.
CONCEN- CONCEN- CONTRI- RADIATIVE TRATION
TRATION
1765
1990
280 ppm -8 PPm .285 ppm 0
350 ppm 1.7 ppm .31 ppm .38ppb3
BUTIONTO FORCING WARMING' EFFICIENCY~
56% 11% 6% 24%
1 58 206 4860
'Estimated contributions from 1980-1990. Since preindustrial times, CO, has contributed an estimated 61% to potential global warming, methane 17%. nitrous oxide 4%, and CFCs 12%. 20n a per unit mass basis relative to CO, (i.e. 1 kg of each gas, not an equal number of molecules). Radiative forcing here is positive; long-wave radiation reflected back to earth results in warming. 3As average of CFC 11 & 12; also cause depletion of stratospheric ozone layer. Source: (11-131
Overview of Environmental Impacts aerosol emissions will therefore have an immediate effect on global warming, but there will be a considerable lag between decreases in emissions of most greenhouse gases and climatic effect. The current atmosphere can be compared to historic conditions by several means. One method measures the concentrations of gases trapped in glacial air bubbles. Because the age of glacial core samples can be determined with some confidence for both recent and ancient times, this gives a relatively accurate picture of past atmospheres. Through such studies, scientists have discovered that atmospheric concentrations of carbon dioxide rose 25% since 1765. Methane concentrations doubled in the same period. Changes in total human releases of greenhouse gases are not precisely reflected in atmospheric concentrations. The various gases are cycled through the biosphere in a complex manner. Many details of this cycling remain unknown. For example, although scientists now estimate that about half the 6 billion tons of anthropogenic (human-caused) carbon dioxide released each year remains in the atmosphere, many aspects of the carbon dioxide cycle are still unclear. Based on best current estimates, about 30% of total human carbon dioxide emissions result from land use changes, largely deforestation. Fossil fuel combustion accounts for the remaining 70% [14]. The Global Warming Potential (GWP) of greenhouse gas emissions is much less well known than their radiative forcing efficiencies, shown in Table 5. Estimating the GWP of emissions is a difficult task given the complex interactions of gases in the lower and upper atmosphere. Not knowing how long various gases remain in the atmosphere creates more uncertainty. Table 6 gives current estimates of the Global Warming Potential of major greenhouse gases. Developed countries account for 54% of all greenhouse gases added to the atmosphere each year while developing countries contribute the remaining 46% [14]. A greenhouse index can be produced by estimating net additions of each gas (total emissions multiplied by the percentage eventually added to the atmosphere) then assigning a weight to each gas based on its warming potential. Using this index, only six countries are responsible for 50% of global greenhouse gas loading each year 1141. Table 7 shows how greenhouse emissions are distributed among these countries. Greenhouse indexes are based on current emissions, not cumulative additions during the industrial age. On a cumulative basis, the developed countries are probably responsible for a greater proportion of total greenhouse gas releases.
Appendix C Table 6. Global Warming Potential of Equal Mass Emissions Over Time
co*
Methane Nitrous Oxide CFC-11 CFC-12
1 63 270 4500 7100
1 21 290 3500 7300
1 9 190 1500 4500
Source: [ I 11
Table 7. Top Six Producers of Greenhouse index COUNTRY
PERCENT OF
NET PER CAPITA
GREENHOUSE
ADDITIONS
INCREASES
(KG co2EQUIVALENT)
US Former USSR Brazil China India Japan
17.0 13.1 8.5 7.6 4.6 3.7
3.8 2.5 3.3 0.4 0.3 1.6
Source: [ I41
As a result of increasing greenhouse gas accumulation. there is a high probability of the planet warming from 1.5 to 2.5 degrees Celsius within the next 60 to 100 years [IS]. Temperatures might increase by as much as 4 degrees Celsius. By comparison, average global temperature during the last ice age was only 4-5" C lower than today. Temperature increases in the range of 1.5-4" C may change weather patterns, substantially reducing agricultural productivity in key areas. The maximum abundance of some vegetation could shift as much as 300 to 600 miles in the next 2- 500 years. This move would equal that made over 1-3,000 years during the most recent period of rapid glaciation [16]. Weather shifts could occur suddenly, rather than in a smooth progression. This would make adjustment much more difficult. Even with temperature shifts in the lower range of estimates, sea levels will rise,
Overview of Environmental Impacts
inundating heavily populated coastal areas. In the next 100 years, temperature and sea levels are expected to rise five times more rapidly than during the previous 100 years [15]. To stabilize atmospheric concentrations of greenhouse gases at current levels, anthropogenic emissions will have to be greatly reduced. Table 8 shows how emissions of each gas are presently rising and how they will have to be cut to avoid future increased concentrations.
Ozone Desttuction In addition to acting as a greenhouse gas, halocarbons destroy the stratospheric ozone that protects all life on the planet from ultraviolet radiation. A reduction in stratospheric ozone concentration will increase cases of skin cancer, eye cataracts, and impaired immune systems, while also causing agricultural disruption. An ozone hole (actually a 50% reduction in ozone concentration) approximately the size of the United States now appears over the South Pole every winter. Although some features of the Antarctic ozone hole are not fully understood, CFCs are apparently the major cause. Human-caused ozone depletion is not confined to remote areas. Chlorine-induced ozone deslruction can be accurately estimated by measuring stratospheric concentrations of chlorine monoxide. This compound is both a catalyst and product of ozone destruction. Chlorine monoxide concentrations of 1.5 ppb, or 75 times higher than normal, were discovered above Bangor, Maine and eastern Canada on 20 January 1992 [17]. This is the highest level ever recorded, exceeding even those found during formation of the ozone hole in Antarctica. Concentrations of 1.2 ppb were also measured over Europe and Asia [17].
Table 8. Current Rate of increased Greenhouse Gas Emissions and Reductions Required to Stabilize at Current Concentrations
Carbon Dioxide Methane
Nitrous Oxide CFC 1 1 & 12
0.50% 0.90% 0.25% 4.00%
60-80% 15-20%
70-80% 70-859'0
Appendix C Scientists believe that a 20-30% reduction in stratospheric ozone concenmtions will almost certainly develop over some populated regions of the northern hemisphere in the next 10 years [17]. These northem "holes" are expected to be less severe than in Antarctica as a result of different weather patterns. The consequences of increased ultraviolet radiation reaching the earth may be far reaching. However, little can be done to improve the situation in the near term, because ozone-destroying compounds are so persistent in the stratosphere. Table 9 shows selected characteristics of various halocarbons. In 1987, developexl countries signing the Montreal Protocol on Substances That Deplete the Ozone Layer agreed to reduce their production and consumption of CFC-11, -12, -113, -114, and -115 to 50% of 1986 levels by 1998. The effectiveness of the Montreal Protocol is somewhat limited because India and China have not agreed to its terms.
Overview of Environmental Impacts Table 9. Global Warming Potential (GWP) and Ozone Depleting Potentlal (ODP) of Varlous Halocarbons GAS
GWP: EQUALMASS ODP RELATIVETO C02 RELATIVE TO 100 YEAR HORIZON CFC-11
CFC-11 CFG12 CFC-113 CFC-114 CFC-115 Carbon Tetrachloride HCFC-22 HCFGl23 HCFC-124 HCFG 125 HCFC-134a HCFC-141b HCFC-142b HCFG 143a HCFC-152a Halon-1301' H-1211 H-1202 H-2402 H-1201 H-2401 H-2311 'Due to complex mixing in the troposphere, GWPs for short-lived gases are difficult to calculate. The radiative cooling caused by ozone loss in the lower stratosphere may offset the warming effect of ozone-depleting gases. Thus calculations of GWPs for ozone depleting halocarbons may be much less than reported. At present, these GWP estimates are controversial. 2Estimatesof ODP for halons are more uncertain than for chlorine compounds. Source: [ I 1, 181
Appendix C
References 1. Science Advisory Board 1990. Reducing Risk: Setting Priorities and Strategies for Environmental Protection, US Environmental Protection Agency, Washington. DC EPA SAB- EC 90-021. 2. U. S. EPA. 1990. Characterization of Solid W a ~ine the United States: 1990 Update. US Environmental Protection Agency. Office of Solid Waste, Washington, DC EPA 530-SW-90-042A. 3. Franklin Associates. 1988. Characterizationof Municipal Solid Waste in the UnitedStates 1960-2000:1988 Update, US E.P.A. Office of Solid Waste and Emergency Response. Washington, DC WH-565E. 4. US Congress. Office of Technology Assessment. 1992. Managing Indusirial Solid Wasie From Mmfaturing, Mining, Oil and Gas Production, and Utility Coal C d u s i i o n - Background Paper, US Government Printing Office. Washington, DC OTA-BP-0-82. 5. US EPA. 1991. Toxics in the C o m i t y : National a n d k a l Perspectives, US Environmental Protection Agency, Office of Toxic Substances. Washington, DC EPA 56014-91-014. 6. Wilson, Edward 0. 1989. Threats to Biodiversity. ScienfificAmerican 261 (3): 108-1 16. 7. Fulkerson, Wiam. Roddie R. Judkins. and Manoj K. Sanghvi. 1990. Energy From Fossil Fuels. Scientific American 263 (3): 129-135. 8. Bleviss, Deborah L., and Peter Walzer. 1990. Energy For Motor Vehicles. ScienfificAmerican 263 (3): 103-109. 9. Ross. Marc H.. and Daniel Steinmeyer. 1990. Energy For Industry. Scienfific American 263 (3): 89-98. 10. Holdren. John P. 1990. Energy in Transition. ScienfificAmerican 263 (3): 157-163. 11. Houghton, J.T., G.J. Jenkins, and JJ. Ephraums, editors. 1990. CIimde Change. The IPPC Scienrific Assessment. Cambridge: Cambridge University Press. 12. Ramanahan, V. 1988. The Greenhouse Theory of Climate Change: A Test by an Inadvertent Global Experiment. Science 240: 293-299. 13. Lashof, Daniel A., and Dilip R. Ahuja 1990. Relative Confributions of Greenhouse Gas Emissions to Global Warming. Nature 344: 529-521. 14. Hanunond, AUen L., Eric Rodenburg, and William Moomaw. 1990. Accountability in the Greenhouse. Nature 347:705-706. 15. Wigley, T.M.L.. and S.C.B. Raper. 1992. Implications for Climate and Sea Level of Revised IPCC Emissions Scenarios. Nature 357(6376):293-300. 16. Overpeck, Jonathan T., Patrick J. Bartlein, and Thompson Webb III. 199 1. Potential Magnitude of Future Vegetation Change in Eastern N. America. Science 254: 692-694. 17. Leary. Warren E. 4 February 1992. Record Rise in Ozone-Destroying Chemicals Found in North. The New York Times, National Edition, B. 7. 18. Asessment Chairs for the Parties to the Montreal Protocol. 1991. Synthesis of the Reports of the Ozone Scientific. Environmental Effects, and Technology and Economic Assessment Prmels, UNEP, New York.
APPENDIX D: DECISION MAKING Decision making is a fundamental design activity. Exploring needs, setting requirements, and evaluating designs all depend on translating complex information into successful decisions. Decisionmaking models have been applied to subjects as diverse as political policy and choosing the best home. Discussion in this appendix will focus only on design.
Key Elements Many decision-making models have the following elements in common:
-
Precisely defined objectives that draw boundaries around the problem Systematic procedures that exclude casual or broad assumptions Rank and weigh objectives according to priority Complex problems broken into clear parts based on known functions Evaluation based on analysis of similar elements
To avoid confusion at a later stage, overall project goals have to be negotiated and agreed on by the development team at the beginning of a project. Precise definition is vital when important decisions must be made quickly, because it helps focus efforts on critical areas and greatly increases efficiency. Assumptions often drive decisions. Systematic procedures can help identify and eliminate casual assumptions that lead to poor decisions. A systematic method greatly aids development teams as they develop and assign priority to requirements. Breaking complex design problems into discrete units based on similar function is a key activity in successful decision making. The best decisions result from focusing on vital elements and analyzing their relationships in as logical a fashion as possible. Because all necessary facts will often not be known, judgements and interpretations based on incomplete information will be a central part of many decisions. This mixture of known and uncertain data is a common element in all complex problems. Decision-making systems
Appendix D must therefore be able to compare both facts and mere estimates arising from many different types of research. Development teams can rely on purely intuitive methods, but a practical system for organizing the diverse elements in a multi-objective design problem may be a better choice. All formal decision-making systems were developed to improve results, but each development team should choose a method that seems compatible with its own dynamics. As in other aspects of life cycle design, meeting customer needs while reducing environmental impacts remains the overall goal; methods of achieving this end can vary across a broad spectrum. Decision making is a large and varied field. A full exploration of it is beyond the scope of this manual. However, given the importance of many decisions to project success, a review of two popular models for decision making may be beneficial. References at the end of this appendix can be used for further guidance. Readers should know that many other models exist beyond these few examples.
Rational Analysis with Uncertain Data Kepner and Tregoe [l] offer one popular, systematic approach. After an overall project objective is established, requirements are proposed to meet that objective. Requirements are weighed and assigned priorities based on how important they are to project goals. These priorities are negotiated with the best available data. Either quantitative or qualitative information can be used.
Assigning Priority to Requirements As a first step in assigning priority, must requirements are distinguished from other requirements. The remaining requirements are then weighed and assigned priority. These priorities reflect direct judgements of team members. Priorities can be assigned verbally, or they may be in numerical form. Although preferences vary, the process of translating verbal judgements into numbers can lead to more thorough and accurate representations of team judgements. A variety of scales may be chosen for numerical values. Ranges from 1 to 10 or 0 to 1 may be convenient for many development teams. As an example, on a scale from 0 to 1, the following verbal and numerical representations could be used to depict group judgements:
Decision Making Numerical Weight
Verbal Priority
Must Requirements yeslno Absolute need Want and Ancillary Requirements 1 Highly important
.8
Very important Important Desirable
.2
Slightly desirable
0
Unimportant
In this system, requirements might be grouped with numerical boundaries to ease analysis. For example, want requirements might extend from -6 or -7 to 1, while ancillary requirements are assigned a priority less than .6. The value of decisions made with any system depends on how accurately these descriptions reflect reality. Therefore, a great deal of effort must be made to characterize priorities and estimations precisely.
Evaluating Deslgns After requirements are assigned priorities, competing designs can be evaluated in several stages. First, alternatives have to meet all must requirements, or they are rejected. It is likely that more than one alternative will satisfy all must requirements, so the next step involves selecting the best choice. Some must requirements will be simple yesfno screens not included in further assessment. For example, if a product must be non-toxic in use and produce no toxic or hazardous waste after consumer disposal, alternatives either fail or pass this requirement. No design can be almost non-toxic or produce less than zero hazardous waste. However, improving on set limits for other must requirements will be desirable, so these requirements can be included in further evaluation. Alternatives are then judged on how well they meet the remaining weighted requirements. The same systematic procedures used to weight requirements are used to rank designs. In a numerical system, the rating (rank) a design receives for each requirement is multiplied by the prior-
Appendix D
I want Criteria:
I
I
Env 1
Env 3
Wt. (0-1)
1
.7
.4
I 1
Design Alternatives Lead-acid
Sodiurn-sulfur
Ranking (0-1) .9
1
-63
1
-12
.3
Total:
Ranking Score (wt*rank) (0-1)
Score (wt'rank)
1
1.47
.4
1
.32
.8
1
.28
1
-96
Figure E-1. Two Designs Evaluated Against Limited Criteria With Rational Management Method
ity (weight) given to that requirement. These scores are added to arrive at an overall score. Figure E-1 presents a very simple example of two hypothetical battery designs for an electric automobile. Both batteries are evaluated against three environmental want criteria (Env 1.2, and 3). For the purposes of illustration, the sodium-sulfur design satisfies both high-priority environmental requirements significantly better than the lead-acid alternative. Although the lead-acid design is a superior choice with regard to the lowest-priority requirement, the overall weighted score obviously favors the design that performed best in the more important criteria. Because it is unlikely that a single design alternative will be the clear choice for all high-priority requirements, evaluation in actual design projects will be much more complex. Development teams need to evaluate designs based on requirements from all classes. The simplest way to accomplish this task is by forming a single multi-discipline group that proposes and evaluates all requirements. For complex products, this type of group is likely to be unwieldy. As an alternative, expert groups for each broad class of requirements may be formed. If this option is selected, requirements are first proposed and prioritized within a class by an expert group, then pre-
Decision Making sented to the entire development team for consideration. A thorough review of proposed requirements and priorities before approval ensures that possible conflicts are identified and resolved. Finally, the same groups evaluate designs and present their recommendations to the full team for a final judgement. Some design teams may wish to add uncertainty factors to judgements based on incomplete information. As an example, if two alternatives appear equally preferable with regard to a requirement, but one seems more likely to satisfy this function in actual situations, a higher evaluation could be given to the more certain choice. Caution must be exercised when interpreting numerical judgements based on verbal translations of incomplete data. In addition, summing various factors inserts another potential for inaccuracy into the process, because evaluations based on hard data must necessarily be combined with others that are much less well-defined. Even when such problems are recognized and reduced, the development team must decide on a level of significance for interpreting results that corresponds with actual results. It may be tempting to analyze numerical scores to many decimal places, but if this does not reflect either the actual data or the verbal translation process, it can lead to inappropriate judgements. The development team should be aware that making fine distinctions between values based on best guesses invites distorted judgement. As the final step in the Kepner Tregoe method, the best alternatives are further analyzed for their potential adverse consequences. Anticipating potential problems and including these assessments in the final evaluation adds another dimension to decision making.
The Analytical Hierarchy Process The Analytical Hierarchy Process attempts to streamline and improve simple, intuitive problem solving. To do so, feelings, judgements, and logic are organized in a structured process capable of handling complex situations [2,3]. Both quantitative and qualitative elements are considered. This more accurately reflects the way people define and attempt to solve problems. As long as such criteria are clearly defined and agreed on, both methods of analysis can contribute to effective decisions. As a first step in properly defining a problem, a hierarchy of decision elements is formed. The top level of the hierarchy is a single element representing the project goal; there can be as many subsequent levels as needed. Elements on the same level must be similar and logi-
Appendix D cally related so they can be directly compared. When elements on a level are not readily comparable, a new level with finer distinctions should be created. Once elements of the problem have been identified, and logical consistency obtained by grouping like elements on the same level, elements are compared with each other to develop priorities and make evaluations. Unlike some other systematic methods, no independent judgements are made. All priorities and evaluations in this system result from comparing one element with another. This pairwise comparison can be extended to as many elements as required for a particular problem. By making all judgements strictly relative, analysis may be more realistic, and decisions can be improved.
Using Matrices for Comparison Comparing similar elements to a criterion from the next higher level establishes their relative priority. Pairwise comparison answers this question: How much more strongly does one element contribute to achieving the stated goal (or satisjfying this requirement) than another? The answer is first expressed verbally then translated into a numerical value based on a scale of 1 through 9. A value of 1 means both elements are of equal imporlance, while a value of 9 means that one element takes absolute preference over another [4].
Intensity of Importance
Meaning
I
Elements equal
3
Weak importance: judgement slightly favors one element
5
Strong importance: one element strongly favored
7
Very strong: dominance of one element demonstrated by fact
9
Absolute imporlance: incontrovertible evidence
From: [23,24]
Decision Making 2,4,6, and 8 are intermediate values. When one element is less favored than another, this judgement is represented by a fraction using the above scale. As an example, when one element is weakly less important than another, it is assigned a value of 113. As in all decisionmaking systems, when fine distinctions must be made between elements, numbers have to be chosen with great care to obtain accurate priorities. A mamx is then constructed to compare elements. The simplest case is a 2x2 matrix (i.e. comparing 2 designs against a single criterion).
I
Criterion
A
B
I
Comparisons are made between the first element of a pair. found in the left hand column (in bold), and the second element. found in the top row. Thus the first pairs compared are: A-A. then A-B. Although there are 4 spaces in this simple 2x2 matrix, only 2 judgements will generally have to be made because each element compared to itself is 1. In such a simple system comparisons between A-B and B-A will usually be a reciprocal such as 3 and 113. The same method is used to assign priority to requirements and then rank designs based on how well they meet those requirements.
Synthesis and Evaluation An evaluation of the two previously discussed hypothetical battery designs begins by weighting requirements. However, this illustration will focus only on ranking designs. The priorities assigned to each requirement here are obtained by the methods that follow. These priorities are consistent with the judgements expressed in Figure E-1. After priorities are established, designs are ranked on how well they satisfy each environmental criterion. To begin. the ability of the two battery designs to satisfy environmental criterion 1 is compared. Again, values used here are consistent with those in Figure E- 1.
Env 1
1
NaS
Pb
1 1/7
7 1
I
NaS Pb
Appendix D
Once appropriate values have been entered into the matrix, the relative importance of each element is calculated. First, values in each column are added.
Env 1
1
NaS Pb Column total:
I
NaS
Pb
1
7
0.143
1
1 .I43
8
Then, each value in a column is divided by the sum of h i t column to obtain the normalized matrix. This step expresses all entries in the column as percentage of the column total.
Normalized Env 1 NaS Pb
I
NaS
Pb
0.875 0.875 0.125 0.125
To obtain meaningful comparisons, normalized values in each row are added, then averaged. Final values are again expressed as percentages, with the preference for all elements adding to 1. In this manner, any number of alternatives can be compared with each other to arrive at an estimation of their preference with regard to a single criterion. Env 1
NaS Pb
NaS
I
Pb
Row Average Total
1 1
0.875 0.875 1.75 0.125 0.125 0.25
0.875 0.125
A final judgement is obtained by adding prioritized scores for each alternative as shown in Figure E-2. Again, evaluation obviously favors the design alternative that best satisfies the highest-priority requirements.
Decision Making
want Criteria:
Wt.
Deslgn Alternatives Sodium-sulfur I Lead-acid Ranking Ranking Score Score (wt' rank) (wt'rank]
Envl
0.283
0.875
0.247
0.125
0.035
Env2
0.643
0.857
0.551
0.143
0.092
Env 3
0.074
0.125
0.009
0.875
0.065
Total:
1
0.808
1
1
0.192
Figure 5-5. Two Designs Evaluated Against Limited Criteria With Analytical Hierarchy Method Even in simple problems with few elements, perfect consistency (that is if A-B is 3, then B-A must be 113) is unlikely. Inconsistency is particularly likely when complex and subtle interconnections exist between various elements. Means have been developed to address this problem. Final results from any matrix can be compared with values expected from random judgements [2,3]. Additional computations can also be performed to reflect the various types of interdependence that arise among the elements being compared. Conclusions from the Analytical Hierarchy Process should always be examined for simple logic and common sense. Even when no obvious problems arise, design teams must select the proper scale of significance for distinguishing between alternatives to avoid error. The AHP has been criticized for various technical reasons [5]. In addition, he 1-9 judgement scale and its numerical lranslkon can seem inappropriate and illogical to many. For this reason, interpreting results can present special problems. Translation from numbers back into language should follow the original scale [5]. That is, if one choice earns a score that is 3 times higher than another, it should be judged as only slightly more favorable. To be clearly preferable, the overall score for a design would have to be fives times that of its alternative.
1
Appendix D
Decision Making Limitations lncommensurables Elements from different classes of requirements sometimes defy easy comparison. For example, it can be very difficult to weigh estimated levels of resource depletion against an aspect of performance. This problem also exists within the class of environmental requirements. How can energy use be compared with human health or ecological degradation? Furthermore, what priority should one assign to different elements of ecological degradation or human health impacts? Rcferences such as Setting Priorities and Strategiesfor Environmental Protection [6] can help in this process, but development teams will still be faced with many difficult choices in weighing items that are measured with different scales. Data Information used to develop environmental requirements and evaluate design alternatives may be much more incomplete or uncertain than data on cost or performance. Developing priorities and evaluating design alternatives can therefore be a proportionally more difficult task for environmental requirements than for other classes of requirements. There may also be no way to even estimate some important information. Such gaps present problems regardless of how skilled a development team is at making appropriate decisions.
Judgement Decision-making systems can assist development teams in organizing and accurately translating their judgements. Yet the ultimate quality of many decisions depends on the skill and experience of the team members. A perfectly efficient method of organizing opinions cannot improve on the quality of those opinions.
Decision Making References 1. Kepner, Charles H., and Benjamin B. Tregoe. 1965. The Rational Manager. New York: McGraw-Hill. 2. Saaty, Thomas L. 1982. Decision Making for LRaders. Belmont, CA: Wadsworth. 3. . 1980. The Analytical Hierarchy Process. New York: McGraw-Hill. 4. . 1977. A Scaling Method for Priorities in Hierarchical Structures.Journal of Mathematical Psychology 15 (3): 234-281. 5. Holder, R. D. 1990. Some Comments on the Analytic Hierarchy Fbcess. Journal of the Operationul Research Society. 41 (11): 1073-1076. 6. Science Advisory Board 1990. Reducing Risk S d n g Priorities and Strategies for Envirownenfd Protection, US Environmental Protection Agency, Washington. DC EPA SAB- EC 90-021.
APPENDIX E. ENVIRONMENTAL LABELING A range of third-party programs offer environmental labeling services to companies. These labels are intended to identify the least damaging products in equivalent groups. Consumers can then use the labels to select environmentally sound products that meet their needs. Labels are awarded on the basis of standards developed by various organizations. In all programs to date, participation by manufacturers is voluntary. Those wishing to display a label must first pay a fee. Labeling rights cover a set amount of time, usually ranging from one to three years. Virtually all programs claim to follow a life cycle approach to ensure reduction of total impacts. But standard setting and product evaluation is actually based on a few "key" factors that may or may not accurately reflect life cycle impacts. Criteria used to judge products have included:
recycled content recyclability or reusability degradability hazardous/toxic material content pollution impacts minimal use of resources/avoidance of nonrenewable or nonsustainable resources The first three categories are particularly popular [I]. Unfortunately, evaluating products on this basis may not result in reduction of life cycle impacts. Criteria used to target product groups for labeling include some or all of the following: Major constituent of the waste stream by volume or weight Produces substantial impacts through toxicity, hazardousness, or difficulty of disposal Easy to evaluate; can be differentiated based on a few, agreedupon criteria Commonly used, high-profile among consumers Offers opportunity for significant environmental impact reduction
The German Blue Angel program. established in 1978, was the pioneer in this field. As in most other programs, evaluation of products is claimed to be based on a life cycle approach which follows the product from raw materials acquisition to disposal. In practice, many products are awarded the label based on a single criterion. Although this greatly simplifies evaluation. it cannot reflect life cycle results. Narrow focus is encouraged by the label design, which states in one very brief phrase why each product has received the Blue Angel. The Canadian Environmental Choice and Japanese Ecomark programs, both begun in 1989, are based on the Blue Angel. Neither uses any recognized life cycle analysis despite claims of a cradle-to-grave approach [l, 21. Other government environmental labeling programs include the Nordic countries' Nordic Environmental Label and the Australian Green Spot. The European Community will also introduce an environmental label after formation of the Single European Market in 1993. All these programs award labels based on just one or several criteria [2,3]. In the United States, private companies, rather than government, are developing environmental labels. Both Green Seal. Inc. and the Green Cross Certification Company are active in this area. Each develops smdards that are supposed to be based on reducing life cycle impacts. These criteria are set on a category by category basis and are meant to reflect current state-of-the-artpractices that are technically and economically feasible [4,5]. As most labeling programs state, identifying key impacts for concentrated evaluation is a vital step in producing an accurate label. Effective use of the life cycle framework for environmental labeling depends on narrowing the scope of analysis. However, identifying key impacts may be difficult because life cycle data is lacking for many products. Labeling programs could generate their own data, but life cycle analyses require significant costs and time, and must address complex issues such as assigning priority to various incommensurable criteria. Results may be too detailed for a small label. Until sufficient data are developed, labeling programs may have to rely on limited criteria and uncertain information. There are several advantages to basing labels on restricted criteria: Standards can be promulgated relatively quickly Evaluation costs are substantially lower Consumer attention is focused on a few easily-understood choices However, labeling initiatives should not promise or imply more than they can deliver. A simple environmental labeling system based on
Appendix E restricted criteria can facilitate consumer use, bul it may also undermine consumer confidence if such evaluations are found to be inadequate. Customer participation and interest remain the key to effective environmental labeling programs. Users of any product should understand that an environmental label is only a snapshot of a complex set of issues.
References 1. Sauer. Beverly J., Robert G. Hunt, and Marjorie A. Franklin. 1990. Back-
ground Document on Clean Products Research and Implementation, US EPA Risk Reduction Engineering Laboratory, Cincinnati, OH EPA/600/2901048.
2. Hirsbak, Stig. Birgitte B. Nielsen. and Thomas Lindhqvivt. 1990.ECO-Prodwts, P r o p w l For an European Community Environmental Label, Danish Technological Institute. Department of EnvironmentalTechnology. Copenhagen, Denmark. 3. 1992. Amended Proposal for a Council Regulation (EEC) Concerning a Community Award Scheme for an Ecolabel. Omial Journal of the European Communities NO C 12 (1 8.1 -92 ): 16-30. 4. Green Seal, 1992. Environmental Standards, Green Seal, Washington, DC. 5. Green Cross Ceniiication Company. 199 1. Green Cross Environmental Seal of Approval: Draft Certfiation Criteria, Green Cross Certification Cornpany, Oakland, CA.
APPENDIX F: GLOSSARY Biodegradable Capable of being broken down by natural. biological processes. The lack of light, oxygen, and water in modem landfills severely inhibits degradation. Compatible Material When combined. compatible materials do not cause unacceptable impacts or risks. For example, materials should not be combined that result in deleterious chemical reactions. Compatible materials do not act as contaminants when recycled in moderate amounts with others. Cross-Disciplinary Team A design team that includes representatives from all the major players in the product life cycle. Concurrent Design Simultaneous design of all components of the product system including processes and distribution networks. Concurrent design requires an integrated team of specialists from various areas. Downcycle To recycle for a less-demanding use. Degraded materials are downcycled. Embodied Energy Energy contained in a material that can be recovered for useful purposes through combustion or other means. Equivalent Use Delivery of an equal amount of product or service. Usually stated in terms of distance, number, volume, weight, or time. For example, the amount of detergent required to wash a certain number of identical loads.
Externalltles Costs borne by society rather than those involved in a transaction. Home Scrap Materials and by-products commonly recycled within an original manufacturing process [I]. Impact Analysis Assesses the environmental impacts and risks associated with various activities. An impact analysis interprets data from a life cycle inventory by identifying the main impacts associated with inputs and outputs. Inventory Analysis Identifies and quantifies all inputs and outputs associated with a product system including materials, energy, and residuals. Life Cycle Accounting A system for assigning specific costs to product systems within a physical life cycle framework. Based on total cost assessment.
Life Cycle Design A systems-oriented approach for designing more ecologically and economically sustainable product systems. It couples the product development cycle used in business with the physical life cycle of a product. Life cycle design integrates environmental requirements into the earliest stages of design so total impacts caused by product systems can be reduced. In life cycle design, environmental, performance, cost, cultural, and legal requirements are balanced. Concepts such as concurrent de-
Appendix F sign, total quality management. cross-disciplinary teams, and multi-attributedecision making are essential elements of life cycle design. Needs Analysis The process of defining societal needs that will be fulfilled by a proposed development project.
Product Life Cycle The life cycle of a product system begins with the acquisition of raw materials and includes bulk material processing, engineered materials production. manufacture and assembly, use, retirement, and disposal of residuals produced in each stage.
Product System Consists of the product, process, distribution network, and management. The product includes all materials in the final product and all forms of those materials in each stage of the life cycle. Processes transform materials and energy. Distribution includes packaging and transportation networks used to conrain, protect, and transport Pollution Any by-product or unwanted residual products and process materials. Wholesalproduced by human activity. Residuals ining and retailing are part of distribution. clude all hazardous and nonhazardous subManagement consist of equipment and adstances generated or released to the air, water, ministrative services related to managing or land. activities. It also includes developing and conveying information. Pollution Prevention Any practice that reduces the amount or environmental and Recycling The reformation, reprocessing, or health impacts of any pollutant released into in-process reuse of a waste material. The the environment prior to recycling. treatment, EPA defines recycling as: "..the series of or disposal. Pollution prevention includes activities, including collection, separation, modifications of equipment and processes; and processing, by which products or other reformulation or redesign of products and materials are recovered from or otherwise processes; substitution of raw materials; and diverted from the solid waste stream for use improvements in housekeeping, maintenance, in the form of raw materials in the manufactraining, or inventory control. It does not ture of new products other than fuel [I]. include activities that are not integral to producing a good or providing a service [2]. Renewable Capable of being replenished Physical Life Cycle The series of physical activities that form the framework for material and energy flows in a product life cycle. The physical life cycle consists of the material and energy flows in a product life cycle. See product life cycle.
Postconsumer Material In recycling. material that has sewed its intended use and been discarded before recovery.
quickly enough to meet present or near-term demand. Time andquantity are the critical elements in measures of renewability. See Sustainable.
Preconsumer Material In recycling, overruns, Requirements The functions, attributes, and rejects, or scrap generated during any stage of constraints used to define and bound the soproduction outside the original manufacturing lution space for design. General categories process [I]. of requirements include environmental, per-
Glossary formance, cost, cultural, and legal. Requirements can be classified as follows: Must requirements Conditions that designs have to meet. Arrived at by ranking all proposed functions and choosing only the most important. Want requirements Desirable traits used to select the best alternative from possible solutions that meet must requirements. Want requirements are also ranked and used to evaluate designs. Ancillary requirements Desired functions judged to be relatively unimportant and thus relegated to a "wish list". Included in the final product only if they do not conflict with other criteria. Residual The remainder. In the life cycle framework, those wastes remaining after all usable materials have been recovered. Retirement The transitional life cycle stage between use and disposal. Resource recovery options are decided in this stage. Products and materials may be reused, remanufactured, or recycled after retirement. Reuse The additional use of a component, part, or product after it has been removed from a clearly defined service cycle. Reuse does not include reformation. However, cleaning, repair, or refurbishing may be done between uses. When applied to producu, reuse is a purely comparative term. Products with no single-use analogs are considered to be in service until retired. Sustainable Able to be maintained through time. Over use of resources may decrease future productivity, thereby lowering sustainable yields. An additional factor defin-
ing natural resources sustainability is the amount and kind of pollution caused by their use. Systems that rely on abundant resources may not be sustainable if this resource use results in major impacts. System Boundaries Define the extent of systems or activities. Boundaries delineate areas for design or analysis. Useful Life Measures how long a system will operate safely and meet perfornancc standards when maintained properly and not subject to stresses beyond stated limits [4]. Total Cost Assessment A comprehensive method of analyzing costs and benefits of a pollution prevention or design project. TCA includes [3]: full cost accounting, a managerial accounting method that assigns both direct and indirect costs to specific products estimates of both short and long- term direct, indirect or hidden, liability, and less tangible costs costs projected over a long horizon, such as 10-15 years
References 1. US EPA. 1991.Guidance For the Use of the Terms "Recycled" md "Recyclable" and the Recycling Emblem in EnvironmentalMarketing Claims. Federal Register 56 (191):49992-50000. 2. United States Code. Public Law 101-508:The Pollution Prevention Act of I W O . (42):1310113109. 3. White., Allen L.Monica Baker, and James Goldstein. 1992.Total Cost Asses~menl,US Environmental Protection Agency, Office of Pollution Prevention and Toxics, Washington, DC. 4. Moss. Marvin A. 1985.Designing for Minimol Maintenance Expenre. New York: Marcel Dekker.


![Product Life cycle. Product life cycle and the Product Life Cycle Curve [PLC]](https://kipdf.com/img/300x300/product-life-cycle-product-life-cycle-and-the-prod_5ac29f511723dd94208541f2.jpg)