European Journal of Academic Essays 2(5): 20-26, 2015 ISSN (online): 2183-1904 ISSN (print): 2183-3818 www.euroessays.org
Kinect Depth Data Calibration Dongdong FEI1, Chen DENG1,*, Qinshun ZHANG2, Zhuliang HUNAG1 1
School of Electronic and Electrical Engineering, Shanghai University of Engineering Science, Shanghai, China
[email protected] 2
Shanghai Huiqin Medical Instruments
___________________________________________________________________________________________________ Abstract: Kinect sensors have drawn much attention since the launch of its first version, which is officially called the Kinect effect by Microsoft. Applications of Kinect are almost all depend on its depth data. However, the accuracy of the depth data will decrease dramatically if the object is far from the sensor. In this work, the accuracy is improved by three main steps. A modified wavelet filter is firstly applied to reduce the nose of the signal that will be processed for the generation of depth data. The result shows that a cleaner depth image can be obtained when the proposed filter is implemented. But the mismatch between the measured depth and the exact depth is still obvious. This problem is overcome by curve fitting with polynomial functions. To assess the performance of the functions, the mean square error (MSE) is employed here. And the 1-order fractional polynomial function is found to be both accurate enough and computationally simple. The last step is to convert the point-to-point distance to point-to-plane depth, which is accomplished by Pythagoras's theorem. The result shows this method is simple but effective. Keywords: Kinect, depth data, wavelet filter, curve fitting, calibration ____________________________________________________________________________________________________
1. Introduction Kinect was first introduced by Microsoft in 2009 with the code name “Project Natal”, and its Xbox version was released the next year. Much attention from developers has been caught ever since its launch. Kinect sensor has found its applications far beyond gaming industry. From robotics to medical care and education, researchers have developed so many interesting ways to perform tedious tasks, which is so called the Kinect Effect [1]. IR Projector
IR Camera
Microphone Array
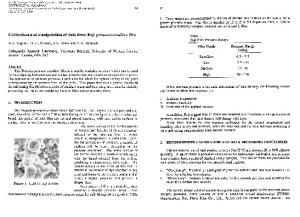
RGB Camera Detected Speckle Dot Pattern Figure 1: Schematic diagram of inferring body position Those applications all depend on both depth data and colour images captured by the Kinect sensor. Basically, Kinect has 3 key optical sensors including an infrared (IR) projector, an RGB camera and an IR camera. To inferring body depth information, it undergoes two stages: analyzing structured light and applying machine learning. On the first
stage, the IR projector emits a known speckle dot pattern that will be detected by the IR camera onto a scene (Figure 1). The detected speckle pattern is then compared with the known speckle pattern to construct a depth map. On stage 2, body parts are distinguished from the depth map by using a decision bank, which is learned from tremendous training examples [2],[3],[4]. Accuracy of Kinect depth data declines sharply as the distance from the object to Kinect increases [5]. But few researches about Kinect depth data calibration is currently available. In this study, its accuracy is improved by three steps, namely, denoising of raw signals from Kinect, mapping the less accurate depth data set to the more accurate data, and convert the point-to-point distance to point-to-plane depth.
2. Method To enhance the accuracy of the depth data, a mathematical model for measuring the depth will be first illustrated. The error source will be then discussed and a filter will be designed subsequently. Even though, the depth data could still contain some errors, which will be eliminated by mapping the raw data to the more accuracy data. 2.1. Mathematical model for depth measurement As is mentioned above, Kinect obtain depth data by comparing the captured speckle dot pattern with the reference pattern received form a reference plane. Figure 2 shows an overlook of the mathematical model that demonstrates how Kinect measures the distance from the object to the sensor [6]. The origin of the 3D coordinate located on the intersection of
Corresponding Author: Chen DENG, School of Electronic and Electrical Engineering, Shanghai University of Engineering Science, Shanghai, 201620, China. E-mail:
[email protected]. Tel: +8613651621128
European Journal of Academic Essays 2(5): 20-26, 2015
the baseline and the center of the IR camera. The x axis that towards the IR projector is parallel with the baseline while the z axis is perpendicular to the image plane in the direction of the object. And y axis is determined by right hand rule. Reference Plane
distance of 1.2 m ~ 3.5 m for players [8]. 2.2. Modified wavelet filter Wavelet theory can be traced back to the early 20th century when Haar created the first wavelet. Some significant advance are made by Zweig in the mid-70s and are later improved by Morlet and Grossmann. Numerous contributions to wavelet theory spring up since the early 80s. And now it has been integrated with filter banks and multiresolution signal analysis to form a single wavelet filter theory. The wavelet filter uses primary functions called wavelets to gain a better performance of distinguishing between interested signal and noise. In this section, the typical wavelet filter is briefly introduced before a modified wavelet filter is exploited.
Object Plane
A C
B
IR Projector
d
D
Wψ(J-1,n) x
z z0
x(n)= Wφ(J,n)
IR Camera
E
z1
l
hψ(-n) Wφ(J-1,n)
y
F G e
Image Plane
hψ(-n)
Wψ(J-2,n) …
hφ(-n) hφ(-n)
f
Wφ(J-2,n)
(a) Wψ(J-1,n) Figure 2: Schematic diagram of the mathematical model
hψ(n) Wψ(J-2,n)
Suppose the IR projector emits a ray that hits the point A on the reference plane and F on the image plane. Then it will shoot the point B on the object plane and reach point G on the image plane. The disparity of F and G is evaluated by e. BC, DE and FG are parallel to each other, which means that C may not on the object plane if the object plane is not parallel with the image plane. It is easy to infer that ΔABC is similar to ΔADE and ΔBCE is similar to ΔGFE. Then, two equations can be established:
d z0 z1 d z1
l z0 e f
…
z0 z 1 0 e lf
1 m n (md n) z01 = d ( z01 ) lf lf lf
+
+
(b) Figure 3: Scheme diagram of the general wavelet filter bank. (a) Undecimated wavelet transform of the input signal x(n); (b) Reconstruction of x(n).
(1)
Suppose hφ(n) is the low-pass filter and hψ(n) the high-pass filter. Then, it will satisfy the reconstruction requirements if Eq.5 works:
(2)
H ( z 1 ) H ( z ) H ( z 1 ) H ( z ) 1
(5)
Where Hφ(z) and Hψ(z) are the z-transform of hφ(n) and hψ(n). A scheme diagram of undecimated wavelet transform (UDWT) and its reconstruction is illustrated in Figure 3. There are J levels in total. At level k, for example, Wφ(j-k,n) is decomposed to Wψ(j-k-1,n) and Wφ(j-k-1,n) by Eq.6 and Eq.7 when UDWT is performed: Wφ(j-k-1,n)=hφ(-n)*Wφ(j-k,n) (6) Wψ(j-k-1,n)=hψ(-n)*Wψ(j-k,n) (7) Wψ(j-k-1,n) contains more detailed information of the signal while Wφ(j-k-1,n) is a rough estimation of the signal and is further decomposed to Wψ(j-k-2,n) and Wφ(j-k-2,n). The obtained composition is then used to reconstruct the original signal by Eq.7 as is demonstrated in Figure 3 (b): Wφ(j-k,n)= hφ(n)*Wφ(j-k-1,n)+hψ(n)*Wψ(j-k-1,n) (8) To have a good performance of denoising, wavelet filters with the capability of altering their coefficients automatically is needed. But bringing this property to orthogonal wavelet filters is too complicated, which results in the theory of bilateral filter in the wavelet domain.
(3)
Due to some limitations from hardware, the exact disparity value e is not used directly. It is normalized between 0 and 211-1, which shrinks the data stream to 11 bit integers [7]. With normalized disparity value, Eq.3 can be replaced by Eq.4:
z11
hφ(n)
xR(n)
+ Wφ(J-1,n) hφ(n)
Wφ(J-2,n)
Where f is the focal length of the IR camera. By combining Eq.1 and Eq.2, the depth value z1 of point B on the object plane can be expressed as Eq.3:
z1
hψ(n)
+
(4)
Where d is the normalized disparity and md + n ≈ e. The operation of normalization yields a quantization error, and the farther the object from the Kinect sensor, the larger the quantization error is. This error can also be amplified if the object is too close to Kinect because of the feature of the inverse proportional function. Microsoft recommend a 21
European Journal of Academic Essays 2(5): 20-26, 2015
Bilateral filter is originally used for edge preserved denoising [9], which takes the advantages of both the domain and range filters. If a pixel’s location x is ascertained, then the response of the filter can be calculated by Eq.9:
I ( x)
1 C
yN ( x )
wS ( x, y) wR ( x, y ) I ( y )
wS ( x, y ) exp(
(9)
wR ( x, y ) exp(
yN ( x )
BL
DA3
LS3
HA2
WT WT
HA1
)
(11)
wS ( x, y )wR ( x, y )
LS2 DD3 HA3
2 r2
WT
(12)
+
LA2
x
| x y |2
and C is a constant that can be expressed by:
C
LA1
(10)
wR is the range component of the bilateral filter given by Eq.11:
Where N(x) is the spatial neighborhood of x, wS is the domain component of the bilateral filter given by Eq.10:
LA3
| x y |2 ) 2 d2
+
+
HS3
LS1 +
DD2
HS2
+R x +
DD1
HS1
Figure 4: Structure diagram of the proposed bilateral filter Figure 4 demonstrates the structure diagram of the filter. Here, x is the input signal, LA stands for low pass analysis filter and HA stands for high pass analysis filter. Signals filtered by HA are sent to wavelet thresholding (WT) treatment while those filtered by LA are either further analyzed or turn to bilateral filter (BL). The denoised approximation coefficients (DA) and the denoised detailed coefficients (DD) are then processed by low pass synthesis filter (LS) and high pass synthesis filter (HS). With all these steps, the denoised signal xR can be reconstructed [10].
level is still noticeable because the error is not only caused by noise, but also by quantization [11]. The pattern of quantization noise largely depends on the original signal and the quantization bits. As Figure 5 shows, quantization noise obviously contains some fragments of the original signal and cannot be regarded as white noise when the quantization bit is at a relatively low level. As the quantization rate increases, the quantization noise gets closer to the white noise accordingly [12]. In Kinect sensor, the raw depth data is quantized to 2^11 levels. Its quantization error is much closer to random white noise than the example in Figure 5 (d).
2.3 Depth data reconstruction Even the raw data from Kinect is well filtered, the deviation
(a )
(b )
(c )
(d ) 22
European Journal of Academic Essays 2(5): 20-26, 2015
Figure 5: Examples of quantization noise under different quantization bits. (a) 1 bit; (b) 2 bits; (c) 4 bits; (d) 8 bits. Suppose q is the quantization step (or sampling interval), exact distance. then the quantization error x will uniformly distribute on [-q/2,q/2]. Thus, its variance σ2 can be expressed as Eq.13: These are two discrepancies between the measured depth 2 and the exact one. The former one is the main factor that q /2 1 q (13) affects the accuracy of depth measurement because the 2 x 2 dx q /2 q 12 deviation it causes is relatively larger. To eliminate this And the standard deviation of z1 in Eq.3 can then be evaluated inaccuracy, we established a relationship between the by: measured depth values and the exact values by polynomial fitting. Measured depth data will be converted to more lfz02 z02lfq (14) accurate values according to the relationship. The other z1 2 2 (lf z0e) 12(lf z0e) discrepancy can be reduced by implementation of It can be inferred from Eq.14 that the standard deviation of Pythagoras's theorem since the exact coordinate value of y z1 will be much larger when e gets smaller enough (or in other axis is easy to be acquired: words, the object leaves farther from the Kinect sensor). As (15) d z2 y2 Figure 6 shows, z1 remains almost constant when e varies on the interval [1, 5] while it drops sharply when e fluctuates from -1 to 0. That means the standard deviation of z1 will be 3. Results and discussion quite sensitive to the variation of e. To investigate the filtering outcome of our proposed Another factor that influent the reliability of the depth algorithm, a comparison of the raw data and the filtered data measurement is the physical quantity that Kinect gauges. should be made. The “raw data” mentioned here refers to the What Kinect meters is the distance between the points on the signal of speckle pattern that is about to be analyzed. For the object and the baseline of Kinect (Figure 2). However, the reason that the discrepancy of the original and filtered speckle depth from the points on the object to Kinect in a strict sense is pattern signal is intuitional, Figure 8 shows the comparison of the distance between the points and a vertical plane that depth images that derive from the raw and filtered signal. embodies the baseline. The premier method of depth Figure 8 (a) is the depth image comes from the “raw data”. It measurement works well and its deviation can be ignored in is obvious that the green square at the center is contaminated the case where the object is either short or far away from the by noise. Fig8 (b) is the depth image originates from the sensor. In Figure 7, all the points on Plane 1 have the same denoised signal. It’s much “cleaner” than Figure 8 (a). depth value from the Kinect. But from the view of Kinect, points on higher position of Plane 1 are farther. The discrepancy between dn and zn are apparent when Plane 1 is close to Kinect while they are almost identical on Plane 2 that is farther from Kinect.
(a)
Figure 6: Simulation of the relationship between e and z1
Plane 2
zn
Plane 1
yn
(b) Figure 8: Filtering result by proposed method. (a) Kinect depth image with noise; (b) denoised depth image
Kinect
zf
yf
Even though, the measured depth data doesn’t match the actual depth values. As Figure 9 shows, the relationship between the measured depth and actual depth is nonlinear. And the larger the measured depth, the more serious the
dn
df Figure 7: Comparison of the depth Kinect measured and the 23
European Journal of Academic Essays 2(5): 20-26, 2015
mismatch problem. Noticing that the curve’s shape in Figure 9 is similar to exponential function, we first applied the exponential function for nonlinear fit. But it didn’t fit the curve well (Figure 10). Polynomials are then implied instead to approach the relationship. Their performance is evaluated by mean square error (MSE) to find out the best.
better, but it is more complicated. So the 5-order polynomial function is preferred. Fractional polynomials are also tested. Figure 12 shows the results of 1-order polynomial and 2-order polynomial functions. Both of the MSEs are smaller than the 5-order polynomial function, especially the 1-order fractional polynomial. And the 1-order fractional polynomial only needs to do division once and subtraction twice while the 5-order polynomial should do multiplication for 15 times, addition twice and subtraction for 3 times if its expression is not modified. As a result, the 1-order fractional polynomial is chosen for the calibration of depth data.
Figure 9: Measured depth and actual depth in meters From Figure 11, a trend that the MSE turns to be smaller as the order of the polynomial gets higher can be observed. And the higher the order, the slower its corresponding MSE decreases (Table 1). With an order of 5, the polynomial function is able to reach an MSE of 0.0040, which is small enough for the Kinect. The 6-order polynomial is only a little
Figure 10: Nonlinear fit with the exponential function
(b)
(a)
(c)
(d)
(e)
Figure 11: Polynomial functions (a) to (e) with orders from 2 to 6. Parameters of the functions are made certain by least squares. Table 1: Details of the polynomial functions in Figure 11 Order of the polynomials 2 3 4 5 6
Functions that fit the curve 2
y=29.86x -40.29x+14.05 y=105.23x3-221.39x2+154.91x-35.06 y=364.6x4-1044.2x3+1114.3x2-521.9x+90.9 y=1162.2x5-4205.4x4+6051.3x3-4317.9x2+1527.0x-213.4 y=40451.1x6-17927.6x5+32955.0x4-32121.0x3+17494.2x2-5043.4x+601.3
The work above serves for the calibration of point-to-point depth data. Based on it, this depth is converted to point-to-plane depth by Eq.15. During the experiments,
MSE 0.0756 0.0168 0.0056 0.0040 0.0038
distances from several joint points of human body including center of shoulders (CS), spine (SP), center of hip (CH) and right knee (RK) to Kinect are metered. The man is asked to 24
European Journal of Academic Essays 2(5): 20-26, 2015
stand still and remain as straight as possible, which ensures those joint points are approximately in the same plane. Table 2 clearly shows the raw data (point-to-point depth) and the
calibrated data (point-to-plane depth) of the joint points under four
Table 2: Raw and calibrated depth data of the four joint points under the exact distances of 1.6, 2.2, 2.6 and 3.1 in meters. 1.6 2.2 2.6 3.1 Joint Points Raw Calibrated Raw Calibrated Raw Calibrated Raw Calibrated CS 1.71 1.63 2.38 2.25 2.81 2.64 3.37 3.16 SP 1.66 1.61 2.31 2.22 2.74 2.61 3.33 3.13 CH 1.60 1.59 2.24 2.21 2.67 2.58 3.27 3.14 RK 1.58 1.60 2.24 2.21 2.65 2.59 3.22 3.13 Standard 0.0512 0.0148 0.058 0.0164 0.063 0.0229 0.0572 0.0122 Deviation different distances. Standard deviations of calibrated depth data are decreased as expected because the distance between Kinect and the plane should not varies as long as the Kinect and the plane are made certain.
the depth is the way Kinect measures itself, which takes the point-to-point distance as the depth. To convert the raw depth data to point-to-plane depth, Pythagoras's theorem is utilized and its outcome is accessed by standard deviation. The experimental results implies that the method we apply here is simple but effective.
Acknowledgment The authors acknowledge the financial support from Shanghai Huiqin Medical Instruments, the innovation project for postgraduates from Shanghai University of Engineering Science (E1-0903-14-01036), the project of Teaching Research (P201402001) from Shanghai University of Engineering Science, the project of Natural Science Foundation of China (No. 61201244) and the project of Laboratory Construction from the central finance special fund (Shanghai municipal bureau of finance and education commission(2013)No.80)
(a) y=-0.3921/(x-1.1056)-0.0865, MSE=0.0037
References [1] Z. Zhang, “Microsoft Kinect sensor and its effect”, MultiMedia, IEEE, 19(2), pp. 4-10, 2012. [2] C. P. Toledo. “Automatic Performance Analysis in Trampoline from RGB-Depth Data”, Autonomous University of Barcelona, Spain, 2014. [3] M. R. Andersen, T. Jensen, P. Lisouski, A. K. Mortensen, M. K. Hansen, T. Gregersen, P. Ahrendt, “Kinect depth sensor evaluation for computer vision applications”, Aarhus University, Department of Engineering, 2012. [4] J. Shotton, T. Sharp, A. Kipman, A. Fitzgibbon, M. Finocchio, A. Blake, R. Moore, “Real-time human pose recognition in parts from single depth images”, Communications of the ACM, 56(1), pp. 116-124, 2013. [5] J. M. Gottfried, J. Fehr, C. S. Garbe, “Computing range flow from multi-modal Kinect data”, In Advances in Visual Computing, Springer Berlin Heidelberg, pp. 758-767, 2011. [6] B. Choo, M. Landau, M. DeVore, P. A. Beling, “Statistical Analysis-Based Error Models for the Microsoft Kinect™ Depth Sensor”, Sensors, 14(9), pp. 17430-17450, 2014. [7] K. Khoshelham, S. O. Elberink, “Accuracy and resolution of kinect depth data for indoor mapping applications”, Sensors, 12(2), pp. 1437-1454, 2012. [8] L. Chen, H. Lin, S. Li, “Depth image enhancement for Kinect using region growing and bilateral filter”, In, 21st
(b) y=0.1174/(x-1.19)2+0.3976, MSE=0.0039 Figure 12: Fractional polynomials and their expressions
4. Conclusion This paper first introduced the principle of the depth measurement of Kinect briefly and points out the factors that may affect the accuracy of depth measurement. According to some of the factors we can make improvement in, a modified wavelet filter is proposed to filter the signal before it is processed for calculating depth. Although its result shows a cleaner depth image when this filter is implemented, the measured depth data are still inconsistent with the exact ones. The exponential function and polynomial functions are then tested for the curving fitting. Their performance is evaluated by MSE, and the 1-order fractional polynomial is finally chosen for the calibration of the depth data accordingly. Another factor that influences the measurement accuracy of 25
European Journal of Academic Essays 2(5): 20-26, 2015
[9]
[10]
[11]
[12]
International Conference on Pattern Recognition (ICPR), IEEE, pp. 3070-3073, 2012. C. Tomasi, R. Manduchi, “Bilateral filtering for gray and color images”, Sixth International Conference on Computer Vision, IEEE, pp. 839-846, 1998. C. S. Anand, J. S. Sahambi, “Wavelet domain non-linear filtering for MRI denoising”. Magnetic Resonance Imaging, 28(6), pp. 842-861, 2010. K. C. Wei, Y. L. Huang, S. Y. Chien, “Quantization error reduction in depth maps”, 2013 IEEE International Conference on Speech and Signal Processing (ICASSP), pp. 1543-1547, 2013. N. Pandey, B. Hennelly, “Quantization noise and its reduction in lensless Fourier digital holography”, Applied optics, 50(7), B58-B70, 2011.
Author Profile
Dongdong FEI is a postgraduate student in School of Electronic and Electrical Engineering, Shanghai University of Engineering Science. He majors in mechatronic engineering. His main research field is robotics, embedded systems, and medical instruments. E-mail:
[email protected]
Chen DENG received the master degree in Shanghai Jiaotong University in 1988. She is a professor in School of Electronic and Electrical Engineering, Shanghai University of Engineering Science. Her major research field is wireless sensor networks, signal processing, embedded systems, intelligent transportation and medical instruments. E-mail:
[email protected]
26