January 2010
A systematic review of the effectiveness of training & education for the protection of workers
About this report:
Authors: Lynda Robson1, Carol Stephenson2, Paul Schulte2, Ben Amick1, Stella Chan1, Amber Bielecky1, Anna Wang1, Terri Heidotting2, Emma Irvin1, Don Eggerth2, Robert Peters2, Judy Clarke1*, Kimberley Cullen1, Lani Boldt2*, Cathy Rotunda2, Paula Grubb2 Affiliations: 1 Institute for Work & Health 2 National Institute for Occupational Safety and Health, Centers for Disease Control and Prevention * Currently retired We would also like to acknowledge the contributions of the following people who provided expertise, comment or support: Laura Blanciforti, Michael J. Burke, Hee Kyoung Chun, Elaine Cullen, Anita Dubey, Randy Elder from the Guide to Community Preventive Services, Alyson Folenius, Andrea Furlan, Sheilah Hogg-Johnson, Carol Kennedy, Kiera Keown, Quenby Mahood, Cindy Moser, Cameron Mustard, Shanti Raktoe, Dan Shannon, the IWH Measurement Group, and the stakeholders who gave input on the review (Appendix I). If you have questions about this or any other of our reports, please contact us at: Institute for Work & Health 481 University Avenue Suite 800 Toronto, Ontario M5G 2E9 E-mail:
[email protected]
National Institute for Occupational Safety and Health c/o Dr. Paul Schulte, MS-C14 4676 Columbia Parkway Cincinnati, OH 5226 E-mail:
[email protected]
Or you can visit our websites at www.iwh.on.ca or www.cdc.gov/niosh Please cite this report as: Robson L, Stephenson C, Schulte P, Amick B, Chan S, Bielecky A, Wang A, Heidotting T, Irvin E, Eggerth D, Peters R, Clarke J, Cullen K, Boldt L, Rotunda C, Grubb P. A systematic review of the effectiveness of training & education for the protection of workers. Toronto: Institute for Work & Health, 2010; Cincinnati, OH: National Institute for Occupational Safety and Health. This publication can also be tracked as DHHS (NIOSH) Publication No. 2010-127. For reprint permission contact the Institute for Work & Health. © Institute for Work & Health; National Institute for Occupational Safety and Health, 2010
Table of Contents
Foreword ......................................................................................................... v 1.0 Introduction............................................................................................... 1 1.1 Why this review was done .................................................................. 1 1.2 Defining training ................................................................................ 4 1.3 Conceptual model ............................................................................... 5 1.4 Research questions ............................................................................. 7 2.0 Methods..................................................................................................... 9 2.1 Literature search ................................................................................. 9 2.2 Relevance assessment (study selection) ........................................... 10 2.3 Quality assessment (QA) .................................................................. 13 2.4 Data extraction (DE)......................................................................... 15 2.5 Evidence synthesis I: Constructing bodies of evidence ...................17 2.6 Evidence synthesis II: Determining the strength of a body of evidence ............................................................................................ 22 2.7 Overview of the review process ....................................................... 25 3.0 Results ..................................................................................................... 27 3.1 Description of the studies in the review ........................................... 27 3.2 Methodological quality ..................................................................... 38 3.3 Effect of training (versus no training) on OHS outcomes ................42 3.4 Synthesis of the evidence on the effect of training (from training versus no-training studies) ............................................................... 51 3.5 Relative effectiveness of training with different levels of engagement .......................................................................................................... 56 3.6 Evidence synthesis of the relative effectiveness of high versus low/medium engagement training .................................................... 62 4.0 Discussion ............................................................................................... 65 4.1 Principal findings.............................................................................. 65 4.2 Strengths and limitations of the systematic review .......................... 70 4.3 Relation of findings to the research literature.................................. 71 4.4 Meaning of the review for policy-makers and practitioners ............75 4.5 Areas for future research .................................................................. 77 4.6 Conclusions arising from the review ................................................ 82 5.0 Messages for stakeholders ..................................................................... 84 6.0 References .............................................................................................. 85 7.0 References for randomized trials ........................................................... 93 8.0 References for non-randomized trials .................................................... 97
A systematic review of the effectiveness of training & education for the protection of workers
i
Appendices Appendix A: Appendix B: Appendix C: Appendix D: Appendix E: Appendix F: Appendix G: Appendix H: Appendix I:
Search Terms ....................................................................... 101 Relevance Assessment, Stage 1 Questions .......................... 102 Relevance Assessment, Stage 2 Questions .......................... 104 Relevance Assessment, Stage 3 and 4 Questions ................ 105 Quality Assessment Instrument ........................................... 109 Data Extraction Instrument .................................................. 124 Methodological quality: questionnaire item-level findings. 138 Methodological quality of the non-randomized trial studies139 Stakeholders providing feedback on either the research questions or the research findings ........................................ 140
List of Tables Table 1a: Table 1b: Table 1c: Table 2: Table 3: Table 4:
Relevance assessment, stage 1 questions .................................. 11 Relevance assessment, stage 2 questions .................................. 12 Relevance assessment, stage 3 and 4 questions......................... 12 Quality assessment (QA) items ................................................. 14 Summary of data extraction (DE) instrument ........................... 16 Primary variables for grouping study findings in evidence synthesis .................................................................................... 18 Table 5a: Evidence synthesis algorithm .................................................... 23 Table 5b: Definition of sufficient and large SMD criteria used in evidence synthesis algorithm .................................................................... 24 Table 6: Key features of studies included in the review .......................... 28 Table 7a: Studies and interventions by hazard category ........................... 34 Table 7b: Method of training delivery ....................................................... 35 Table 8: Occupations of individuals involved in training interventions.. 37 Table 9: Types of outcomes measured in studies .................................... 38 Table 10: Summary of methodological quality assessments of studies .... 39 Table 11: Distribution of responses (%) to summary questions about Methodological quality .............................................................. 41 Table 12a: Effect of training on Knowledge (relative to a no-training control) ...................................................................................... 43 Table 12b: Effect of training on Attitudes & Beliefs (relative to a no-training control)……………………………………………………………….44 Table 12c: Effect of training on Behaviours (relative to a no-training control) ...................................................................................... 45 Table 12d: Effect of training on Health (relative to a no-training control)……………………………………………………………...47 Table 13: Algorithm applied to training versus control evidence to determine its strength ................................................................ 52 Table 14a: Evidence synthesis of the effect on Knowledge (training vs control) ...................................................................................... 53
ii
Institute for Work & Health
Table 14b: Evidence synthesis of the effect on Attitudes & Beliefs (training vs control)........................................................ 53 Table 14c: Evidence synthesis of the effect on Behaviours (training vs control) ....................................................................................... 54 Table 14d: Evidence synthesis of the effect on Health (training vs control) ………………………………………………………………….56 Table 15: Relative effectiveness of differing levels of engagement on outcomes..................................................................................... 58 Table 16: Algorithm applied to higher versus lower engagement training evidence to determine its strength .............................................. 62 Table 17: Evidence synthesis of engagement level effects on Behaviours (training vs control) .................................................................... 63 Table 18: Summary of evidence syntheses for training versus control studies .........................................................................................65 Table 19: Summary of evidence syntheses for higher versus lower engagement studies .................................................................... 66
List of Figures Figure 1: A conceptual model of workplace training interventions for primary prevention in OHS ............................................................. 7 Figure 2: Search strategy .............................................................................. 10 Figure 3: Overview of the review process ....................................................26 Figure 4: Distribution of studies by methodological limitations scores ....... 42
A systematic review of the effectiveness of training & education for the protection of workers
iii
iv
Institute for Work & Health
Foreword
Occupational health and safety (OHS) training is a fundamental element in workplace hazard control programs. Numerous safety and health standards for hazard control contain requirements for training aimed at reducing risk factors for injury, disease or death. Combined with management responsibility, which is paramount, training is a necessary part of a comprehensive hazard control program. Improving the effectiveness of OHS training efforts and other interventions is important especially as workplaces and workforces change. This report builds on the review published by the National Institute for Occupational Safety and Health (NIOSH) in 1998. Subsequently, in 2004, the Institute for Work & Health (IWH) and NIOSH agreed to collaborate and update the original NIOSH review by conducting a systematic review of the literature published since 1996. A joint team of IWH and NIOSH researchers have produced this systematic review of the occupational safety and health training research literature, to determine what is known about the effectiveness of training. This information should be useful to employers, workers, unions, trade associations, NGOs (nongovernmental organizations), regulators and academics as they consider developing and delivering occupational safety and health training. Dr. Cameron Mustard President Institute for Work & Health Toronto, Ontario, Canada
Dr. John Howard Director National Institute for Occupational Safety and Health Centers for Disease Control and Prevention Washington DC, U.S.A.
A systematic review of the effectiveness of training & education for the protection of workers
v
vi
Institute for Work & Health
1.0
Introduction
Each year corporations and other organizations provide many hours of training for employees, including occupational health and safety (OHS) training. In the United States, the total cost of training is over $100 billion per year (1). Training is widely acknowledged as an important component of occupational hazard control and risk management programs (2). However, the expense and effort required to conduct such training calls for continued research on the factors that make training effective (3; 4; 5; 6; 7). Increasingly, business owners are demanding assurance that training can meet its stated goals of mitigating injury and illness, and that it provides an adequate return on investment (ROI). Thus, it is critical to gain a better understanding of the factors contributing to successful training outcomes in the context of the millions of injuries and illnesses, and thousands of deaths, that are reported annually in workplaces in North America and globally. These events place an extreme burden on workers, their families, employers and society (8; 9). 1.1 Why this review was done Research on the effectiveness of OHS training is needed to: 1) identify major variables that influence the learning process and 2) optimize the allocation of resources for training interventions. In research on training, it is often difficult to arrive at definitive conclusions about effectiveness. Typically, many workplace characteristics contribute to real-world effects of training. Designing studies that validate the unique contribution of individual factors, such as specific training program features, is often infeasible. Traditional narrative literature reviews of training are often speculative about specific factors that enhance the relative effectiveness of OHS training interventions in reducing occupational injuries, illnesses and deaths. Consequently, there is a need for a systematic review of the existing literature with attention to the most rigorously designed and analyzed studies. The review would not only highlight what is known about the effectiveness of training, but also point out gaps in our understanding that may be addressed in future research. There have been two broad approaches to research on training effectiveness. One approach employs triangulation of multiple data sources and methods to gather data from end users of training. This method combines qualitative data (e.g. from key informant interviews, focus groups and observations) with various forms of quantitative data (e.g. from controlled study situations (10)). These data are then used to assemble valid correlational arguments for interpretation of results (11). The other approach to studying the effectiveness of training explores causeand-effect relationships that are pertinent to the learning process or the application of learned material within the workplace. These studies use experimental designs to investigate factors related to the training process A systematic review of the effectiveness of training & education for the protection of workers
1
itself. They use measurable outcomes affecting individuals or work teams and, if feasible, gather data related to the impacts of training on the organization or relevant industry. While the ultimate goal of OHS training is the prevention or reduction of injury, disease and death, these outcomes are often difficult to study, requiring long periods of time and extensive resources. Therefore, OHS training research usually focuses on proxy outcomes such as workers’ behaviour or their statements of intentions. These may be considered intermediate steps toward achieving the long-term goals. Historically, it has been difficult to conduct the type of research that clearly shows the value and effectiveness of OHS training. Partly, this situation may exist because the ultimate effectiveness of training is likely dependent on factors external to the training, such as trainee readiness, management commitment, appropriate resources, nature of the organization’s safety climate, and systematic monitoring and feedback. In short, for training to be effective, it is likely that a worker must be empowered and enabled to perform according to the training content. Another challenge is that other unrelated factors in a workplace, such as a labour dispute or a change in a production process, may have an impact on the same outcomes as training. Despite the influence of these factors, it is useful to try to identify the particular aspects of training that influence its effectiveness for the reasons cited at the start of this section. In 1998, the U.S. National Institute for Occupational Safety and Health (NIOSH) published a literature review of studies in which training was used as an intervention to reduce the risk of work-related injury and disease (4). The review focused on a variety of reports in the peer-reviewed and non-peer-reviewed literature between 19801996. Eighty studies met the criteria for inclusion in that review. The NIOSH review by Cohen and Colligan (4) concluded that the literature offered much direct and indirect evidence to show the benefits of training in ensuring safe and healthy work conditions. Study findings were near unanimous in confirming that training could attain immediate and short-term objectives. These included increased hazard awareness among workers at risk, improvements in knowledge and work practices, and the acquisition of skills that should lead to risk reductions and workplace safety improvements. There was also evidence suggesting that management support was critical to effective safety training, especially in transferring new knowledge and behaviours to the job site. Optimum results came from policies and work climates in which workers had opportunities to apply the knowledge from training, or that reinforced learned behaviour through incentives or other means. However, the review found that some methodologies used in these studies were more effective than others. Some studies used quasi-experimental designs that included manipulations of variables and suitable controls for potentially confounding factors. Other evaluation methodologies were not 2
Institute for Work & Health
well controlled: the results were typically derived from a post-hoc analysis of post-training surveys in which training results could have been contaminated by the effects of other workplace activities. Many evaluations were based on short-term results so that the sustainability of any training effect remained uncertain. Also, the ultimate outcomes of interest — injuries and illnesses — were not often studied. The degree of correlation between these outcomes and typical measures of training effects, such as knowledge gain and behaviour change, is unclear at best (12). These limitations in methodology suggested the need for more rigorous investigations of training effectiveness to confirm the importance of different training variables. Since the Cohen and Colligan report, there continues to be broad stakeholder interest in continued research on the effectiveness of training interventions. A relatively large number of studies of training effectiveness have been published in the peer-reviewed scientific literature since 1996. The number of these studies supported the belief that a systematic review could be accomplished. In 2004, the Institute for Work & Health (IWH) conducted a preliminary survey of the number and quality of published reviews on the research evidence on the effectiveness of training interventions for the protection of workers. As only a limited number of useful reviews was identified, it was determined that the NIOSH 1998 review could serve as the basis for an updated review. In 2005, IWH and NIOSH agreed to collaborate and update the original NIOSH review by conducting the current systematic review of the literature from 1996-2005. Subsequently, in 2006, a useful meta-analytic review by Burke et al. was published (7). This review found that knowledge acquisition and reductions in accidents, injuries and illness in workers depended on the level of engagement by workers in the training (higher engagement required employees’ more active participation). They concluded that training involving behavioural modeling, a substantial amount of practice, and dialogue was generally more effective than other methods. Burke et al. noted that these findings had implications for more passive OHS training approaches such as video and some computer-based and distance learning methods (7). In another review, Burke et al (6) observed that potentially relevant learning theories and prior research findings were not necessarily incorporated into the design and content of worker safety and health training. Burke et al. (7) proposed that principles in learning theory could lead to new training approaches as well as novel research methodologies that would better address safety and health research questions. Improved training approaches require the trainee’s involvement in the learning process and in its transfer to the job. Burke suggested these will both occur primarily through practice, dialogue with peers and instructor, action-focused self-reflection, and selfregulation during the development of procedures, knowledge and skills (6).
A systematic review of the effectiveness of training & education for the protection of workers
3
1.2 Defining training Training refers to planned efforts to facilitate the learning of specific competencies (13). These competencies typically consist of specialized knowledge, skills and behaviours needed for success in a particular environment. In practice, training uses diverse methods of instruction or practice. OHS training often consists of instruction in hazard recognition and control, safe work practices, proper use of personal protective equipment, and emergency procedures and preventive actions. Training can also guide workers on how to find additional information about potential hazards. It can empower workers and managers to become more active in implementing hazard control programs or effecting organizational changes that enhance worksite protection (4, p. 11). Training interventions sometimes include additional components besides instruction or practice, such as goal-setting, to enhance effectiveness. The distinction between training and education is not always clear, nor universally agreed upon. For some, only programs clearly involving a handson, practical component can be considered training. For others, the scope is broader, including programs without such a component. For the purposes of this review, the broader understanding of training has been adopted. Our definition of OHS training is “planned efforts to facilitate the learning of specific OHS competencies.” Training methods can range from a one-time dissemination of information to intensive programs administered over a long period of time. Researchers and practitioners have characterized training methods in a variety of ways, including active or passive training, learning-centred or teaching-centred training, the degree of transactional distance between teachers and learners, and the degree of engagement with training ( 7; 13; 14; 15; 16; 17). For this review’s analysis of the training literature, we have classified engagement into three levels as Burke et al. did in their metaanalysis (7). 1.2.1 Low, medium and high degree of engagement in training Low engagement is defined as training that uses oral, written or multi-media presentations of information by an expert source, but requires little or no active participation by the learner other than attentiveness. It may include some interaction between instructor and trainees, or post-tests of learned material without feedback of test results to trainees. Examples include lectures with or without brief question-and-answer periods, videos, pamphlets, manuals that do not contain interactive exercises, and computerbased instruction that is essentially an electronic slide show, lecture or textbook. With these low engagement training methods, the trainee does not have an active cognitive or behavioural role in the learning process. In many cases, trainees are simply required to attend the training session and sign a log indicating they were present. In low engagement training, trainees 4
Institute for Work & Health
notably do not receive hands-on practice, nor do they engage in group or individual problem-solving activities. Medium engagement is defined as training with a stronger degree of interactivity. Examples include lectures with a strong emphasis on discussion and feedback. In electronic training programs, the worker would receive feedback from quizzes, for example. In print-based training, trainees would study material, answer tests and check the accuracy of their responses in workbooks. At this level, the knowledge is not applied to real or simulated work situations to any substantial extent. With high engagement training methods, the trainee has a much more active role in the learning process. The trainee engages in significant cognitive and behavioural interaction with the material, and has many opportunities to ask questions to experts/instructors. High engagement training typically occurs in face-to-face settings, but can include virtual environments. It frequently uses behavioural modeling techniques. This could include self-assessments, goal-setting and opportunities to discover new cognitive strategies related to problem-solving and decision-making. Participants are often involved in hands-on practice of the behaviours taught. Examples can range from tabletop exercises in a board game format in a classroom, to mine rescue training of emergency personnel within a simulated mine. Computer-based training can be highly engaging if it also involves relevant simulations, stimulates cognitive processing of the material, and provides opportunities for decisionmaking and feedback on performance. 1.3 Conceptual model This section describes the way in which the studies in this review were conceptualized. It also summarizes the generally accepted view of the causeand-effect relationships involved in the learning process (11; 18; 19). For the purpose of this review, the cause-and-effect relationships of primary interest are between the training-related factors, outcomes in workers (both immediate and intermediate) and impacts on injury and fatalities (Figure 1). The cause-and-effect pathway is also affected by various modifying and confounding factors. These elements of the model will be explained more fully below. Training Factors: These are the independent variables related to training that can be manipulated. They are presumed to cause or influence certain training outcomes that ultimately should lead to an impact. Depending on the study, independent variables could include: degree of engagement in the training methods; timing of the training and its various components; format and content of the training materials; characteristics of the learning environment such as locations or seating arrangements; intensity of the training; and differences in the training rationale content or educational approach under study (11; 20). A systematic review of the effectiveness of training & education for the protection of workers
5
Immediate Outcomes: The immediate training outcomes are the proximal reactions measured in trainees, including changes in knowledge, beliefs, attitudes, skills, motivation and behavioural intentions. These are expected to be influenced by exposure to the training factors (i.e. the independent variables). Intermediate Outcomes: These are dependent variables that represent the transfer of knowledge and behavioural intent into practice. Measurable examples include: a trained employee adopting new work practices; a manager who makes changes in standard operating procedures that are instituted, enforced and codified in the company policy manual; a purchasing agent who buys new, safer equipment. These outcomes are intermediate between the training factors and the impacts. Often, intermediate outcomes are used as surrogates for the ultimate impacts of training because of time and resource limitations in conducting research. Impacts: The ultimate impacts of training are the prevention or reduction of diseases, injuries or deaths, and the related direct and indirect costs. These impacts can be influenced by training, but can also be caused by factors independent of training. For example, a workplace explosion may occur due to a faulty valve or structural weakness unrelated to training. However, the causal pathways can sometimes intersect; for example, if a worker has been trained to inspect valves or structures, then such explosions may be prevented. The time frame for measuring the health and economic impacts of training can vary from short term to long term. Confounding and Modifying Factors: Confounding factors are associated with the outcome but do not mediate the relationship between training and outcomes. Modifying factors change the relationship between training and outcomes. These can occur at the individual or workplace level. Individual Factors – These are demographic factors, cognitive abilities, learning styles, pre-training attitudes, expectations, motivations, health status and previous training. Workplace Factors – These are workplace conditions that can have an impact on the delivery or effect of training, including its application in practice. For example, a workplace with low management commitment to training could diminish the effect of training. Some workplace factors have an influence before training and others have an influence afterward. The latter are particularly critical in influencing whether training has an ultimate impact. Both individual and workplace factors can affect various points in the causeand-effect continuum. Moreover, they can be confounding factors in research that is designed to assess the effectiveness of training, or the contribution of specific training elements. Hence, it is important to 6
Institute for Work & Health
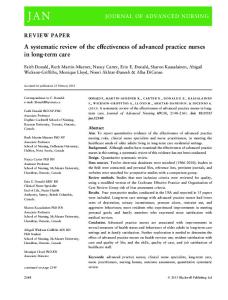
determine the extent to which such confounding factors are addressed in research studies and to weigh the evidence on that basis. Figure 1: A conceptual model of workplace training interventions for primary prevention in OHS
IMMEDIATE OUTCOMES Reaction to Training, Knowledge, Beliefs, Skills, Attitude, Motivation to Act, Behavioural Intent, Etc.
TRAINING FACTORS (e.g. learning principles, timing, format, trainer)
INTERMEDIATE OUTCOMES Behaviors, Hazard Controls, Hazards, Exposures, Etc.
IMPACTS Injuries, Illnesses, Fatalities, Disabilities, Costs Etc.
INDIVIDUAL FACTORS (e.g., demographic factors, cognitive abilities, occupation, ethnicity, language abilities, learning style, previous training, health status, pre -training attitudes, expectancies, motivation to learn)
PRE -INTERVENTION WORKPLACE FACTORS (e.g., pre -training needs assessment, empowerment, safety culture)
POST-INTERVENTION WORKPLACE FACTORS (e.g., post -training maintenance interventions, empowerment, safety culture,)
WORKPLACE
EXTERNAL ENVIRONMENT
1.4 Research questions The primary research questions in this systematic review were:1 1. Does OHS training have a beneficial effect on workers and firms? 2. Does higher engagement OHS training have a greater beneficial effect on workers and firms than lower engagement OHS training? One secondary question was also considered: 3. What is the methodological quality of the research literature concerned with the effectiveness of OHS training? 1
The primary research questions were initially framed as the following: 1) What quantitative effect does OHS training/education have on workers and workplaces? 2) What is the magnitude of effect of various factors upon the effectiveness of the OHS training/education intervention (i.e. factors related to the individual, the training/education intervention, the workplace and the external environment)? After retrieving the eligible studies and learning of their limited quantity and their heterogeneity, it was thought that a qualitative approach to the literature would be more appropriate, which necessitated a reframing of the research questions. In addition, the publication of Burke et al. (7) followed the initial framing of the research questions, and led the review to focus on the engagement concept. A systematic review of the effectiveness of training & education for the protection of workers
7
8
Institute for Work & Health
2.0
Methods
These are the methodological steps of the review:
conduct literature search indentify relevant studies conduct a methodological quality assessment and ranking of studies extract data (evidence) from publications synthesize evidence
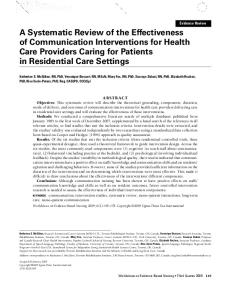
These steps are explained in this section. 2.1 Literature search The review team searched the following 10 electronic databases for studies published between 1996-2007: MEDLINE, EMBASE, PsycINFO, Eric, CCOHS, Dissertation Abstracts, Agricola, Social Science Abstracts, Health and Safety Science Abstracts and Toxline. The search terms fell into four broad categories: work-related terms, education/training intervention terms, OHS outcomes and factors affecting effectiveness, and between-group evaluation designs (see Appendix A). The search strategy combined the four categories using the AND Boolean operator, while the terms within each category were combined with the OR Boolean operator (see Figure 2). The search terms were customized for each electronic database. Overall the search categories were chosen to be inclusive. However, the following terms were used to exclude articles: health promotion, diet, exercise, smoking, weight loss and addiction. The review was limited to articles published in either English or French. Content experts were identified and asked to submit their own or suggest other relevant published articles or articles in press, plus any relevant bibliographies or reference lists. Reference lists of articles deemed relevant to the review in the next step, relevance assessment, were examined as well.
A systematic review of the effectiveness of training & education for the protection of workers
9
Figure 2: Search strategy
Work-related
Education/training intervention
“HITS”
OHS outcomes and factors affecting effectiveness
Between-group evaluation design
2.2 Relevance assessment (study selection) The broad search strategy captured many studies that were not relevant to the review’s research questions. Study relevance was determined using a four-stage process. Studies had to meet criteria in each stage before advancing to the next stage. In stage one, a single reviewer used only the title and abstract (when available) to answer the questions shown in Table 1a. In stage two, the reviewer used the questions in Table 1b. In the third stage, two independent reviewers answered the questions shown in Table 1c, again using only the title and abstract. In the fourth stage, two independent reviewers answered the questions from Table 1c again, using the full paper to make their assessments. At each stage, reviewers were given detailed guidance for answering each question (see Appendices 2a through 2c). When two reviewers disagreed, disputes were resolved using consensus. If consensus could not be reached, a third reviewer was consulted. Reviewers entered answers to all questions assessing relevance into a web-based Systematic Review Software (SRS) database (TrialStat! Corporation, 2008). An SRS database allows centralized reference tracking and access. At each stage, the operational definition of “training” included studies of less intensive forms of training, such as educational pamphlets, as long as the intervention involved a means to ensure that information was accessed (i.e. that the pamphlet was received and looked at by the intended target).
10
Institute for Work & Health
However, the majority of studies that were ultimately included in the review involved some sort of practice in workers’ applying new knowledge to develop skills. Table 1a: Relevance assessment, stage 1 questions
#
Question
1
Does the study meet one of the conditions below? Study of an education or training intervention aimed at reducing worker risks of workplace injury or disease Survey or report offering data on training (or lack thereof) as well as other factors contributing to work-related injuries, fatalities and health problems Report on OHS* program practices for employers with exemplary safety/health performance to isolate training factors that may have contributed to their success Study in education/learning field, or ancillary area, that deals with issues especially pertinent to effective OHS training Is the education or training examined in the study targeted at one of the following OHS Other workplace factors with changes recorded in OHS outcomes Is the study published in English or French? Is the study focused on a worker population? Is the date of publication between 1996 and 2007?
2
3 4 5
Exclusionary response No
No
No No No
*OHS = occupational health and safety
A systematic review of the effectiveness of training & education for the protection of workers
11
Table 1b: Relevance assessment, stage 2 questions
#
Question
1 2
Is the study examining a worker population? Is the study concerned with any of the following? An intervention study (with pre- and post- measures) assessing the effectiveness of an OHS* education/training program Factors that may facilitate or inhibit the effectiveness of OHS education/training programs A novel approach to provide OHS education/training programs Specialized techniques/methods (e.g. computer-based training) that have been used to provide OHS education/training programs Factors that affect compliance with OHS education/training programs Does the study present information that is best described as ‘conjecture’ or ‘testimonials’ with no supporting evidence? Does the study focus on workers’ current state of knowledge regarding an OHS issue, which simply identifies that there is a further need for education/training on this issue?
3
4
Exclusionary response No No
Yes Yes
*OHS = occupational health and safety Table 1c: Relevance assessment, stage 3 and 4 questions
#
Question
1
Is the study concerned with the effectiveness of a worker- or workplace-centred OHS* training intervention aimed at the primary prevention of workplace injury and/or illness? Is the study a randomized or non-randomized trial? Are there pre- and post- measures available for each study group? Does the study examine a worker, firm or societal outcome related to OHS training? Is the study published in a scientific peerreviewed journal?
2 3 4 5
Exclusionary response No
No No No No
*OHS = occupational health and safety
12
Institute for Work & Health
One additional inclusion criterion was applied after the quality assessment stage of the review: only randomized trials were included. At the outset of the review, both randomized and non-randomized trials had been eligible for inclusion. A comparison of the randomized and non-randomized studies showed that the two sets of studies were similar with respect to sample sizes and quality assessment ratings (see Table 10 and Appendix H). However, due to time constraints, it was necessary to narrow the pool of eligible studies. Only the reports on randomized controlled trials, the design that involves the least potential for bias, were kept for further analysis. 2.3 Quality assessment (QA) The quality assessment (QA) step of the review assessed the methodological quality of the relevant studies. Two reviewers independently answered the questions included in the review’s QA instrument (see Table 2 and Appendix E). Reviewer pairs met to resolve any disagreements through a consensus process. Because the team was interested in the effect of education and training interventions on worker knowledge, attitudes, beliefs, behaviours and health, the QA was completed multiple times for one study. For example, the reviewer pair would do three separate QAs if the intervention was designed to affect knowledge, attitudes and health. Or, if the researchers were examining the performance of two different training programs, a separate QA would be done for each training program. 2.3.1 Quality assessment (QA) instrument A wide variety of quality assessment instruments are available. None were designed for our particular application. We adapted the principles espoused in Hayden et al. (21), but not the details, since that study was concerned with QA instruments for clinical prognosis studies. Following the lead of Hayden et al. (21), we developed an instrument focused on internal validity, which considers the extent to which its design and conduct are likely to prevent systematic errors or bias (22). The review team identified four domains of potential bias or internal validity relevant to our articles by examining several sources in the literature (22; 23; 24; 25; 26; 27; 28):
comparability of study groups intervention implementation outcome assessment statistical tests
Following Hayden et al. (21), the QA instrument assessed quality in three separate stages. First, items were used to assess specific biases (e.g. concealment of how the intervention was allocated; see Table 2). Second, reviewers were asked to provide summary assessments for each of the four A systematic review of the effectiveness of training & education for the protection of workers
13
domains of potential bias. Finally, reviewers rated the study’s overall methodological quality on a five-point scale, after considering all sources of potential bias. We used a well-established QA instrument for randomized trials to select the 16 items for the first stage of assessment (29). This instrument addressed three methodological issues considered especially important in clinical research on the potential for bias: concealment of treatment allocation; blinding of the person assessing outcomes; and handling of withdrawals (30). We supplemented these items with others used elsewhere (27; 31) that were thought to add value to our instrument. All items were adapted to suit the training literature. Items were refined through two rounds of pretesting with multiple assessors. A copy of the instrument and its accompanying guide can be found in Appendix E; it is summarized in Table 2. Table 2: Quality assessment (QA) items*
Comparability of study groups 5. Research design 6. Randomization methods adequacy 7. Intervention allocation concealment 8. Study group similarity at baseline 9. Effect of withdrawals 10. Summary: Comparison group selection and maintenance Intervention implementation 11. Implementation of planned training intervention 12. Contamination avoidance 13. Planned co-intervention avoidance or similarity 14. Unplanned co-intervention avoidance or similarity 15. Summary: Intervention implementation Outcome assessment 16. Outcome assessor blinding 17. Method and timing of outcome assessment 18. Outcome data validity 19. Outcome data reliability 20. Summary: Method of measuring outcomes Statistical tests 21. Statistical tests and procedures 22. Statistical adjustment for groups 23. Intention-to-treat analysis 24. Summary: Analytic method Miscellaneous 25. Additional threats or strengths to internal validity Overall assessment 26. Overall assessment of methodological quality * The details of the form summarized in Table 2 are shown in Appendix E. Items 1 through 4 of the form are not included here because they were not part of the quality assessment content.
14
Institute for Work & Health
2.3.2 Consistency of reviewer ratings We attempted to maximize the consistency of reviewers’ ratings in four ways: by providing a guide to use with the QA instrument, by having practice sessions, by discussing difficulties in decision-making as they arose, and by making iterative refinements to the instrument. Nevertheless, the percentage agreement between each pair of reviewers assigned to a particular review article ranged from 23% to 86%, with a median of 59% for the articles synthesized in the review. Weighted Kappa coefficients (32) were used to take a closer look at the agreement between reviewers for the summary assessments of the four sources of bias and the overall assessment of methodological quality. These coefficients were as follows: comparability of study groups (0.34); intervention implementation (0.28); outcome assessment (0.30); statistical analysis (0.23); overall (0.28). Using criteria by Landis and Koch (33), this level of agreement would be considered only “fair.” While quantitative agreement was not strong in initial assessments of study quality, paired reviewers did not differ greatly in their overall view of a study’s quality; rather, disagreements often arose on how to use the quality assessment form. Reviewer pairs were not fixed for all articles, so that each reviewer was paired with several others over the course of the review. Further, most articles were reviewed by a pair consisting of one NIOSH researcher and one IWH researcher, which ensured complementary expertise and lessened the possibility that a junior reviewer might routinely defer to a senior one within the same organization. The practices used to construct reviewer pairs did not maximize agreement within pairs, but prevented large, systematic discrepancies between pairs. After paired reviewers made their initial assessments, they worked collaboratively to reach consensus. Overall, the results demonstrated the importance of having two reviewers and a consensus process, which were study strengths. 2.4 Data extraction (DE) The review team developed a standardized data extraction (DE) form, based on existing forms and data extraction procedures (see Appendix F). A summary of the form is shown in Table 3. Data extraction was performed independently by two reviewers. Study results were derived from figures, if they were not available in tables. Discrepancies in data extracted were resolved using consensus. If consensus could not be reached, a third reviewer was consulted. Team members did not review articles that they had authored, co-authored or consulted on. The completed DE documents are available upon request.
A systematic review of the effectiveness of training & education for the protection of workers
15
Table 3: Summary of data extraction (DE) instrument
1. 2. 3. 4. 5. 6. 7. 8. 9. 10. 11. 12. 13. 14. 15. 16. 17. 18. 19. 20. 21. 22. 23. 24. 25. 26.
The title, first author and year of publication of all relevant articles Research question(s) Study design Unit of allocation Randomization methods Data collection time points Place of study Calendar time of study Description of workplace(s) Methods used to select workplace(s) Methods used to select groups/individuals Comparison of study population vs. larger population Other information about the population and context Comparison of study groups Description of each intervention Study group contamination Unplanned co-interventions Description of each outcome Description of each set of outcome data Cost of intervention Factors affecting intervention effectiveness (quantitative data) Factors affecting intervention effectiveness (qualitative data) Adverse intervention effects Author’s conclusions Reviewer’s conclusions Other noteworthy information
2.4.1 Selecting from multiple measures of an outcome in a single study A single study might report on multiple measures in an outcome category of interest. For example, a study might report on two measures in the Behaviour category: postural behaviours and workstation changes. In such cases, we selected measures using the following set of rules. First, measures were automatically excluded if they had not been measured at baseline or in both groups being compared. Second, measures considered more appropriate to the intent of the intervention and evaluation were selected in preference to others. For example, the measure of upper body musculoskeletal (MSK) symptoms was used over lower or total body MSK symptoms when the intervention focus was office ergonomics (Bohr, 2000; 2002). Similarly, measures of the ergonomic environment or ergonomic behaviours were used in preference to measures of the workplace psychosocial environment in another study (Eklöf et al., 2004; Eklöf & Hagberg, 2006). In Perry and Layde (2003), the Behaviour category measures described as primary outcomes were used in preference to those described as exploratory.
16
Institute for Work & Health
The third rule was to favour independent rater assessments (e.g. clinician or external observer) over worker self-reports. Accordingly, symptom assessment by clinician or technical instrument was preferred to self-report in Brisson et al. (1999), Duffy and Hazlett (2004), and Held et al. (2002). The objective measure of behaviour was preferred to the self-report in Greene et al. (2005). If more than one outcome measure remained after this selection procedure was applied, they were reported separately in the results tables (i.e. Tables 12a-d, 14). Three studies (Bohr, 2000; 2002; Jensen et al., 2006; Löffler et al., 2006) reported multiple follow-up times for an outcome. In these cases, the measures from the longest follow-up time were used. 2.5 Evidence synthesis I: Constructing bodies of evidence During evidence synthesis, the results of the primary studies are collated and summarized. Evidence can be synthesized either qualitatively or quantitatively. The heterogeneous outcomes in the studies we reviewed precluded a quantitative meta-analysis. Instead we conducted a qualitative review following other recent prevention intervention reviews (34; 35; 36). We first collated the research evidence into “bodies of evidence.” A body of evidence is the group of results from various studies that answers a particular research question. To group results, we drew from the data extraction documents and our conceptual framework described in Section 1, determining where there was sufficient literature to examine particular outcomes of interest. We grouped by: the level of engagement in the training intervention, categories of outcomes, outcome follow-up time and types of comparisons made between different groups in the same study (see Table 4).
A systematic review of the effectiveness of training & education for the protection of workers
17
Table 4: Primary variables for grouping study findings in evidence synthesis
Training interventions o Level of engagement (low, medium, high) Outcome measures o Knowledge o Attitudes & Beliefs (including attitudes, beliefs, perceived risk, self-efficacy, behavioural intentions) o Behaviours (including behaviour-dependent hazards and exposures) o Health (including early symptoms and injury/illness) Outcome follow-up time o Immediate: collected immediately post-training o Short: not immediate and 1 month o Intermediate: > 1 month; 6months o Long: > 6 months Comparisons within studies o training intervention versus no-training control o training intervention A versus training intervention B
2.5.1 Categorizing training interventions Training interventions were categorized by level of engagement, based on the method used in the meta-analysis by Burke et al. (7). The level of engagement was independently assessed by pairs of reviewers who reached consensus. Briefly, the levels of engagement were as follows. They are more fully described in Section 1.2.1. Low engagement: Training that includes oral, written or multi-media presentation of factual information by an expert source. It may include brief interaction. Examples include lectures with minimal interaction, videos, pamphlets, manuals without exercises, or computer instruction with no interaction or feedback. Medium engagement: Training that includes a stronger element of interactivity, with or without feedback. Examples include lectures with discussion afterwards, computer instruction with interaction, workbooks with exercises and results, or discussions or problem-solving activities presented in an interactive format. High engagement: Training that involves an application of the concepts from the training content in a real or simulated environment. Examples include behavioural modelling, based on Bandura’s (37) social learning theory (which may or may not include self-diagnosis or goal setting), handson training including simulated or actual work environments or virtual reality training.
18
Institute for Work & Health
2.5.2 Categorizing outcome measures Outcome measures were categorized by category and timing. A single researcher carried out this procedure, in accordance with the categories developed by the group. We initially classified outcome measures into four categories: Knowledge/Skills; Attitudes & Beliefs; Behaviours, and Health. Health behaviour theory supports the separation of knowledge/skills, attitudes, beliefs and behaviours (38; 39). The workplace training literature supports the distinction between acquired knowledge/skills and behaviours (40). The meta-analysis by Burke et al. (7) on the OHS training literature supports the distinction between knowledge, behaviours and health. Due to the lack of studies measuring skills, our four outcome categories are reported in the rest of the review as Knowledge, Attitudes & Beliefs, Behaviours, and Health. Attitudes & Beliefs include self-efficacy, perceived risk, outcome expectations and behavioural intentions. For the review, we thought that these somewhat distinct concepts could be grouped. This is because there were few results for each concept, they all had potential to be affected in the immediate- and short-term, and they were expected to correlate. The Behaviours category included not only behaviours, but also hazards and exposures that could reasonably be under the control of worker behaviours. Since this review has many ergonomic studies, there was considerable conceptual overlap among behaviours, hazards and exposures. Health included occupational illnesses and injuries, plus early signs of these conditions, such as musculoskeletal symptoms. Outcomes were also categorized according to the timing of their measurement from the end of training as follows:
Immediate: immediately post-training, often before leaving the facility Short-term: not immediate, but up to and including one month posttraining Intermediate-term: greater than one month; up to and including six months post-training Long-term: greater than six months post-training
Some interventions included secondary reinforcement or booster components, which made it unclear as to the start of the post-training period. We defined the start of the follow-up period as the conclusion of the primary training sessions (i.e. the sessions comprising the major transfer of knowledge and skill). 2.5.3 Categorizing study group comparisons The evidence base provided two types of comparisons. One type involved a training intervention group and a no-training control group from the same A systematic review of the effectiveness of training & education for the protection of workers
19
study. These comparisons were relevant to the first research question about the effects of training. The other type involved two different training intervention groups from the same study. Such comparisons provided direct evidence about the effectiveness of higher engagement training relative to lower engagement, which was relevant to the second research question. 2.5.4
Determining the direction and statistical significance of effects in the original studies We present the between-group direction of effect from an individual study as “+” or “-”. In comparisons of a training group against a no-training control group, “+” means the training is more effective than the control condition and “-” means training is less effective. In comparisons of different levels of engagement, a “+” corresponds to the higher level of engagement being more effective than the lower level and “-” means the lower level is more effective than the higher level. Results of the original studies were extracted from the original publications and are reported in Tables 12a-d (studies with training versus control studies) and Table 14 (studies with training having different levels of engagement). If the original study did not determine a between-group direction of effect or its statistical significance (e.g. Banco et al., 1997; Brisson et al., 1999), then the review team made a determination. In such cases, the similarity at baseline of the two groups (alpha = 0.05) was first examined using the following tests: t-test for unequal variances for continuous data; Chi-square test with Yate’s correction for dichotomous or ordinal data; and the score test for rate data (41). If the two groups were found to be similar, the study’s post-intervention data were then analyzed using the same tests. Information on the direction of effect and statistical significance was determined by the biostatistician (SC) on the review team, confirmed by a second team member (LR). Both relied on the data extraction by two reviewers and the original publication. 2.5.5 Determining the effect size Different studies measured effects in different ways. A common metric was needed to compare the size of effects across studies. The most common type of data across studies and outcome categories was continuous data. The standardized mean difference (SMD) was therefore chosen as the primary way to compare the effects of the interventions across studies. This effect size metric is the between-group difference in means divided by the pooled standard deviation for the two groups (42). In other words, it expresses the difference between two groups in terms of a number of standard deviations. As such, it is unitless. It is considered to be a valid way to compare effects across studies, even if they have been measured using different methods (42). 20
Institute for Work & Health
Some express concern about the comparability in these situations, since the SMD will vary across studies, according to the precision of the different measurement methods and the homogeneity of the study groups. A second effect size metric, rate ratio, was used to compare effects between studies when rate data were involved. It has been shown that the standardized mean difference metric has a slight upward bias when using small sample sizes, especially when the total sample size is less that 20 (42). As a result, a correction factor is often applied (42). This was not done in the main analysis of this study, but was examined in a sensitivity analysis. Making this correction was found to have a trivial impact on the study findings (table available from lead author). All of the SMDs and rate ratios appearing in this report were calculated from (post-test) data at one point in time. This calculation was performed only if the baseline similarity of groups had been established through one of the following sources of information:
Results of a statistical test shown in the study report Claims in the study report that baseline measurement was similar across groups, as determined in a statistical test Results of a statistical test conducted by the review team on data provided in the study report (baseline similarity defined as a test result with p > 0.05)
It was desirable to express as much data as possible as SMDs to allow comparisons across studies and outcomes. Data in a form other than continuous were transformed as follows. Ordinal data presented as frequencies were transformed to continuous data, as described in Lipsey and Wilson (42); SMDs were then calculated as usual. In the case of dichotomous data reported as frequencies, SMDs were calculated using the arcsine transformation method described in Lipsey and Wilson (42), after confirming that the underlying phenomenon was continuous in nature. Odds ratio information from the Behaviours category in the Perry and Layde (2003) study and the dermatitis information in the Löffler et al. (2006) study were transformed to SMDs using an established formula (43). Rate ratios are not routinely transformed into SMDs in meta-analysis, but such a transformation became critical to developing an evidence synthesis statement about effects in the Health category. The following steps were therefore carried out with the Banco et al. (1997) and Rasmussen et al. (2003) studies: 1) information on the number of injuries, length of follow-up period, injury rates and employment status were extracted from the original articles; 2) the number of people working was calculated, using assumptions of a full-time employee working 2,000 hours per year and a part-time employee working 1,000 hours per year; 3) odds ratio was calculated, assuming each person acquired no more than one injury; 4) odds ratio was A systematic review of the effectiveness of training & education for the protection of workers
21
transformed to an SMD, employing the Chinn (43) formula. This procedure yielded SMD estimates of +0.06 for both the Rasmussen et al. and Banco et al. studies. Varying the assumption of step 3, so that multiple injuries were assumed for some employees, had little effect on these estimates. In one case, the calculation of an SMD involved an imputation. A standard deviation for voice quality score in Duffy and Hazlett (2004) was derived from an ANOVA table, using the method described in Lipsey and Wilson (42). When some of the data required to calculate effect sizes was missing from published study results, the original authors were sent a request for these data, which was repeated once if they did not respond. Some authors provided the data requested; others did not. Determining baseline similarity and calculating effect size was done by a biostatistician on the review team (SC), with quality control checks by another team member (LR). 2.6
Evidence synthesis II: Determining the strength of a body of evidence To determine the strength of a body of evidence, this review used the methods of the Guide to Community Preventive Services (Guide) (44). This initiative of the U.S. Department of Health and Human Services has led to a number of systematic reviews, including some on occupational health and safety topics (45). Like the best evidence synthesis method of Slavin (46) used in other Institute for Work & Health systematic reviews on prevention interventions (47; 48; 49), the Guide method assesses the quantity and quality2 of research studies, as well as the consistency of their findings in a body of evidence. The Guide also considers the size of the observed intervention effects. The Guide identifies four levels of evidence: strong, sufficient, expert opinion and insufficient. In the current review, the team adopted three levels, dropping expert opinion. Furthermore, the Guide considers studies’ Design Suitability, which range from Greatest (i.e. randomized controlled trials RCTs) to Least (e.g. pre-/post-intervention designs with no control). Since the studies in this review were all RCTs, we simplified the Guide’s evidence synthesis algorithm, by excluding sets of criteria that involved Least or Moderate design suitability. It also meant that there was no need to consider Design Suitability any further during evidence synthesis. As a result, the evidence synthesis algorithm used in this study (Table 5a) considered four aspects of each body of evidence to determine its strength: methodological 2
The Guide evidence synthesis method separately considers two aspects of methodological quality: Design Suitability (i.e. study design); and Study Execution (i.e. threats to internal validity). In the IWH systematic reviews, these aspects are considered together during the methodological quality assessment. 22
Institute for Work & Health
quality, number of studies, consistency of effects and effect size (expressed as the standardized mean difference, SMD). Table 5a: Evidence synthesis algorithm
Level of Evidence
Methodological Quality
Minimum Consistency of Quantity Effects
Minimum Median SMD*
Strong
Good (limitations score = 0-1)
≥2 studies
Sufficient SMD
Sufficient
Insufficient
Interquartile range (range) of effect sizes does not include zero Good or fair ≥5 studies Interquartile (limitations score = range (range) of 0-4) SMDs does not include zero Meet execution, quantity and consistency criteria for Sufficient but not Strong evidence Good 1 study Interquartile (limitations score = range (range) of 0-1) SMDs does not include zero Good or fair ≥3 studies Interquartile (limitations score = range (range) of 0-4) SMDs does not include zero The above criteria not met
Sufficient SMD
Large SMD Sufficient SMD
Sufficient SMD
* SMD = standardized mean difference. Particular SMD criteria for Sufficient and Large varied with outcome type and type of group comparison. See sections 3.4 and 3.6 for the specific values.
Methodological quality assessment in the Guide3 is based on nine potential limitations in the following categories of threats to internal validity: study population or intervention description; sampling; measurement of exposures to the intervention; measurement of outcomes; data analysis; the role of loss to follow-up in interpreting results; the role of confounding in interpreting results; and the role of the comparability of groups and other limitations that would affect the ability of the reviewer to conclude the observed effect is due to the intervention. These nine limitations map well to the four categories of potential bias considered in the methodological assessment of our review: comparability of study groups, intervention implementation, outcome assessment, statistical tests. A limitations score was therefore derived from the four category-specific assessments (see section 2.3.1) by assigning a score of 2 for any “No” and a score of 1 for any “Partial.” These
3
The Guide used the term ‘study execution’ instead of the term ‘methodological quality.’
A systematic review of the effectiveness of training & education for the protection of workers
23
were summed, so the possible range of the limitations score was from 0 (no limitations) to 8 (most limitations). In the original Briss et al. (44) work, studies with 0-1 limitations are classified as ”Good” quality and studies with 2-4 limitations are “Fair.” Studies with 5 or more limitations are not included in evidence synthesis as they have “Limited” quality. This review applied the same classification scheme. A strong or sufficient body of evidence must be consistent in direction and size (with larger effects sizes preferable). We established consistency in direction and size as follows. The interquartile range (computed by Microsoft Excel software) was established for all effect sizes available in the body of evidence. When the number of effects was less than five, then the full range of effects was used to define the interval. If the interval lay completely above zero, then the evidence was considered to be consistent and positive. If the interval lay completely below zero, then the evidence was considered to be consistent and negative. If the interval crossed zero, then the body of evidence did not meet the criterion for consistency. A strong or sufficient body of evidence must also show sufficiently large effects. The effect sizes for a body of evidence were classified by comparing their median against criteria for “Sufficient” and “Large” (Table 5b). The median was used for comparisons instead of the mean because no assumptions about the distribution of effect sizes was needed. The criteria for Sufficient and Large were set by review team members with experience in OHS training intervention research (CS, DE, PS). Criteria for the training versus control comparisons were first set. Next, criteria for the comparisons between two training interventions with differing levels of engagement were set, such that each criterion was one-quarter as large as the criterion used with the corresponding training versus control comparison. Table 5b: Definition of sufficient and large SMD criteria used in evidence synthesis algorithm
Training versus control comparisons Outcome Knowledge Attitudes & Beliefs Behaviours Health
Sufficient SMD 1.0 0.5
Large SMD 1.5 1.0
Higher versus lower engagement training comparisons Sufficient Large SMD SMD 0.25 0.38 0.12 0.25
0.4 0.15
0.8 0.3
0.10 0.04
0.20 0.08
A methodological issue in evidence synthesis arises when some studies contribute multiple effect sizes to a body of evidence. This occurs when 24
Institute for Work & Health
there are multiple outcome indicators or intervention arms. As a result, some studies can have an undue influence on the determination of the median and interquartile range of effect sizes in a body of evidence. The team therefore decided to pool effect sizes based on conceptually similar outcomes, but keep the effect sizes separate when they were based on conceptually distinct outcomes or on separate intervention arms. As a result, some of the effect sizes in the initial Results tables (i.e. Tables 12a-d, 15) are represented by a pooled effect size in the corresponding evidence synthesis tables (i.e. Tables 14a-d, 17). The median was used to represent any pooled group of effect sizes because no assumptions about the distribution of effect sizes were needed. For example, three effects of training on musculoskeletal symptoms in the upper spine were reported in Table 12d for the Greene et al. (2005) study. These effects corresponded to the intensity, frequency and duration of symptoms; they had effect sizes of +0.15, +0.27 and +0.37, respectively. They were then summarized in the corresponding evidence synthesis table (Table 14d) by the median value, +0.27. 2.7 Overview of the review process Figure 3 gives an overview of the flow of literature from the initial steps of the literature search to the final step of evidence synthesis.
A systematic review of the effectiveness of training & education for the protection of workers
25
Figure 3: Overview of the review process
Literature Search
Medline N n = 1416
Embase N n = 1726
PsychInfo N n = 234
Hlth Sfty Sci Abs n = 910
Agricola n = 335
Soc Sci Abs n = 45
Eric n = 618
Toxline n = 2245
CCOHS n = 143
Dissert. Abs n = 129
Experts & Ref List n = 91
Merge databases (n = 7892) and remove duplicates
Duplicates EXCLUDED n = 1423
Relevance Assessment I
Stage 1 and 2 relevance criteria applied to titles/abstracts; n = 6469
Titles/abstracts EXCLUDED
Stage 3 relevance criteria applied to titles/abstracts
Titles/abstracts EXCLUDED
n = 1846
n = 1678
Stage 4 relevance criteria applied to full papers n = 168
n = 4623
Full papers EXCLUDED n = 132
Quality assessment conducted on full papers
Quality Assessment
n = 36 (representing 33 unique studies)
Additional relevance criterion applied to full papers
Relevance Assessment II
n = 36 (representing 33 unique studies)
All non-randomized trials EXCLUDED (n = 11)
Data extraction on full papers
Data Extraction
n = 25 (representing 22 unique studies)
Construction of bodies of evidence Evidence Synthesis I
n = 23 (representing 20 unique studies)
Studies without comparisons of training vs control or higher vs lower engagement training n=2
Evidence Synthesis II
Evidence synthesis on training vs control and higher vs lower engagement studies of Fair/Good methodological quality
Studies of Limited methodological quality n = 7 (6 studies)
n = 16 (representing 14 unique studies)
n= number of studies
26
Institute for Work & Health
3.0 Results
3.1 Description of the studies in the review This section of the report summarizes the main features of the 22 studies included. Section 3.1.1 gives information on the training interventions. Section 3.1.2 describes the study populations. Section 3.1.3 gives information on the outcomes. A summary of key study features is in Table 6. Additional detail is found in the data extraction forms (available upon request).
A systematic review of the effectiveness of training & education for the protection of workers
27
Table 6: Key features of studies included in the review
28 Institute for Work & Health
Authors
Hazard category / Training type
(Level of engagement) Intervention groups
Country
Occupation/ Workplace
Arnetz & Arnetz (2000)
S / Prevention of violence towards health-care workers
(M) Continuous registration of violent incidents on checklist; structured program for regular discussion of specific violent incidents registered in workplace, over one year. Written guidelines for the feedback/group discussion, based on points summarized on checklist. (N) No training control (continuous registration of violent incidents only).
Sweden
Nurses/ Health-care workplaces incl. emergency depts., geriatric psychiatric and home healthcare sites
Banco et al. (1997)
S / Safety training (use of cutters)
USA
Supermarket workers/Supermarkets
Bohr (2000, 2002)
E / Office ergonomic training
USA
Brisson et al. (1999)
E / Office ergonomic training
(H1) Safety training and use of new safety cutters, including instruction and practice. One session; 15 minutes. (H2) Safety training and use of old cutters. One session; 15 minutes. (N) No training control (use of old cutters only). (H) Participatory education (hands-on demo, problem solving, application to work area). One session; two hours. (L) Traditional education (lecture, informational handout, Q&A session). One session; one hour. (N) No training control. (H) Ergonomics training (demonstrations, simulations, discussions, lectures and selfdiagnosis on work stations). Two sessions; three hours each, at a two-week interval. (N) No training control.
Computer users/ Centralized reservation facility in transportation company Clerical workers (computer users)/University
Canada
Outcome timing and type Immed. B
Short
Interm.
Long
H
B, H
B, H
B,H
A systematic review of the effectiveness of training & education for the protection of workers
Hazard category / Training type
(Level of engagement) Intervention groups
Country
Occupation/ Workplace
Duffy & Hazlett (2004)
E / Preventive voice care training
(H) Direct voice care training (vocalization, posture, respiration, release of tension in vocal apparatus, resonance and voice projection). One session; duration not reported. Also received one session of indirect voice care training. (L) Indirect voice care training (information on voice production, factors associated with healthy voice). One session; duration not reported. (N) No training control.
Ireland
Teacher trainees/ Schools
Eklöf et al. (2004); Eklöf & Hagberg (2006)
E / Ergonomic and psychosocial work environment intervention
Sweden
White collar computer users/Nine organizations; various sectors
Gray et al. (1996)
E / Lift & transfer training
Canada
Greene et al. (2005)
E / Office ergonomic training
(H1) Feedback on individual and on group, directed to individuals; related to normative info; given orally & with printed reports. Discussion. One session; 38 minutes. (H2) Same as H1, except feedback is only on the group and is directed to supervisors only. One session; 61 minutes. (H3) Same as H1, but feedback is only on the group and is directed to the group. One session; 85 minutes. (N) No training control. (H) Educational program (demo, videos, lectures, practice sessions, resource team, binder for feedback, manual available & pictograms). Five sessions; four hours per session weekly for five weeks. (N) No training control. (H) Active ergonomic training intervention (didactic interactions, discussion and problem-based activities). Two sessions; three hours per session. (N) No training control, but received intervention at week 4 of the study period.
Nursing personnel/ Long-term care and rehabilitation hospital Computer users/Large university
29
Authors
USA
Outcome timing and type Immed.
Short
Interm. H
B, H
K
K, A, B, H
Long
Hazard category / Training type
(Level of engagement) Intervention groups
Country
Occupation/ Workplace
Harrington & Walker (2002)
P / Fire safety and behaviour training
USA
All staff/ Lifecare community facility
Harrington & Walker (2004)
E / Home office ergonomics training
(M) Computer-based instruction; screens contained narration, interaction, animation or video; some with questions and interactive games. Two sessions; average 30 minutes each. (L) Instructor-led (lectures & printed materials). Two sessions; average 40 minutes each. (N) No training control. (L) Computer-based training, screens containing interaction, animation or a colour graphic to keep learner-focused. Includes screen-to-screen navigation so learner can move forward, pause, repeat a topic or quit the lesson. Program “combines text, graphics, color illustrations, animation, and sound, to provide a fully interactive media-rich learning environment.” One session; 45 minutes. (N) No training control.
USA
Teleworkers/ Home or telecommuting centres (business, academic, government agency)
Held et al. (2002)
C / Skin care program
(H) Train-the-trainer. Education on skin care (video, instruction, role play, booklet, reinforcement meeting). Two sessions; four hours each with 14 weeks in between and one meeting with instructors six weeks after last session for reinforcement. (N) No training control.
Denmark
“Wet workers” (nurses, cleaners, kitchen, staff)/Geriatric care facility
30
Authors
Outcome timing and type Immed. K, A
Short
Interm.
K, A
B, H
Long
Institute for Work & Health
A systematic review of the effectiveness of training & education for the protection of workers
Hazard category / Training type
(Level of engagement) Intervention groups
Country
Occupation/ Workplace
Hickman & Geller (2003)
S / Safety selfmanagement (mining)
USA
Miners/Aboveground quarry
Hong et al. (2006)
P / Hearing protection training
USA
Construction workers, heavy equipment
Jensen et al. (2006)
E/ Lifting technique training
Denmark
Health-care workers/ Eldercare services
Löffler et al. (2006)
C/ Skin care program
Safety self-management training, including goal-setting, ways to self-reward for meeting goals, group exercises to demonstrate personal use of self-monitoring form (one two-hour session). Four weeks of selfrecording and feedback. (H1) Pre-behaviour (self-recording of intended safety-related work behaviours before beginning of shift). (H2) Post-behaviour (self-recording of safetyrelated work behaviours after shift). (H) Tailored with feedback: Computer-based training tailored to worker’s hearing test, selfreported hearing protective device (HPD) use, self-efficacy and perceptions. Reinforcement of any HPD use. Practice with HPDs. Handout with hearing test results, individualized information and opportunity to ask questions. One session; 43 minutes. (M) Commercial video with feedback: Computer-delivered video meeting OSHA requirements. Handout with hearing test results, standard information and opportunity to ask questions. One session; 33 minutes. (H) Transfer technique intervention: train-thetrainer. Two four-hour sessions of mainly classroom education, followed by observation and feedback in work setting. Training aimed to reduce biomechanical risks. (N) Control received training in topic of their “choice in matters unrelated to the intervention program.” (M) Lecture, group problem-solving, practice with individual feedback. Seven sessions over three years; duration unknown. (L) Informational paper. One time.
Germany
Nursing students/ Health care organizations
31
Authors
Outcome timing and type Immed. B
Short
Interm.
A
Long
A, B
B
B, H
H
Hazard category / Training type
(Level of engagement) Intervention groups
Country
Occupation/ Workplace
Lusk et al. (2003, 2004)
P / Hearing protection training
USA
Factory workers/ Large automotive factory
Perry & Layde (2003)
C / Safe pesticide handling
USA
Farmers/ Private dairy farms
K, B
Rasmussen et al. (2003)
S / Safety training (farm)
Denmark
Farmers/Farms
B, H
Rizzo et al. (1997)
E / Preventive office ergonomic training
(H1) Tailored: Computer-based training tailored to worker’s self-reported practice. Used factual, cognitive approaches; demonstration; directed practice; vicarious experience; persuasion and role-modeling techniques. Presented in interactive format, with feedback. One session; 30 minutes. (H2) Non-tailored: As above, but delivered to all participants in a uniform manner. One session; 30 minutes. (L) Control:Video. One session; 30 minutes. In each group, there were four possibilities: Boosters at 30 days; Boosters at 30 & 90 days; Boosters at 90 days; No boosters. (H) Education intervention (lecture, slides, presentation by respected area farmer, demonstration and opportunity for hands-on practice). One session; three hours. (L) Standard re-certification meeting for pesticide applicators. One session. (H) Farm safety check (feedback, written report with recommendations) (1/2 day) and safety course (lecture, meeting with injured farmers, demonstration, discussion of recommendations, action planning) (one day, within one to four weeks after farm safety check). (N) No training control (L1) Instructor-directed: Seminar, video, pamphlets, and concluding discussion in which instructor summarized and responded to individual questions. One session; one hour. (L2) Self-directed (videos and pamphlets). One session; 45 minutes. (N) No training control.
USA
Computer users/ Information technology
32
Authors
Outcome timing and type Immed.
Short
Interm.
Long B
Institute for Work & Health
K
A systematic review of the effectiveness of training & education for the protection of workers
Authors
Hazard category / Training type
(Level of engagement) Intervention groups
Country
Occupation/ Workplace
Outcome timing and type
Van Poppel et al. (1998)
E / Ergonomic training on lifting (back pain prevention)
(H) Lifting instruction, including theory and practice, and including instruction in individual work settings. Three sessions (two hours, 1.5 hours, 1.5 hours respectively). (N) No training control.
Netherlands
Manual material handlers /Cargo department of airline company
Wang et al. (2003)
B / Blood-borne pathogens prevention training
China
Nursing students/ Hospital
K, B
Wright et al. (2002)
B / Universal Precautions training
(L1) Educational intervention about bloodborne pathogens (lecture, video and printed materials). One session; 60-minute lecture, 20-minute video. (L2) Standard education about vaccination only. (M) Computer-assisted instruction with problem-solving scenarios and feedback. No sessions; self-paced. (N) No training control.
USA
Registered nurses/ Large teaching hospital
B
Immed.
Short
Interm. H
Long
Level of engagement: H = high; M = medium; L = low; N = no training control. Hazard Category: E = ergonomics; S = safety/injury; C = chemical; B = biological; P = physical. Outcome timing: Immed = immediately after training; short = short-term; not immediate and < 1 month; intermediate = > 1 month and < 6 months; long = longterm; > 6 months. Type of outcome: K = knowledge; A = attitudes & beliefs (including attitudes, beliefs, perceived risk, self-efficacy, behavioural intentions); B = behaviours (including behaviour-dependent hazards and exposures); H = health (including early symptoms and injury/illness). Only study outcomes falling into one of these four categories and for which both pre- and post-intervention measures are available are documented.
33
3.1.1 Training interventions Thirty-six different training interventions were studied in the 22 studies in the review. The intervention features are described in more detail below. Sixteen studies also included a no-OHS training control condition. Training content -- occupational hazard: The interventions were categorized into five types of occupational hazards described in the Cohen and Colligan (4) review. These categories had been chosen to reflect workrelated exposure risks recognized by U.S. Occupational Safety and Health Administration (OSHA) standards. The hazard categories are:
safety/injury hazard health hazard - chemical agents health hazard - biological agents health hazard - physical agents ergonomic hazard
Most studies in our review addressed ergonomic hazards (n = 10). Other categories were safety/injury hazards (n = 4), chemical agents (n = 3), physical agents (n = 3) and biological agents (n = 2). Table 7a shows the training content in more detail. In the category of ergonomic training, office ergonomics was most frequently studied. Safety training/injury prevention interventions took place in a range of settings, including farming, mining, health care and retail. Chemical hazard interventions had content on safe pesticide use and skin care. Physical hazard prevention involved hearing protection and fire safety. The studies involving biological hazards concerned blood-borne pathogens. Table 7a: Studies and interventions by hazard category Hazard category Ergonomics: Safety/Injury Hazard Training :
Chemical: Physical agents Biological Total
Office ergonomics (6,10)# Lifting (3,3) Voice training (1,2) Farm safety (1,1) Safety self-management, mining (1,2) Violence prevention, health care (1,1) Use of cutters, retail (1,2) Pesticide use (1,2) Skin care (2,3) Hearing protection (2,5) Fire safety, long-term care (1,2) Blood-borne pathogens (2,3)
Number of studies 10
Number of interventions 15
4
6
3
5
3
7
2 22
3 36
#
Numbers in brackets show the number of studies and interventions, respectively, as multiple interventions could occur in one study.
34
Institute for Work & Health
Training methods: Training methods are listed in Table 7b. Traditional methods of lectures and printed materials were most common. However, training elements that engaged the learner more were also common. Fourteen interventions involved a hands-on practice component and 12 involved feedback to the learner. In most cases, a combination of methods was used. Examples include a lecture with a question and answer opportunity and a handout, or a demonstration followed by a practice session. Further details on these training methods are in Table 6. Table 7b: Method of training delivery
Method of training delivery used Lectures Printed materials (pamphlets, booklets, information sheets) Hands-on training (simulated work environment and/or participant’s own work environment) Feedback Videos Discussions Demonstration Computer instruction Problem-solving Q&A Behaviour modelling Goal-setting/planning Role play
No. of interventions 20 14 14 12 8 7 7 5 5 4 3 3 1
Degree of engagement: The descriptions of training methods were used to place an intervention into one of three categories of learner engagement – low, medium or high. These are described more fully in section 1.2.1. Most studies (15 of 22 studies) included at least one group participating in an intervention categorized as “high engagement” for a total of 20 high engagement interventions. Five studies included a single “medium engagement” intervention. In nine studies, there were 11 “low engagement” interventions. Intensity of exposure in the interventions: The intensity of the interventions studied was typically modest. Of the 34 interventions where the number of sessions could be assessed, 23 involved only a single session; eight involved two sessions; and one intervention each involved three, five and seven sessions. A systematic review of the effectiveness of training & education for the protection of workers
35
The sessions usually did not take place over a long period of time. Of the 28 interventions where session duration could be assessed, 12 had sessions lasting less than one hour; nine were one to two hours; and seven lasted three or more hours. Summary The most frequent type of hazard addressed in the training interventions was ergonomic, followed by safety/injury hazards, and less often, chemical, biological or physical hazards. The most frequent method of delivering the intervention was lectures, followed by printed materials, hands-on practice in a realistic work environment, and giving feedback to the learner. The majority of interventions studied (20 out of 36) were classified as having high engagement delivery methods. However, the intervention intensity was usually modest. Two-thirds of the interventions involved only one session of training; and the session length was typically two hours or less. 3.1.2 Study populations Country of origin: Half of the studies were done in the USA (n = 11). The next most frequent source was Denmark (n=3), followed by Canada and Sweden, each of which yielded two studies. One study was done in each of the following countries: Germany, the Netherlands, Ireland and China. We note that our selection of only English and French articles for review would likely have influenced these findings. Industrial sector: Eight studies were in the health-care/social assistance sector, three in educational services, two in each of agriculture and transportation, one in each of manufacturing, construction, mining, retail and information technology. In two studies, more than one industry was involved. Occupation: Health-care occupations were most frequently involved in the training interventions, with four studies involving nurses or other direct caregivers, two involving student nurses, and two involving various occupations in a health-care setting (Table 8). Various white collar workers were also well represented, described as computer users, teleworkers or administrative staff. Farmers were participants in two studies; and factory workers, miners, construction workers, airline cargo handlers, supermarket workers and teacher trainees in one study each.
36
Institute for Work & Health
Table 8: Occupations of individuals involved in training interventions
Occupation Computer users, teleworkers, administrative staff Nurses and other direct caregivers in health care (including nursing students, n = 2) Mix of occupations in health-care setting Farmers Factory workers Miners Construction workers Airline cargo handlers Grocery clerks/shelf stockers Teacher trainees
Number of studies 6 6 2 2 1 1 1 1 1 1
Gender was often embedded in the description of participants’ occupations, so we did not analyze gender separately. There is some variation in the previous experience (or age) of participants, but this aspect has not been analyzed. Summary The majority of studies were done in the USA, with the remainder coming from Canada, Europe and China. A third of the studies involved the healthcare/social assistance sector and the remaining two-thirds involved a variety of sectors (educational services, agriculture, transportation, manufacturing, construction, mining, retail and information technology). Two occupational groups were researched in more than half of the studies – health-care workers and office workers – and the remaining occupations were otherwise varied. 3.1.3 Outcomes Of the 22 studies reviewed, 11 studies examined health outcomes. Most common were musculoskeletal injuries/symptoms (n = 6). Two studies each were concerned with other injury measures (all injuries/cutter injuries) and skin symptoms, and one looked at voice quality. Fourteen studies included outcomes in the Behaviour category (i.e. behaviours; and hazards and exposures influenced by behaviours). The most frequent examples were personal protective equipment use, and postural behaviours and hazards at computer workstations. Seven studies included outcomes related to knowledge and skills on topics such as ergonomics of computer use (n = 3), ergonomics of lifting, safe pesticide use, fire safety and Universal Precautions against blood-borne pathogens. Only four studies included outcomes related to attitudes and beliefs (e.g. attitudes toward fire hazards, self-efficacy, intention to use hearing protection device).
A systematic review of the effectiveness of training & education for the protection of workers
37
Outcomes were also categorized by the length of time after the intervention until follow-up using the four categories of immediate, short-term, intermediate, and long-term (defined in Table 6). Only three studies measured outcomes in more than one of these time frames (Bohr, 2000; 2002; Hong et al., 2006; Jensen et al., 2006). In total there were 40 distinct outcomes measured in the 22 studies. These were counted after sorting results into 16 outcome type and time frame categories (see Table 9). Eight of these outcomes were measured immediately after the intervention. In four cases, a short-term outcome was measured. In 18 cases, intermediate-term outcomes were measured, while 10 measured long-term outcomes. Table 9: Types of outcomes measured in studies
Type of Immediate outcome/time frame Knowledge 3 Attitudes & Beliefs 3 Behaviours 2 Health 0 Total 8
Shortterm 1 1 1 1 4
Intermediate Longterm 2 1 0 1 9 4 7 4 18 10
Total 7 5 16 12 40
In summary, the types of outcome measures included Knowledge, Attitudes & Beliefs, Behaviours and Health. Outcomes in the categories of Behaviours and Health were observed most frequently, and were most often measured between one and six months after the intervention. 3.2 Methodological quality As shown in Table 10, the size of the study samples varied widely, from 15 to 2,219 at the outset of the study. The median was 209. Three studies had small study populations, with less than 20 study units in each study group (Duffy & Hazlett, 2004; Eklöf et al., 2004; Hickman & Geller, 2003). Table 10 shows the reviewers’ assessments for each study. The results across all studies are summarized in Table 11. It shows that the strongest domain of internal validity was outcome measurement. Even so, reviewers rated only 36% of the studies in this domain with a “yes.” In other words, they were confident that the potential for bias related to outcome measurement was minimized in 36% of the studies reviewed.
38
Institute for Work & Health
Table 10: Summary of methodological quality assessments of studies
Authors Arnetz & Arnetz (2000) Banco et al. (1997) Bohr (2000; 2002) Brisson et al. (1999) Duffy & Hazlett (2004) Eklöf et al. (2004); Eklöf & Hagberg (2006) Gray et al. (1996) Greene et al. (2005) Harrington & Walker (2002) Harrington & Walker (2004) Held et al. (2002) Hickman & Geller (2003) Hong et al. (2006) Jensen et al. (2006) Löffler et al. (2006) Lusk et al. (2003; 2004) Perry & Layde (2003) Rasmussen et al. (2003) Rizzo et al. (1997) Van Poppel et al. (1998) Wang et al. (2003) Wright et al. (2002) MEDIAN
Initial study sample a size
Methodological assessments: four domains and overall CSG
II
OA
SA
Overall
*1500 950 154 *658 55
P P N P N
P P N P N
N P Y Y Y
P P N N N
2 3 3 4 2
36
P
P
P
Y
3
*250 87
N P
N P
N P
N P
1 3
141
N
P
P
P
3
102
P
N
P
Y
3
375
Y
Y
Y
Y
5
15
Y
P
Y
Y
4
612 210 521 2219 400 208 *150 312 106 60 209
P P P P Y Y N P P P
Y P P P P Y N P P P
Y N Y P Y P Y P P P
P N P P Y Y P N P Y
4 3 4 3 4 4 3 4 3 3 3
Methodological limitations score used in evidence synthesis 5 4 6 4 6 3 8 4 5 4 0 1 2 6 3 4 1 1 5 5 4 3 4
CSG = comparability of study groups; II = intervention implementation; OA = outcome assessment; SA = statistical analysis. Y = Yes (confident that the potential for bias was minimized); P = Partly; N = No. Initial study sample size refers to the initial size of the sample with respect to individual workers, with the exception of the Eklöf studies where it refers to the workgroups. Where the distinction was permitted, this was the size of the study sample following exclusions on the basis of eligibility, initial inability to contact and initial refusal to participate, but before any loss of sample for reasons of non-response during measurement or withdrawal. Asterisks (*) indicate cases in which numbers were either estimated by the reviewers or were reported as approximate by the authors. For Banco et al. (1997), which reported worker hours, an estimated number of FTEs is reported. a
A systematic review of the effectiveness of training & education for the protection of workers
39
The five methodological assessments correspond to summary questions (#10, #15, #20, #24, #26) in the quality assessment instrument (Appendix E). The first four questions asked reviewers whether they were confident that the potential for bias was minimized in each of four domains of internal validity (CSG, II, OA, SA). Possible responses were Yes (Y), Partly (P) and No (N). The fifth overall assessment item asked: “What degree of confidence do you have that the study provides an unbiased estimate of the true effect of a specific training intervention in the initial study sample?” Possible responses were: 5 – high degree of confidence (very little or no bias is most likely); 4; 3 – medium degree of confidence (a moderate amount of bias is possible); 2; 1 – low degree of confidence (a large amount of bias is very likely). When the study involves multiple outcomes, the scores for the best quality outcome are reported. A limitations score was derived from the four domain-specific methodological assessments by assigning a score of 2 for any “No” and a score of 1 for any “Partial.” These were summed, so the possible range of the limitations score was from 0 (no limitations) to 8 (most limitations).
In terms of being most favourably rated, outcome measurement was followed by statistical analysis, then comparability of study groups, and finally intervention implementation (Table 11). More specific areas of concern are revealed in the responses at the level of individual QA items (Appendix G). The areas of particular concern to reviewers were the following (issues are listed when more than 50% of the outcomes did not meet the QA criterion because of inadequacies in methodology or reporting:
40
inadequate reporting of the method of randomization inadequate reporting of the concealment of the subject assignment to study group up to the implementation of the intervention inadequate reporting on the effect of withdrawals on group similarity inadequate reporting on the implementation of the intervention inadequate reporting on potential contamination between study groups inadequate reporting on other workplace events that could impact outcomes lack of blinding of outcome assessors (related to the heavy use of self-report measures in these studies) inadequate reporting on statistical adjustments to correct for group differences at baseline or following withdrawal lack of consideration during analysis of the effect of participant withdrawals on results
Institute for Work & Health
Table 11: Distribution of responses (%) to summary questions about methodological quality
Reviewers’ response to:
a
Domains of potential bias
Confident that potential for bias minimized in that domain?a
Comparability of study groups
Intervention implementation
Outcome measurement
Statistical analysis
Yes Partly No
18 59 23
14 64 23
41 45 14
32 41 27
Reviewers were asked whether they were confident that the potential for bias in the estimate of the true effect was minimized (with reference to the indicated domain of bias).
Following the assessment of a study’s potential for bias in the four domains, reviewers gave an overall assessment of the article. They were asked to indicate their degree of confidence that the study provided an unbiased estimate of the true effect of a specific training intervention, in the initial study sample on a five-point scale. Results for each study are shown in Table 10. They range from 1 to 5, with a median of 3 and a mean of 3.2. A score of 3 on the scale corresponded to reviewers having a “medium degree of confidence” and that they thought a “moderate amount of bias is possible.” This generally lukewarm endorsement of study quality was somewhat surprising to the reviewers, since all were randomized controlled trials. Also provided (Appendix H) is a summary of the methodological quality ratings for 11 non-randomized trial studies that were ultimately excluded late in the review process (see end of section 2.2) For purposes of using the Guide to Community Preventive Services (44) algorithm in the evidence synthesis step, the four domain scores were transformed into a “methodological limitations score” as described elsewhere (section 2.6). As summarized in Figure 4, only three studies had a score of 0-1 (classified as Good); 11 studies had a score of 2-4 (Fair); and eight studies had a score of 5 or more (Limited). Only studies classified as Good or Fair were included in the evidence synthesis, in accordance with the Guide. This meant that only 14 studies were potentially available for the final stage of evidence synthesis (sections 3.4. and 3.6).
A systematic review of the effectiveness of training & education for the protection of workers
41
Figure 4: Distribution of studies by methodological limitations scores Good
Number of studies
7
Fair
Limited
6 5 4 3 2 1 0 0
1
2
3
4
5
6
7
8
Lim ita tions score A limitations score was derived from the four domain-specific methodological assessments by assigning a score of 2 for any “No” and a score of 1 for any “Partial.” These were added, so the possible range of the limitations score was from 0 (no limitations) to 8 (most limitations). The studies were grouped into methodological quality categories using the limitations scores, as shown.
3.3 Effect of training (versus no training) on OHS outcomes This section summarizes the research findings on the effectiveness of training relative to a no-training control condition in the 22 studies of the review. As such, these findings address the first research question: “Does OHS training have a beneficial effect on workers and firms?” Tables 12a-d report the studies’ results in three ways. First, the direction of the effect of training in comparison with the control is reported, with a “+” indicating that the effect was positive. Direction of effect can be determined in more than one way (e.g., by comparing outcome measures postintervention for the training and control groups, or by comparing pre-post changes). In these tables, the direction relied upon the author’s primary approach to the between-group analysis. Second, we report the statistical significance of the effect of training versus the control. Again, the author’s approach to the analysis was used to report the statistical significance. Third, where data permitted, the effect of training relative to the control is expressed in terms of the standardized mean difference (see section 2.5.6). This allows a valid comparison of the size of the effect across the various studies, even though different methods of measuring outcomes were used (42). These results were calculated by the review team 42
Institute for Work & Health
A systematic review of the effectiveness of training & education for the protection of workers
Table 12a: Effect of training on Knowledge (relative to a no-training control) [refer to key at end of Table 12d for abbreviations and explanations]
43
Authors
Intervention (level of engagement; number of training sessions; hazard type)
Limitations
Sample n
Time of followup
Outcome(s)
Gray et al. (1996)
Multi-component lift training to nurses (H;5;E) Multi-component office ergonomics (H;2;E)
8
not reported
Immed
Knowledge (Q)
4
83
Short
Harrington & Walker (2002)
1) Computer-based fire safety training at life care facility (M;2;P) 2) Instructor-led fire safety training (L;2;P)
5
1) 46 2) 45
Harrington & Walker (2004) Rizzo et al. (1997)
Computer-based home office ergonomics training (L;1;E) 1) Instructor-directed computer ergonomics (L;1;E) 2) Video and pamphlets; computer ergonomics (L;1;E)
4 5
Greene et al. (2005)
Results, as reported in original publication Direction of Statistical effect significance (between group) + p < 0.001
SMD, calculated by reviewers
Knowledge and beliefs (Q)
+
+1.45
Immed
i) Knowledge on hazards (Q) ii) Knowledge on safety behaviours (Q)
1i) +# 1ii) +# 2i) +# 2ii) +#
p < 0.01 for interaction of baseline knowledge and group in ANCOVA ANCOVA: 1i) p < 0.05 1ii) p < 0.05 2i) p < 0.05 2ii) p < 0.05
50
Immed
Knowledge (Q)
+
p < 0.0001#
+3.58
1) 45 2) 39
Long
Knowledge (Q)
1) + 2) +
ANCOVA: 1) p < 0.05 2) p < 0.05
1) +1.38 2) +0.78
na
1i) +1.30 1ii) +1.06 2i) +0.94 2ii) +0.83
44
Table 12b: Effect of training on Attitudes & Beliefs (relative to a no-training control) [refer to key at end of Table 12d for abbreviations and explanations]
Institute for Work & Health
Authors
Intervention (level of engagement; number of training sessions; hazard type)
Limitations
Sample n
Time of followup
Outcome(s)
Greene et al. (2005)
Multi-component office ergonomics (H;2;E)
4
83
Short
i) Self-efficacy (Q) ii) Outcome expectations (Q)
Harrington & Walker (2002)
1) Computer-based fire safety training at life care facility (M;2;P) 2) Instructor-led fire safety training (L;2;P)
5
1) 46 2) 45
Immed
i) Attitudes to hazards (Q) ii) Attitudes to safety behaviours (Q)
Harrington & Walker (2004)
Computer-based home office ergonomics training (L;1;E)
5
50
Immed
Attitudes (Q)
Results, as reported in original publication Direction of Statistical effect significance (between group) i) + ANCOVA: ii) + i) p < 0.01 for interaction of baseline self-efficacy and group ii) p = 0.00 1i) ANCOVA on three 1ii) + groups: 2i) 1i) ns 2ii) 1ii) ns 2i) ns 2ii) ns + p = 0.0001#
SMD, calculated by reviewers
i) +0.82 ii) +0.87
1i) € 1ii) +0.21 2i) -0.03 2ii) -0.13 +1.41
A systematic review of the effectiveness of training & education for the protection of workers
Table 12c: Effect of training on Behaviours (relative to a no-training control) [refer to key at end of Table 12d for abbreviations and explanations]
45
Authors
Intervention (level of engagement; number of training sessions; hazard type)
Limitations
Sample n
Time of followup
Outcome(s)
Arnetz & Arnetz (2000)
Group discussion of violent incidents (both groups with violent incident forms) (M;multiple;S) 1) Multi-component office ergonomics (H;1;E) 2) Lecture (L;1;E) Multi-component office ergonomics (H;2;E) for each of: 1) < 40 yrs 2) ≥ 40 years
5
686
Immed
Exposures to violent incidents (Q)
6
1) 103 2) 104
Long
4
1) 207 2) 420
Interm
Multi-component office ergonomics including PS factors (H;1;E) Three study arms with different targets for feedback: 1) individual 2) supervisors 3) group
3
1) 18 2) 18 3) 18 (unit: workgp)
Interm
Bohr (2000; 2002) Brisson et al. (1999)
Eklöf et al. (2004); Eklöf & Hagberg (2006)
Results, as reported in original publication Direction of Statistical effect significance (between group) p = 0.03
SMD, calculated by reviewers
i) Workstation hazards (O) ii) Postural behaviours (O) i) 3 postural behaviours (O) ii) 10 workstation hazards (O)
1i) - # 1ii) - # 2i) + # 2ii) + # Calculated by reviewers: 1i) €, +, + 1ii) +, €, €, €, €, +, -, €, +, + 2i) +, €, + 2ii) €, +, +, +, +, +, €, +, +, +
na
i) % ergonomic modifications (Q) ii) Avg. no. ergonomic modifications (Q)
1i) + 2i) + 3i) + 1ii) +# 2ii) +# 3ii) +#
1),2) p ≥ 0.05 (RM ANOVA on all 3 groups) Calculated by reviewers: 1i) p = €, .00, .52 1ii) p = .02, €, €, €, €, .02, .15, €, .10, .04 2i) p = .99, €, .00 2ii) p = €, .01, .24, .35, .08, 0.04, €, 0.06, 0.45, .04 1i) p = 0.02 2i) p = 0.02 3i) p = 0.06 1,2,3) ii) p = 0.24 in overall test All based on change data.
-0.20
1i) €, +.49, +.11 1ii) +.34, €, €, €, €, +.35, -.22, €, +.29, +.30 2i) +.01, €, .35 2ii) €, +.38, +.19, +.15, +.26, +.31, €, +.30, +.14, +.30 1i) +1.09 2i) +1.71 3i) +1.98 1ii) +0.95 2ii) +1.35 3ii) +2.36
46
Authors
Intervention (level of engagement; number of training sessions; hazard type)
Limitations
Sample n
Time of followup
Outcome(s)
Greene et al. (2005)
Multi-component office ergonomics (H;2;E)
4
87
Short
Postural exposures (O)
Held et al. (2002)
Formalized education program on skin care (H;3;C)
0
287
Interm
6 wet work behaviours (Q)
Jensen et al. (2006)
Train-the-trainer program in patient lifting techniques (H;2;E) Multi-component farm safety (H;2;S)
6
64 approx
Long
Physical exertion (Q)
1
178
Interm
1) Instructor-directed computer ergonomics (L;1:E) 2) Video and pamphlets; computer ergonomics (L;1:E) Computer-assisted with problem-solving; UP behaviours (M;1;B)
6
1) 45 2) 39
Long
i) Active safety behaviours (Q) ii) PPE use (Q) Work habits (Q)
60
Interm
Rasmussen et al. (2003) Rizzo et al. (1997) Institute for Work & Health
Wright et al. (2002)
3
UP behaviours (O)
Results, as reported in original publication Direction of Statistical effect significance (between group) + p < 0.01 for interaction of postural exposures and group in ANCOVA i) + Using change data: ii) + i) p = 0.02 iii) na ii) p < 0001 iv) na iii) p = 0.80 v) + iv) p = 0.54 vi) +# v) p = 0.06 vi) p = 0.11 ns
i) + ii) + 1) + 2) +
+
Using change data: i) p = 0.035 ii) p = 0.005 ANCOVA: 1) p < 0.05 2) p < 0.05
Using change data: p = 0.0004
SMD, calculated by reviewers
+1.16
i) +0.51o ii) +0.83 o iii) +0.03 o iv) +0.17 o v) +0.52 o vi) +0.32 o -0.17
na
1) € 2) +1.32
+1.25
A systematic review of the effectiveness of training & education for the protection of workers
Table 12d: Effect of training on Health (relative to a no-training control) [refer to key at end of table for abbreviations and explanations] Authors
Intervention (level of engagement; number of training sessions; hazard type)
Limitations
Sample n
Time of followup
Outcome(s)
Banco et al (1997)
Training on old cutter use by retail employees (H;1;S) 1) Multi-component office ergonomics (H;1;E) 2) Lecture (L;1;E) Multi-component office ergonomics (H;2;E) for each of: 1) < 40 years 2) ≥ 40 years 1) Practical training on voice use for teaching trainees (H;2;E) 2) Information on voice use for teaching trainees (L;1;E) Multi-component office ergonomics including PS factors (H;1;E) Three study arms with different targets for feedback: 1) individual 2) supervisors 3) group
4
670
Long
Cutter-related injury rate (A)
6
1) 85 2) 86
Long
Upper body MSK symptom score (Q)
Interm
MSK disorder prevalence (C):
Bohr (2000; 2002) Brisson et al. (1999)
Duffy & Hazlett (2004)
Eklöf et al. (2004); Eklöf & Hagberg (2006)
5 1) 162 2) 328 6
3
1) 35 2) 43
Interm
1) 18 2) 18 3) 18 (unit: workgp)
Interm
Voice quality score (P)
MSK or eye symptom prevalence (Q)
Results, as reported in original publication Direction of Statistical effect significance (between group) p = 0.8#
SMD or Rate Ratio, calculated by reviewers
1) +# 2) + #
1,2) p < 0.01 (RM ANOVA on all 3 gps)
na
1) + 2) - #
1) p=0.1# 2) p=0.4#
SMDs: 1) +0.33 2) -0.11
1) + 2) +
1,2) p=0.18 (RM ANOVA on all 3 gps)
SMDs: 1) +0.04 o 2) +0.30 o
1) -# 2) -# 3) -#
1,2,3) p = 0.90 in overall test of change data
SMDs: 1) -0.13 2) -1.34 3) -0.37
Rate ratio: 0.90
47
48
Authors
Intervention (level of engagement; number of training sessions; hazard type)
Limitations
Sample n
Time of followup
Outcome(s)
Greene et al. (2005)
Multi-component office ergonomics (H;2;E)
4
82
Short
Held et al. (2002)
Formalized education program on skin care (H;3;C) Train-the-trainer program in patient lifting techniques (H;2;E) Multi-component farm safety (H;2;S)
2
287
Interm
MSK symptom score (Q): i) upper extremity (UE) intensity ii) UE frequency iii) UE duration iv) upper spine (US) intensity v) US frequency vi) US duration Skin symptom severity (C)
6
114
Long
Low back pain (Q): i) past year ii) past 3 months
i) – ii) –
1
178 (farms)
Interm
Farm-related injury rates; all injuries (Q)
+
Lifting ergonomics for material handlers (H;3;E)
5
282
Interm
Low-back pain past month prevalence (Q)
-
Jensen et al. (2006) Rasmussen et al. (2003) Van Poppel et al. (1998)
Results, as reported in original publication Direction of Statistical effect significance (between group)
SMD or Rate Ratio, calculated by reviewers
SMDs: i) -0.12 ii) +0.03 iii) -0.15 iv) +0.15 v) +0.27 vi) +0.37
i) – ii) + iii) – iv) + v) + vi) +
i) p=0.6 ii) p=0.9 iii) p=0.7 iv) p=0.8 v) p=0.4 vi) p=0.7
+
p = 0.0002 (based on change data) Using change data: i) p = 0.10 ii) p = 0.16
SMD: +0.05 o
p = ns (Poisson regression model) p = 0.97
Rate ratio: 0.91
SMD: i) +0.04 ii) 0.00
SMD: i) –0.004
Institute for Work & Health
A systematic review of the effectiveness of training & education for the protection of workers
Direction of effect: “+” indicates training more effective than control; “-” indicates training less effective than control. As reported by original authors for a between-group results, when available. When not reported, the determination was made by the reviewers (indicated by #), guided by the authors’ approach to analysis. na = data not available for reviewers to determine direction of effect. Hazard type: B, biological; C, chemical; E, ergonomic; P, physical; S, safety Level of engagement: low (L), medium (M), or high (H) Limitations = methodological limitations score as described in Methods, ranging from 0 limitations to 8. Intervention: more details on interventions in Table 6. MSK = musculoskeletal Outcome data collection methods: A = administrative records; C = clinical exam; O = observations; P= physical property measurement; Q = questionnaire/diary; R = voluntary registry Rate Ratio: Rate was calculated from post-intervention rate data when baseline similarity of the groups for the outcome had been established and data were available. Rate ratio less than 1.0 indicates intervention more effective than control. RM ANOVA = repeated measures analysis of variance Sample n = total number of subjects in the intervention and control groups in analysis (estimated from hours in Banco et al. study). Subjects are people unless indicated otherwise. SD = standard deviation
SMD = standardized mean difference. SMD was calculated from post-intervention dichotomous, ordinal or continuous data when baseline similarity of the groups for the outcome had been established (using criterion of p > 0.05) and data were available. “+” indicates training more effective than control; “-“ indicates training less effective than control. In some cases, the direction of the SMD is different than the direction of effect, because the SMD calculation was based on post-intervention data, whereas the direction-of-effect determination may have involved change data. na = data not available either for determining baseline similarity or for calculating SMD. € = SMD not calculated because groups not similar at baseline (using the criterion of a baseline statistical test showing p < 0.05). o = SMD calculated from data presented in a Figure. Statistical significance: As reported by original authors for a between-group test, when available. When not reported, it was calculated by reviewers (indicated by #) when baseline similarity could be established (using criterion of p > 0.05). In all cases, the results are of statistical tests on post-intervention data only, unless indicated otherwise. na = data not available either for determining baseline similarity or for reviewers to determine statistical significance. ns = not statistically significant when alpha = 0.05. € = statistical significance not determined by reviewers because groups not similar at baseline. Time of followup: immediate post-training, short (not immediate but 1 mo.), intermediate (> 1 mo., 6 mos.) or long (>6 mos.).
49
3.3.1 Effect on Knowledge Table 12a summarizes the evidence on the effect of OHS training on worker knowledge compared to a control group with no training. Data were available from seven interventions from five studies. Five interventions were concerned with ergonomics, varying from a low to a high level of engagement and in most cases consisting of one or two training sessions. Most measurements were taken in the immediate- or short-term. All interventions showed positive, statistically significant results, and the calculated effect sizes (SMDs) were large. 3.3.2 Effect on Attitudes & Beliefs Table 12b summarizes research findings on the effect of OHS training on attitudes and beliefs relative to a control with no training. There were only three studies, two of which were concerned with office ergonomics. The training interventions consisted of one or two sessions of low, medium or high level of engagement. Results varied from being small, negative and statistically non-significant, to being large, positive and statistically significant. 3.3.3 Effect on Behaviours Table 12c gives an overview of the effects observed on Behaviours. This category also included behaviourally-influenced hazards and exposures. Ten studies contributed findings on 14 interventions, nine of which addressed ergonomic risks. The majority of these interventions involved high engagement training, but usually for only one or two sessions. Behaviourrelated outcomes were typically measured between one and six months postintervention (i.e. intermediate-term). Most effects were positive, with some being large and statistically significant (see Eklöf studies; Greene et al., 2005; Held et al., 2002; Rizzo et al., 1997; Wright et al., 2002). Others were more modest in size or nonsignificant (Brisson et al., 1999; Held et al., 2002). The results of Rasmussen et al. (2003), although not expressed as an SMD, were also statistically significant and positive. Two studies that measured effectiveness with selfreport measures yielded only small, negative effects (Arnetz and Arnetz, 2000; Jensen et al., 2006), with the first of these being statistically significant. The validity of the Arnetz and Arnetz (2000) finding suffered considerably from several threats to validity, most notably a major drop in study sample size due to reorganization. There was evidence of an impact on the comparability of post-intervention study groups (whereas survey response rates were similar pre-intervention, they were widely different post intervention). The remaining study (Bohr, 2000; 2002) yielded mixed, statistically non-significant effects. 3.3.4 Effect on Health (i.e. injuries, illnesses, symptoms) Ten studies contributed to the findings on health (Table 12d), with six measuring musculoskeletal-related outcomes. Seven studies were concerned 50
Institute for Work & Health
with ergonomic training interventions: four with office ergonomics; two with lifting. The majority of training interventions were high engagement. Most involved one or two training sessions, while there were three sessions in the Held et al. (2002) and Van Poppel et al. (1998) studies. Measurements were mostly taken one to six months post-intervention (i.e. intermediateterm). Only two studies showed statistically significant effects (Bohr, 2000; 2002; Held et al., 2002). The Bohr study showed a decline in self-reported upper extremity symptoms following a single session of low- or high-engagement training in office ergonomics. The Held et al. study showed a decrease in clinically assessed skin symptoms following a three-session, high engagement train-the-trainer intervention. The results of the other eight studies were not statistically significant. These studies showed effects in both the positive and negative direction, which were generally small in size. (The large effect size seen for the supervisor feedback condition in the Eklöf study is attributable to large differences in pre-intervention measures of values for the two groups rather than differences in pre-post changes.) 3.4
Synthesis of the evidence on the effect of training (from training versus no-training studies) Tables 14a-d in this section represent a selection from and further synthesis of the results presented in Tables 12a-d. First, only results from those studies considered Good and Fair in their methodological quality are brought forward to Tables 14a-d, in keeping with the Guide to Community Preventive Services evidence synthesis method (see section 2.6). Second, in order to avoid over-representing studies with many reported outcomes, conceptually similar outcomes from the same study are collapsed by reporting only their median. For example, several standardized mean differences (SMDs), each corresponding to a different workstation hazard, are reported in Table 12c for the workers of ≥ 40 years of age in the Brisson et al. (1999) study. In Table 14c, only the median of these SMDs, +0.28, is reported. These steps yield the four bodies of evidence presented in Tables 14a-d. Each body of evidence is then characterized in four ways:
methodological quality of studies quantity of Fair and Good studies consistency of effects median effect size
These characteristics lead to a summary assessment about the quality of the body of evidence, through the application of the algorithm shown in Table 13. A systematic review of the effectiveness of training & education for the protection of workers
51
Table 13: Algorithm applied to training versus control evidence to determine its strength
Level of Evidence
Methodological Quality
Minimum Quantity
Strong
Good (limitations score = 0-1)
≥2 studies
Sufficient
Insufficient
Consistency of Effects
Interquartile range (range) of effect sizes does not include zero Good or Fair ≥5 Interquartile (limitations score studies range (range) = 0-4) of SMDs does not include zero Meet execution, quantity and consistency criteria for Sufficient but not Strong evidence Good (limitations score = 0-1)
1 study
Good or Fair (limitations score = 0-4)
≥3 studies
Interquartile range (range) of SMDs does not include zero Interquartile range (range) of SMDs does not include zero
Minimum Median Effect Size (Median SMD) Sufficient SMD: Knowledge = 1.0 Attitudes & Beliefs = 0.5 Behaviours = 0.4 Health = 0.15
Sufficient SMD: Knowledge = 1.0 Attitudes & Beliefs = 0.5 Behaviours = 0.4 Health = 0.15
Large SMD: Knowledge = 1.5 Attitudes & Beliefs = 1.0 Behaviours = 0.8 Health = 0.3
Sufficient SMD: Knowledge = 1.0 Attitudes & Beliefs = 0.5 Behaviours = 0.4 Health = 0.15
Sufficient SMD: Knowledge = 1.0 Attitudes & Beliefs = 0.5 Behaviours = 0.4 Health = 0.15
The above criteria not met
SMD = standardized mean difference
3.4.1 Evidence synthesis of the effect on Knowledge Two of the five studies reported in Table 12a were considered to have Good/Fair methodological quality and these are summarized below in Table 14a. The median SMD of the two studies (+2.52) far exceeds the criterion of Sufficient (+1.0) or Large (+1.5), and the range of SMDs does not include zero. However, since there are only two studies and they are both of fair quality, application of the evidence synthesis algorithm leads to the following conclusion: there is insufficient evidence of the effectiveness of training on Knowledge.
52
Institute for Work & Health
Table 14a: Evidence synthesis of the effect on Knowledge (training vs control)
1st author; intervention (level of engagement; number of training sessions; hazard type) Greene; multi-component office ergonomics (H;2;E) Harrington 2004; computer-based office ergonomics (L;1;E) Number of studies = 2
Methodol. SMD or Median Quality SMDo Fair
+1.45
Fair
+3.58o
2 Fair 0 Good
Median = +2.52 Range = +1.45 to +3.58
o
Median SMD used in cases where multiple SMDs of conceptually similar outcomes have been collapsed. These cases are indicated by symbol (o). Positive SMD indicates that training intervention was effective.
3.4.2 Evidence synthesis of the effect on Attitudes & Beliefs Only one study (Greene et al., 2005) was considered to be of Fair or Good methodological quality, and it yielded two effect size estimates for Table 14b. The median SMD (+0.84) exceeded the criterion for Sufficient and the range did not include negative values. However, since this single study was of only Fair methodological quality, there is insufficient evidence of the effectiveness of training on Attitudues & Beliefs. Table 14b: Evidence synthesis of the effect on Attitudes & Beliefs (training vs control)
1st author; intervention (level of engagement; number of training sessions; hazard type); outcome Greene; multi-component office ergonomics (H;2;E); self-efficacy Greene; multi-component office ergonomics (H;2;E); outcome expectations Number of studies = 1 o
Methodol. Quality
SMDo
Fair
+0.82
Fair
+0.87
1 Fair
Median = +0.84 Range = +0.82 to +0.87
Positive SMD indicates that training intervention was effective.
3.4.3 Synthesis of the evidence of the effect on Behaviours Six studies were rated as being of Fair/Good methodological quality and were carried forward to Table 14c. Five of these studies provide 13 SMDs for determining the interquartile range (+0.33 to +1.35) and median effect size (+1.09). As such, there is strong evidence for the effectiveness of training on Behaviours.
A systematic review of the effectiveness of training & education for the protection of workers
53
Table 14c: Evidence synthesis of the effect on Behaviours (training vs control)
1st author; intervention (level of engagement; number of training sessions; hazard type); outcome Brisson; multi-component office ergonomics < 40 yrs (H;2;E); postural behaviours Brisson; multi-component office ergonomics < 40 yrs (H;2;E); workstation hazards Brisson; multi-component office ergonomics ≥ 40 yrs (H;2;E); postural behaviours Brisson; multi-component office ergonomics ≥ 40 yrs (H;2;E); workstation hazards Eklöf; multi-component office ergonomics, individual feedback (H;1;E); % ergonomic modifications Eklöf; multi-component office ergonomics, individual feedback (H;1;E); avg. no. ergonomic modifications Eklöf; multi-component office ergonomics, supervisor feedback (H;1;E); % ergonomic modifications Eklöf; multi-component office ergonomics, supervisor feedback (H;1;E); avg. no. ergonomic modifications Eklöf; multi-component office ergonomics, group feedback (H;1;E); % ergonomic modifications Eklöf; multi-component office ergonomics, group feedback (H;1;E); avg. no. ergonomic modifications Greene; multi-component office ergonomics (H;2;E); postural exposures Held; multi-component (H;3;C); wet work behaviours Rasmuussen; multi-component (H;2;S); farm safety behaviours Wright; computer-based (M;1;B); universal precautions behaviours Number of studies = 6
o
Method. SMD or Quality Median SMDo Fair +0.30o Fair
+0.33o
Fair
+0.18o
Fair
+0.28 o
Fair
+1.09o
Fair
+0.95
Fair
+1.71
Fair
+1.35
Fair
+1.98
Fair
+2.36
Fair
+1.16
Good Good
+0.42o Not available
Fair
+1.25
2 Good 4 Fair
Median =+1.09 Interquartile range = +0.33 to +1.35
Median SMD in cases where multiple SMDs of conceptually similar outcomes have been collapsed. These cases are indicated by symbol (o). Positive value indicates that training intervention was effective. na = not available # SMD not calculable because standard deviations were not available, but the post-intervention means indicate that the effect would be positive. Not included in determinations of the median or interquartile range.
54
Institute for Work & Health
3.4.4
Evidence synthesis of the effect on Health (i.e. injuries, symptoms) Five studies were of Fair/Good methodological quality, allowing their inclusion in the evidence synthesis. Two studies had effect sizes expressed in rate ratios, but transformations to corresponding SMDs were made (described in Methods), and these were pooled with the other six SMDs. The resulting median SMD is -0.04 and the interquartile range is -0.25 to +0.06. Since the latter encompasses both positive and negative numbers, an inconsistency among the observed effects is indicated. There is insufficient evidence for the effectiveness of training on Health (i.e. injuries, symptoms). A close look at Table 14d indicates that the inconsistency in effects arises from a mixture of small, positive effects and of negative effects. There are no medium or large positive effects.
A systematic review of the effectiveness of training & education for the protection of workers
55
Table 14d: Evidence synthesis of the effect on Health (training vs control)
1st author; intervention (level of engagement; number of training sessions; hazard type); health outcome Banco; training (H;1;S); cutting injury rate Eklöf; multi-component office ergonomics, individual feedback (H;1;E); MSK or eye symptom prevalence Eklöf; multi-component office ergonomics, supervisor feedback; (H;1;E) MSK or eye symptom prevalence Eklöf; multi-component office ergonomics, group feedback (H;1;E); MSK or eye symptom prevalence Greene; multi-component office ergonomics (H;2;E); upper extremity MSK symptoms Greene; multi-component office ergonomics (H;2;E); upper spine MSK symptoms Held (H;3;C); multi-component; skin symptom severity Rasmussen (H;2;S); multi-component; farm-related injury rate Number of studies = 5
o
Method. SMD or Quality Median SMDo Fair +0.06
Rate Ratio# 0.90
Fair
-0.13
Fair
-1.34
Fair
-0.37
Fair
-0.12o
Fair
+0.27o
Good
+0.05
Good
+0.06
0.91
2 Good 3 Fair
Median = -0.04 Interquartile Range = -0.25 to +0.06
Median = 0.90 Range = 0.90 to 0.91
Median SMD in cases where multiple SMDs of conceptually similar outcomes have been collapsed. These cases are indicated by symbol (o). A positive value indicates that the training intervention was effective. For Banco et al. and Rasmussen et al. studies, SMDs were approximated as described in the Methods section. # Rate ratio less than 1 indicates training intervention was effective. MSK = musculoskeletal
3.5
Relative effectiveness of training with different levels of engagement This section presents results from studies comparing two training interventions with different levels of employee engagement. These results address the second research question: “Does higher engagement OHS training have a greater beneficial effect on workers and firms than lower engagement OHS training?”
56
Institute for Work & Health
The findings on all categories of outcomes (Knowledge, Attitudes & Beliefs, Behaviours, Health) have been aggregated in Table 15 because of the sparseness of evidence. Seven studies with 15 different interventions contribute evidence to this table. All interventions consist of one or two training sessions, with the exception of a seven-session intervention studied in Löffler et al. (2006). Three studies with positive, statistically significant effects are seen: i) the effect on the intention to use hearing protection devices in a comparison of computer instruction with tailored feedback to a commercial video (Hong et al., 2006); ii) the effect on knowledge and personal protective equipment for pesticide use (Perry and Layde, 2003); and iii) the effect on dermatitis in a comparison of a seven-session multi-component intervention to a single informational paper (Löffler et al., 2006). The remaining studies show findings that are not statistically significant, with the direction of effects in each study being either positive (Duffy and Hazlett, 2004; Harrington and Walker, 2002) or mixed (Bohr, 2000; 2002; Lusk et al., 2003; 2004). The largest calculated SMD in the table was also observed on dermatitis in the Löffler study (+0.60). Next largest were those calculated for Knowledge (+0.41) and Attitudes & Beliefs (+0.56) measures in the Harrington and Walker (2002) study, in which interactive computer-based instruction on fire safety was compared to a lecture and printed materials. The remaining SMDs in Table 15 are small and positive.
A systematic review of the effectiveness of training & education for the protection of workers
57
Table 15: Relative effectiveness of differing levels of engagement on outcomes [refer to key at end of table for abbreviations and explanations] Interventions (number of training sessions; hazard type)
Limitations
Sample n
Time of followup
Outcome(s)
Bohr (2000; 2002)
H) Participatory education (hands-on demo, problem solving, application to work area) (1;E) L) Traditional education (lecture, informational handout, Q&A session) (1;E) M) Direct voice care training (vocalization, posture, respiration, release of tension in vocal apparatus, resonance, and voice projection) (2;E) L) Indirect voice care training (information on voice production, factors associated with healthy voice) (1;E) M) Computer-based instruction on fire safety; screens contained narration, interaction, animation or video; some with questions and interactive games (2;S) L) Lectures & printed materials (2;S)
6
101
Long
i) Workstation hazards (O) ii) Postural behaviours (O) iii) UE MSK symptoms (Q)
6
32
Interm
5
45
Immed
58
Authors
Duffy & Hazlett (2004)
Institute for Work & Health
Harrington & Walker (2002)
Results, as reported in original publication Direction of Statistical significance effect (between group) H vs L: H vs L: i) –# RM ANOVA: ii) –# i) ns iii) +# ii) ns iii) ns
SMD, calculated by reviewers
Voice quality (Dysphonia Severity Index) (P)
M vs L: +
M, L, control: RM ANOVA: p = 0.18
M vs L: +0.26 o
Fire safety outcomes (Q): i) knowledge on hazards ii) knowledge on safety behaviours iii) attitudes on hazards iv) attitudes on safety behaviours
M vs L: i) +# ii) +# iii) +# iv) +#
M vs L: i) p = ns ii) p = ns
M vs L: i) +0.41 ii) +0.26 iii) +0.56 iv) +0.21
M, L, control: ANCOVA: iii) p = ns iv) p = ns
H vs L: i) na ii) na iii) na
A systematic review of the effectiveness of training & education programs for the protection of workers 59
Authors
Interventions (number of training sessions; hazard type)
Limitations
Sample n
Time of followup
Outcome(s)
Hong et al. (2006)
H) Computer w/ tailored feedback incl. hearing test result; HPD practice (1;P) M) Commercial video w/ hearing test result (1;P) M) Lecture, problemsolving and practice regarding skin care (7;C) L) Informational paper on skin care (1;C) H1) Tailored: Computer-based training tailored to worker’s self-reported practice. Used factual, cognitive approaches, demonstration, directed practice, vicarious experience, persuasion and role-modeling techniques. Presented in interactive format, with feedback (1:P) H2) Non-tailored: As above, but delivered to all participants in a uniform manner (1;P) L) Video (1;P)
i) 2 ii) 3
403
i) Immed ii) Long
i) Intention to use HPDs (Q) ii) Use of HPDs (Q)
3
325
Long
Dermatitis (C)
4
879
Long
Use of hearing protection (Q)
Löffler et al. (2006)
Lusk et al. (2003, 2004)
Results, as reported in original publication Direction of Statistical significance effect (between group) i) + H vs M: ii) + RM ANOVA: i) p = 0.001 ii) ns
SMD, calculated by reviewers
+
M vs L: +0.60
H1 vs L: + H2 vs L: -
M vs L: Multiple logistic regression: p = 0.0001 RM ANOVA: H1 vs L: p = 0.49 H2 vs L: p = 0.18
H vs M: i) +0.12 ii) +0.03
H1 vs L: € H2 vs L: +0.02
60
Authors
Interventions (number of training sessions; hazard type)
Limitations
Sample n
Time of followup
Outcome(s)
Perry & Layde (2003)
H) Education intervention (lecture, slides, presentation by respected area farmer, demonstration and opportunity for handson practice) (1;C) L) Standard recertification meeting for pesticide applicators (1;C)
i) 2 ii) 1 iii) 1 iv) 1
385
Interm
i) Safety knowledge (Q) ii) PPE use other than gloves (Q) iii) Full PPE compliance (Q) iv) Dermal exposure (Q)
Results, as reported in original publication Direction of Statistical significance effect (between group) H vs L: H vs L: i) + i) p < 0.05 ii) + ii) p < 0.05 iii) + iii) ns iv) + iv) ns
SMD, calculated by reviewers H vs L: i) na ii) +0.23 iii) +0.05 iv) +0.08
Institute for Work & Health
A systematic review of the effectiveness of training & education programs for the protection of workers
Direction of effect: “+” indicates the higher level of engagement training was more effective than lower, as reported by the original authors for between-group results, when available. When not reported, the determination was made by the reviewers (indicated by #), guided by the authors’ approach to analysis. na = data not available for reviewers to determine direction of effect. Hazard type: B, biological; C, chemical; E, ergonomic; P, physical; S, safety HPD = hearing protection device Intervention: more details on interventions in Table 6. Level of engagement is low (L), medium (M) or high (H). Limitations = methodological limitations score as described in Methods, ranging from 0 limitations to 8. MSK= musculoskeletal Outcome data collection methods: A = administrative records; C = clinical exam; O = observations; P = physical property measurement; Q = questionnaire/diary; R = voluntary registry RM ANOVA = repeated measures analysis of variance Sample n = total number of subjects in the intervention and control groups in analysis (estimated from hours in Banco et al. study). Subjects are people unless indicated otherwise. SD = standard deviation
SMD = standardized mean difference. SMD was calculated from postintervention dichotomous, ordinal or continuous data when baseline similarity of the groups for the outcome had been established and data were available. “+” indicates training with the higher level of engagement was more effective than low. In some cases, the direction of the SMD is different than the direction of effect, because the SMD calculation was based on post-intervention data, whereas the direction-of-effect determination may have involved change data. na = data not available either for determining baseline similarity or for calculating SMD. € = SMD not calculated because groups not similar at baseline. Statistical significance: As reported by original authors for a betweengroup test, when available. When not reported, it was calculated by reviewers (indicated by #) when baseline similarity could be established. In all cases, the results are of statistical tests on post-intervention data only, unless indicated otherwise. na = data not available either for determining baseline similarity or for reviewers to determine statistical significance. ns = not statistically significant when alpha = 0.05. € = statistical significance not determined by reviewers because groups not similar at baseline. Time of followup: immediate post-training, short (not immediate but 1 mo.), intermediate (> 1 mo., 6 mos.) or long (>6 mos.)
61
3.6
Evidence synthesis of the relative effectiveness of high versus low/medium engagement training When synthesizing the evidence on the effectiveness of higher versus lower engagement training, the review team set the effect size criteria to be onequarter as large as those used with the evidence on the effectiveness of training versus no training. This choice of lower effect size thresholds was based on the expectation that there should be a smaller difference between two training interventions, presumed to be effective, as opposed to training versus a no-training control. The algorithm in Table 16 was therefore used when synthesizing the evidence on higher versus lower engagement training.
Table 16: Algorithm applied to higher versus lower engagement training evidence to determine its strength
Level of Evidence
Methodological Quality
Minimum Quantity
Consistency of Effects
Strong
Good (limitations score = 0-1)
≥ 2 studies
Interquartile range (range) of effect sizes does not include zero
Good or Fair (limitations score = 0-4)
≥ 5 studies
Minimum Median Effect Size (Median SMD) Sufficient SMD: Knowledge = 0.25 Attitudes & Beliefs = 0.12 Behaviours = 0.10 Health = 0.04
Interquartile range (range) of SMDs does not include zero
Meet execution, quantity and consistency criteria for Sufficient but not Strong evidence
Sufficient
Insufficient
Good (limitations score = 0-1)
1 study
Good or Fair (limitations score = 0-4)
≥ 3 studies
Sufficient SMD: Knowledge = 0.25 Attitudes & Beliefs = 0.12 Behaviours = 0.10 Health = 0.04
Large SMD: Knowledge = 0.38 Attitudes & Beliefs = 0.25 Behaviours = 0.20 Health = 0.08
Interquartile range (range) of SMDs does not include zero
Sufficient SMD:
Interquartile range (range) of SMDs does not include zero
Sufficient SMD:
Knowledge = 0.25 Attitudes & Beliefs = 0.12 Behaviours = 0.10 Health = 0.04 Knowledge = 0.25 Attitudes & Beliefs = 0.12 Behaviours = 0.10 Health = 0.04
The above criteria not met
SMD = standardized mean difference
62
Institute for Work & Health
3.6.1
Evidence synthesis of engagement level effects on Knowledge, Attitudes & Beliefs or Health Of the seven studies in Table 15, only four were rated as having Fair/Good methodological quality. Among these, there are only single effects of a Fair methodological quality for each of the following: Knowledge (Perry & Layde, 2003) Attitudes & Beliefs (SMD = +0.12) (Hong et al., 2006) Health (SMD = +0.60) (Löffler et al., 2006) As such, there is insufficient evidence that high engagement training is more effective than medium/low engagement training on Knowledge, Attitudes & Beliefs or Health. 3.6.2 Evidence synthesis of engagement level effects on Behaviours There were a sufficient number of Fair/Good studies available to examine the consistency and size of effects on behaviours (Table 17). The Hong et al. (2006) and Lusk et al. (2003; 2004) studies involved single sessions, less than one hour in length, of hearing protection training, with outcomes measured one year post-intervention. The Perry & Layde study (2003) involved a day-long single-session of training in safe pesticide use to dairy farmers, with outcomes measured in the intermediate-term. Effects are quite consistently small, and the median is below the criterion of 0.1 set for sufficient effect size for Behaviours. This leads to the following summary statement: There is insufficient evidence that a single session of high engagement training has a greater effect than a single session of low or medium engagement training on health and safety behaviours. Table 17: Evidence synthesis of engagement level effects on Behaviours (training vs control)
1st author; high vs low/medium interventions (H vs L/M; number of training sessions; hazard type); outcome Hong; computer w/ feedback & practice vs video w/ feedback (H vs M;1;P); use of HPDs Lusk; computer w/ feedback & practice vs video (H vs L;1;P); use of HPDs Perry; lecture, demo & practice vs lecture (H vs L;1;C); PPE use Perry; lecture, demo & practice vs lecture (H vs L;1;C); dermal exposure 3 studies o
Methodol. SMD or Median SMDo quality Fair
+0.03
Fair
+0.02
Good
+0.14o
Good
+0.08
1 Good 2 Fair
Median: + 0.06 Range: +0.02 to +0.08
Median SMD in cases where multiple SMDs of conceptually similar outcomes have been collapsed. These cases are indicated by symbol. Positive values indicate that high engagement intervention was more effective than low/medium. FB = feedback HPD = hearing protection device na = not available
A systematic review of the effectiveness of training & education for the protection of workers
63
64
Institute for Work & Health
4.0
Discussion
4.1 Principal findings This review found a lack of high quality randomized trials in the area of OHS training effectiveness. Twenty-two randomized trials were identified through the search and relevance screening. Of these, 14 were considered of sufficient methodological quality to proceed to final evidence syntheses. The quality of the studies would have been higher if study researchers had conducted additional analyses of the similarity of groups at baseline and after withdrawals, and if they had more thoroughly reported various aspects of the studies, including randomization procedures, intervention implementation methods, and the occurrence of extraneous events. The trials comprised a wide range of study populations, interventions and outcomes. The modest number of trials available, plus their heterogeneity, limited the ability of the review to draw more definitive conclusions. This was particularly the case for the effect of training (versus control) on Knowledge, and on Attitudes & Beliefs (see Table 18), and on the relative effect of higher versus lower engagement training on each of Knowledge, Attitudes & Beliefs and Health (see Table 19). Table 18: Summary of evidence syntheses for training versus control studies*
Status of body of evidence relative to evidence synthesis criteria Number of Fair/Good studies
Consistency
Median effect size
Strength of evidence
Knowledge (Table 14a)
Too few (2)
Yes
Large (+2.52)
Insufficient
Attitudes (Table 14b)
Too few (1)
n/a
Sufficient (+0.84)
Insufficient
Behaviours (Table 14c)
Enough (6)
Yes
Large (+1.09)
Strong
Health (Table 14d)
Enough (5)
No
Insufficient (-0.04)
Insufficient
Body of evidence
* Table 18 summarizes the information presented in Tables 14a-d. Underlining indicates where the body of evidence did not meet evidence synthesis criterion for Sufficient. n/a = not applicable.
In contrast, there were sufficient higher quality studies to meaningfully examine the size and consistency of training’s effects on OHS Behaviours and on Health. With regard to Behaviours, the review found strong evidence of training’s effectiveness. The conclusion was based on six A systematic review of the effectiveness of training & education for the protection of workers
65
studies, three of which involved training directed at ergonomic hazards and three of which involved training directed at other types of hazards. Most involved one or two training sessions. The median effect size in the body of evidence was considered large by the review team: standardized mean difference (SMD) = +1.09. There were also enough higher quality studies to meaningfully examine the size and consistency of the effects of OHS training on category of Health. Interventions involved one to three sessions and were directed at a variety of OHS hazards. The data in this review show inconsistent and small effects of OHS training on Health. Therefore, the review team considered the evidence insufficient to conclude whether OHS training has or does not have an effect on Health. Though a lack of studies prevented a meaningful examination of the size of training’s effects on Knowledge and Attitudes & Beliefs, the review’s preliminary findings on Knowledge and Attitudes & Beliefs are consistent with the evidence on Behaviours. The respective effects observed on Knowledge and Attitudes & Beliefs in the higher quality studies are positive and sizeable: median SMDs equal to +2.52 and + 0.84, respectively. This is expected, since knowledge, attitudes and beliefs mediate the effect of training on behaviours. Table 19: Summary of evidence syntheses for higher versus lower engagement studies
Status of body of evidence relative to evidence synthesis criteria
Body of evidence
Strength of evidence
Number of Fair/Good studies
Consistency
Median effect size
Knowledge
Too few (1)
n/a
Not available
Insufficient
Attitudes
Too few (1)
n/a
Sufficient (+0.12)
Insufficient
Behaviours (Table 17)
Enough (3)
Yes
Insufficient (+0.06)
Insufficient
Health
Too few (1)
n/a
Large (+0.60)
Insufficient
* Table 19 summarizes the information presented in section 3.6. Underlining indicates where the body of evidence did not meet evidence synthesis criterion for Sufficient. n/a = not applicable.
66
Institute for Work & Health
Current learning theory suggests that high engagement training, which involves an application of knowledge and skills in a work-like setting, will have a greater impact on workers than low or medium engagement training. There was a sufficient number of higher quality studies examining this contrast with behaviour as an outcome; effects were consistent, but very small. The review team concluded there is insufficient evidence of high engagement training (single session) having a greater impact on OHSrelated behaviors compared to low/medium engagement training (single session). These results should not be generalized to training involving a large number of training sessions. 4.1.1 Additional findings Robustness of findings to methodological decisions in evidence synthesis: The review team explored the robustness of the findings by allowing Limited studies to be analyzed in addition to Fair or Good studies. For the training versus control studies and for each of the outcomes of Knowledge and Attitudes & Beliefs, the size and consistency of effects remained consistent with evidence being sufficient. However, because the number of studies increased, the strength of the evidence increased to Strong for Knowledge and Sufficient for Attitudes & Beliefs. The review’s finding of Strong evidence for Behaviours was not affected by the inclusion of Limited studies. The review’s finding of insufficient evidence for Health was also not affected: the median effect remained close to zero and the interquartile range contained zero. Another sensitivity analysis explored the effect of allowing each study to contribute only one effect size to the evidence synthesis for a given body of evidence. In contrast, in the review’s main analysis, conceptually similar effect sizes were collapsed; however those corresponding to conceptually distinct outcomes and to separate intervention arms each contributed to the synthesis. For example, the main analysis of health outcomes included three effect sizes from the study by Eklöf and colleagues (see Table 14d), whereas the sensitivity analysis included the median of these three effect sizes instead. The effect of this further data reduction step was explored for the evidence syntheses concerned with Behaviours (Table 14c) and Health (Table 14d) in the training versus control studies. It was found to have no effect. Finally, the effect of correcting for small sample size bias (42) in the standardized mean difference metric was examined. It was found to have only a trivial impact on the results and no impact on the conclusions, since sample sizes were in most cases greater than 20. Exploration of the heterogeneity in health outcome results: An inconsistency in direction and size of effects among a group of related studies suggests heterogeneity in the study populations, interventions, measurement methods or study designs. The health outcome data in Table A systematic review of the effectiveness of training & education for the protection of workers
67
14d were considered in light of this. Heterogeneity arising from study design was excluded as an issue since all studies were randomized controlled trials. The training methods in the studies did not vary greatly: all were high engagement, multi-component, and one to three sessions. There is, however, variation in the type of hazard addressed by the training and, accordingly, the type of outcome measured. This variation corresponded to differences in the results. All the negative SMDs in Table 14d were derived from the two ergonomic studies involving self-reported musculoskeletal symptoms, whereas the three studies that addressed safety or chemical hazards had a positive SMD. When Limited studies were considered in addition to the Good/Fair studies, the same pattern held true: all the negative SMDs were from studies of ergonomic training. In order to see whether this pattern was generalizable, the team re-examined the published results of the Burke et al. meta-analysis (7). While the same pattern was not found, there was evidence that also suggests ergonomic training should be separated from other types of OHS training when examining health outcomes in reviews of this type. Burke et al. (7) reported effects on a study-by-study basis, and an occupational hazard category could be assigned to each effect by reading the title of the corresponding journal article cited. Only two references could not be categorized in this way, so 29 SMDs for health outcomes could be associated with a category of occupational hazard. There were only three negative effects: one was from an ergonomic study; the other two from a safety study. Unlike the present review, the Burke et al. (7) results did not suggest that ergonomic training studies were likely to produce negative results. It was therefore determined if they were likely to produce smaller effects than studies of non-ergonomic OHS training. The SMDs in Burke et al. (7) were therefore rank ordered and divided at the midpoint into two equal-sized groups. The prevalence of ergonomic training in the group of larger SMDs (which ranged from 0.43 to 1.39) was 2/14 (14%), whereas it was 8/14 (57%) in the group of smaller SMDs (which ranged from -0.27 to 0.37). A chi-square test yields a probability of 0.02 that these differences occurred by chance. In contrast, the behavioural data in Tables 12c or 14c do not suggest differing effects of ergonomic and non-ergonomic interventions. An analysis of the behavioural outcome data in Burke et al. (7), in the manner described above for the health outcome data, concurs: the prevalence of ergonomic training among the largest SMDs (7/27) was not much different from that among the smallest SMDs (4/27). A chi-square test yields a probability of 0.31. The data in this review and the Burke et al. study (7) therefore suggest that in future reviews and where the numbers of studies allow, the health effects of training directed toward ergonomic risks should be analyzed separately from those of training directed toward other OHS risks.
68
Institute for Work & Health
Single study suggests number of training sessions is important: The Löffler et al. (2006) study (shown in Table 15), which contrasted medium and low level engagement training, showed an unusually large effect of training on health (SMD = +0.60). The observed effect was even greater than any health outcome in the training versus control studies (see Table 12d). The different number of training sessions might help to explain this result. Whereas the Löffler et al. study involved seven sessions, the others involved from one to three. Another factor might have played a role too: the workers in the Löffler et al. study were nursing students, which might have meant there was more potential for change. Nevertheless, the study points to the potential value of future research that intentionally manipulates the number of training sessions to look at its effect. No study in this review involved such a manipulation. The effect of other training factors: Single studies examined a variety of other training-related factors:
Tailoring interventions to the individual versus non-tailoring (Lusk et al., 2004; 2005) Brief informational boosters (Lusk et al., 2004) Organizational level of training using feedback (individual versus supervisor versus group) (Eklöf et al., 2004; Eklöf & Hagberg, 2006) Self-directed computer instruction versus instructor-led instruction (Rizzo et al., 1997) Brief instruction on only hepatitis B vaccination versus low engagement instruction with more complete instruction on the prevention of blood-borne pathogens (Wang et al., 2003)
As these factors did not address the research questions, they were not explored further. The effect of factors related to the individual: Only Brisson et al. (1999) reported on factors related to the individual. They investigated a number of potential effect modifiers of the relationship between training and outcomes: age, number of hours of video display unit (VDU) use per week, seniority in the current job, job strain status, leisure-time physical activity, smoking and body mass index. Age was the only statistically significant effect modifier, with greater changes in appropriate workstation use, posture and MSK symptoms reported for those in the under-40 age group, compared with those in the 40-plus age group. Cost-effectiveness or cost-benefit evidence: Only one study (Banco et al., 1997) reported on the costs of two intervention alternatives (training only versus new equipment plus training) relative to a no-intervention control case in a retail store chain. It also calculated savings in workers’ compensation and lost time by comparing intervention stores’ results to those of control stores. Their simple evaluation showed that training on the A systematic review of the effectiveness of training & education for the protection of workers
69
old equipment could result in a net cost savings of $106 per store. On the other hand, replacing the old equipment with new equipment and implementing training on the new ones yielded greater net cost savings ($245 per store). 4.2 Strengths and limitations of the systematic review Strengths: One of the strengths of the review is that the review team members had a broad range of skills and expertise that added to the internal validity of the review. Content experts from the U.S.’s NIOSH joined with IWH researchers from Canada who have expertise in systematic review methods. Another strength of this review, as compared to traditional narrative reviews, is that the search, quality assessment, data extraction and evidence synthesis procedures were explicit and are reproducible. This helps to guarantee that the review can be replicated, that it is relatively objective in its appraisal of included studies, and that the methodological quality of those studies is considered in the interpretation of the findings. Our method of randomly pairing reviewers at each phase, and requiring their independent assessment and then consensus for decision-making, was a strength in that it minimized bias. Although this review was restricted to the peer-reviewed literature, it drew from ten databases, covering a range of disciplines including education, occupational health and safety, biomedicine, psychology, agriculture, social sciences and toxicology. We also contacted content experts to request potentially relevant published articles or articles that were in press, to ensure that we reviewed as much relevant literature as possible. The search strategy, which captured articles up to 2007, drew upon the Cohen and Colligan (4) review but was broader than their search or the one by Burke et al. (7) from 2003. The review included only randomized controlled trials, which helped ensure that high quality evidence was used. This type of study design minimizes confounding by other various factors that could affect training outcomes besides the intervention. In summary, the review team is confident that the search was, within the parameters set by the review questions and the included sources, both systematic and comprehensive, and that it is unlikely that there are other items in the peer-reviewed, published literature that would dramatically alter our conclusions. Limitations: A limitation is that the data were relatively sparse, as only randomized controlled trials were included. In addition, the time period was restricted to 1996 to 2007, because the review was an update of the Cohen and Colligan (4) review. Third, the relevance criteria specified that studies 70
Institute for Work & Health
needed to have both pre- and post-intervention outcome data. The purpose of this restriction was to allow an assessment of the equivalency at baseline of study groups with respect to OHS outcome, and thus a determination of whether computed effect sizes should contribute to the body of evidence (see section 2.5.5). However, in the case of studies with large sample sizes, this may have been unduly restrictive. The review was limited to the peer-reviewed literature; it is possible that a broader search of the grey literature, dissertations and conference materials might have yielded further relevant information. The Institute has received a grant to investigate how much the grey literature can add to a review, which will give us a better sense of the influence of this decision in future reviews. The review was limited to articles written in French and English. Articles in other languages were excluded before their relevance could be assessed. It is possible that these articles would have provided relevant evidence. No adjustments were made to the standardized mean difference metric. The most commonly used adjustment, which corrects for small sample bias, was examined in a sensitivity analysis (see section 4.1.1). The adjustment was found to have no impact on the conclusions. Other adjustments, such as correcting for unreliability in the dependent variable, are conducted less commonly because they rely on information not available to the researcher. The evidence synthesis pooled together a variety of populations, interventions and outcome measures. Not all researchers in systematic reviews would agree with such pooling. However, given the sparseness of the available data, this research team thought this pooling was necessary. Unfortunately, this sparseness of data prevented any conclusive exploration of relationships between study characteristics and intervention effect. Please refer to section 2.6 in the methods for details of our evidence synthesis approach 4.3 Relation of findings to the research literature In many ways, the findings of this review parallel the findings of the original Cohen and Colligan training research review (4) published by NIOSH in 1998. While they found both direct and indirect indications of positive training effects, especially with regard to gains in knowledge and skill, they also noted considerable deficiencies in the research designs in the 80 interventions they reviewed. Lack of randomization, inappropriate or missing comparison groups, and various other confounders made it difficult to make definitive conclusions about the impact of training on workplace health and safety. They listed many factors that could potentially influence the learning process and desired OHS post-training results. These authors proposed that training factors needed to be addressed in future research through systematic and thorough investigations employing strong research designs. Our review suggests that this goal has not yet been achieved. A systematic review of the effectiveness of training & education for the protection of workers
71
This review covers a subset of newer studies, published from 1996-2007. Our goal was to examine studies with the most rigorous study designs – specifically, randomized controlled trials – in order to make definitive statements on the effectiveness of various training factors. That remains a difficult task, since only 22 studies met this design criterion. Randomized, controlled trials continue to be a very small subset of reported training interventions. Within that subset, few studies adequately addressed all concerns established by our review team with regard to validity and reliability of the results. Nevertheless, our assessment of these studies provides some additional evidence supporting the Cohen and Colligan (4) assertion that workplace training programs can successfully influence behaviour change. The evidence from our analysis is not sufficient to show that training has an impact on worker health. Knowledge: In the literature, reports on the effects of training on knowledge gain have been common. Our review of more recent randomized controlled trials (RCTs) continued to find effects on knowledge that were consistently positive, statistically significant and large. This is in line with the relatively large effect sizes observed by Burke et al (7) in their 2006 review of training which considered both RCTs and quasi-experimental studies. They determined that for knowledge gain, the mean SMD determined for low, medium and high engagement training in between-subjects studies was 0.58, 0.66 and 1.27, respectively. Each estimate was based on five to seven studies and they were concerned with a variety of OHS hazards. Our report cannot issue a stronger statement with regard to knowledge gain because only two studies of Fair or Good quality were available for our synthesis. Our evidence also follows the trend reported in a 2003 meta-analysis of organizational training (not OHS) conducted by Arthur et al. (47) These authors used Kirkpatrick’s evaluation criteria (40) of reaction to training (satisfaction with training), learning (gains in knowledge and skill), behavioural (changes in behaviour after training) and results (organizational changes after training) as outcomes associated with training success. The largest effect they found for training was for learning criteria (knowledge and skill gain). They did not restrict their data to RCTs, but required that “a study must have investigated the effectiveness of an organizational training program or conducted an empirical evaluation of an organizational training method or approach.” To be included, studies also had to report sample sizes and must have involved more than a single group pre-post test design. Taylor et al. (48) conducted a meta-analysis of behaviour modelling training (BMT), a specific training approach that is based on Bandura’s Social Modeling Theory. BMT stresses clearly defining and illustrating desired behaviours for trainees, facilitating both symbolic (mental) and physical rehearsal of the new behaviours, and engaging trainees in substantial practice. They examined 117 studies in which overall effects were largest for learning outcomes (knowledge and skill gain), specifically declarative 72
Institute for Work & Health
knowledge and procedural knowledge/skill. Behavioural effects were smaller, and organizational results after training even smaller. Of interest to this review was the finding that training effects on skills and job behaviour remained relatively stable while knowledge declined over time. These declines were reported at rates consistent with prior research on skill decay and retention (49). These authors note however that there were only a small number of studies that measured these outcomes over time, and typically those studies compared an immediate post-test to one delivered anywhere from 0-12 months later. Attitudes & Beliefs: It is also generally believed that training can have beneficial effects on attitudes and beliefs, and that this will in turn motivate healthier behaviours. Our review was unable to confirm this because only one study of Fair or Good quality included this outcome. Burke et al (7) did not look at this outcome. Taylor et al. (48) reported only modest effects of BMT on attitudes with a wide variety of study designs. However, posttraining attitudes may be a more important factor than originally considered, based on a recent study by Alvarez et al (50). In that study, post-training attitudes were found to correlate with cognitive learning, training performance and transfer performance. Behaviour: Based on six studies of Fair or Good quality, our review indicates strong evidence for effects of training on behaviour. The median effect size based on five studies was large (SMD = +1.09). This is somewhat larger than the mean SMDs reported in Burke et al. (7), which ranged from 0.65 to 0.74 in between-subject studies. Our results are encouraging in that a primary purpose for workplace training is to impart new skills/behaviours that are transferred into the workplace. Translating training into changes in worksite behaviour depends on an interplay of extremely complex factors such as trainee characteristics, characteristics of the work environment (including management commitment and peer support), as well as aspects of the training itself (51). Arthur et al (47) noted that their analyses indicated a substantial decrease in effect sizes from learning/knowledge to post-training behaviour. They suggested that this might be readily explained by variability in post-training environments with regard to social and environmental support for newly learned behaviours. Newly trained skills will not be practiced on-the-job if trainees either have no opportunity to perform, or they experience constraints against performance. Health: In this review, there were 10 studies that reported on the effects of training relative to control conditions on a health-related outcome (e.g. injuries, symptoms). Only five were of fair or good quality. Furthermore, the results of this latter group of studies were mixed with both positive and negative effects and a median effect size close to zero (SMD = -0.04). We
A systematic review of the effectiveness of training & education for the protection of workers
73
conclude that the RCT training literature does not provide sufficient evidence for the effectiveness of training on health outcomes. A recent Cochrane review of ergonomic training related to lifting and handling (52) also did not find any evidence that training in proper lifting techniques, with or without provision of lifting equipment, led to decreases in back pain or disability. These authors included six randomized trials and five cohort studies in their analyses. Neither study type yielded significant results for health outcomes. It did not matter whether the training “employed more intense training methods.” They concluded that there was no evidence to support the effects of training on this health outcome. Their suggested explanation for these findings was that either the training in these studies was inappropriate or inadequate to reduce the risk of back injury, or the training did not sufficiently motivate changes in lifting and handling behaviours needed to prevent injury. Multiple IWH systematic reviews have also indicated that OHS training alone was not sufficient to have an effect on musculoskeletal disorders in office workers (34), health-care workers (53), when only upper extremity musculoskeletal disorders were considered (54) and when all types of injury prevention and loss control programs were considered (55). Several of these reviews did find training was effective in reducing MSDs when combined in a multi-component intervention with changes in the work environment and OHS policies (34; 53; 54; 55). In these reviews the authors suggest that training is an important component of effective multi-component/multi-level OHS intervention strategies. But alone, training may not have the effect on MSD outcomes if the hazards are not changed. Prior reviews have noted the difficulty in assessing health outcomes. In many studies, positive results were often statistically insignificant. The size of effect for health-related outcomes observed by Burke et al. (7) in between-subject studies was small: SMD = +0.04 for moderately engaging training and SMD = +0.25 for highly engaging. Such small effects point to a need to adequately consider statistical power when designing studies with health outcomes. They also underline the value of a meta-analytic approach when health outcomes are involved. Level of engagement: The data in this review were only substantial enough to meaningfully address the effect of level of engagement on behavioural outcomes. (They were too sparse for the other outcomes, resulting in conclusions of insufficient evidence.) It should be noted that the three studies providing evidence on Behaviours involved training comprised of only a single session. Among these studies, the observed effect sizes were too small (median SMD = +0.06) to conclude that high engagement training is more effective than low/medium engagement training. These findings therefore do not support the general findings of Burke et al. (7) regarding the effect of level of engagement. However, it is notable that their results for 74
Institute for Work & Health
behavioural outcomes in between-subjects studies similarly showed that the level of engagement made a very small difference: the mean effect sizes for low, medium and high engagement training were +0.65, +0.74 and +0.72, respectively. We did not find studies that looked at the effect of level of engagement on behaviours when there were multiple training sessions. Thus, additional studies are clearly needed to definitively assess this issue. This review makes a new contribution to the literature by synthesizing the evidence from RCTs that directly examine the effect of level of engagement by comparing groups from the same study receiving training of different levels of engagement. In contrast, the meta-analysis of Burke et al. (7) involved an indirect approach. In their review, the evidence from training versus control group comparisons was separately synthesized for each of low, medium and high engagement training. The mean effect sizes from each set of evidence were then compared. Since the data for each of the three levels of engagement are drawn from different (though overlapping) sets of studies, there is a risk of confounding between level of engagement and some other study feature. Burke et al. noted this when they pointed out that higher engagement training tended to involve more complex tasks. The effect of this confounding would be to reduce the actual effect of the level of engagement. Other possible confounders could be the type of OHS hazard, study population, length of follow-up, and number of training sessions. There is preliminary evidence from this study and a reconsideration of the Burke et al. (7) findings that the type of OHS hazard could be important when examining health outcomes but not behavioural outcomes (see section 4.1.1). 4.4 Meaning of the review for policy-makers and practitioners Policy- and decision-makers in industry, government and labour want assurance that investments in OHS training will provide a return, both in terms of reducing the burden of disease, injury and death, and in saving money. This report shows that investment in OHS training results in positive changes in worker behaviour, which is the link between knowledge and attitudes, and health and safety outcomes. In studies using stringent methodologies, training worked to change worker behaviour. This is useful information because many occupational safety and health standards and regulations require training. If workers exhibit safe behaviours, it is axiomatic that they have the appropriate knowledge and attitudes. However, the fact that the study did not show an effect of training on health outcomes in part was a function of the nature of the available research, and in part an indication that training alone is not sufficient to result in reduced morbidity, mortality or injury.
A systematic review of the effectiveness of training & education for the protection of workers
75
Return on investment: Training is an investment for employers. An organization’s commitment to training is partly related to the returns they expect to receive. Many businesses are concerned with their return on the investment (ROI). Phillips (56) advocates for a return on investment of 25 per cent for training programs, where ROI = (net program benefits/program costs x 100). This review was not able to provide evidence on ROI in relation to OHS training, apart from a single study (Banco et al., 1997), because of a lack of trial research on the subject. In fact, there is a lack of economic evaluations of OHS research involving all types of study designs (57). We note that guidance on these methods is available (58, 59). Type of training methods: The review found that a single session of high engagement training (i.e. involving hands-on practice in a realistic setting) has a greater effect on behaviour than a single session of low/medium engagement training (e.g. video only). However, the difference is so small that there is insufficient evidence to recommend high engagement training. These results should not be generalized to training involving larger numbers of sessions. Furthermore, these findings do not yet preclude investment in higher engagement training, because elsewhere such training has been found to be more effective than lower engagement on health (7). Utility of review findings as benchmarks in training evaluations: Historically, weakness in quality assurance and evaluation of specific training programs has been cited as deficiencies in the field of OHS training (11; 60; 61; 62; 63; 64; 65). In order to assure quality training products and service, the American National Standards Institute (ANSI) Z490.1 voluntary standard, “Criteria for Accepted Practices in Safety, Health, and Environmental Training,” recommends evaluation of training programs to include: demonstrate evidence of achieving training objectives; show gains in trainee knowledge and skills; and exhibit beneficial organizational performance (65). It may be beneficial to use the size of effects found in this review and that of Burke et al. (7) as preliminary benchmarks to evaluate the impacts of specific formal training programs. The findings of such evaluations should be used as part of the quality control and improvement of training programs. Note that improving training quality and effectiveness may require not only changes in the current parameters of the training programs, but also changes such as additional resources and an expansion of the audience for training to include supervisors, foremen and owners. Extent and magnitude of OHS training activities: This review is focused on research on the effectiveness of training. However, when seeking contextual information for writing the report, it became clear that there was a dearth of information on the extent of occupational safety and health training in the United States. Few major compendia on training (for example (1)) describe an estimate of the extent and magnitude of OHS training 76
Institute for Work & Health
activities. Any existing data are 10 to 12 years old. In Canada, Smith and Mustard (66) recently published one of the few studies of the scope and magnitude of training in a representative sample of employers. It is important for policy- and decision-makers to be aware of the extent to which formal OHS training is conducted and where it is conducted, so that sector gaps in training and more specifically in topics are identified and addressed. Non-English speaking workers: This review found no randomized controlled trials involving OHS training for the rapidly growing population of non-English speaking immigrants in the U.S. and Canada. Moreover, according to a recent report (67), literacy in the U.S. workforce is eroding and will continue to do so at least through 2030. According to the U.S. Census projection, 60 per cent of the Hispanic working population is expected to remain foreign-born. In Canada, immigrants are expected to account for almost all net growth in the Canadian labour force by 2011. Questions of the nature, extent and effectiveness of training on these populations need further consideration. Training as a part of an OHS management system: Occupational safety and health training is considered a critical component of OHS management systems (2, 68). Within such systems is the need to define and assess OHS competence for supervisors, employees and contractors, to ensure effective access to participation in training, and ensure the competency of trainees. It also needs to be recognized that training is only one of many important components of an OHS management system. Investment in training research: As illustrated by this review, there were relatively few high quality well-controlled studies of training effectiveness. In part, this is due to the fact that controlled trials of training factors and impact are difficult and time-consuming to conduct. The small number of studies included in this review may also be due to the lack of targeted investment by governments for training research, and the failure of researchers to submit grant applications, or the inability of grant review panels to effectively assess grant applications for training research. Given the positive impact of training and relatively large amounts of funds invested by corporations and organizations, there is a need for more increased high quality training effectiveness research. 4.5 Areas for future research Our analysis suggests that research gaps in the training literature need to be filled with more rigorous studies that assess the impact of specific training factors on outcomes. High quality research designs should include randomized and non-randomized controlled trials with sufficient statistical power. New studies should strive to use experimental and quasiexperimental methods that allow researchers to more reasonably attribute A systematic review of the effectiveness of training & education for the protection of workers
77
cause-and-effect relationships between various training factors and outcomes, so that evidence-based decisions can be made by those who develop and provide training programs. Of particular interest would be:
studies broadening our understanding of the effects of pre-training factors on training success studies that discriminate between various elements related to training itself additional investigations clarifying what is known about factors affecting transfer of training further exploration of the role of national culture in training effectiveness (69) broad efforts to validate comprehensive models such as that proposed by Alvarez et al (50).
Pre-training factors typically involve characteristics that trainees bring to training, such as their attitudes, beliefs, values, abilities and motivational states. More specifically, they include factors such as: motivation to learn and apply new knowledge; cognitive ability and literacy level; feelings of pre-training self-efficacy; personal learning style; beliefs about one’s ability to learn something new; previous experience with the training topic; attitudes, beliefs and expectations about the upcoming training itself; and expectations about training outcomes. Overall in the OHS training literature we reviewed, few studies considered these factors. Research investigating the relationship between such pre-training factors and immediate outcomes such as training performance measures (gains in knowledge and skill) or more distal training outcomes assessing transfer of training would be useful. Outside of the occupational safety and health field, there has been much research on factors associated with the design and delivery of training. Most of this literature is published in the fields of educational psychology, industrial/organizational psychology and human resource management. Within those disciplines, training is developed after a needs assessment has indicated that a problem or deficiency can likely be addressed by training that corrects a lack of knowledge or improves skills among a target population. As Burke et al. (6) have noted already, OHS training practices and future research efforts would benefit from a systematic application and testing of many of the theoretical approaches suggested from those fields. For example, in other fields, various learning theories have been applied to the development of training including: reinforcement theory (51), social learning theory (37; 38), goal theories (70), need theories (71), expectancy theories, information processing theory (15, 72) and most recently, adult learning theory (13; 72; 73).
78
Institute for Work & Health
Each of these perspectives offers opportunities for additional research specifically related to health and safety training. The following are possible areas for future investigation. They build upon several different theoretical perspectives.
Research is needed that will guide OHS professionals in accurately assessing trainee needs before training. This way managers can first be assured that training is the appropriate solution to a workplace problem. Second, trainers can then develop targeted, effective training programs. Currently, many interventions reported in the OHS literature do not clearly indicate that a needs assessment was performed confirming that training was the appropriate solution to a perceived problem. It is possible that studies with negative results sometimes reflect an inappropriate application of a training solution to an engineering or work organization problem. While behaviour-based safety approaches have applied reinforcement theory to the OHS environment (74; 75; 76), application of the theory to training design and delivery has not been thoroughly examined in the OHS training literature. For example, what is the impact of applying various types of reinforcement and different reinforcement schedules during training and during the transfer period after training? In other words, how could the application of principles derived from reinforcement theory and schedules of reinforcement be optimized in ways that produce positive measurable outcomes from training? What do learners find most positive or negative with regard to training? How can this information be utilized to improve training, training delivery or persistence of training gains? What is the optimum amount of practice needed during training to ensure the mastery of new knowledge and skills? In what way does a complete mastery during training translate into more effective transfer into the workplace? What role does over-learning play in training effectiveness outcomes related to transfer of training? What is the impact of fostering pre-training feelings of self-efficacy? Social learning theory predicts this will engender persistence in learning and fuller engagement in training. For OHS environments, what are the relative merits of stressing mastery (e.g. individual improvement toward goals, with errors embraced as part of the learning process) versus performance (e.g. focusing on high level task performance and comparison to/competition with other trainees)? Does the best approach differ in different occupational settings? Is it related to complexity of tasks associated with particular jobs, level of skills needed or other workplace factors? It would be useful for future research to assess how current workplace trends such as downsizing, outsourcing and business consolidations influence training effectiveness. Similarly, it would be
A systematic review of the effectiveness of training & education for the protection of workers
79
interesting to show how training methods or content might mitigate these effects. Many studies attempted to assess trainees’ attitudes, beliefs and motivations and relate those factors to training effectiveness. More rigorous experimental designs are needed in this area, as well as exploration of trainees’ expectations. For example, studies exploring how trainees weigh their OHS options, apply expectations of outcomes and then choose a behaviour that will result in the outcome of the highest value to them could have significant implications for the design of training. Research is needed to clarify ways to increase trainees’ attentiveness. Can this be accomplished by manipulating aspects of the training material and/or the training environment (intensity of stimuli, pace, frequency of presentation)? What impact might attentiveness have on retention of information and subsequent transfer of training? Are there new training methods that can increase memory capabilities or improve learners’ abilities to strategize and select correct courses of action during and after training?
Adult learning theory, which recognizes that most prior educational theories were based upon studies with children and youth, is especially relevant to workplace training. This model suggests that trainers and training programs must address several assumptions with regard to adult learners. For example, adults bring work-related experiences and problem-solving approaches into training; they need training programs that permit self-direction; and they learn best through experiences (73). The implications of involving learners for effective training are immediately apparent. The issue of trainee “engagement” with training is a major interest within adult learning disciplines. We need better ways to define high, medium and low levels of engagement to permit comparisons across studies. Research differentiating between problem-centred training approaches versus the more common subject-centered approaches would be especially useful. Novel training techniques that increase the involvement of trainees in creating their learning experience and then applying it back in the workplace are needed. Computer-based training and realistic immersive simulation training offer the potential to increase levels of engagement with training, but need comparative evaluation studies that also include economic indices so that return-on-investment can be considered. Higher engagement often requires higher investment in time and dollars. There are other information gaps in OHS literature that could be addressed through targeted training effectiveness research or collaborative studies with allied scientific disciplines. For example, studies of “trainer effects” are needed and could result in changes to the qualifications and education of trainers. In many work sectors, the person designated to develop and provide OHS training to work teams is a manager or senior worker. This person 80
Institute for Work & Health
often has little or no formal training in educational needs assessment or in the development, delivery or evaluation of training. Systematic studies may result in specific evidence-based recommendations for these trainers, similar to recommendations for therapists derived from psychology research in which the skill and manner of effective therapists has been quantified and validated. Further studies are also needed to better understand the role of feedback in training effectiveness. In particular, determining appropriate types of feedback and timing with regard to optimal learning and transfer of training to the workplace is needed. While there are many regulations requiring training and refresher training, those regulations are not based on empirical findings that validated the optimal intervals for refresher training (77). Often, a default time period of yearly refresher training was established based on little more than convention and convenience. Studies are needed to confirm how often retraining is needed, what form it should take, and to investigate the potential value of post-training maintenance activities such as on-the-job goal-setting, visualization exercises, mastery manipulations, etc. Longitudinal studies that follow knowledge retention and maintenance of behavioural change would address this need. Similarly, the impact of varying the number of training sessions should be a focus in future research. No such studies were found in this review. The promise of this approach was suggested by a study in this review that found a substantial, statistically significant effect (SMD = +0.60, p = 0.0001) on the development of clinical dermatitis in student nurses when a sevensession multi-component intervention was contrasted with a single session information sheet (Löffler et al. 2006). Studies in a greater variety of occupational settings, examining training as it is normally provided in a workplace, would also be welcome. More rigorous training evaluations need to be conducted in ways that still reflect realities typical of workplaces in terms of training content, delivery and workplace settings. Many studies suggest that environmental factors play a role in the effectiveness of training, and some factors appear to influence readiness for training or willingness to apply training in the workplace. Factors worthy of additional study include perceived supervisor support, mandatory attendance for managers, rewards for practicing skills and various types of follow-up evaluations of onsite behaviour. In future reviews on this topic, consideration should be given to examining the health effects of training for ergonomic risks, separately from training addressing other types of OHS risks. The findings in this review, including a A systematic review of the effectiveness of training & education for the protection of workers
81
re-examination of results published by Burke et al. (7), suggest that the health impacts of the two types of training differ (see section 4.1.1). Finally, there could be improvements in the way future research is reported. Our quality assessment showed that there was room for improvement in the reporting of individual studies, particularly of the randomization procedures, the similarity of study groups, the potential for contamination and the occurrence of influential events coinciding with the intervention. More complete reporting would aid the reader in assessing the credibility and generalizabilty of study findings. The clinical field has developed a checklist that researchers can use to ensure that their reporting is complete (78). 4.6 Conclusions arising from the review Based on the 22 studies included in this review, the following conclusions can be drawn: 1. There is strong evidence for the effectiveness of training on worker OHS behaviours. 2. The size and direction of the effects observed to date for knowledge and attitudes and beliefs are consistent with the evidence on behaviours. Surprisingly, there is insufficient evidence on the effectiveness of training on knowledge and attitudes and beliefs. The reason is a lack of studies of sufficient methodological quality that meet the review’s relevance criteria (which include requirements for a study being a randomized controlled trial published between 1996-2007 and reporting both pre- and postintervention measurement of outcomes.) 3. There is insufficient evidence of the effectiveness of training on health (i.e. injuries, symptoms), because there are inconsistent and small effects. The inconsistency arises from finding both negative and small, positive effects in the training versus control studies. No large, positive effects are observed in these studies. 4. There is insufficient evidence that high engagement training is more effective than medium/low engagement training on knowledge, attitudes or health. There are too few studies of sufficient methodological quality that meet the review’s relevance criteria (which include requirements for a study being a randomized controlled trial published between 1996-2007 and reporting both preand post-intervention measurement of outcomes.) 5. There is insufficient evidence that a single session of high engagement training has a greater effect than a single session of low or medium engagement training on behaviours. The observed effects are very small. 82
Institute for Work & Health
6. There is a lack of high quality randomized trial research on OHS training effectiveness. This review identified only 22 randomized trials on OHS training with both pre- and post-intervention measurements published from 1996 to 2007. Only 14 are of sufficient quality to use in the final syntheses of research evidence. This lack of useable evidence is a barrier to drawing conclusions in some areas.
A systematic review of the effectiveness of training & education for the protection of workers
83
5.0
Messages for stakeholders
The following messages were developed after considering the evidence from this review: Workplace education and training programs have a positive impact on health and safety behaviours, so the review team recommends that workplaces continue to conduct education and training programs. Current evidence indicates positive associations between OHS training and the knowledge and attitudes of workers. However, OHS training as a lone intervention has not been demonstrated to have an impact on health (e.g. injuries, symptoms). The review team is unable to make recommendations about the nature of training (e.g. level of engagement, computer versus lecture, number of sessions). There is a critical need for high quality research on OHS training. Researchers, training providers, labour and management should continue to work together to advance the knowledge of effective practices in education and training.
84
Institute for Work & Health
6.0
References
1. Rivera RJ, Paradise A. State of the industry report. Alexandria (VA): American Society for Training and Development; 2006. 2. Redinger CF, Levine SP. Development and evaluation of the Michigan Occupational Health and Safety Management System assessment instrument: a universal OHSMS performance measurement tool. American Industrial Hygiene Association Journal. 1998; 59(8):572-581 3. Vaught C, Brnich MJ, Kellner HJ. Effects of training strategy on selfcontained self-rescuer donning performance. In Proceedings: Bureau of Mines Technology transfer seminar; Information Circular 9185. 1988 May 17; Pittsburgh (PA); 1988. 4. Cohen H, Colligan MJ. Assessing Occupational Safety and Health Training: A literature review. DHHS (NIOSH) Pub. Number 98-145. Cincinnati, OH: National Institute for Occupational Safety and Health. 1998. 5. Sinclair RC, Smith K, Colligan M, Prince M, Nguyen T, Stayner L. Evaluation of a safety training program in three food service companies. Journal of Safety Research. 2003; 34:547-558. 6. Burke MJ, Holman D, Birdi K. A walk on the safe side: The implications of learning theory for developing effective safety & health training. In Hodgkinson GP, Ford JK (editors). International review of industrial and organizational psychology. 2006a; 21:1-44. 7. Burke MJ, Sarpy SN, Smith-Crowe K, Chan-Serafin S, Salvador R, Islam G. Relative effectiveness of worker safety and health training methods. American Journal of Public Health. 2006b; 96:315-324. 8. Leigh J, Markowitz S, Fahs M, Landrigan P. Costs of occupational injuries and illnesses. Ann Arbor (MI): University of Michigan Press, 2000. 9. Schulte PA. Characterizing the burden of occupational injury and disease. Journal of Occupational and Environmental Medicine. 2005; 47:607-622. 10. Crabtree BF, Miller ML. Doing qualitative research. Newbury Park (CA): Sage, 1992.
A systematic review of the effectiveness of training & education for the protection of workers
85
11. National Institute for Occupational Safety and Health (NIOSH). A model for research on training effectiveness. DHHS (NIOSH) Publication No. 99-1112. Cincinnati (OH): NIOSH, 1999. 12. National Institute for Occupational Safety and Health (NIOSH). Workplace safety and health training: Report from the 1999 National Conference. DHHS (NIOSH) Publication No. 2004-132. Cincinnati (OH): NIOSH, 2004. 13. Noe RA. Employee training and development. Boston (MA): McGraw-Hill, 2005. pp. 184-190. 14. Moore MG. Transactional distance theory. In Keegan D, editor. Theoretical principles of distance education. New York (NY): Routlege, 1993. pp. 22-38. 15. Mayer, Richard E (Ed).The Cambridge handbook of multimedia learning. New York (NY): Cambridge University Press; 2005. 16. Van Wart M, Cayer NJ, Cook S. Handbook of training and development for the public sector. San Francisco (CA): Jossey-Bass; 1993. 17. McManus DA. The two paradigms of education and the peer review of teaching. NAGT Journal of Geoscience Education. 2001; 49:423434. 18. Alliger GM, Tannenbaum S, Bennett W, Traver H, Shortland A. A meta-analysis of the relations among training criteria. Personnel Psychology. 1997; 50:341-358. 19. Borich G. Effective teaching methods. New York (NY): Macmillan Publishing Co; 1998. 20. Gagne RM. The conditions of learning and theory of instruction. 4th edition. New York (NY): Wadsworth; 1985. 21. Hayden JA, Cote P, Bombardier C. Evaluation of the quality of prognosis studies in systematic reviews. Annals of Internal Medicine. 2006; 144(6): 427-437. 22. Cochrane Collaboration Handbook, May 2005 edition. Available from: www.cochrane.org/resources/handbook/. Accessed September 2009. 23. Sackett DL. Bias in analytic research. Journal of Chronic Disability. 1979; 32(1/2): 51-63. 86
Institute for Work & Health
24. Kleinbaum DG, Kupper LL, Morgenstern H. Epidemiologic research. Belmont (CA): Lifetime Learning Publications; 1982. 25. Delgado-Rodriguez M, Llorca J. Bias. Journal of Epidemiology and Community Health. 2004; 58: 635-41. 26. Shadish WR, Cook TD, Campbell DT. Experimental and quasiexperimental designs for generalized causal inference. Boston (MA): Houghton Mifflin Co; 2002. 27. Deeks JJ, Dinnes J, D’Amico R, Sowden AJ, Sakarovitch C, Song F et al. Evaluating non-randomised intervention studies. Health Technology Assessment. 2003; 7(27):1-173. 28. Choi BCK, Pak AWP. Bias, overview. In: Gail MH, Benichou J, editors. Encyclopedia of epidemiologic methods. Chichester, U.K.: Wiley; 2000. pp. 74-82. 29. van Tulder M, Furlan A, Bombardier C, Bouter L. Updated method guidelines for systematic reviews in the Cochrane Collaboration Back Review Group. Spine. 2003; 28(12):1290-1299. 30. Juni P, Altman DG, Egger P. Assessing the quality of randomized controlled trials. In: Systematic reviews in health care: meta-analysis in context, 2nd edition. London, U.K.: BMJ Books; 2001. 31. Carroll LJ, Cassidy JD, Peloso PM, Garritty C, Giles-Smith L. Systematic search and review procedures: results of the WHO Collaborating Centre Task Force on Mild Traumatic Brain Injury. Journal of Rehabilitation Medicine. 2004; (Suppl 43):11-14. 32. Cohen J. Weighted kappa: nominal scale agreement with provision for scaled disagreement or partial credit. Psychological Bulletin. 1968; 70(4): 213-220. 33. Landis JR, Koch GG. The measurement of observer agreement for categorical data. Biometrics. 1977; 33:159-174. 34. Brewer S, Van Eerd D, Amick III BC, Irvin E, Daum K, Gerr F, et al. Workplace interventions to prevent musculoskeletal and visual symptoms and disorders among computer users: a systematic review. Journal of Occupational Rehabilitation. 2006; 16 (3):317-350. 35. Franche RL, Cullen K, Clarke J, Irvin E, Sinclair S, Frank J, the Institute for Work & Health Workplace-Based RTW Intervention Literature Review Research Team. Workplace-based return-to-work A systematic review of the effectiveness of training & education for the protection of workers
87
interventions: a systematic review of the quantitative literature. Journal of Occupational Rehabilitation. 2005; Dec 15; (4):607-31. 36. Tompa E, Trevithick S, McLeod C. Systematic review of the prevention incentives of insurance and regulatory mechanisms for occupational health and safety. Scandinavian Journal of Work Environment and Health. 2007; 33(2):85-95. 37. Bandura A. Social Foundations of Thoughts and Actions. Englewood Cliffs (NJ): Prentice-Hall; 1986. 38. Janz NK, Becker MH. The Health Belief Model: A decade later. Health Education Quarterly. 1984; 11: 1-47. 39. Prochaska JO, DeClemente CC, Norcross JC. In search of how people change: applications to addictive behaviors. American Psychologist. 1992; 47: 1102-1114. 40. Alliger GM, Janak EA. Kirkpatrick’s levels of training criteria: thirty years later. Personnel Psychology. 1989; 42(2): 331-42. 41. Rothman KJ, Greenland S. Modern epidemiology, 2nd ed., Philadephia (PA): Lippincott-Raven; 1998. 42. Lipsey MW, Wilson DB. Practical meta-analysis. Thousand Oaks, (CA): Sage Publications Ltd; 2000. 43. Chinn S. A simple method for converting an odds ratio to effect size for use in meta-analysis. Statistics in Medicine. 2000; 19 (22):31273131. 44. Briss PA, Fielding J, Hopkins DP, Woolf SH, Hinman AR, Harris JR. Developing an evidence-based guide to community preventive services - methods. American Journal of Preventive Medicine 2000; 18 (1 Suppl):35-43. 45. Rivara FP, Thompson DC. Systematic reviews of injury-prevention strategies for occupational injuries: an overview. American Journal of Preventive Medicine. 2000; 18 (4 Suppl):1-3. 46. Slavin RE. Best evidence synthesis: an intelligent alternative to metaanalysis. Journal of Clinical Epidemiology. 1995; 48(1): 9-18. 47. Arthur W, Bennett W, Edens P, Bell S. Effectiveness of training in organizations: a meta-analysis of design and evaluation features. Journal of Applied Psychology. 2003; 88(2): 234-245.
88
Institute for Work & Health
48. Taylor PJ, Russ-Eft DF, Chan DWL. A meta-analytic review of behavior modeling training. Journal of Applied Psychology. 2005; 90(4): 692-709. 49. Arthur W, Bennett W, Stanush PL, McNelly TL. Factors that influence skill decay and retention: a quantitative review and analysis. Human Performance. 1998; 11(1): 57-101. 50. Alvarez K, Salas E, Garofano CM. An integrated model of training evaluation and effectiveness. Human Resource Development Review. 2004; 3(4): 385-416. 51. Komaki J, Barwick KD, Scott LR. A behavioral approach to occupational safety: pinpointing and reinforcing safe performance in a food manufacturing plant. Journal of Applied Psychology. 1978; 63:434-445. 52. Martimo KP, Verbeek J, Karppinen J, Furlan AD, Takala EP, Kuijer PP et al. Effect of training and lifting equipment for preventing back pain in lifting and handling: systematic review. British Medical Journal. 2008; 336(7641): 429-31. 53. Amick B, Tullar J, Brewer S, Irvin E, Pompeii L, Wang A et al. Interventions in health- care settings to improve musculoskeletal health: A systematic review. Toronto: Institute for Work & Health; 2006. 54. Amick BC, Kennedy CA, Dennerlein JT, Brewer S, Catli S, Williams R et al. Systematic review of the role of occupational health and safety interventions in the prevention of upper extremity musculoskeletal symptoms, signs, disorders, injuries, claims and lost time. Toronto: Institute for Work & Health; 2008. 55. Brewer S, King E, Amick B, Delclos G, Spear J, Irvin E et al. A systematic review of injury/illness prevention and loss control programs (IPC). Toronto: Institute for Work & Health; 2007. 56. Phillips JJ. Return on investment training and performance improvement programs. Houston (TX): Gulf Publishing; 1997. 57. Tompa E, Dolinschi R, Niven K, de Oliveira C. A critical review of the application of economic evaluation methodologies in occupational safety. In: Tompa E, Culyer A, Dolinschi R, editors. Economic evaluation of interventions for occupational health and safety: developing good practice. Oxford: Oxford University Press; 2008.
A systematic review of the effectiveness of training & education for the protection of workers
89
58. Morrow CC, Jarrett MQ, Rupinski MT. An investigation of the effect and economic utility of corporate-wide training. Personnel Psychology. 1997; 50:91-119. 59. Tompa E, Culyer A, Dolinschi R, editors. Economic evaluation of interventions for occupational health and safety: developing good practice. Oxford: Oxford University Press; 2008. 60. Moran JB, Dobbin D. Quality assurance for worker health and safety training programs. Hazardous waste/operations and emergency responses. Applied Occupational and Environmental Hygiene. 1991; 6: 07-113. 61. Vojetcky MA, Berkanovic L. The evaluation of health and safety training. International Quarterly of Community Health Education. 1984; 5:277-286. 62. Vojetcky MA, Schmitz MI. Program evaluation and health and safety training. Journal of Safety Research. 1986; 17:57-63. 63. Wallerstein N, Weinger M. Health and safety evaluation for worker empowerment. American Journal of Industrial Medicine. 1992; 22: 619-635. 64. Gotsch AR, Weidner BL. Strategies for evaluating the effectiveness of training programs. Occupational Medicine: State of the Art Reviews. 1994; 9(2): 171-188. 65. American National Standards Institute. Criteria for accepted practices for safety, health, and environmental training. ANSI Z-490.1-2001. Des Plaines (IL): American Society of Safety Engineers, 2001. 66. Smith PM, Mustard CA. How many employees receive safety training during their first year of a new job? Injury Prevention. 2007; 13:37-41. 67. Kirsch I, Braun H, Yamamoto K, Sum A. America’s perfect storm: three forces changing our nation’s future. Policy Information Report Educational Testing Service. Princeton (NJ): Educational Testing Service; 2007. 68. American National Standards Institute. American National Standard – Occupational Health and Safety Management System. ANSI/AHIA Z-10-2005. Fairfax (VA): American Industrial Hygiene Association, 2005. 69. Burke MJ, Chan-Serafin S, Salvador R, Smith A, Sarpy S. The role of national culture and organizational climate in safety training 90
Institute for Work & Health
effectiveness. European Journal of Work and Organizational Psychology. 2008; 17:133-154. 70. Locke EA, Shaw KN, Saari LM, Latham GP. Goal setting and task performance. Psychological Bulletin. 1981; 90:125-152. 71. Maslow AH. A theory of human motivation. Psychological Reports. 1943; 50: 370-396. 72. Gagne RM. Learning processes and instruction. Training Research Journal. 1996; 1:17-28. 73. Knowles M. The adult learner, 4th edition. Houston (TX): Gulf Publishing; 1990. 74. Geller ES. Behavior-based safety: confusion, controversy, and clarification. Occupational Health and Safety. 1999; 68(1): 40-49. 75. Geller ES. The psychology of safety handbook. Boca Raton (FL): CRC Press; 2001. 76. DePasquale JP, Geller ES. Critical success factors for behavior-based safety: a study of 20 industry-wide applications. Journal of Safety Research. 1999; 30(4):237-249. 77. Richards R. Directorate of Standards, Occupational Health Administration. Personal communication; 2007. 78. Moher D, Schulz KF, Altman DG, for the CONSORT Group. The CONSORT statement: revised recommendations for improving the quality of reports of parallel-group randomized trials. The Lancet. 2001; 357:1191-4.
A systematic review of the effectiveness of training & education for the protection of workers
91
92
Institute for Work & Health
7.0
References for randomized trials
1. Arnetz JE, Arnetz BB. Implementation and evaluation of a practical intervention programme for dealing with violence towards health care workers. Journal of Advanced Nursing. 2000; 31(3):668-80. 2. Banco L, Lapidus G, Monopoli J, Zavoski R. The safe teen work project: a study to reduce cutting injuries among young and inexperienced workers. American Journal of Industrial Medicine. 1997; 31(5):619-622. 3. Bohr PC. Efficacy of office ergonomics education. Journal of Occupational Rehabilitation. 2000; 10(4):243-256. 4. Bohr PC. Office ergonomics education: a comparison of traditional and participatory methods. Work. 2002; 19(2):185-91. 5. Brisson C, Montreuil S, Punnett L. Effects of an ergonomic training program on workers with video display units. Scandinavian Journal of Work, Environment and Health. 1999; 25(3):255-263. 6. Duffy OM, Hazlett DE. The impact of preventive voice care programs for training teachers: a longitudinal study. Journal of Voice: Official Journal of the Voice Foundation. 2004; 18(1):63-70. 7. Eklöf M, Hagberg M. Are simple feedback interventions involving workplace data associated with better working environment and health? A cluster randomized controlled study among Swedish VDU workers. Applied Ergonomics. 2006; 37(2):201-210. 8. Eklöf M, Hagberg M, Toomingas A, Tornqvist EW. Feedback of workplace data to individual workers, workgroups or supervisors as a way to stimulate working environment activity: a cluster randomized controlled study. International Archives of Occupational and Environmental Health. 2004; 77:505-514. 9. Gray J, Cass J, Harper DW, O'Hara PA. A controlled evaluation of a lifts and transfer educational program for nurses. Geriatric Nursing. 1996; 17(2):81-5. 10. Greene BL, DeJoy DM, Olejnik S. Effects of an active ergonomics training program on risk exposure, worker beliefs, and symptoms in computer users. Work. 2005; 24(1):41-52. 11. Harrington S, Walker BL. A comparison of computer-based and instructor-led training for long-term care staff. Journal of Continuing Education in Nursing. 2002 Jan-Feb; 33(1):39-45. A systematic review of the effectiveness of training & education for the protection of workers
93
12. Harrington SS, Walker BL. The effects of ergonomics training on the knowledge, attitudes, and practices of teleworkers. Journal of Safety Research. 2004; 35(1):13-22. 13. Hickman JS, Geller ES. A safety self-management intervention for mining operations.[erratum appears in Journal of Safety Research. 2003; 34(5):605] Journal of Safety Research. 2003; 34(3):299-308. 14. Held E, Mygind K, Wolff C, Gyntelberg F, Agner T. Prevention of work related skin problems: an intervention study in wet work employees. Occupational & Environmental Medicine. 2002; 59(8): 556-561. 15. Hong O, Ronis DL, Lusk SL, Kee G-S. Efficacy of a computer-based hearing test and tailored hearing protection intervention. International Journal of Behavioral Medicine. 2006; 13(4): 304-14. 16. Jensen LD, Gonge H, Jørs E, Ryom P, Foldspang A, Christensen M, Vesterdorf A, Bonde JP. Prevention of low back pain in female eldercare workers: randomized controlled work site trial. Spine. 2006; 31(16): 1761-69. 17. Löffler H, Bruckner T, Diepgen T, Effendy I. Primary prevention in health care employees: a prospective intervention study with a 3-year training period. Contact Dermatitis. 2006; 54:202-9. 18. Lusk SL, Eakin BL, Kazanis AS, McCullagh MC. Effects of booster interventions on factory workers' use of hearing protection. Nursing Research. 2004; 53(1):53-58. 19. Lusk SL, Ronis DL, Kazanis AS, Eakin BL, Hong O, Raymond DM. Effectiveness of a tailored intervention to increase factory workers' use of hearing protection. Nursing Research. 2003; 52(5): 289-95. 20. Perry MJ, Layde PM. Farm pesticides: outcomes of a randomized controlled intervention to reduce risks. American Journal of Preventive Medicine. 2003; 24(4):310-315. 21. Rizzo TH, Pelletier KR, Serxner S, Chikamoto Y. Reducing risk factors for cumulative trauma disorders (CTDs): the impact of preventive ergonomic training on knowledge, intentions, and practices related to computer use. American Journal of Health Promotion. 1997; 11(4):250-3.
94
Institute for Work & Health
22. Rasmussen K, Carstensen O, Lauritsen JM, Glasscock DJ, Hansen ON, Jensen UF. Prevention of farm injuries in Denmark. Scandinavian Journal of Work, Environment and Health. 2003; 29(4): 288-296. 23. Wang H, Fennie K, He G, Burgess J, Williams AB. A training programme for prevention of occupational exposure to bloodborne pathogens: impact on knowledge, behaviour and incidence of needle stick injuries among student nurses. In Changsha, People's Republic of China. Journal of Advanced Nursing. 2005; 41(2):187-94. 24. van Poppel MN, Koes BW, van der Ploeg T, Smid T, Bouter LM. Lumbar supports and education for the prevention of low back pain in industry: a randomized controlled trial. [see comment]. Journal of the American Medical Association. 1998; 279(22):789-1794. 25. Wright BJ, Turner JG, Daffin P. Effectiveness of computer-assisted instruction in increasing the rate of universal precautions-related behaviors. American Journal of Infection Control. 2005; 25(5):426429.
A systematic review of the effectiveness of training & education for the protection of workers
95
96
Institute for Work & Health
8.0
References for non-randomized trials
1. Bauer A, Kelterer D, Bartsch R, Pearson J, Stadeler M, Kleesz P, Elsner P, Williams H. Skin protection in bakers' apprentices. Contact Dermatitis. 2002; 46(2):81-5. 2. Gregersen NP, Brehmer B, Moren B. Road safety improvement in large companies. An experimental comparison of different measures. Accident Analysis & Prevention. 1996; 28(3):297-306. 3. Held E, Wolff C, Gyntelberg F, Agner T. Prevention of work-related skin problems in student auxiliary nurses, Contact Dermatitis. 2001; 44(5):297-303. 4. Hong Y-J, Lin Y-H, Pai H-H, Lai Y-C, Lee I-N. Developing a safety and health training model for petrochemical workers, Kao-Hsiung i Hsueh Ko Hsueh Tsa Chih [Kaohsiung Journal of Medical Sciences]. 2004; 20(2):56-62. 5. Jeffe DB, Mutha S, Kim LE, Evanoff BA, Fraser VJ. Evaluation of a preclinical, educational and skills-training program to improve students' use of blood and body fluid precautions: one-year follow-up. Preventive Medicine. 1999; 29(5):365-373. 6. Lueveswanij S, Nittayananta W, Robison VA. Changing knowledge, attitudes, and practices of Thai oral health personnel with regard to AIDS: an evaluation of an educational intervention. Community Dental Health. 2000; 17(3):165-71. 7. Ray PS, Bishop PA, Wang MQ. Efficacy of the components of a behavioral safety program. International Journal of Industrial Ergonomics. 1997; 19(1):19-29. 8. Robertson MM, O'Neill MJ. Reducing musculoskeletal discomfort: effects of an office ergonomics workplace and training intervention, International Journal of Occupational Safety and Ergonomics. 2003; 9(4):491-502. 9. Thorne CD, Oliver M, Al Ibrahim M, Gucer PW, McDiarmid MA. Terrorism-preparedness training for non-clinical hospital workers: tailoring content and presentation to meet workers' needs. Journal of Occupational and Environmental Medicine. 2004; 46(7): 668-676. 10. Vaught C, Mallet LG, Brnich MJ Jr, Peters RH. Expectations versus experience: training lessons based upon miners' difficulties when using emergency breathing apparatus. Journal of the International Society for Respiratory Protection. 2004; 21(Spring/Summer):49-59. A systematic review of the effectiveness of training & education for the protection of workers
97
11. Vela Acosta MS, Chapman P, Bigelow PL, Kennedy C, Buchan RM. Measuring success in a pesticide risk reduction program among migrant farm workers in Colorado. American Journal of Industrial Medicine. 2005; 47(3):237-245.
98
Institute for Work & Health
Appendices
A systematic review of the effectiveness of training & education for the protection of workers
99
100
Institute for Work & Health
Appendix A
Search Terms Term Category Work-related Education and training intervention
Exact Search Terms work/ worker$.mp. intervention?.mp. training.mp. inservice training/ Inservice Training/ec, og, mt education/
OHS outcomes and factors affecting effectiveness
feedback procedures.mp. feedback/ Evaluation Studies/ reinforcement.mp. accidents/ accidents, occupational/ cumulative trauma disorder/ occupational diseases/ occupational exposure/ occupational health/ Occupational Health Services/ safety/ hazardous substances/ hazardous waste/ Risk Factors/ protective factors.mp. primary prevention/ accident prevention/
Between-group evaluation design
comparison.mp. random$.mp.
workplace$.mp. occupations/ educational measurement/ educational status/ health education/ Health Education/mt [Methods] health knowledge, attitudes, practice/
prevention & control/
employment/ e-training.mp. blended training.mp. extra training.mp. pre training.mp. on demand training.mp. practice.mp. facilitators.mp. barriers.mp. "wounds and injuries"/ KNOWLEDGE/ Health Knowledge, Attitudes, Practice/ safety culture.mp. health protection.mp. behavio?ral change.mp. return on investment.mp. performance indicators.mp. medical care.mp. "Costs and Cost Analysis"/ workers' compensation/ claim$.mp. absenteeism/ presenteeism.mp. economic evaluation.mp. between groups.mp.
NOTE: The search was limited to humans and (English or French) and yr= “1996 – 2007” The search terms were combined using the following Boolean logic: terms within a row were combined using “OR” and terms between rows were combined using “AND”
A systematic review of the effectiveness of training & education for the protection of workers
101
Appendix B
Relevance Assessment, Stage 1 Questions # Question
Guidance
Response Response Option Consequence
1 Does the study meet one of the conditions listed below? a) Study of an education or training intervention aimed at reducing worker risks of workplace injury or disease b) Survey or report offering data on training (or lack thereof) as well as other factors contributing to work related injuries, fatalities, and health problems c) Report on OHS program practices for employers with exemplary safety/health performance to isolate training factors that may have contributed to their success d) Study in education/ learning field or ancillary areas that deal with issues especially pertinent to effective OHS training
If yes, please indicate which condition(s) were met by noting the appropriate letter(s) (i.e. a, b, c, and/or d) in the comment box
Yes
Include
No
Exclude
Unclear
Include
102
The working definition of occupational health and safety (OHS) will include the following (NIOSH report (4), p. 5): Instruction in prevention of work-related injury and illness through the: Proper use and maintenance of tools, equipment, materials Knowledge of emergency procedures Personal hygiene measures Needs for medical monitoring Use of personal protective equipment Instruction emphasizing awareness of workplace hazards: Knowledge of methods of hazard elimination or control Understanding right-to-know laws Ways for collecting information on workplace hazards Recognizing symptoms of toxic exposure Observing and reporting hazards or potential hazards to the appropriate bodies The working definitions of education and training will include the following (NIOSH report (4), p. 5): The narrower the role, the more the instruction is training The broader the role, the more the instruction is education Training embodies instructing workers in recognizing known hazards and using available methods for protection Education prepares one to deal with potential hazards or unforeseen problems. Guidance is given in ways to become better informed and to seek actions aimed at eliminating the hazard For option B – “other factors” might include such things as management support of safety training, setting goals and providing feedback to motivate use of knowledge gained, offering incentives or rewards for safe performance, etc.
Institute for Work & Health
# Question
Guidance
Response Response Option Consequence
2 Is the education or training examined in the study targeted at one of the following? a) Occupational health and safety (OHS) b) Other workplace factors with changes recorded in OHS outcomes (e.g., first aid training with accompanying reductions in workplace injuries) 3 Is the study published in either English or French?
If yes, please indicate what is being targeted by noting the appropriate letter(s) (i.e. a and/or b) in the comment box.
Yes
Include
No
Exclude
Unclear
Include
Yes
Include
No
Exclude
Unclear Yes
Include Include
No
Exclude
Unclear
Include
Yes
Include
No
Exclude
Unclear
Include
4 Is the study focused on a worker population?
General workplace health promotion education/training (e.g. smoking cessation, high blood pressure, etc.) with no link to OHS outcomes should be excluded. OHS is described in the OHS definition above for question #1.
Enter ‘yes’ if the abstract is in either English or French.
Studies focusing on non-working populations should be excluded. These may include articles concerning: Children Elderly or senior citizens who are not working Other adult populations that are not work-related (e.g. cancer education program offered to patients in an outpatient clinical setting) At least for now, there is no distinction being made about whether the work is paid or unpaid.
5 Is the date of publication between 1996 and 2007?
If the study is examining a ‘work’ setting, err on the inclusive side for this question. Studies published prior to 1996 should be excluded.
A systematic review of the effectiveness of training & education for the protection of workers
103
Appendix C
Relevance Assessment, Stage 2 Questions # Question
Guidance
1 Is the study examining a worker population?
None
2 Is the study concerned with any of the following? a) An intervention study (with pre- AND postmeasures) assessing the effectiveness of an OHS education/ training program b) Factors that may facilitate or inhibit the effectiveness of an OHS education/training programs c) A novel approach to provide OHS education/training programs d) Specialized techniques/methods (e.g. computer-based training) that have been used to provide OHS education/training programs e) Factors that affect compliance with OHS education/training programs addressed 3 Does the study present information that is best described as ‘conjecture’ or ‘testimonials’ with no supporting evidence?
If yes, please indicate which issues are addressed in the text box.
4 Does the study focus on workers' current state of knowledge regarding an OHS issue, which simply identifies that there is a further need for education/training on this issue?
In other words, the study doesn't meet the criteria 2b (facilitators/barriers) or 2e (compliance issues) described above.
104
None
Response Option Yes
Response Consequence Include
No
Exclude
Unclear Yes
Include Include
No
Exclude
Unclear
Include
Yes
Exclude
No
Include
Unclear Yes
Include Exclude
No
Include
Unclear
Include
Institute for Work & Health
Appendix D
Relevance Assessment, Stage 3 and 4 Questions # Question
Guidance
Response Option
Response Consequence
1 Is the study concerned with the effectiveness of a worker- or workplace-centered OHS training/education intervention aimed at the primary prevention of workplace injury and illness?
Primary prevention aims to reduce the incidence of illness/injury; secondary prevention aims to reduce the duration or severity of illness/injury through early detection and corrective interventions.
Yes
Include
No
Exclude
Since the focus of the review is on the worker- or workplace-centered training/education, population-based initiatives, including social marketing campaigns, are excluded.
Unclear
Include
Exclude stress management training type interventions. Exclude interventions where physical fitness is the major component. Exclude if an intervention includes training/education as only one component of a multi-component intervention, unless it is possible to isolate the effect of the training/education. Training/education refers to instruction or practice for acquiring skills and knowledge of rules, concepts or attitudes necessary to function effectively in specified task situations. With regard to OHS, training/education can consist of instruction in hazard recognition and control measures, learning safe work practices and proper use of personal protective equipment, and acquiring knowledge of emergency procedures and preventive actions. Training/ education can also provide workers with ways to obtain added information about potential hazards and their control; they can gain skills to assume a more active role in implementing hazard control programs or to effect organizational changes that would enhance worksite protection (Modified from 1998 NIOSH report, p. 11). Less intensive forms of training/education (e.g. educational pamphlets) are included if the intervention process includes a means of ensuring knowledge is accessed (i.e. that the pamphlet has been received and looked at by subject).
A systematic review of the effectiveness of training & education for the protection of workers
105
# Question
Guidance
2 Is the study a randomized trial?
Interventions are included if they meet this review’s definition of training/education, even if the authors do not use the term “training” or “education” to describe the intervention. Refer to revised Zaza et al. (2000) for algorithm (see Zaza figure below). “Investigators assign exposure?” refers to study units being intentionally placed into exposed and unexposed conditions for the purpose of evaluation.
Response Option
Response Consequence
Yes
Include
No
Exclude
Unclear
Include
Yes
Include
No
Exclude
Unclear Yes
Include Include
No
Exclude
Unclear
Include
Treat the words “investigators” loosely. It does not just mean researchers or the authors of the paper; it could be decision-makers in the government, workplace, etc. “Cohort study?” refers to whether the study attempted to follow the same people over time (cohort study) or whether it measured a changing group of people (e.g. all employees in workplace with 20% turnover measured over 3 years; other designs with concurrent comparison groups). If one encounters a mixed-model design that includes both qualitative and quantitative designs, choose the quantitative design when answering this question.
3 Are there pre- and postmeasures for each study group?
4 Does the study examine a worker, firm, or societal outcome related to OHS training/education?
106
If one encounters a mixed-model design that includes two quantitative designs, choose the stronger quantitative design when answering this question. None
Possible outcomes include knowledge, attitude, behaviour, exposure, ill-health, injury, cost, etc. Answer “no” if only immediate perceptions of the training/education are measured (e.g. satisfaction with, or perceptions of the quality of, the training/education).
Institute for Work & Health
# Question
Guidance
Response Option
Response Consequence
5 Is the study published in a scientific peer-reviewed journal?
Refer to list of peer-reviewed journals (created by the IWH library).
Yes
Include
Exclude journals where an assessment of scientific rigor/quality is not part of the article review process.
No
Exclude
Unclear
Include
Exclude practitioner-based journal articles.
A systematic review of the effectiveness of training & education for the protection of workers
107
Zaza Study Design Algorithm
Comparison between exposed & unexposed work sites?
No
Non-Comparative Study e.g., Case series Focus Group Case study Descriptive epi. study
Yes
Cross Sectional
Exposure (i.e. OHSMS intervention) and outcome determined in the same population (population of work sites) at the same time?
Yes
No
Randomized trial
No
Three + measurements made before, during or after an intervention?
No
More than one group of work sites studied?
Exposure assigned at group level? (e.g., community, county)
Yes
Group randomized trial
No Yes
Yes BeforeAfter
Yes
Time Series Investigators assign exposure?
Yes
No
Case Control
Outcome
Exposure assigned randomly?
No
Non-randomized “trial”
Groups defined by?
Exposure
Other designs with concurrent comparison groups (e.g., time series study with comparison group)
No
Cohort Design? (i.e. cohort of work sites)
Yes
Perspective?
Yes
Prospective Cohort Study
No
Retrospective Cohort Study
108
Institute for Work & Health
Appendix E
Quality Assessment Instrument Training/Education Intervention Effectiveness Review: Quality Assessment Guide This form is primarily designed to aid in assessing the internal validity of intervention studies of training/education4 effectiveness. The form therefore focuses on sources of systematic error or bias in estimates of the true effects of training/education interventions. We are not trying to assess external validity with this form. That aspect of validity will be assessed at a later stage of the review. The bulk of the items in the form are of two types: - Methodological: These questions ask for the assessment of a particular methodological feature relevant to bias. - Summary assessment of potential bias (questions #10, #15, #20, #24): These questions ask for a judgment on the potential for a certain kind of bias in the estimate of effect. You are requested to review your own responses to a few related methodological items before making this judgment. In addition to the question-specific guidance following each question, please apply this general guidance. Answer “unclear/not reported” if: -The information necessary to answer the question is unclear or not reported in the study paper AND -There are NO cited references that may contain the information AND - You do NOT feel advice would help to clarify the information in the study paper. Answer “advice and/or supplementary publication needed” if: -The information necessary to answer the question is unclear or not reported in the study paper AND -There IS a cited reference that may contain the information OR you DO feel advice (statistical or otherwise) may help clarify the information in the paper. -If you choose this response for a methodological question, note (in the SRS text box beside the response option) whether you need advice, a supplementary article, or both. - If you choose this response for a summary question, note (in the SRS text box beside the response option) a preliminary assessment of yes/partly/no in the absence of that advice and/or supplementary publication.
4
“Training” will be used instead of “training/education” in the interests of brevity.
A systematic review of the effectiveness of training & education for the protection of workers
109
General 1.
Please list each of the study groups, in order of its mention in the Methods. 1st study group ___________________________________ 2nd study group ___________________________________ 3rd study group ___________________________________ 4th study group ___________________________________ 5th study group ___________________________________ 6th study group ___________________________________
Further explanation: - This question is looking for the labels or names given to the study groups, based on the type of conditions to which they were exposed (e.g. tailored training; nontailored training; control). It is not looking for a description of the conditions. - Read the Methods section of the article to determine the order in which the study groups should be listed. List the first group mentioned as the “1st study group”, the second mentioned as the “2nd study group”, etc. - “Study groups” includes both training intervention and control groups.
Please consider only the comparison between the study groups you listed 1st and 2nd in question #1 when completing the QA in SRS.
Further explanation: If there are more than two study groups, there are multiple sets of results (corresponding to all possible pairings of groups), which could differ in their internal validity. We will consider first in SRS the quality of the results based on the pair of groups mentioned first in the Methods. The results based on the other pairs will be considered later in question #28. 2.
Are any of the study groups a “no-training control” group? Yes No Advice and/or supplementary publication needed
Further explanation: - A “no-training control” group would be a control study group with no training component. It could involve an additional planned co-intervention (e.g. engineering), as in a study comparing “training + engineering” vs. “engineering-only.” In such a case, the “engineering-only” would be considered a no-training control. 3. 110
Please list each of the outcomes studied. Most distal outcome(s) __________________ Remaining distal outcome(s) (if applicable) __________________ Remaining outcome(s) (if applicable) __________________ Institute for Work & Health
Guidance: - List the most distal outcome in the first text box. - If there are any “ties” regarding which outcome is the most distal (e.g. two types of symptoms, two types of injury, etc.), list the one that is mentioned first in the Methods section in the first text box and the remainder in the second text box. - List the remaining outcomes in the third text box. Further explanation: Outcome Proximity Guide*: Distal Outcome
Proximal Outcomes
Disability Injury/Ill-health Symptoms Exposures Hazards Behaviours Attitudes Knowledge/skills
*The order and applicability of the outcomes listed above may vary across studies.
Please answer the remainder of the form with reference to the most distal outcome.
Further explanation: - The internal validity of results could differ for each outcome. We will consider first in SRS the quality of the results for the most distal outcome. The results for the other outcomes will be considered later in question #27. 4.
In what category is the most distal outcome of the study? Disability Injury or ill-health Early symptoms of injury or ill-health Exposures Hazards Behaviours Attitudes Knowledge/skills Other (please specify) ____________________________
Potential Source of Bias 1: Selection – Noncomparability of Groups 5.
What type of research design was used? Randomized trial Non-randomized trial Advice and/or supplementary publication needed
A systematic review of the effectiveness of training & education for the protection of workers
111
Guidance: Answer “non-randomized trial” UNLESS: - The authors explicitly report randomly assigning subjects to study groups. 6.
Was the method of randomization adequate? Yes No Unclear/not reported Not applicable Advice and/or supplementary publication needed
Guidance: Answer “not applicable” if: - The study was a NON-randomized trial. Further explanation: - Adequate methods of randomization include: computer-generated random numbers; table of random numbers; drawing lots or envelopes; coin tossing; shuffling cards; throwing dice. - Inadequate methods include: according to subject number (e.g. employee number); date of birth; date of employment; alternation (i.e. any method in which there is predictability about the assignment). 7.
Was the intervention allocation concealed up to the point of intervention? Yes No Unclear/not reported Not applicable Advice and/or supplementary publication needed
Guidance: Answer “yes” if: - Group assignment was concealed from the subjects and those who had potential control over group assignment until the intervention began. Answer “not applicable” if: - The study was a NON-randomized trial. Further explanation: - This quality criterion is concerned with the potential bias arising when assignment is not concealed before the intervention begins and subjects and/or investigators try to “game the system” so that particular subjects end up in particular study groups. 8. Were the study groups similar at baseline regarding the most important potential confounders? Yes No
112
Institute for Work & Health
Unclear/not reported Advice and/or supplementary publication needed Guidance: Answer this question in two steps: - Step 1: Identify one to three potential confounders of most concern from the following list: age, sex, occupation, education, health status, ethnicity, language abilities, previous training experience, workplace empowerment/safety culture, and other(s) [please specify]. - Step 2: Determine whether the groups were similar at baseline with respect to these potential confounders. Use this two-step process in the consensus meeting as well: 1) agree on the one to three confounders; 2) agree on the degree of similarity between groups at baseline. 9.
Did withdrawals affect groups equally? Yes No Unclear/not reported Not applicable Advice and/or supplementary publication needed
Guidance: Answer “yes” if: - The withdrawal rate was 10% or less for each group (but not 0% for both groups) OR - The withdrawal rate was more than 10% for at least one group, but the groups remaining after withdrawals were as similar as they had been at baseline (with respect to the important confounders agreed upon in question #8). Answer “no” if: The withdrawal rate was more than 10% for at least one group AND The groups became more dissimilar than they had been at baseline (with respect to the important confounders agreed upon in question #8). Answer “not applicable” if: - The withdrawal rate was 0% for each study group OR - Withdrawals were unlikely to occur given the study design (e.g., intervention consists of a single session and post-intervention measures are taken immediately). Further explanation: - This question is concerned with whether withdrawals made the groups less comparable than they were at baseline. It is presumed that if the withdrawals had been less than 10%, any effect towards non-comparability would have been relatively
A systematic review of the effectiveness of training & education for the protection of workers
113
small. On the other hand, if withdrawals were greater than 10% for one or more of the groups, then their effect might have been to sizeably increase the non-comparability of the groups. Thus, to meet this criterion in cases where withdrawals have been greater than 10%, one is looking for a demonstration of similarity with respect to the identified confounders. 10. (SUMMARY Question) Are you confident that the comparison groups were selected and maintained in such a way that the potential for bias in the estimate of the true effect was minimized? Yes Partly No Advice and/or supplementary publication needed Guidance: Review your answers to questions #5-#9 before answering.
Potential Source of Bias 2: Study Execution 11. Was the implementation of the planned training intervention(s) monitored adequately? Yes No Unclear/not reported Not applicable Advice and/or supplementary publication needed Guidance: Answer “yes” if: Subjects’ access to the training/education intervention(s) has been explicitly mentioned in the publication AND It appears to have been monitored adequately. Answer “no” if: - Monitoring was said to be or demonstrated to be inadequate. Answer “unclear/not reported” if: - Implementation would have reasonably been an issue, but no mention or no clear mention of it has been made. Answer “not applicable” if: - Implementation would not have been an issue given the study design (e.g. intervention consists of a single session). Further explanation: - This item is concerned with knowing the actual exposure to the intervention (which might be different than the planned exposure) so that any observed effects can be attributed to a certain intervention exposure.
114
Institute for Work & Health
- For example, for an intervention consisting of multiple training sessions, we would want to see some comment about attendance at the sessions. 12. Was contamination avoided? Yes No Unclear/not reported Advice and/or supplementary publication needed Further explanation: - Contamination occurs when individuals assigned to study group A are exposed to study group B’s treatment condition either directly or indirectly. 13. Were planned co-interventions avoided or similar across groups? Yes No Unclear/not reported Advice and/or supplementary publication needed Further explanation: - This quality criterion is concerned with the potential bias arising from differential treatment of groups. - Planned co-interventions are distinct from the primary training intervention. They are other intentional exposures that could affect outcomes (e.g. engineering would be a planned co-intervention in a study that compared an engineering-only intervention vs. engineering-plus-training intervention). 14. Were unplanned co-interventions avoided or similar across groups? Yes No Unclear/not reported Advice and/or supplementary publication needed Guidance: Do not consider contamination in this item. Answer “yes” if: - There was no opportunity for unplanned co-interventions (given the time and circumstances between initial exposure to the intervention and all outcome measures) OR - There was opportunity for unplanned co-interventions, but each group was adequately monitored and known to have had similar exposure to them. Further explanation: - This quality criterion is concerned with the potential bias arising from differential treatment of groups.
A systematic review of the effectiveness of training & education for the protection of workers
115
- Unplanned co-interventions are those changes taking place in the environment of the study outside of the investigators’ control that could affect the outcomes (e.g. engineering would be an unplanned co-intervention if a work manager introduced an engineering innovation to only some of the work units being studied in a training trial). 15. (SUMMARY Question) Are you confident that the groups were intervened upon in such a way that the potential for bias in the estimate of the true effect was minimized? Yes Partly No Advice and/or supplementary publication needed Guidance: Review your answers to questions #11-#14 before answering.
Potential Source of Bias 3: Outcome Measurement 16. Was the outcome assessor blinded to the intervention assignment? Yes No Unclear/not reported Advice and/or supplementary publication needed Guidance: Answer “no” for self-report measures. Further explanation: - This criterion is concerned with the potential bias arising when the outcome assessor has expectations about the effectiveness of one treatment over another. The more subjective the outcome assessment method, the more concern one should have with this issue. - For self-report measures, the outcome assessor is the study subject. Since they are always aware of the intervention assignment for the outcomes they are assessing, the answer is “no.” - For observational measures, the outcome assessor is the person conducting the observations. - For injury records, the outcome assessors are those involved in the initial assessment and reporting of injuries (e.g. health care provider). 17. Was the method and timing of the outcome assessment similar in both groups? Yes No Unclear/not reported 116
Institute for Work & Health
Advice and/or supplementary publication needed Further explanation: - Timing is considered “similar” if the difference in the timing of outcome assessment(s) between study groups is less than 20% of the entire length of the study (i.e. from baseline to final outcome assessment). 18. Were the outcome data sufficiently valid? Yes No Unclear/not reported Advice and/or supplementary publication needed Guidance: Consider aspects of validity apart from blinding and outcome assessment issues covered in questions #16 and #17. Answer “no” if: - The outcome data were not sufficiently valid OR - There is reason to believe that the validity of the outcome data would differ across groups being compared. Further explanation: - Valid data are those that measure what they are intended to measure. - Depending on your normal use of the word validity, you might prefer to think in terms of whether the means of collecting the data (e.g. instruments) were valid. - Note that an instrument shown to be valid in one population cannot be assumed to be valid in a different population. - The amount of validity information required will vary with the outcome. For example, if the aim of training was to increase the ability to put on respiratory equipment properly and the outcome measure was a fit-test result with the equipment, then face validity would suffice. - For knowledge or behavioural measures, look for information on content validity. - For attitudes and other psychological constructs, look for a report on content validity and construct validity, or a criterion validity with a validity of 0.7 or greater. - For biomechanical measures, it is common for authors to not include a discussion of validity, assuming the reader has certain knowledge. Consider selecting the “advice needed” option. - For injury statistics, look for evidence that a change in injury rates (or lack thereof) was not the result of changes in reporting practices. - When no effect in response to the intervention was observed, look for assurance that a change in response to the intervention can be detected (i.e. validity for change). 19. Were the outcome data sufficiently reliable? Yes No
A systematic review of the effectiveness of training & education for the protection of workers
117
Unclear/not reported Advice and/or supplementary publication needed Guidance: Answer “yes” if: - Supportive results of reliability tests were reported directly OR - Supportive results of reliability tests were cited. Further explanation: The following types of reliability are potentially relevant: - Reliability with multiple administrations of tool: This type of reliability is relevant to all types of data, yet is investigated and reported upon more commonly for some types, e.g. psychological measures. Examples of tests of this type of reliability include delayed alternate form analysis, test-retest reliability, intra-rater reliability and precision tests of equipment. - Internal consistency: When a tool has multiple items measuring the same construct, look for the internal consistency of items. Common reliability tests and reliability coefficients are split-half, Kuder-Richardson, and Cronbach’s alpha. Look for coefficients with values of 0.7 or greater. - Reliability related to multiple raters: This type of reliability is reported on using percent agreement and Kappa. Look for Kappa values greater than 0.41. 20. (SUMMARY Question) Are you confident that the method of measuring the outcomes minimized the potential for measurement bias in the estimate of the true effect? Yes Partly No Advice and/or supplementary publication needed Guidance: Review your answers for questions #16-#19 before answering.
Potential Source of Bias 4: Analysis 21. Were the statistical tests and procedures appropriate? Yes No Not applicable Advice and/or supplementary publication needed Guidance: Answer “no” if: - The authors report that the study data violated test assumptions and/or missing data or outliers were not handled appropriately
118
Institute for Work & Health
OR - The tests were inappropriate. Answer “not applicable” if: - No statistical tests were conducted. 22. Was there appropriate statistical adjustment for differences between groups? Yes No Unclear Not applicable Advice and/or supplementary publication needed Guidance: Answer “yes” if: - Groups were dissimilar at baseline or after withdrawals AND appropriate adjustment was made. Answer “no” if: Groups were dissimilar at baseline or after withdrawals AND no appropriate adjustment was made Answer “unclear” if: It was unclear whether the groups were similar at both baseline and after withdrawal OR Groups were dissimilar AND it was unclear whether appropriate adjustment was made. Answer “not applicable” if: Groups were similar at baseline and after withdrawals. Further explanation: - This item is concerned with whether there was appropriate adjustment for the noncomparability of groups (only) in those cases where non-comparability at baseline or after withdrawals was an issue. - Dissimilarity at baseline = “no” to question #8. - Dissimilarity after withdrawals = “no” to question #9. - Similarity at baseline and after withdrawals = “yes” to both questions #8 and #9. - Methods of adjustment include matching, stratification, covariance adjustment and propensity score analysis. 23. Did the analysis include an intention-to-treat analysis? Yes No Unclear Not applicable Advice and/or supplementary publication needed
A systematic review of the effectiveness of training & education for the protection of workers
119
Guidance: Answer “yes” if: - Data from all subjects initially assigned to study groups were included in the analysis (including withdrawals, etc.) AND the data were analyzed according to the original group assignment. Answer “no” if: - Intention-to-treat analysis is relevant to the situation (e.g. more than 10% withdrawals), but the results of such an analysis are not mentioned. Answer “not applicable” if: - 90% or more of the subjects originally assigned to each group completed the study as planned. Further explanation: - Intention-to-treat is an analytic strategy wherein subjects are analyzed in the groups to which they were originally assigned, regardless of whether they subsequently proved to be ineligible, withdrew from the study, or received treatment that was different from that planned. - This question is relevant to both randomized and non-randomized trials. - It is assumed that in cases where an intention-to-treat analysis would have been relevant to the situation, the researchers would have reported the results of the analysis if they had conducted it. 24. (SUMMARY Question) Are you confident that the analytic method minimized the potential for bias in the estimate of the true effect? Yes Partly No Advice and/or supplementary publication needed Guidance: Review your answers for questions #21-#23 before answering.
Potential Source of Bias 5: Other 25. Are there any additional threats or strengths to internal validity beyond those already assessed? Yes (please describe) No Guidance: Answer “yes” if: - There are other threats or strengths that should be considered in the overall assessment of internal validity (question #26), but have not yet been captured by the previous questions Please describe the threats/strengths briefly.
120
Institute for Work & Health
Further explanation: - Confine your consideration to issues of internal validity or potential for bias. Do not include issues related to precision or external validity (i.e. how representative the initial study sample is of the target population or other reference population). This will be captured later in the review.
Overall assessment 26. (SUMMARY Question) What degree of confidence do you have that the study provides an unbiased estimate of the true effect of a specific training/education intervention in the initial study sample? 5 – High degree of confidence (very little or no bias is most likely) 4 3 – Medium degree of confidence (a moderate amount of bias is possible) 2 1 – Low degree of confidence (a large amount of bias is very likely) Advice and/or supplementary publication needed Guidance: - Review your answers for questions #10, #15, #20, #24, and #25 before answering. - Confine your answer to an assessment of internal validity or potential for bias. Do not include an assessment about precision or external validity (i.e. how representative the initial study sample is of the target population or other reference population). This will be captured later in the review.
Quality of additional results 27. Would you give the same answers to questions #6 to #26 for the remaining outcomes? Yes No Not applicable Guidance: Answer “not applicable” if: - There was only one outcome studied. Further explanation: - Still focusing on the two study groups mentioned first in the Methods section, this item asks you to consider whether the answers just given for questions #6-#26 (regarding the most distal outcome) would be the same for all the outcomes. 28. Would you give the same answers to questions #6 to #26 for all other combinations of study group comparisons and outcomes? Yes No Not applicable A systematic review of the effectiveness of training & education for the protection of workers
121
Guidance: Answer “no” if: - You would assess the results for any of the outcomes from any of the other study group comparisons differently than you did (in SRS for questions #6-#26) for the first study group comparison and the most distal outcome. Answer “not applicable” if: - There were only two study groups studied. Further explanation: - This item is concerned with the results corresponding to all other combinations of study group comparisons and outcomes, besides those already considered in questions #6-#26 and in question #27.
If you answered “No” to either of questions #27 and #28, please complete the supplementary QA assessment in Excel.
Additional results about factors 29. Does the study contain additional QUANTITATIVE evidence on factors besides that related to the main study comparisons? Yes No Advice and/or supplementary publication needed Guidance: Answer “yes” if: - Variation in effectiveness was examined for one or more worker characteristics (e.g., age, gender, previous training experience, etc.) OR - Variation in effectiveness was examined for one or more workplace characteristics (e.g., workplace size, management commitment to safety, etc.). Further explanation: - This question determines whether there is any additional quantitative evidence about the effect of factors, besides that already determined by the comparison of groups. Example analytical approaches providing this evidence include presenting the results stratified by factors or a regression analysis. - There must be numerical results in order to answer “yes,” but there need not be a statistical analysis.
122
Institute for Work & Health
Supplementary publications 30. Are there supplementary publications cited in this article that would assist in Quality Assessment or Data Extraction? Yes No Guidance: Answer “yes” if: - Any cited English or French language publications could provide information that would: - Assist in answering some of the quality assessment questions OR - Contribute to data extraction (e.g., provide more details about the population or intervention). 31. Are there any potential primary studies or reviews listed in the references that are likely to meet the inclusion criteria? (If yes, please include author/year/publication.) Yes (please describe) No
A systematic review of the effectiveness of training & education for the protection of workers
123
Appendix F
Data Extraction Instrument Ref ID:
Reviewer:
Date (dd/mm/yy):
General instructions: Keep in mind that these DE tables will appear as Appendices and will serve as a data source when further levels of abstraction are made to generate synthesis tables for the main body of the report. These DE tables need to be detailed enough that such abstraction can be made accurately. Use quotation marks to indicate directly quoted text. Use references to page numbers in the article to show the location of the extracted information in order to help anyone who may be returning to the article to check the original source – especially if the information is ‘buried” in the text. Enter NA for fields that are not applicable to the design of the study. Enter NR if the requested information would be potentially relevant to the article but it is not provided by the authors. Avoid deleting the numbered rows, as the automatic bulleting could misalign the numbering of your form and that of your partner’s form. The table contains MSWord form fields in some places to facilitate data entry (e.g. following “Reviewer” at top of the page); they appear shaded when viewed electronically (but not when printed). Some form fields are blank and some have default text. Use form fields by clicking on a field and then typing. INSTRUCTIONS Tracking Information First author (yr of publication) Title Research question Research question
Study design Study design
Unit of allocation Randomization methods
Data collection time points
124
EXTRACTED DATA
Report as Smith (2000), Smith & Jones (2000) or Smith et al. (2000) as appropriate. Title of the journal article
Report the research question (purpose, objective, aim), using the author’s own words if possible. Use X to indicate randomized trial (RT), quasi-RT, or nonrandomized trial (NRT). Individual, work group, workplace, etc. If applicable, describe methods of randomization (including any stratification) and concealing of allocation. List the points in time (e.g. 0 wks, 4 wks) when data were collected. Also indicate which should be considered baseline, follow-up 1, etc. Make time references in the remainder of the form consistent with these.
RT quasi-RT NRT
Time 1 = Time 2 = Time 3 = Time 4 = Time 5 =
Institute for Work & Health
Study Population Place Time Workplace(s)
Selection of workplace(s)
Selection of groups/individuals
Study population vs. larger population
Other information about the population and context
Study Groups
City / Country Calendar period from recruitment to final follow-up Describe workplaces from which individuals/work groups were selected, including name, size, sector, and broad occupational groups, if available. Describe selection of workplaces into study, including, if relevant, recruitment and sampling methods (e.g. entire sample, probability sample, convenience sample), inclusion/exclusion criteria, matching and numbers involved. Describe selection of work groups and/or individuals including recruitment and sampling methods, inclusion/exclusion criteria, matching and numbers involved. Report any information about the similarity between the entire study sample at a larger population from which the study sample was drawn. Specify the time point for which this is done. Describe any other noteworthy aspects of the study population, the larger population from which it is drawn, or the study context, not reported above or in the Group Characteristics section. List the names of the study groups, using short descriptive labels. They should correspond to the groups listed in QA.
Recruitment: Sampling method: Inclusion/exclusion criteria: Numbers involved:
1= 2= 3= 4= 5=
A systematic review of the effectiveness of training & education for the protection of workers
125
Group Characteristics at Times 1 to 5 In the Group Characteristics sections, there is no need to enter data on the numbers of subjects at Times 1 to 5 if the numbers are the only group characteristics available and if the information will be reported in the Results section. Group Characteristics at Time 1 Give characteristics at Time 1 for the whole study sample and the study groups (information on one or both may be available). Tailor the column headings of the table to the study by: i) specifying any reported characteristics besides age and gender in the fields defaultlabeled “(specify)” that follow “Other”; ii) changing default labels “mean” and “s.d.” as needed (to “%”, “n”, etc.). Report results of any statistical tests of the differences between study groups by reporting test statistics and p-value/NS. Note type of statistical test used, including level of significance if specified. Give any other descriptive information about the comparability of the different study groups characteristics at Time 1 that has not already been included in the table.
126
n Total sample Group 1 Group 2 Group 3 Group 4 Group 5 Test stat value Stat sign of difs Note on statistical test
Age mean
s.d.
Sex nF
%F
Other: (specify) mean s.d.
Other: (specify) mean s.d.
Other: (specify) mean s.d.
Other: (specify) mean s.d.
n/ a n/ a
Institute for Work & Health
Group Characteristics at Time 2 Give characteristics at Time 2 for the whole study sample and the study groups (information on one or both may be available). Tailor the column headings of the table to the study by: i) specifying any reported characteristics besides age and gender in the fields defaultlabeled “(specify)” that follow “Other”; ii) changing default labels “mean” and “s.d.” as needed (to “%”, “n”, etc.). Report results of any statistical tests of the differences in characteristics between study groups or the differences between characteristics at two time points by reporting test statistics and p-value/NS. Note type of statistical test used, including level of significance if specified. Give any other descriptive information about the comparability of the different study groups’ characteristics at Time 2 that has not already been included in the table. Give any other descriptive information about the comparability of the study groups at Time 2 vs baseline that has not already been included in the table.
n
Age mean
s.d.
Sex nF
%F
Other: (specify) mean s.d.
Other: (specify) mean s.d.
Other: (specify) mean s.d.
Other: (specify) mean s.d.
Total sample Group 1 Group 2 Group 3 Group 4 Group 5 Stat tests between gps Test stat n/ value a Stat sign of n/ difs a Note on statistical test Stat tests between Time 2 and Time 1 Test stat n/ value a Stat sign of n/ difs a Note on statistical test
A systematic review of the effectiveness of training & education for the protection of workers
127
Group Characteristics at Time 3 Give characteristics at Time 3 for the whole study sample and the study groups (information on one or both may be available). Tailor the column headings of the table to the study by: i) specifying any reported characteristics besides age and gender in the fields defaultlabeled “(specify)” that follow “Other”; ii) changing default labels “mean” and “s.d.” as needed (to “%”, “n”, etc.). Report results of any statistical tests of the differences in characteristics between study groups or the differences between characteristics at two time points by reporting test statistics and p-value/NS. Note type of statistical test used, including level of significance if specified. Give any other descriptive information about the comparability of the different study groups’ characteristics at Time 3 that has not already been included in the table Give any other descriptive information about the comparability of the study groups at Time 3 vs baseline that has not already been included in the table
128
n
Age mean
s.d.
Sex nF
%F
Other: (specify) mean s.d.
Other: (specify) mean s.d.
Other: (specify) mean s.d.
Other: (specify) mean s.d.
Total sample Group 1 Group 2 Group 3 Group 4 Group 5 Stat tests between gps Test stat n/ value a Stat sign of n/ difs a Note on statistical test Stat tests between Time 3 and Time Test stat n/ value a Stat sign of n/ difs a Note on statistical test
Institute for Work & Health
Group Characteristics at Time 4 Give characteristics at Time 4 for the whole study sample and the study groups (information on one or both may be available). Tailor the column headings of the table to the study by: i) specifying any reported characteristics besides age and gender in the fields defaultlabeled “(specify)” that follow “Other”; ii) changing default labels “mean” and “s.d.” as needed (to “%”, “n”, etc.). Report results of any statistical tests of the differences in characteristics between study groups or the differences between characteristics at two time points by reporting test statistics and p-value/NS. Note type of statistical test used, including level of significance if specified. Give any other descriptive information about the comparability of the different study groups’ characteristics at Time 4 that has not already been included in the table. Give any other descriptive information about the comparability of the study groups at Time 4 vs at baseline that has not already been included in the table.
n
Age mean
s.d.
Sex nF
%F
Other: (specify) mean s.d.
Other: (specify) mean s.d.
Other: (specify) mean s.d.
Other: (specify) mean s.d.
Total sample Group 1 Group 2 Group 3 Group 4 Group 5 Stat tests between gps Test stat n/ value a Stat sign of n/ difs a Note on statistical test Stat tests between Time 4 and Time Test stat n/ value a Stat sign of n/ difs a Note on statistical test
A systematic review of the effectiveness of training & education for the protection of workers
129
Group Characteristics at Time 5 Give characteristics at Time 5 for the whole study sample and the study groups (information on one or both may be available). Tailor the column headings of the table to the study by: i) specifying any reported characteristics besides age and gender in the fields defaultlabeled “(specify)” that follow “Other”; ii) changing default labels “mean” and “s.d.” as needed (to “%”, “n”, etc.). Report results of any statistical tests of the differences in characteristics between study groups or the differences between characteristics at two time points by reporting test statistics and p-value/NS. Note type of statistical test used, including level of significance if specified. Give any other descriptive information about the comparability of the different study groups’ characteristics at Time 5 that has not already been included in the table. Give any other descriptive information about the comparability of the study groups at Time 5 vs at baseline that has not already been included in the table.
130
n
Age mean
s.d.
Sex nF
%F
Other: (specify) mean s.d.
Other: (specify) mean s.d.
Other: (specify) mean s.d.
Other: (specify) mean s.d.
Total sample Group 1 Group 2 Group 3 Group 4 Group 5 Stat tests between gps Test stat n/ value a Stat sign of n/ difs a Note on statistical test Stat tests between Time 5 and Time Test stat n/ value a Stat sign of n/ difs a Note on statistical test
Institute for Work & Health
Interventions: Intervention descriptions
Contamination
Unplanned cointerventions Outcomes Study outcomes
Outcome descriptions
Describe interventions in study group, including: - the instructional method (including medium and any learning theories drawn upon) - basic training content - planned co-interventions (e.g. new equipment for all gps) - duration and frequency of training sessions - completeness of intervention implementation. Use hyphens as bullets to separate the components of the instructional method and the training content. Report any comments made about contamination or the lack of it. Provide any information about presence or lack of unplanned interventions. List the the study outcomes. They should correspond to the outcomes listed in QA.
Describe outcomes by identifying: - the construct measured - the measurement method (including instrument names, any modifications, illustrative items, response formats, who did the measurement, blinding, etc.) - the points in time when measurement took place - information on validity - informaiton on reliability.
G Instructional Method p
Basic Training Content
Planned co-interventions
Duration & Frequency
Implem entatio n
1 2 3 4 5
A= B= C= D= E= Outcome
Construct measured
Measurement method
When?
Validity
Reliability
A B C D E
A systematic review of the effectiveness of training & education for the protection of workers
131
Results & Analysis Effect Measures & Analysis – Outcome A
Enter raw effect data or derived effect data into their appropriate respective sections (usually only one type, but sometimes both types might be reported in the study). Tailor the column headings of the tables to the study by replacing the default labels from mean and s.d. to any more applicable measures of effect (e.g. %, counts, risk ratios) or variability (e.g. confidence interval, standard error). Report on any statistical tests on these data by including: - the name of the test - description of its particular application in the study (e.g. adjustment for covariates) - results, including the test statistic value and p-value if available (the Note column is available for any notes about which groups are being compared etc.) - descriptive statements providing further information on statistical results. Be clear about which groups or times are being compared when summarizing the results.
132
Outcome A: Raw effect data (e.g. means, %, counts) Gp Time 1 Time 2 Time 3 mean s.d. smpl mean s.d. smpl mean s.d. n n 1 2 3 4 5 Statistical test(s) on raw effect data Name of test: Description of test application: Time 1 Time 2 Time 3 Note Test pNote Test pNote Test stat value stat value stat value value value
smpl n
pvalue
Time 4 mean s.d.
Time 4 Note
Test stat value
TO CREATE MORE ROWS WITHIN SECTION, place cursor on last row, select from menus: Table>>Insert>>Rows Below.
Any further descriptive statements about results: Derived effect data (e.g., adjusted means, mean change, risk ratios, effect sizes) Gp Time 1 Time 2 Time 3 Time 4 adj. s.d. smpl adj. s.d. smpl adj. s.d. smpl adj. s.d. mean n mean n mean n mean 1 2 3 4 5 Statistical test(s) on derived effect data Name of test: Description of test application: Time 1 Time 2 Time 3 Time 4 Note Test pNote Test pNote Test pNote Test stat value stat value stat value stat value value value value
TO CREATE MORE SPACE WITHIN SECTION, highlight those rows you will not need, right-click to bring up menu, select Delete Cells>>Delete entire row.
Any further descriptive statements about results:
smpl n
pvalue
smpl n
pvalue
Time 5 mean s.d.
Time 5 Note
Test stat value
Time 5 adj. s.d. mean
Time 5 Note
Test stat value
Institute for Work & Health
smpl n
pvalue
smpl n
pvalue
Effect Measures & Analysis – Outcome B
Enter raw effect data or derived effect data into their appropriate respective sections (usually only one type, but sometimes both types might be reported in the study). Tailor the column headings of the tables to the study by replacing the default labels from mean and s.d. to any more applicable measures of effect (e.g. %, counts, risk ratios) or variability (e.g. confidence interval, standard error). Report on any statistical tests on these data by including: - the name of the test - description of its particular application in the study (e.g. adjustment for covariates) - results, including the test statistic value and p-value if available (the Note column is available for any notes about which groups are being compared etc.) - descriptive statements providing further information on statistical results. Be clear about which groups or times are being compared when summarizing the results. TO CREATE MORE ROWS WITHIN SECTION, place cursor on last row, select from menus: Table>>Insert>>Rows Below. TO CREATE MORE SPACE WITHIN SECTION, highlight those rows you will not need, right-click to bring up menu, select Delete Cells>>Delete entire row.
Outcome B: Raw effect data (e.g. means, %, counts) Gp Time 1 Time 2 Time 3 Time 4 mea s.d. smpl mean s.d. smpl mea s.d. smpl mea s.d. n n n n n n 1 2 3 4 5 Statistical test(s) on raw effect data Name of test: Description of test application: Time 1 Time 2 Time 3 Time 4 Note Test pNote Test pNote Test pNote Test stat value stat value stat value stat value value value value
Any further descriptive statements about results: Derived effect data (e.g., adjusted means, mean change, risk ratios, effect sizes) Gp Time 1 Time 2 Time 3 Time 4 adj. s.d. smpl adj. s.d. smpl adj. s.d. smpl adj. s.d. mea n mea n mea n mea n n n n 1 2 3 4 5 Statistical test(s) on derived effect data Name of test: Description of test application: Time 1 Time 2 Time 3 Time 4 Note Test pNote Test pNote Test pNote Test stat value stat value stat value stat value value value value
smpl n
pvalue
smpl n
pvalue
Time 5 mea s.d. n
Time 5 Note
Test stat value
Time 5 adj. s.d. mea n
Time 5 Note
Test stat value
Any further descriptive statements about results:
A systematic review of the effectiveness of training & education for the protection of workers
133
smpl n
pvalue
smpl n
pvalue
Effect Measures & Analysis – Outcome C
Enter raw effect data or derived effect data into their appropriate respective sections (usually only one type, but sometimes both types might be reported in the study). Tailor the column headings of the tables to the study by replacing the default labels from mean and s.d. to any more applicable measures of effect (e.g., %, counts, risk ratios) or variability (e.g. confidence interval, standard error). Report on any statistical tests on these data by including: - the name of the test - description of its particular application in the study (e.g. adjustment for covariates) - results, including the test statistic value and p-value if available (the Note column is available for any notes about which groups are being compared etc.) - descriptive statements providing further information on statistical results. Be clear about which groups or times are being compared when summarizing the results. TO CREATE MORE ROWS WITHIN SECTION, place cursor on last row, select from menus: Table>>Insert>>Rows Below. TO CREATE MORE SPACE WITHIN SECTION, highlight those rows you will not need, right-click to bring up menu, select Delete Cells>>Delete entire row.
134
Outcome C: Raw effect data (e.g. means, %, counts) Gp Time 1 Time 2 Time 3 Time 4 mea s.d. smpl mean s.d. smpl mea s.d. smpl mea s.d. n n n n n n 1 2 3 4 5 Statistical test(s) on raw effect data Name of test: Description of test application: Time 1 Time 2 Time 3 Time 4 Note Test pNote Test pNote Test pNote Test stat value stat value stat value stat value value value value
Any further descriptive statements about results: Derived effect data (e.g., adjusted means, mean change, risk ratios, effect sizes) Gp Time 1 Time 2 Time 3 Time 4 adj. s.d. smpl adj. s.d. smpl adj. s.d. smpl adj. s.d. mea n mea n mea n mea n n n n 1 2 3 4 5 Statistical test(s) on derived effect data Name of test: Description of test application: Time 1 Time 2 Time 3 Time 4 Note Test pNote Test pNote Test pNote Test stat value stat value stat value stat value value value value
smpl n
pvalue
smpl n
pvalue
Time 5 mea s.d. n
Time 5 Note
Test stat value
Time 5 adj. s.d. mea n
Time 5 Note
Test stat value
Any further descriptive statements about results:
Institute for Work & Health
smpl n
pvalue
smpl n
pvalue
Effect Measures & Analysis – Outcome D
Enter raw effect data or derived effect data into their appropriate respective sections (usually only one type, but sometimes both types might be reported in the study). Tailor the column headings of the tables to the study by replacing the default labels from mean and s.d. to any more applicable measures of effect (e.g. %, counts, risk ratios) or variability (e.g. confidence interval, standard error). Report on any statistical tests on these data by including: - the name of the test - description of its particular application in the study (e.g. adjustment for covariates) - results, including the test statistic value and p-value if available (the Note column is available for any notes about which groups are being compared etc.) - descriptive statements providing further information on statistical results. Be clear about which groups or times are being compared when summarizing the results. TO CREATE MORE ROWS WITHIN SECTION, place cursor on last row, select from menus: Table>>Insert>>Rows Below. TO CREATE MORE SPACE WITHIN SECTION, highlight those rows you will not need, right-click to bring up menu, select Delete Cells>>Delete entire row.
Outcome D: Raw effect data (e.g. means, %, counts) Gp Time 1 Time 2 Time 3 Time 4 mea s.d. smpl mean s.d. smpl mea s.d. smpl mea s.d. n n n n n n 1 2 3 4 5 Statistical test(s) on raw effect data Name of test: Description of test application: Time 1 Time 2 Time 3 Time 4 Note Test pNote Test pNote Test pNote Test stat value stat value stat value stat value value value value
Any further descriptive statements about results: Derived effect data (e.g., adjusted means, mean change, risk ratios, effect sizes) Gp Time 1 Time 2 Time 3 Time 4 adj. s.d. smpl adj. s.d. smpl adj. s.d. smpl adj. s.d. mea n mea n mea n mea n n n n 1 2 3 4 5 Statistical test(s) on derived effect data Name of test: Description of test application: Time 1 Time 2 Time 3 Time 4 Note Test pNote Test pNote Test pNote Test stat value stat value stat value stat value value value value
smpl n
pvalue
smpl n
pvalue
Time 5 mea s.d. n
Time 5 Note
Test stat value
Time 5 adj. s.d. mea n
Time 5 Note
Test stat value
Any further descriptive statements about results:
A systematic review of the effectiveness of training & education for the protection of workers
135
smpl n
pvalue
smpl n
pvalue
Effect Measures & Analysis – Outcome E
Enter raw effect data or derived effect data into their appropriate respective sections (usually only one type, but sometimes both types might be reported in the study). Tailor the column headings of the tables to the study by replacing the default labels from mean and s.d. to any more applicable measures of effect (e.g. %, counts, risk ratios) or variability (e.g. confidence interval, standard error). Report on any statistical tests on these data by including: - the name of the test - description of its particular application in the study (e.g. adjustment for covariates) - results, including the test statistic value and p-value if available (the Note column is available for any notes about which groups are being compared etc.) - descriptive statements providing further information on statistical results. Be clear about which groups or times are being compared when summarizing the results. TO CREATE MORE ROWS WITHIN SECTION, place cursor on last row, select from menus: Table>>Insert>>Rows Below. TO CREATE MORE SPACE WITHIN SECTION, highlight those rows you will not need, right-click to bring up menu, select Delete Cells>>Delete entire row.
136
Outcome E: Raw effect data (e.g. means, %, counts) Gp Time 1 Time 2 Time 3 Time 4 mea s.d. smpl mean s.d. smpl mea s.d. smpl mea s.d. n n n n n n 1 2 3 4 5 Statistical test(s) on raw effect data Name of test: Description of test application: Time 1 Time 2 Time 3 Time 4 Note Test pNote Test pNote Test pNote Test stat value stat value stat value stat value value value value
Any further descriptive statements about results: Derived effect data (e.g., adjusted means, mean change, risk ratios, effect sizes) Gp Time 1 Time 2 Time 3 Time 4 adj. s.d. smpl adj. s.d. smpl adj. s.d. smpl adj. s.d. mea n mea n mea n mea n n n n 1 2 3 4 5 Statistical test(s) on derived effect data Name of test: Description of test application: Time 1 Time 2 Time 3 Time 4 Note Test pNote Test pNote Test pNote Test stat value stat value stat value stat value value value value
smpl n
pvalue
smpl n
pvalue
Time 5 mea s.d. n
Time 5 Note
Test stat value
Time 5 adj. s.d. mea n
Time 5 Note
Test stat value
Any further descriptive statements about results:
Institute for Work & Health
smpl n
pvalue
smpl n
pvalue
Miscellaneous Cost of intervention:
Provide any available information about the cost of the intervention. Factors – quantitative Please report on any additional information quantitative evidence on factors related to training effectiveness, not already reported through the results summarized above. Factors – qualitative Please report on any noninformation quantitative information on factors related to training effectiveness, including anecdotal comments. Adverse effects Please report on any adverse effects of interventions. Author’s conclusions Summarize the author’s conclusions. Reviewer’s conclusions State whether you agree or disagree with author’s conclusions. Give reasons if you disagree. Other noteworthy Please provide any other information from the article that aids the overall interpretation of the study, but has not been captured in the QA or DE forms already. Is this the final version of DE? (Y/N)
A systematic review of the effectiveness of training & education for the protection of workers
137
Appendix G
Methodological quality: questionnaire item-level findings
Table A5: Summary of quality assessment items in four methodological domains from 22 randomized trial studies Response options (%) Yes
No
Unclear/ Not reported
33.3 26.7 57.8 34.1
0.0 6.7 11.1 11.4
66.7 66.7 31.1 54.5
58.3 22.2 71.1 13.3
0.0 20.0 0.0 8.9
41.7 57.8 28.9 77.8
24.4 91.1 82.2 53.3
62.2 6.7 4.4 13.3
13.3 2.2 13.3 42.2
Q21 stats appropriate
86.7
13.3
Q22 stats adjustment Q23 intention-to-treat
41.2 0.0
14.7 83.8
Domain 1 – Comparability of study groups Q6 randomization Q7 concealment Q8 baseline confounders Q9 withdrawals Domain 2 – Intervention implementation Q11 implementation Q12 contamination Q13 planned co-intervention Q14 unplanned co-intervention Domain 3 – Outcome measurement Q16 blinding Q17 method & timing same Q18 validity Q19 reliability Domain 4 – Statistical analysis
Not a response option 44.1 16.2
The unit of analysis was conceptually unique outcomes for each study. There were 45 outcomes from 22 studies. Some questions (#7, #9, #11, #21, #22, #23) included a “not applicable” option and these responses were excluded from the calculations.
138
Institute for Work & Health
Appendix H Methodological quality of the non-randomized trial studies
Table A6: Summary of methodological aspects of non-randomized trial studies
Authors Bauer et al. (2002) Gregersen et al. (1996) Held et al. (2001) Hong et al. (2004) Jeffe et al. (1999) Lueveswanij et al. (2000) Ray et al. (1997) Robertson & O'Neill (2003) Thorne et al. (2004) Vaught et al. (2004) Vela Acosta et al. (2005) MEDIAN
Initial study population sizea 94 4656 107 42 251 149 41 1135 191 83 152 149
Methodological assessmentsb 1
2
3
4
OVERALL
P P P P P P P N N P N P
P Y P P P P P P P Y P P
Y P P P Y Y N P Y Y P P
P Y Y Y P P P P P Y Y P
3 3 3 3 3 3 3 2 3 4 3 3
Initial population size refers to the initial size of the study population with respect to individual workers, with the exception of the Eklöf stuies where it refers to the workgroups. Where the distinction was permitted, this was the size of the study sample following exclusions on the basis of eligibility, initial inability to contact, initial refusal to participate, but before any loss of sample for reasons of non-response during measurement or withdrawal. Asterisks (*) indicate cases in which numbers were either estimated by the reviewers or were reported as approximate by the authors. The five methodological assessments correspond to summary questions (#10, #15, #20, #24, #26) in the quality assessment instrument (Appendix E). The first four questions asked reviewers whether they were confident that the potential for bias was minimized in each of four domains of internal validity: comparability of study groups (CSG); intervention implementation (II); outcome assessment (OA); statistical analysis (SA). Possible responses were Yes (Y), Partly (P) and No (N). The fifth overall assessment item asked: “What degree of confidence do you have that the study provides an unbiased estimate of the true effect of a specific training intervention in the initial study sample?” Possible responses were: 5 – high degree of confidence (very little or no bias is most likely); 4; 3 – medium degree of confidence (a moderate amount of bias is possible); 2; 1 – low degree of confidence (a large amount of bias is very likely). When the study involve multiple outcomes, the scores for the best quality outcome is reported.
a
A systematic review of the effectiveness of training & education for the protection of workers
139
Appendix I
Stakeholders providing feedback on either the research questions or the research findings Feedback on research questions Kiran Kapoor – Industrial Accident Prevention Association Monika Sharma – Industrial Accident Prevention Association Kim Grant – Ontario Service Safety Alliance Cathy Carr – Workplace Safety & Insurance Board Shannon Hunt – Electrical & Utilities Safety Association Feedback on research findings Chris Moore – Canadian Centre for Occupational Health and Safety Shannon Hunt – Electrical & Utilities Safety Association Kiran Kapoor – Industrial Accident Prevention Association Monika Sharma – Industrial Accident Prevention Association Vern Edwards – Ontario Federation of Labour Sue Boychuk – Ontario Ministry of Labour Kim Grant – Ontario Service Safety Alliance Sandra Miller – Ontario Service Safety Alliance Sue Daub – Workers Health and Safety Centre Tom Parkin – Workers Health and Safety Centre Carrie Boyle – Workplace Safety & Insurance Board Luisa Natarelli – Workplace Safety & Insurance Board
140
Institute for Work & Health