JBC Papers in Press. Published on January 15, 2004 as Manuscript M311532200
Intestinal Tumor Progression Is Associated with Altered Function of KLF5
Nicholas W. Bateman‡, Dongfeng Tan§, Richard G. PestellV, Jennifer D. Black‡, and Adrian R. Black‡¶
From the ‡Department of Pharmacology and Therapeutics and §Department of Pathology, Roswell Park Cancer Institute, Elm and Carlton Streets, Buffalo NY 14263 and theVDepartment of Oncology, Lombardi Cancer Center, Georgetown Medical Center, 3970 Reservoir Rd NW, Washington, DC 20057.
¶
To whom correspondence should be addressed:
Adrian R. Black, Ph.D. Department of Pharmacology and Therapeutics Roswell Park Cancer Institute Elm and Carlton Streets Buffalo NY 14263 Tel: (716) 845 3090 Fax: (716) 845 8857 email:
[email protected]
Running title: KLF5 and intestinal tumorigenesis
Copyright 2004 by The American Society for Biochemistry and Molecular Biology, Inc.
SUMMARY Krüppel-like transcription factors have been linked to cell growth regulation and tumorigenesis in a number of systems. In the intestinal epithelium, expression of KLF5 (IKLF/BTEB2) is limited to proliferating crypt cells, indicating a growth promoting role. Consistent with this role, we demonstrate that expression of KLF5 in non-transformed intestinal epithelial cells [ileal IEC-18 and Immorto-Min Colon Epithelial (IMCE) cells] enhances colony formation, cyclin D1 transcription, and cell growth. However, in contrast to these effects in non-transformed cells, KLF5 reduced colony number, failed to enhance cyclin D1 transcription, and was negatively correlated with cell growth in colon cancer cell lines. The relationship between tumor progression and KLF5 was further investigated using Rasmediated transformation of IEC-18 and IMCE cells as syngeneic models. Ras-transformation recapitulated differences in the effects of KLF5 on cell growth and cyclin D1 transcription, providing a direct link between intestinal tumor progression and altered function of KLF5. Ras-transformation also markedly downregulated KLF5; further analysis indicated that reduced expression of KLF5 mRNA and destabilization of KLF5 protein occur in intestinal tumors. Reduced levels of KLF5 mRNA were also detected in APCmin mouse and human familial adenomatous polyposis adenomas compared with normal crypt epithelium, indicating that downregulation of KLF5 is an early event in intestinal tumorigenesis in vivo. Collectively, these data indicate that intestinal tumor progression is associated with a change in the growth-related functions of KLF5 and that intestinal tumors downregulate KLF5 expression by multiple mechanisms.
2
INTRODUCTION Krüppel-like factors (KLFs1) constitute a family of Sp1-related transcription factors with over 20 identified members (for review and references see 1,2,3). Members of this family are characterized by a highly conserved C-terminal, three zinc finger DNA-binding domain which binds to GC-rich sequences with overlapping sequence specificities. In contrast to their DNA binding domains, the Nterminal transactivation domains are not conserved in this family; thus, individual family members can have different transcriptional properties. Furthermore, transcriptional effects of KLFs are contextdependent, with individual factors being transcriptional activators or repressors dependent on the promoter and cell type being examined. Consistent with the presence of GC-rich binding sites for KLFs in multiple promoters, increasing evidence indicates that this family plays a central role in the regulation of cell growth, differentiation and tumorigenesis (for review, see 1). The intestinal epithelium is among the most rapidly renewing tissues in the body (4). Normal homeostasis in the intestine requires tight regulation of epithelial cell growth and differentiation, and disruption of this regulation leads to a number of pathological changes including colon cancer. Two KLFs, KLF4 (also known as gut krüppel-like factor, GKLF, and epithelial zinc finger protein, EZF) and KLF5 (also known as basic transcription element binding protein 2, BTEB2, and intestine
1
Abbreviations used: APC, adenomatous polyposis coli; BTEB2, basic transcription element
binding protein 2; CMV, cytomegalovirus, EZF epithelial zinc finger protein; FAP, familial adenomatous polyposis; GAPDH, glyceraldehyde-3-phosphate dehydrogenase; GKLF, gut kruppellike factor; IKLF, intestine enriched krüppel-like factor; IMCE; immorto-min colonic epithelial; KLF, krüppel-like factor; LCM, laser capture microdissection; PKC, protein kinase C; PMA, phorbol 12-myristate 13-acetate; siRNA, short interfering RNA; RT-PCR, reverse transcriptionpolymerase chain reaction. 3
enriched krüppel-like factor, IKLF), appear to play a central role in the regulation of intestinal epithelial renewal in both the small intestine and colon. KLF4 is expressed mainly in the nonproliferating differentiating/differentiated cells of the upper crypt and villus/surface mucosa (5,6), suggesting that it is involved in post-mitotic events in this tissue. A role for this factor in negative growth regulation and differentiation is supported by the expression and actions of KLF4 in intestinal cell lines and other systems (e.g., 1,7,8-10). Furthermore, KLF4 has been implicated as a tumor suppressor in the intestine (6,10). In contrast to KLF4, KLF5 is expressed mainly in the proliferating cells of the crypt (11,12), suggesting that it plays a positive growth regulatory role in this tissue. A growth promoting role for KLF5 in the intestine is further indicated by the finding that KLF5 +/- mice have shorter crypts and villi (13). Findings in other systems also support a positive growth regulatory role for KLF5. For example, KLF5 is expressed in the proliferating cells of the skin and in activated vascular smooth muscle cells (14-17), and overexpression of KLF5 in NIH 3T3 fibroblasts leads to increased growth and loss of sensitivity to negative growth stimuli (18). While these studies point to a growth promoting role for KLF5 in the intestine, direct examination of the growth properties of KLF5 in normal intestinal (or other epithelial) tissues has not previously been reported. Here we provide the first direct evidence that KLF5 is growth promoting in non-transformed intestinal epithelial cells. We also demonstrate that, in contrast to its effects in non-transformed cells, KLF5 has growth inhibitory properties in colon tumor-derived cells and that intestinal tumorigenesis is associated with downregulation of KLF5. These differences in the properties of KLF5 could be recapitulated in syngeneic models of oncogenic transformation, indicating that tumor progression in the intestine is associated with a change in the function(s) of KLF5. Thus, KLF5 may have both growth promoting and tumor suppressive properties in this tissue.
4
EXPERIMENTAL PROCEDURES Plasmids and antibodies. The cyclin D1 promoter-reporter plasmid (cyclin D1-luciferase), containing the full length (-1745) cyclin D1 promoter driving expression of firefly luciferase has been described previously (19). The p21waf1/cip1 promoter-reporter plasmids (p21-luciferase) in which the full length p21waf1/cip1 promoter drives expression of firefly luciferase was provided by Dr X.-F. Wang, Duke University Medical Center, Durham, North Carolina (20). pRL-TK and pCMV-TK plasmids were from Promega Corporation, pBKCMV was from Stratagene and pEGFPN1 was from Clontech. pBKCMV-KLF5 contains the mouse KLF5 cDNA upstream of the CMV promoter and was provided by Drs. J.B. Lingrel and M.A. Wani, University of Cincinnati College of Medicine, Cincinnati, Ohio (12). pBabe-puro and pBabe-puro containing cDNA for activated Ha-Ras V12 (pBabe-Ras) were provided by Dr. A.W. Lin, Roswell Park Cancer Institute, Buffalo, NY (21). Anti-KLF5 antibody (anti-BTEB2) and blocking peptide were from Santa Cruz Biotechnology. Cell Lines and Tissue Culture. IEC-18 cells (CRL-1589), a non-transformed intestinal crypt cell line derived from rat ileum, were cultured as described (22). IEC-Babe and IEC-Ras cells were generated by transfection of IEC-18 cells with pBabe-puro or pBabe-Ras, respectively. Cells were then selected with puromycin and stable transfectants were pooled. Two independent sets of IEC-Babe and IECRas cells were generated in two separate parallel transfection/selection procedures. Non-transformed Immorto-Min Colon Epithelial (IMCE) cells and IMCE cells transformed by expression of v-Ha-Ras (IMCE-Ras cells) were obtained from Dr. R. Whitehead, Vanderbilt University, Nashville, Tenessee (23) and were maintained in DMEM medium containing 5 units/ml γ-interferon, 1 unit/ml insulin, 5 mM L-glutamine and 5% fetal bovine serum. Ward cells, derived from a dimethylhydrazine-induced rat colonic adenocarcinoma (24), were maintained in RPMI 1640, 10% fetal bovine serum, 25 mM Hepes, pH 7.4, 5 mM L-glutamine, 1 mM sodium pyruvate and 0.2% ITS-A mixture. DLD-1 cells (CCL-221), HCT-116 cells (CCL-247) and HCT-116b cells (25), derived from human colorectal 5
adenocarcinomas, were maintained in RPMI 1640, 10% fetal bovine serum and 5 mM L-glutamine. Cells were grown in a 5 % CO2 atmosphere at 37EC, except IMCE and IMCE-Ras cells which were grown at 33EC. Where indicated, PMA (10 µM in ethanol) was added at a final concentration of 100 nM for 8 h or MG132 (20 mM in dimethyl sulfoxide) was added to a final concentration of 20 µM for 6-8 h (control cells were treated with vehicle alone). Colony Formation Assays. IEC-18, Ward and DLD-1 cells (0.5-1 x 10⁵) were transfected in 6 well plates with 5 µg of pBKCMV-KLF5 or pBKCMV using 8 µl of Fugene 6 transfection reagent (Roche Diagnostic). IMCE and IMCE-Ras cells were transfected with 4 µg plasmid DNA using Lipofectamine 2000 (Invitrogen). After 24-48 h, cells were maintained in medium containing G418 (1.5 mg/ml for IEC-18 and 0.6 mg/ml for Ward and DLD-1, 1 mg/ml for IMCE and IMCE-Ras) prior to staining with 2% Methylene Blue/70% Methanol for quantitation/imaging of colonies. Reporter Gene Assays. Cells (0.5 x 10⁵) were transfected as above with 2 µg cyclin D1- or p21luciferase, 1 µg pRL-TK, and 2 µg pBKCMV or pBKCMV-KLF5. After 24 h, luciferase activity was assayed using the Luciferase Reporter Assay System (Promega).
Background luminescence
(determined using cells transfected without reporter plasmids) was subtracted from observed luminescence values and values were normalized to cell number. Fold change relative to control was calculated by dividing luminescence values for a particular reporter by the average luminescence obtained with that reporter in the presence of pBKCMV. Flow Cytometry. Subconfluent PMA-treated and control cells were stained with propidium iodide and cell cycle distribution was determined as described (22). Western Blotting. Cells were harvested with 1% SDS, 0.1 M Tris-HCl, pH 7.4, and 20 µg protein of extract was subjected to Western blot analysis and densitometric quantitation essentially as described (22). Membranes were probed with 2 µg/ml anti-KLF5 antibody or 2 µg/ml anti-KLF5 and 2 µg/ml blocking peptide. Equal loading in lanes was confirmed by Fast Green staining of membranes. 6
Apparent molecular weights were calculated from the migration of Kaleidoscope Prestained Standards (Bio-Rad). Northern analysis. Total cellular RNA was isolated using the RNAeasy system (Qiagen), separated on 1% agarose/formaldehyde gels and transferred to Nylon membrane as described (26). Integrity of RNA and equal loading was confirmed by ethidium bromide staining (26). Membranes were probed with randomly primed 32P-labeled KLF5 cDNA probe using Quickhyb solution (Stratagene) and visualized/quantified by phosphorimaging using the Storm 840/ImageQuant system (Amersham Biosciences). Short interfering RNA (siRNA)-mediated KLF5 downregulation. HCT116b cells (4 x 10⁴) were transfected with 1 µg siRNA using Lipofectamine 2000 according to the manufacturer’s recommendation and medium was changed after 4-6 h. For determination of KLF5 mRNA expression, cells were extracted in Trizol reagent (Invitrogen) and RNA was purified according to the manufacturer’s instructions. Levels of GAPDH, KLF5 and KLF4 in RNA samples were determined by RT-PCR used the Access RT-PCR system (Promega) as recommended. Reaction products were separated on 1.5 % agarose gels containing ethidium bromide, visualized using an AlphaImaging System (Alpha Innotech) and quantified with ImageQuant Software (Amersham Biosciences). For determination of effects on cell growth, cells were harvested by trypsinization at 48 h and 96 h after transfection and cell number was determined using a ZM model Coulter Counter. KLF5
siRNA
(sense
5'- AAGCUCACCUGAGGACUCAUU -3';
antisense
5'-
UGAGUCCUCAGGUGAGCUUUU-3') and control SEAP siRNA were produced using the SilencerTM siRNA
Construction kit (Ambion) as described (27). Oligonucleotides for RT-PCR were as follows: human KLF5 (TGCCATTTTCAGCCACCAGAGTGA, CGGGGGAAAGTAAGTGGCCTGTTG), human GAPDH (CCACCCATGGCAAATCCATGGCA,
TCTAGACGGCAGGTCAGGTCCACC),
CAAGTTCGTGCTGAAG, CGGGTGGCATGAGCTCTTGGTAAT).
7
and human KLF4 (CTGATGGG
Analysis of mRNA in normal intestinal epithelial crypt cells and adenoma cells. Human tissue was obtained from the Tissue Procurement Facility at RPCI. Pure cell populations from APCmin mouse or FAP tissues were procured using the Arcturus PIXCell II LCM system. Cells were dissected from hematoxylin- and eosin-stained 10 µm frozen sections using 15 µm diameter laser pulses at 25 Mv; 800-1200 pulses obtained ~ 2000-3000 cells. Only histologically intact intestinal epithelial cells or adenoma cells were microdissected, while other components in the sections, including non-crypt epithelium, stromal cells, endothelial cells and inflammatory cells were avoided. Thus, intestinal crypt samples contained only crypt cells while adenoma samples contained close to 100% neoplastic cells. For isolation of proliferating cells from APCmin mouse crypts, cells were dissected from only the lower-to-mid crypt and Paneth cells were avoided. RNA was purified using the RNA Micro Isolation kit (Stratagene) with DNase treatment [absence of contaminating DNA was confirmed by performing reverse transcription-polymerse chain reactions (RT-PCR) without reverse transcriptase]. RT-PCR was performed as above, except that reactions contained 0.5 µCi [α-32P]CTP. Reaction products were separated by 5% polyacrylamide gel electrophoresis and visualized/quantitated by phosphorimaging with the Storm 840/ImageQuant system (Amersham Biosciences). Amounts of sample in assays were adjusted to be within the linear range of the assay and to contain equivalent amounts of RNA [based on glyceraldehyde-3-phosphate dehydrogenase (GAPDH) expression]. Primers were as above or as follows: mouse KLF5 (CCATTTTCAGCCACCAGAGCGAGT,
ACGGGGGAAAATAAGTGGCCTGCT)
and mouse
GAPDH (GGCAAAGTGGAGATTGTTGC, AGCTCTGGGATGACCTTGC). Statistical analysis. Statistical analysis used the two-tailed student t test and p values < 0.05 were considered significant. Errors represent standard error.
8
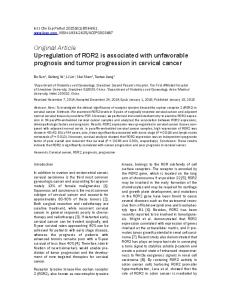
RESULTS KLF5 differentially affects colony formation in non-transformed and tumor-derived intestinal epithelial cells. The effects of KLF5 on cell growth in intestinal epithelial cells were examined in colony formation efficiency assays using IEC-18, Ward and DLD-1 cells, which represent non-transformed rat intestinal crypt cells (IEC-18) and intestinal tumor-derived cells of rat (Ward) and human (DLD-1) origin. Cells were transfected with either a control vector (pBKCMV), which expresses the neomycin/G418 resistance gene, or the same vector also expressing KLF5 (pBKCMV-KLF5), and their ability to form G418-resistant colonies was assessed. As can be seen from Fig.1, KLF5 expression in the non-transformed IEC-18 cells markedly increased the number of colonies obtained. In addition, colonies formed by KLF5-transfected cells were generally larger than those seen with control vector-transfected cells (Fig.1A), indicating that KLF5 overexpression enhanced the growth of IEC-18 cells. Similar results were obtained with the non-transformed colonic IMCE cells line (see below), indicating that KLF5 positively regulates growth in non-transformed cells of both small intestine and colonic origin. In contrast, KLF5 appeared to inhibit the growth of tumor-derived cells since transfection of Ward or DLD-1 cells with KLF5 led to a reduction in both the size and number of G418-resistant colonies obtained (Fig.1A,B). The differences in the effects of transfection with KLF5 expression vectors in normal and tumor-derived cell lines cannot be attributed to differences in plasmid preparations or transfection efficiency of individual cell lines because (a) data are from experiments in which IEC-18 cells and tumor-derived cells were transfected and selected in parallel, (b) multiple plasmid preparations were used for experiments, and (c) use of an enhanced green flourescent protein expression vector (pEGFPN1) indicated that the cell lines were transfected to similar extents (~30 % of cells) under the conditions used. To determine if differences in the expression of exogenous KLF5 could account for 9
these differences, IEC-18 and DLD-1 cells transfected with either the pBKCMV control vector or KLF5 expression vector were subjected to Western analysis with an antibody raised against a peptide from the N-terminal half of KLF5. The anti-KLF5 antibody detected two immunoreactive protein bands which were specific for KLF5 based on their increased levels in cells tranfected with KLF5 cDNA (Fig. 1C) and the reduced signal obtained in the presence of blocking peptide (see Fig. 2). In IEC-18 cells, the predominant band was ~65 kDa with a band at ~60 kDa sometimes detected, whereas in DLD-1 cells, the major band was at ~60 kDa with a faint band seen at ~65kDa (KLF5 was also detected at ~60 kDa in HCT-116 colon cancer cells, see below). The sizes for KLF5 seen here are in agreement with other studies that have detected KLF5 protein at 57-60 kDa in mouse and between 57 kDa and 66 kDa in different human cell lines (13,17,28). While control DLD-1 cells express lower levels of KLF5 than IEC-18 cells, the protein is expressed at comparable levels following transfection with KLF5 cDNA (Fig. 1C). This similar level of expression in KLF5-transfected cells likely reflects a balance between differences in KLF5 protein stability (higher in IEC-18 cells; see below) and CMV promoter activity (9.5 ± 0.6-fold higher in DLD-1 cells based on pCMV-TK activity). Transfection efficiency of these cells was estimated at ~30% using the enhanced green flourescent protein expressing vector (data not shown); thus, the observed levels of protein represent an ~3 to 4-fold higher expression of KLF5 in transfected IEC-18 and DLD-1 cells than in vector control IEC-18 cells. Collectively, these data demonstrate that differences in the expression of KLF5 cannot account for the differential growth effects of its overexpression in these cell lines. Thus, KLF5 enhances growth in non-transformed intestinal epithelial cells but inhibits the growth of tumor-derived intestinal cells.
KLF5 upregulates cyclin D1 promoter activity in IEC-18 cells but not in tumor-derived cells. To determine the transcriptional effects of KLF5 in non-transformed and tumor-derived intestinal cells, we analyzed its effects on the activity of the promoters for cyclin D1 and p21waf1/cip1. 10
These promoters were selected for analysis because (a) previously identified transcriptional targets of KLF5, such as KLF4 (29), are not expressed in proliferating intestinal epithelial cells; (b) cyclin D1 and p21waf1/cip1 play a critical role in intestinal epithelial cell growth regulation and are implicated in carcinogenesis (c.f. 22,30,31), and (c) although the effects of KLF5 on these promoters has not been reported, they have been shown to be regulated by other KLFs (c.f. 10). In IEC-18 cells, KLF5 expression enhanced cyclin D1 promoter activity (Fig. 1D). KLF5 also increased p21waf1/cip1 promoter activity in these cells, although the data did not reach statistical significance (Fig. 1D). In contrast, KLF5 expression did not enhance cyclin D1 or p21waf1/cip1 promoter activity in Ward or DLD-1 cells; indeed KLF5 significantly decreased cyclin D1 promoter activity in DLD-1 cells (Fig. 1D). Thus, consistent with its growth inhibitory effects, KLF5 inhibited or was unable to enhance cyclin D1 promoter activity in tumor-derived cell lines. As with colony survival studies, differences in effects of KLF5 on promoter activity cannot be attributed to differences in plasmid preparations, transfection efficiency, or KLF5 expression because IEC-18 cells and tumor-derived cells were transfected in parallel under conditions that gave similar levels of transfection, and multiple plasmid preparations were used for experiments.
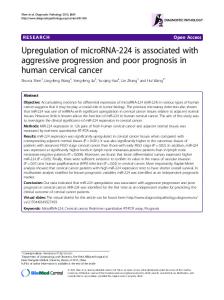
KLF5 protein expression is differentially regulated in IEC-18 and colon tumor-derived cells. We have previously reported that the phorbol ester, phorbol 12-myristate 13-acetate (PMA), induces a protein kinase C (PKC) α-mediated G1 and G2/M phase cell cycle arrest in IEC-18 cells (22,32). As shown in Fig. 2A, treatment of DLD-1 cells with PMA similarly decreased the proportion of cells in S-phase and increased the proportion in G2/M. Thus, although the effect in DLD-1 cells was somewhat less marked than that seen in IEC-18 cells [presumably reflecting the relatively low level of PKCα expression in intestinal tumor-derived cells (unpublished data and 22)], PMA treatment inhibits cell growth in both the non-transformed and tumor-derived intestinal epithelial cells. To test 11
the effects of PMA on expression of KLF5, IEC-18 and DLD-1 cells were treated with 100 nM PMA and subjected to Western blot analysis (Ward cells were not used in these experiments because they did not have detectable levels of KLF5 protein; data not shown). As noted above, proliferating IEC-18 cells had higher levels of KLF5 protein than proliferating DLD-1 cells (it should be noted that, since the levels of KLF5 in the non-transformed cells from which DLD-1 cells were derived is unknown, the relationship of this difference to the transformed phenotype cannot be determined). However, these two cell lines differed in the regulation of KLF5 expression in response to PMA-induced growth inhibition. Consistent with the positive correlation of KLF5 expression and cell growth in the normal intestinal epithelium, PMA treatment led to a 3 to 4-fold reduction (3.8 ± 0.7-fold, n = 4) in the level of KLF5 detected in IEC-18 cells (Fig. 2B). However, PMA treatment of DLD-1 cells led to a modest but consistent increase (1.7 ± 0.1 fold, n = 4) in the detection of KLF5 (Fig. 2B), indicating that its expression is negatively associated with growth in these cells (PMA similarly induced expression of KLF5 in HCT-116 and HCT-116b human colon cancer cells; see below). Thus, in addition to the differences in the effect of KLF5 expression on cell growth, non-transformed and tumor-derived intestinal epithelial cells also differ with regard to growth regulation of KLF5 protein expression.
Ras-mediated transformation of intestinal epithelial cells leads to altered growth related-properties of KLF5. The above data demonstrated that the growth-related properties of KLF5 differed between nontransformed intestinal epithelial cells and colon tumor-derived cells; thus, the link between oncogenic transformation and the properties of KLF5 was directly investigated using the ability of activated Ras to transform intestinal epithelial cell lines. Two syngeneic models were used to examine different aspects of KLF5 function. One consisted of non-transformed IMCE cells, derived from Immorto-Min mouse colonic epithelium, and IMCE-Ras cells, viral Ha-Ras transformed derivatives of IMCE cells: 12
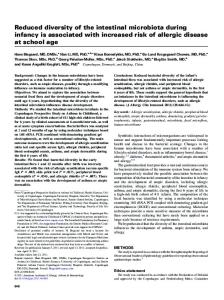
these cell lines have been extensively characterized with regard to oncogenic transformation (e.g., 23). The other consisted of IEC-18 cells transformed by expression of activated Ras. For this model, IEC18 cells were transfected with activated (V12) Ha-Ras expression vector (pBabe-Ras) or empty vector (pBabe-puro) and selected with puromycin. Properties of KLF5 were then compared in pooled populations of stable Ras-expressing (IEC-Ras) and control empty vector-containing (IEC-Babe) cells generated in parallel. The growth properties of IEC-Ras and IEC-Babe cells were consistent with the well characterized ability of activated Ras to transform IEC-18 cells (e.g., 33): IEC-Babe cells were contact inhibited for growth, consistent with a non-transformed phenotype, whereas IEC-Ras cells were not contact inhibited and could form multilayered cultures, consistent with a transformed phenotype (data not shown). As seen with IEC-18 cells, KLF5 enhanced colony formation in the non-transformed IMCE cells (Fig. 3A&B). However, KLF5 inhibited colony formation in IMCE-Ras cells (Fig. 3). These data are strikingly similar to those obtained with the colon tumor cell lines and indicate that Rasmediated transformation alters the growth-related properties of KLF5 in intestinal epithelial cells. IEC-Babe and IEC-Ras cells could not be used in colony survival assays since they showed altered responses to G418, presumably as a result of their prior selection with puromycin. Therefore, potential changes in the growth-related properties of KLF5 in these cells were assessed using cyclin D1 transcription assays. While, KLF5 enhanced cyclin D1 promoter activity in IEC-Babe cells, it had no significant effect in IEC-Ras cells. In this regard, IEC-Babe cells behave like the parental IEC-18 cells, whereas IEC-Ras cells behave like Ward colon cancer cells; thus, Ras-transformation of intestinal epithelial cells recapitulated differences between non-transformed cells and tumor cells with regard to the effects of KLF5 on cyclin D1 transcription (Fig. 1D). (IMCE cells were not used in these assays due to extremely low levels of cyclin D1 transcription.) IEC-Babe and IEC-Ras cells also differed with regard to the growth regulation of KLF5 expression. While PMA-induced growth arrest 13
was accompanied by a downregulation (2.4 ± 0.2-fold, n=6) of KLF5 protein in the control IEC-Babe cells, it had a minimal effect on KLF5 levels in IEC-Ras cells (1.2 ± 0.1-fold upregulation, n=6). Collectively, these data indicate that Ras-mediated transformation in syngeneic systems recapitulates differences in the growth-related properties of KLF5 seen in non-transformed and tumor-derived cells; thus, these differences can be attributed to effects of tumor progression.
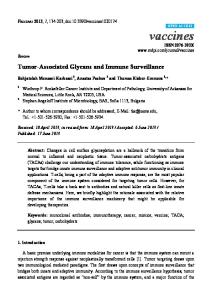
Transformation of intestinal epithelial cells is associated with downregulation of KLF5. While tumor-derived DLD-1 cells express lower levels of KLF5 protein than IEC-18 cells, this difference cannot be equated with tumor progression since the level of KLF5 in the nontransformed colon epithelial cells in the patient from which DLD-1 cells were derived is unknown. Therefore, levels of KLF5 protein were compared in control and Ras-transformed derivatives of IMCE and IEC-18 cells . As shown in Fig. 4A, although IMCE cells express low levels of KLF5 compared with IEC-Babe cells, the protein could be detected in both cell types. In contrast, KLF5 protein was barely detectable in the IMCE-Ras and IEC-Ras cells, indicating that transformation of these cells leads to downregulation of KLF5 expression. This downregulation was particularly marked in IECRas cells, which had an ~8-fold reduction in KLF5 protein expression compared with IEC-Babe cells. While Ras-transformation also led to substantial downregulation of KLF5 in IMCE cells, the levels of expression in these cells was too low to allow evaluation of the degree of this downregulation. IMCE-Ras cells showed a 2 to 4-fold downregulation of KLF5 mRNA relative to IMCE cells (Fig. 4A), indicating that downregulation of KLF5 in transformed intestinal epithelial cells can be mediated by loss of mRNA expression. Interestingly, while a modest (1.6 ± 0.1-fold, n=5) downregulation of KLF5 mRNA was also observed in IEC-Ras cells compared with IEC-Babe cells (Fig. 4), this effect was much less than that seen for the protein (8.4 ± 0.3-fold, n = 7), indicating that Ras-transformation also affected KLF5 expression through translational or post-translational mechanisms. Based on these 14
findings, potential alterations in protein stability were examined using the proteasome inhibitor, MG132. In control IEC-Babe cells, MG132 treatment led to a modest (10-fold in the IEC-Ras cells, restoring expression to levels close to those seen in IEC-Babe cells (Fig 4B). Thus, alterations in proteasomal degradation pathways appear to play a major role in the downregulation of KLF5 in Rastransformed IEC-18 cells (MG132 did not have a significant effect on KLF5 mRNA; data not shown). To test if this mechanism of regulation is relevant to human colon cancer, the effects of MG132 on KLF5 expression in DLD-1 and HCT-116 cells were compared with those in IEC-18 cells. Consistent with the results obtained with IEC-Babe cells, MG132 treatment led to a modest 90%) conserved between humans, mice and rats (www.ncbi.nlm.nih.gov/genome/guide/rat and 12,28), (b) although KLF5 was detected predominantly at one size in each cell line, bands corresponding to both molecular weights were detected in a given cell type, and (c) exogenously expressed protein co-migrated with the endogenous protein in different cell types. Differences in the size of in vitro-translated human KLF5 and the protein in cell extracts have been noted, further indicating that it is posttranslationally modified (17,28). Furthermore, the reported size of cellular human KLF5 ranges from 57-66 kDa, indicating that it may be differentially modified in different cell types. Recently, phosphorylation of KLF5 has been reported to affect its interaction with CBP/p300 (36), transcriptional coactivators implicated in carcinogenesis (37,38). Although it is tempting to speculate that alterations in posttranslational modification are responsible for the differences in KLF5 activity in non-transformed and tumor-derived intestinal cells, it should be noted that Ras-transformation of IEC-18 cells did not affect the apparent molecular weight of KLF5 seen following MG132 treatment. Whether the different sizes of KLF5 seen here reflect differences in posttranslational modification and how these differences relate to its altered regulation and activity in the different cell types is currently under investigation.
In addition to the data presented here, several other studies have indicated that KLF5 is modulated by phorbol esters. Phorbol esters have been shown to upregulate KLF5 mRNA levels and/or transcription in mammary, vascular smooth muscle and NIH 3T3 cells (13,18,39). This has led to the proposal that KLF5 is a direct target of PKC signaling; however, the opposing effects of 20
PMA in IEC-18 and tumor-derived/transformed cells indicates that, at least in the intestinal system, the actions of PMA may be secondary to its effects on cell growth. The precise relationship between KLF5, PKC signaling and cell growth status will require a more detailed analysis of the relationship between phorbol ester-induced downregulation of PKCs and their effects on cell growth in the various systems.
Evidence presented in this report indicates that KLF5 expression is downregulated by multiple mechanisms in intestinal tumors. Use of the proteasome inhibitor, MG132, indicated that KLF5 protein is destabilized in tumor-derived colon cancer cells and Ras-transformed IEC-18 cells. Rapid proteasomal degradation of transfected Gal4-KLF5 fusion proteins has recently been noted in endometrial carcinoma cells (36); thus, enhanced instability of KLF5 protein may be a common mechanism for the regulation of its expression in various tumor types. In addition to changes in protein stability, analysis of syngeneic colon cancer cell lines and patient samples indicated that intestinal tumor progression can be associated with downregulation of KLF5 mRNA, an effect also seen following Ras-transformation of IMCE cells. These mechanisms of downregulation can occur independently and sequentially during tumor progression since, (a) while the syngeneic HCT116 and HCT116b cells both showed destabilization of KLF5 protein, the levels of KLF5 mRNA are markedly lower in the more progressed HCT116 cells, and (b) in IMCE-Ras and IEC-Ras cells, KLF5 is downregulated predominantly by reduction of mRNA expression and destabilization of protein, respectively. The detection of two independent mechanisms for downregulation of KLF5 that can occur sequentially during tumor progression argues that KLF5 is a direct target for downregulation during intestinal tumor progression and that its reduced expression is not simply a byproduct of changes targeting other factors. Furthermore, use of siRNA against KLF5 indicated that reduced expression of KLF5 in HCT116b colon tumor cells leads to enhanced cell growth. By underscoring 21
the importance of reducing KLF5 expression for intestinal tumors, these data reinforce its role as an inhibitory factor in intestinal tumor progression.
Although, to our knowledge, the current study is the first to directly demonstrate a growth promoting role for KLF5 in non-transformed epithelial cells and to highlight alterations in this function during tumor progression, evidence suggests that similar changes may occur during tumor progression in other tissues. For example, although KLF5 appears to be associated with proliferating cells in all normal epithelial tissues examined, the human klf5 gene is located at chromosome 13q21, a region frequently deleted in cancers including those of the breast and prostate (40,41). Thus, KLF5 may have tumor suppressor properties in other epithelial cancer types. Indeed, reports published during preparation of this manuscript provide evidence that KLF5 is a potential tumor suppressor in breast and prostate cancer, where >70% of tumors show downregulation of KLF5 expression (37, 39). Several other KLFs, including KLF4, KLF6 and KLF10, have been implicated in tumor progression (1,42). By providing the first direct demonstration of a difference in the effects of KLF5 in normal and tumor-derived cells, the data presented in this report establish the idea that, not only can KLFs contribute to the development of tumors, but the role of a particular KLF can change during tumor progression.
Acknowledgments. The authors would like to thank Drs. M.A. Wani and J.B. Lingrel for the KLF5 expression vector, Dr. X.-F. Wang for the p21waf1/cip1 promoter vector, Dr. A.W. Lin for the pBabe-Ras vector, Dr. R. Whitehead for the IMCE and IMCE-Ras cells and Dr. M.G. Brattain for the HCT-116 and HCT-116b cells. The authors would also like to thank Dr. M.G. Brattain and Dr. D.W. Goodrich for critical reading of this manuscript and Dr. Alexander Bloch and Rosemary Bloch for their support. This research utilized core facilities supported in part by Roswell Park Cancer Institute’s NCI-funded 22
Cancer Center Support Grant, CA16056. Supported by the Roswell Park Alliance Foundation, the Mae Stone Goode Foundation, NIH grants DK54909 and DK60632, and Roswell Park Cancer Center core grant CA16056.
23
REFERENCES 1.
Black, A. R., Black, J. D., and Azizkhan-Clifford, J. (2001) J Cell Physiol 188, 143-160.
2.
Bieker, J. J. (2001) J Biol Chem 276, 34355-34358
3.
Kaczynski, J., Cook, T., and Urrutia, R. (2003) Genome Biol 4, 206
4.
Burgess, A. W. (1998) Philos Trans R Soc Lond B Biol Sci 353, 903-909
5.
Shields, J. M., Christy, R. J., and Yang, V. W. (1996) J Biol Chem 271, 20009-20017
6.
Shie, J. L., Chen, Z. Y., O'Brien, M. J., Pestell, R. G., Lee, M. E., and Tseng, C. C. (2000) Am J Physiol Gastrointest Liver Physiol, G806-814.
7.
Stone, C. D., Chen, Z. Y., and Tseng, C. C. (2002) FEBS Lett 530, 147-152
8.
Katz, J. P., Perreault, N., Goldstein, B. G., Lee, C. S., Labosky, P. A., Yang, V. W., and Kaestner, K. H. (2002) Development 129, 2619-2628
9.
Chen, Z. Y., Shie, J. L., and Tseng, C. C. (2002) J Biol Chem 277, 46831-46839
10.
Dang, D. T., Pevsner, J., and Yang, V. W. (2000) Int J Biochem Cell Biol 32, 1103-1121.
11.
Ohnishi, S., Laub, F., Matsumoto, N., Asaka, M., Ramirez, F., Yoshida, T., and Terada, M. (2000) Dev Dyn 217, 421-429
12.
Conkright, M. D., Wani, M. A., Anderson, K. P., and Lingrel, J. B. (1999) Nucleic Acids Res 27, 1263-1270
13.
Shindo, T., Manabe, I., Fukushima, Y., Tobe, K., Aizawa, K., Miyamoto, S., Kawai-Kowase, K., Moriyama, N., Imai, Y., Kawakami, H., Nishimatsu, H., Ishikawa, T., Suzuki, T., Morita, H., Maemura, K., Sata, M., Hirata, Y., Komukai, M., Kagechika, H., Kadowaki, T., Kurabayashi, M., and Nagai, R. (2002) Nat Med 8, 856-863
14.
Watanabe, N., Kurabayashi, M., Shimomura, Y., Kawai-Kowase, K., Hoshino, Y., Manabe, I., Watanabe, M., Aikawa, M., Kuro-o, M., Suzuki, T., Yazaki, Y., and Nagai, R. (1999) Circ Res 85, 182-191 24
15.
Hoshino, Y., Kurabayashi, M., Kanda, T., Hasegawa, A., Sakamoto, H., Okamoto, E., Kowase, K., Watanabe, N., Manabe, I., Suzuki, T., Nakano, A., Takase, S., Wilcox, J. N., and Nagai, R. (2000) Circulation 102, 2528-2534.
16.
Ogata, T., Kurabayashi, M., Hoshino, Y. I., Sekiguchi, K. I., Kawai-Kowase, K., Ishikawa, S., Morishita, Y., and Nagai, R. (2000) Transplantation 70, 1653-1656.
17.
Sur, I., Unden, A. B., and Toftgard, R. (2002) Eur J Cell Biol 81, 323-334
18.
Sun, R., Chen, X., and Yang, V. W. (2001) J Biol Chem 276, 6897-6900
19.
Watanabe, G., Albanese, C., Lee, R. J., Reutens, A., Vairo, G., Henglein, B., and Pestell, R. G. (1998) Mol Cell Biol 18, 3212-3222
20.
Datto, M. B., Yu, Y., and Wang, X. F. (1995) J Biol Chem 270, 28623-28628
21.
Lin, A. W., and Lowe, S. W. (2001) PNAS 98, 5025-5030
22.
Frey, M. R., Clark, J. A., Leontieva, O., Uronis, J. M., Black, A. R., and Black, J. D. (2000) J Cell Biol 151, 763-778.
23.
D'Abaco, G., Whitehead, R., and Burgess, A. (1996) Mol. Cell. Biol. 16, 884-891
24.
Ward, J. M., Yamamoto, R. S., Weisburger, J. H., and Benjamin, T. (1973) J Natl Cancer Inst 51, 1997-1999
25.
Brattain, M. G., Marks, M. E., McCombs, J., Finely, W., and Brattain, D. E. (1983) Br J Cancer 47, 373-381
26.
Black, A. R., and Dolnick, B. J. (1996) Cancer Res 56, 700-705
27.
Aizawa, K., Suzuki, T., Kada, N., Ishihara, A., Kawai-Kowase, K., Matsumura, T., Sasaki, K., Munemasa, Y., Manabe, I., Kurabayashi, M., Collins, T., and Nagai, R. (2004) J Biol Chem 279, 70-76
28.
Shi, H., Zhang, Z., Wang, X., Liu, S., and Teng, C. T. (1999) Nucleic Acids Res 27, 4807-4815
25
29.
Dang, D. T., Zhao, W., Mahatan, C. S., Geiman, D. E., and Yang, V. W. (2002) Nucleic Acids Res 30, 2736-2741
30.
Weinstein, I. B. (2000) Carcinogenesis 21, 857-864
31.
Sherr, C. J., and Roberts, J. M. (1999) Genes Dev. 13, 1501-1512
32.
Clark, J. A., Black, A. R., Leontieva, O. V., Frey, M. R., Pysz, M. A., Kunneva, L., Woloszynska-Read, A., Roy, D., and Black, J. D. (2003) J Biol Chem In Press
33.
Rak, J., Mitsuhashi, Y., Sheehan, C., Tamir, A., Viloria-Petit, A., Filmus, J., Mansour, S. J., Ahn, N. G., and Kerbel, R. S. (2000) Cancer Res 60, 490-498
34.
Brattain, M. G., Fine, W. D., Khaled, F. M., Thompson, J., and Brattain, D. E. (1981) Cancer Res 41, 1751-1756
35.
Ko, T. C., Yu, W., Sakai, T., Sheng, H., Shao, J., Beauchamp, R. D., and Thompson, E. A. (1998) Oncogene 16, 3445-3454
36.
Zhang, Z., and Teng, C. T. (2003) Nucl. Acids. Res. 31, 2196-2208
37.
Muraoka, M., M., K., Kikuchi-Yanoshita, R., Tanaka, K., Shitara, N., Chong, J., Iwama, T., and Miyaki, M. (1996) Oncogene 12, 1565-1569
38.
Goodman, R. H., and Smolik, S. (2000) Genes Dev. 14, 1553-1577
39.
Ziemer, L. T., Pennica, D., and Levine, A. J. (2001) Mol Cell Biol 21, 562-574
40.
Chen, C., Bhalala, H. V., Qiao, H., and Dong, J. T. (2002) Oncogene 21, 6567-6572
41.
Rozenblum, E., Vahteristo, P., Sandberg, T., Bergthorsson, J. T., Syrjakoski, K., Weaver, D., Haraldsson, K., Johannsdottir, H. K., Vehmanen, P., Nigam, S., Golberger, N., Robbins, C., Pak, E., Dutra, A., Gillander, E., Stephan, D. A., Bailey-Wilson, J., Juo, S. H., Kainu, T., Arason, A., Barkardottir, R. B., Nevanlinna, H., Borg, A., and Kallioniemi, O. P. (2002) Hum Genet 110, 111-121
26
42.
Narla, G., Heath, K. E., Reeves, H. L., Li, D., Giono, L. E., Kimmelman, A. C., Glucksman, M. J., Narla, J., Eng, F. J., Chan, A. M., Ferrari, A. C., Martignetti, J. A., and Friedman, S. L. (2001) Science 294, 2563-2566
27
FIGURE LEGENDS
Fig. 1. Effect of KLF5 on colony formation and growth-related gene transcription in normal and tumor-derived intestinal cell lines. (A) IEC-18, Ward and DLD-1 cells were transfected with either pBKCMV (Vector) or pBKCMV-KLF5 (KLF5) and selected with G418 before being fixed and stained. (B) The relative number of colonies obtained with pBKCMV (Vector)- and pBKCMV-KLF5 (KLF5)-transfected cells (on average, vector-transfected Ward and DLD-1 cells yielded 1.8 ± 0.2-fold and 2.7 ± 0.5-fold more colonies than vector-transfected IEC-18 cells, respectively). Data are the average of 3 independent experiments. ** Significantly different from Vector control (p < 0.03). (C) IEC-18 and DLD-1 cells were transfected with pBKCMV (-) or pBKCMV-KLF5 (+) and harvested for Western analysis with anti-KLF5 antibody after 24 h. Arrows to the right indicate the apparent molecular weight of specific KLF5 immunoreacive bands. Numbers under the figure represent the relative amounts of KLF5 in different samples as estimated by densitometric analysis. (D) IEC-18, Ward or DLD-1 cells were co-transfected with either pBKCMV (Vector) or pBKCMV-KLF5 (KLF5), pRL-TK, and either the cyclin D1 (Cyclin D1) or p21waf1/cip1 (p21)-firefly luciferase plasmid and reporter gene expression was determined after 24 h. Firefly luciferase expression is presented as the fold difference from cells transfected with pBKCMV. Consistent with the increased expression of cyclin D1 in colon tumors, relative luciferase readings in vector transfected IEC-18, Ward and DLD-1 cells were 1, 2.3 ± 0.8 and 22 ± 10, respectively. ** Significantly different from Vector control (p < 0.03).
Graphed data are the average of at least 3 independent experiments, other data are
representative of 3 (A) and 2 (C) independent experiments.
Fig. 2. Effect of PMA on cell growth and KLF5 levels. (A) Cell cycle analysis of cells treated with 100 nM PMA or vehicle (Control) for 8 h. Plots show DNA content (x-axis) against number of events 28
(y-axis) obtained by flow cytometric analysis of propidium iodide-stained IEC-18 and DLD-1 cells. Numbers represent the percentage of cells in G1, S and G2/M phase, estimated using Modfit software. (B) Western blot analysis of extracts (20 µg protein) from IEC-18 and DLD-1 cells treated with 100 nM PMA (+) or vehicle (-) for 8 h. Blots were probed with anti-KLF5 antibody (i) or anti-KLF5 plus the blocking peptide (ii) and visualized by chemiluminescence. Arrows indicate the migration and apparent molecular weights of specific KLF5 immunoreactive proteins. Data are representative of 4 independent experiments
Fig. 3. Effects of KLF5 in Ras-transformed intestinal epithelial cells. (A) The indicated cells were transfected with either pBKCMV (Vector) or pBKCMV-KLF5 (KLF5) and selected with G418 before colonies formed were visualized by methylene blue staining. (B) Relative number of colonies obtained with pBKCMV (Vector)- and pBKCMV-KLF5 (KLF5)-transfected IMCE and IMCE-Ras cells (on average, vector-transfected IMCE-Ras cells yielded 2.8 ± 0.3-fold more colonies than vectortransfected IMCE cells). Data are the average of 3 independent experiments. ** Significantly different from control vector (p < 0.05). (C) IEC-Babe and IEC-Ras cells were co-transfected with either pBKCMV (Vector) or pBKCMV-KLF5 (KLF5) and the cyclin D1-firefly luciferase plasmid and reporter gene expression was determined after 24 h. Firefly luciferase expression is presented as the fold difference from cells transfected with pBKCMV. Consistent with the ability of Ras to induce Cyclin D1 promoter activity, luciferase readings were 3-7-fold higher on average in IEC-Ras than IEC-Babe cells. Data are the average of 5 independent experiments. ** Significantly different from Vector control (p < 0.05).
29
Fig. 4. Downregulation of KLF5 expression in transformed intestinal epithelial cells. (A) Upper panel: Western blot analysis of extracts (20 µg protein) from the indicated cells probed with antiKLF5 antibody. Middle panel: Northern analysis of KLF5 mRNA. Bottom panel: Ethidium bromide staining of 28 S RNA in the samples shown in the Middle panel. (B) IEC-Babe and IEC-Ras cells were treated with 20 µM MG132 (+) or vehicle (-) for 6 h and cell extracts (20 µg protein) were subjected to Western blot analysis for KLF5 protein. (C) Western blot analysis of KLF5 protein expression in IEC-18, DLD-1 and HCT-116 cells treated with 20 µM MG132 (+) or vehicle (-) for 6 h. (D) Western blot analysis of KLF5 protein expression in IMCE and IMCE-Ras treated with 20 µM MG132 (+) or vehicle (-) for 6 h. Data are representative of at least 3 independent experiments (experiments involving IEC-Babe and IEC-Ras cells were also performed with two independent sets of transfectants). Arrows indicate the migration of KLF5 species identified in Fig 1.
Fig. 5. KLF5 expression in HCT-116 and HCT-116b cells. (A) IEC-118, HCT-116 and HCT116b cells were treated with vehicle (C), MG132 (MG) or PMA (PMA) as indicated and total cellular protein was subjected to Western analysis for KLF5. (B) Total cellular protein and RNA from subconfluent cultures of HCT-116 and HCT-116b cells were subjected to Western and Northern analysis, respectively. Upper panel:. Western analysis of protein from the indicated cells probed with anti-KLF5 antibody. Middle panel: Northern analysis of total cellular RNA from the indicated cells probed with 32P-labeled KLF5 cDNA. Bottom panel: Ethidium bromide staining of 28 S RNA in the samples shown in the Middle panel. (C) HCT116b cells were transfected with siRNA corresponding to secreted alkaline phosphatase (-) or human KLF5 (+) mRNA, cellular RNA was extracted 48 and 72 h later and levels of KLF5 and KLF4 were detected by RT-PCR. (D) HCT116b cells, plated at equal density, were transfected with Control (secreted alkaline phosphatase) or KLF5 siRNA and cell number was determined after 48 and 96 h. Data show the increase in cell growth over this time and 30
are averages (± s.e.) of 2 independent experiments. ** Cell number at 96 h significantly different from control (p < 0.03).
Fig. 6. RT-PCR analysis of laser capture microdissected normal crypt epithelial cells and adenoma cells. (A) Cells from APCmin mouse adenomas (Adenoma) and epithelial cells from the proliferation zone of adjacent normal intestinal crypts (Lower Crypt) were collected by laser capture microdissection and RNA was isolated. RT-PCR was performed in the presence of [α-32P]CTP using primers specific for mouse KLF5 or GAPDH, and products were separated by 5% polyacrylamide gel electrophoresis and visualized by phosphorimaging. (B) Cells from FAP adenomas (Adenoma) or adjacent crypt epithelium (Normal Crypt) were isolated and analyzed as in (A) using primers for human KLF5 or GAPDH. Numbers under the figures, derived from phosphorimaging analysis, represent expression of the indicated RNA in adenomas relative to that in normal crypt mucosa, normalized to expression of GAPDH.
31
Bateman et al.
Figure 1 A.
IEC-18
DLD-1
Ward
C.
IEC-18
DLD-1
-
+
-
1.0
1.56
KLF5 ~65 kDa ~60 kDa
Vector
0.53 1.53
D.
KLF5
Relative colonies
2.5
Vector KLF5
**
2
1.5 1
**
**
0.5 0
IEC-18 Ward DLD-1
Fold Activity
2.5
B.
+
**
2.0
Cyclin D1 + Vector Cyclin D1 + KLF5 p21 + Vector p21+ KLF5
1.5
**
1.0 0.5 0
IEC-18
Ward
DLD-1
Bateman et al.
Figure 2 A.
Control
PMA
G1 = 55% S = 27% G2/M = 16%
G1 = 72% S = 2% G2/M = 26%
G1 = 38% S = 31% G2/M = 31%
G1 = 42% S = 15% G2/M = 43%
IEC-18
DLD-1
B. PMA ~65 kDa ~60 kDa
i. Anti-KLF5
ii. Anti-KLF5 + peptide
IEC-18
DLD-1
IEC-18
DLD-1
-
-
-
-
+
+
+
+
Bateman et al.
Figure 3 A.
IMCE
IMCE-Ras
C.
Fold Activity
2
Vector
**
Vector KLF5
1.5 1
0.5
KLF5
0
Relative colonies
B. 2
**
Vector KLF5
1.5
**
1 0.5 0
IMCE
IMCE-Ras
IEC-Babe IEC-Ras
Bateman et al.
Figure 4 A. IM
CE
IM
CE
s Ra
s be Ba -Ra C C IE IE
KLF5 protein KLF5 mRNA 28 S RNA
B.
IEC-Babe IEC-Ras MG132
-
+
-
+
KLF5
C.
MG132
IEC-18
DLD-1
-
-
+
+
HCT-116
-
KLF5
D.
IMCE MG132 KLF5
-
+
IMCE-Ras
-
+
+
Bateman et al.
Figure 5 A.
IEC-18 MG PMA
C
C
HCT-116b MG PMA
C
HCT-116 MG PMA
KLF5
B.
b 16 16 -1 -1 T T HC HC KLF5 protein KLF5 mRNA 28 S RNA
48 h +
siRNA -
KLF5 GAPDH KLF4
72 h - +
D. 3.0 2.5 2.0 1.5 1.0 0.5 0
**
Cells x 10-4
C.
Control siRNA
KLF5 siRNA
Bateman et al.
Figure 6
Lo w Ad er C en ry om pt a
No rm Ad al en Cr Ad om ypt en a 1 om a2
A. APCmin mouse samples B. FAP patient samples
KLF5
KLF5
GAPDH
GAPDH
Relative expression in adenoma KLF5 = 0.17
Relative expression of KLF5 Adenoma 1 = 0.47 Adenoma 2 = 0.23