Human Gait Characterization using Kinect Kale Moyano, Raquel Curs 2014-2015
Director: Xavier Binefa Valls GRAU EN ENGINYERIA BIOMÈDICA
Tre b a l l d e Fi de G ra u
“In the middle of difficulty lies opportunity” Albert Einstein
TABLE OF CONTENTS
ABSTRACT .................................................................................................................. 2 PROJECT STRUCTURE .............................................................................................. 3 INTRODUCTION .......................................................................................................... 4 THEORETICAL BACKGROUND ............................................................................... 4 CHAPTER 1: ABOUT MICROSOFT KINECT SENSOR ....................................... 4 CHAPTER 2: GAIT CYCLE AND ITS ANALYSIS ................................................. 6 PROBLEM FORMULATION .................................................................................... 12 STATE OF ART .......................................................................................................... 13 METHODOLOGY ....................................................................................................... 15 PART 1- FIRST STEPS ....................................................................................... 15 PART 2- KINEMATIC GAIT ANALYSIS USING KINECT ..................................... 19 PART 3- GAIT ANALYSIS OF THE GROUND REACTION FORCES .................. 25 RESULTS AND DISCUSSION.................................................................................... 30 CONCLUSIONS ......................................................................................................... 38 FUTURE WORK ......................................................................................................... 39 REFERENCES ........................................................................................................... 39 ACKNOWLEDGEMENTS ........................................................................................... 43 APPENDIX ................................................................................................................. 44
1
ABSTRACT Gait analysis has become a widely used tool to evaluate and assess the human locomotion, aiding to identify and characterize movement disorders from the population. The increasing interest in gait analysis together with the recent development of new technologies has led the progress of the devices and techniques used in motion analysis, providing new opportunities in human motion characterization. In this project, the potential use of Kinect as a tool for gait analysis is presented with the aim to provide reliable information of human motion using this single device, avoiding the use of expensive motion capture systems and strict laboratory conditions usually used for this type of analysis. This project proposes a set of algorithms to effectively extract the gait features of interest, in terms human motion (kinematics) but also in terms of forces (kinetics) during gait. This part has been one of the most challenging analysis in the project, as at a glance, seems impossible to obtain human forces using a camera. The results obtained have been compared to those obtained with the gold standard equipment and similarities between both approaches indicate that the goal has been positively achieved. These findings encourage even more the use of this technology as an alternative when no equipment or laboratory conditions are available. The information acquired in this project with Kinect sensor could have of great interest to characterize the human gait in two major application fields: sports and healthcare. On one hand, in sports context, these measurements could have an impact in the improvement of the performance during running, contributing to give useful information to exhibit the good technique and correct posture; hence, achieving the maximum efficiency in the performance. On the other hand, in clinical field, these measurements could help to deeply understand how our movement during locomotion can lead to increase the risk of injuries. Specifically, common incidence of injuries such as knee pain, back pain and stress fracture can be analyzed with the results provided in this project.
2
PROJECT STRUCTURE Since this project cover different topics about biomechanics and engineering, two introductory chapters has been firstly presented with the aim to provide the reader prior knowledge and necessary background. Specifically, the first chapter is devoted to the basic concepts about Kinect technology, whereas the second chapter deals with biomechanics science of human motion, defining the basic concepts of the cycle gait, its analysis, and the related implication in the clinical area. After these introductory chapters, a review in the literature about the concepts that deals this project has been presented. This part is devoted to acquire background knowledge of the development of the techniques used in gait analysis. Subsequently, the methodology used in this project has been exposed. The development of the project has been divided into three main parts. The first one is devoted to the first experiments performed in order to familiarize with the device as it was completely new for me. These initial experiments consist of color, depth and skeletal data acquisition with Kinect and also data preprocessing (skeleton visualization, filtering, etc). The second part has deals with the characterization and analysis of gait, specifically a standard spatio-temporal and other kinematic feature extraction. Whereas this second part is essentially dedicated to the study of human movement, the last part of the project is dedicated to study the human forces that produce that movement, through a kinetic analysis using two approaches. After the methodology, results are presented and discussed. Subsequently, some conclusions are highlighted and useful thoughts for future work are exposed. An Appendix has been included. It has been divided in three main parts, corresponding to important sections in the project but tedious to explain in the methodology.
3
INTRODUCTION THEORETICAL BACKGROUND
CHAPTER 1: ABOUT MICROSOFT KINECT SENSOR 1.1. The device Microsoft Kinect is a novel depth sensor released by Microsoft for Xbox 360 which allows to be used as a motion capture system. This device consist on an infrared sensor (IR) and infrared projector, a RGB (three channel color) camera, a tilt motor and a microphone array for voice recognition (Figure 1).
Figure 1: Microsoft Kinect Sensor and its components (http://www.opensourceforu.com/2012/02/open-source-setsmicrosofts-kinect-free/)
Firstly, Kinect sensor was developed only for game industry as interactive device between console/PC-player with the aim to build more realistic experiences to the users. This interaction is achieved through gestures and voice commands in real time, without the need for a game controller. However, recently to its development, Kinect’s impact has extended far beyond the gaming industry by its innovative sensing technology behind, drawing the attention of researchers from other fields (computer science, electronic engineering, and robotics, etc) and confirming in this sense the potential that Kinect has in wide range of application areas [1], [2].
1.2. Skeleton Tracking using Kinect Microsoft Kinect sensor provides two data channels that allows to capture color and depth images simultaneously, with a 640 x 480-pixel resolution and at a rate of 30 fps (frames per second) [1], [3]. In addition to the color and depth data acquisition, Microsoft developed skeleton tracking functionality for the Kinect sensor in order to enable the body motion capture. To allow the skeleton tracking, the sensor requires the depth data of the user’s body.
Specifically, the
algorithm behind consists of two- stage process: first the depth skeleton map is computed and, secondly, the sensor’s algorithm infers an intermediate body parts representation in a colorcoded way (Figure 2) by means of machine learning algorithms (randomized decision forest algorithms). Subsequently, the algorithm recognizes these colors and its locations and, by
4
applying the mean shift algorithm and these body parts are transformed into a skeleton representation by its body segments and joints [4], [5].
Figure 2: Depth Image of a Human Body [5]
-
Depth Accuracy and Resolution
In order to achieve a properly functionality of the device, it is important to consider the potential sources of error and data imperfection of the depth acquisition. In those applications in which a high reliability of the captured data is required, this type of errors must be identified and corrected. A great part of these errors are produced intrinsically by inaccuracies of the device, being unknown and unpredictable. The other type of errors are produced by the environment influences and the measurement setup [3], [6]. These errors may occur for different scene conditions such as lighting environment, shadows or occlusions, and mainly can be avoided following the proper instructions. Moreover, according to the specifications, the operating range to properly functioning sensor measurements is between 0.40 m to 4 m. The random error produced intrinsically in the device mentioned above increases when distance from any point to sensor is increasing, leading to low resolution depth measurements [3].
1.3. Application Areas: “Microsoft Kinect as a novel tool in Virtual Healthcare” Virtual reality technology of Kinect has had impact on the development of tools in the healthcare. Some of these applications lie on physical therapy and rehabilitation, contributing to assess and improve body posture, balance and coordination of rehabilitation patients in a home environment. It also has a special interest in elderly people, specifically in balance and assessing falls risk [7]–[10]. Kinect sensor also plays an important role in the clinical research of many disorders. At the present, an in-going project carry out by researchers at the University of Minnesota's Institute of Child Development in Minneapolis is studying the potential of Microsoft Kinect to early detect signs of autisms in children, through sensing its motion responses and capabilities. Another recent study have reported the use of Kinect sensor as a potential tool for Parkinson’s disease
5
patients with the aim of improving and re-training the movement function (mobility, posture and balance) [8]. On the other hand, it also has an impact in the advances of clinical diagnosis and medical imaging areas. Three studies have reported the development of controller-free systems to exploring medical images interactively using Kinect. This novel navigation system provides a practical, efficient and fast exploration using only hand gestures, facilitating in this sense the task for clinicians to browse without the need for DICOM viewers and interfaces and without having to touch any control in PC (touchless interfaces), sometimes a time-consuming activity. Furthermore, developers are attempting to create “surgeon’s GPS” in order to manipulate and navigate in medical images through gestures while maintain the sterility of operating room objects [11].
CHAPTER 2: GAIT CYCLE AND ITS ANALYSIS 2.1 Gait Terminology: Gait Cycle and its Events Gait cycle is the term applied to describe the simplest form of human locomotion. The cycle consists of sequential and rhythmic movements of body limbs and trunk, resulting in a forward progression of our body. As gait cycle represents a repetitive sequence of walking events, the cycle is defined that occur between two consecutive occurrences of the same event (Figure 3). Although any event could be chosen to define the cycle, by definition is convenient to take as the cycle beginning when one foot hits the ground and complete the cycle when same foot contacts again with the ground [12].
Figure 3: The Gait Cycle and its events Gait cycle is divided into two major phases: stance and swing. The stance phase is referred to the period in which the foot is in contact with the ground, and comprises the first 62% of the entire cycle. On the other hand, the swing phase comprises the remaining 38% of whole cycle and corresponds to the phase in which the foot does not touch the ground, being in this moment
6
suspended on the air and moving forward in order to induce limb advancement in the locomotion. During gait cycle, double-foot support and single-foot support phases can be also distinguished. Double support corresponds to the period in which both feet are in contact with the ground and this occurs twice during a complete gait cycle (at the beginning and at the end of the stance phase). On the other hand, single-foot support period occurs when there is only one foot in contact with the ground supporting all the body weight load, and takes place twice during cycle gait as well [12][13]. The swing and stance phases are further subdivided into seven distinct events, where the stance period comprises the four first subphases and the reimagining three corresponds to the swing period (Figure 4).
GAIT CYCLE SWING (38%)
STANCE (62%) Initial Contact (0%)
Flat Foot
Mid Stance
(0-10%)
(10-30%)
Terminal Stance (3050%)
Pre-Swing (50-60%)
Initial Swing
Mid Swing
(60-73%)
(73-87%)
Terminal Swing (87100%)
Figure 4: Representation of the timing of each gait event
These phases are briefly described as follows[13],[14]:
Initial Contact or Heel Strike (0%) – Initial contact is commonly referred to as heel strike event. It is the starting point of the gait cycle, where the heel contacts with the ground. In reality, heel strike corresponds to an instant, not a phase.
Foot flat or Loading response (0-10%) – Subsequently, the toe comes down towards the ground, having both heel and toe on the floor, exhibiting flat foot and a stable support base for the body. It corresponds to the first period of double-foot support.
Mid-stance (10-30%) – It begins the single-support and is referred to the period in which the body advances over this stationary foot (body alignment).
Terminal stance or heel off (30-50) – It completes the single-support period. The heel starts to rise from the ground, and the toe pushes off from the ground to propel body weight to move forward, preparing for the limb advancement.
Pre-swing or Toe-off (50-62%) – Corresponds to the final event of the stance and with the second period of double-foot support. Ends when the foot leaves the ground, being the toe the last point of contact with the ground (for that reason is sometimes called toeoff event).
7
Initial Swing (62-73%) – Corresponds to the first third period of the swing phase and begins when the toe completely leaves the ground (foot clearance)
Mid-swing (73-87%) – It comprises the middle of the swing and the main goal of this phase is the forward advancement of the accelerated limb (leg).
Terminal Swing (87-100%) – The limb advancement is completed and before heel strike. It corresponds to the end of the swing phase, hence, with the end of a cycle gait and the beginning of the next cycle.
Run Cycle The cycle gait during running presents several differences in comparison with walking. The most important of them is the duration of the stance and swing phases: in running, the period where the foot is in contact with the ground is shorter, having a higher proportion of the gait cycle in swing phase. Due to this fact, in running there is no period in which both feet are on the ground (double-support); in contrast, it exhibits a period, called double-float, in which neither feet are in contact with the ground [15].
2.2 Gait Analysis The analysis of human gait can be divided into two major categories, namely, kinematics and kinetics [13]. 2.2. 1. Kinematic Gait Analysis Kinematics refers to the study and description of the human motion (gait displacements, velocities and accelerations of body joints and segments) without consideration of its causes[13][16]. Kinematic gait analysis usually uses different type of systems (laboratory equipment) and wide variety of sensors and in order to capture the motion data, such as accelerometers, gyroscopes, and magnetoresistive sensors[13].
It is important to note that the kinematic analysis described below has been reduced only to the necessary knowledge of the content of the project. Most simply gait analysis has been carried out to obtain the spatial and temporal parameters: cycle time, stance time, swing time, step length, stride length and stride time, cadence and gait velocity [17], briefly defined in the following points: o
Cycle Time or Stride Time – Duration of one gait cycle (amount of time spent it takes to complete one stride, where STRIDE = CYCLE)
o
Stance Time – Stance phase duration of the reference lower limb. It includes single support and double support, and takes the first 62% of the total cycle time.
8
o
Swing Time – Swing phase duration of the reference lower limb. It takes the remaining 38% of the cycle time.
o
Step Length – Distance between the point of heel contact (initial contact) of one foot and the point of initial contact of the opposite foot
o
Stride Length – Distance between two consecutive heel contacts of the same foot
o
Cadence – Number of steps taken by unit time. Usually measured as step/min
o
Velocity – Gait distance by unit time. Usually measured in km/h or m/s.
Other kinematic gait variables has been selected and described below due its importance in the project: the body center of mass and the joint rotation during gait.
Center of Mass The center of mass is considered an essential physical concept [18]. In the human body, the center of mass is defined as the physical point around which the volumetric mass distribution is balanced. In that point, the body mass is focused or concentrated for some purposes; in this case, for locomotion. Its location depends on the body posture and also on the physical features of each individual but when the subject is standing upright (with a normal pose of the limbs) the center of mass is always located approximately at the center of the torso of the body [4]. The goal of gait is to move body forward from one point to another in space. This fact leads to a forward trajectory of the body center of mass in a certain direction, velocity and acceleration [19]. This results in a up and down rhythmic and sequential movement in a range of 4-5 cm (Figure 5), exhibiting two maximum points reached in single-foot support gait events and the lowest points in double support events [20].
Figure 5: The vertical displacement of the center of mass during the gait. Modified Image from “Kinesiology Scientific Basis of Human Motion, 12th Edition by Hamilton, Nancy, Luttgens
Specifically, vertical displacement of the center of mass during locomotion is an important variable in gait analysis; it provides information about the gait efficiency and it also can be used as a complement indicator of pathological or abnormal gait [21].
9
Joint Angles Intersegmental lower limb joint angles are important variables in kinematic gait analysis. These angles describe joint ranges of motion and its characterization in gait analysis gives powerful information related with the injury risk. For example, when the limit of the flexion range is exceeded, the probability of get injured increases [13], [16], [22]. In this study, the angle from the knee has been analyzed in detail, as it corresponds of one of the features with more interest for the project purposes. During normal gait cycle, two knee flexions and extensions are produced. For that reason, the knee motion is commonly called “double knee action”[23]. Although there is a normal range for the joint motion, knee rotation is a gait feature highly variable across individuals, so that many people have a knee rotation that characterizes its specific gait style. [24].
2.2.2. Kinetic Gait Analysis Kinetics focuses on the study of internal and external forces (and moments) acting on our body which effects produce the displacements and movements of body segments [13]. These forces include ground reaction force, body weight force, force momentum and muscle force, etc. [25] . Due to the importance of our interactions with the ground during locomotion in the generation and modulation of our movements , kinetic measurements have largely focused on the ground reaction forces, being considered the most important external force acting on the body [19], [13]. According to Newton’s 3rd Law, (Reaction Law) for every action there is an equal and opposite reaction (Figure 6). With this, a definition of the ground reaction force arises: The ground reaction force (GRF) is the force exerted by the ground on a body in contact with it. This reaction force supplied by the ground in a vertical direction is equal in magnitude and opposite in direction to the force that the body exerts on the supporting surface through the foot [19].
COM
Body Weight
Vertical GRF Figure 6: Vertical component of the Ground Reaction Force depicted schematically together with the Body Weight force
In the analysis of the ground reaction forces, it is important to take into account the way in which way the foot strikes (hits) the ground. Foot strike pattern term has been defined to describe it. There are three well-known ways to collide with the ground (Figure 7) during locomotion: rear-
10
foot, mid-foot and fore-foot strike, in which the first contact with the ground is made with the heel, with the mid-point of the foot (the foot lands flat) and with the distal part of the foot, respectively.
Figure 7: Different ways in which the foot can hits the ground (footstrike pattern). Image from "Should We Heel Strike When We Walk?"June 18, 2012 by James Speck
The gold standard device for the measurement of the ground reaction forces are force plates, equipment present in gait laboratories [19] and its study provides useful information in gait assessment, being of special interest as an indicator of pathological gait and risk of injuries [26], [27]. Specifically, the most important features extracted from the ground reaction force data that has been identified to predict the occurrence of injuries are the magnitude of the force and the value of the loading rate parameter, which represents the speed at which the forces are applied in our body [26] [28].
3. GAIT ANALYSIS AND ITS MAIN APPLICATION AREAS -
Clinical Context
In a clinical context, the main goal of gait analysis is to provide quantitative measures that characterize the degree of gait disorder of an individual. The data extracted in gait analysis has been reported to be of special interest in the evolution of diseases such as multiple sclerosis or Parkinson (neurological diseases), heart disease, strokes, physiological diseases caused by ageing, etc. (as all these conditions the gait is clearly affected). In this sense, gait analysis provides potential information for clinicians. [29]. It is important to note that gait analysis is used as an evaluation tool of an already diagnosed movement disorder, not as a diagnostic tool. Despite of this fact, through complete kinematic and kinetic measurement and description of gait characteristics may aid to the early identification of movement disorders [29], [30]. -
Sports Context
The applicability of gait analysis in the sports training field is two-fold: it can be used to increase the efficiency for performance improvement and, on the other hand, to analyze how the risk of injuries during the performance can be effectively prevented [13].
11
PROBLEM FORMULATION Gait analysis has become a widely used tool for the study of human locomotion and the management of movement disorders. In the recent years, there has been a special interest of specialists and researchers among several branches of medicine and sports such as rehabilitation and orthopedics. However, major disadvantages of gait analysis suppose important limitations in terms of cost, space and time. The high cost and availability of the gait analysis equipment together with the complexity of the set up in a laboratory environment, has evolved to the recent development of new cost-effective technologies such as Kinect as a powerful alternative for gait analysis purposes. This project aims to explore the recent development and optimization of novel sensing technology of Kinect and the applicability of captured data in gait analysis. Kinect sensor provides an alternative to capture gait data easily and rapidly, without the requirement of high cost equipment and without laboratory setting, overcoming in this line the limitations regarding the cost, the time and the space of conventional gait analysis techniques. The main goal of the project has been to provide a simple characterization of human motion during gait only using Kinect sensor, through the acquisition and data analysis of segment skeleton displacements and velocities to perform the analysis described in the introduction. Essentially, the first part of project has focused on an analysis to extract kinematic gait variables such as the center of mass and the knee angle during locomotion, considered features of special interest. Because of its importance during gait, a great part of this project also has been focused on the study of ground reaction forces. As they are traditionally measured only with force platforms in gait laboratories, one of the main challenges has been to estimate or predict the ground reaction forces using only the Kinect device.
The final target of the project has been reached by combining the results obtained in kinematic and kinetic gait analysis together with key aspects of the individuals' technique and/or style in walking and running, with the aim of provide useful information that could effectively characterize the gait into its two major fields of application (clinics and sports).
12
STATE OF ART A standard gait analysis is traditionally performed in specialized locomotion laboratories, due to it requires a wide variety of expensive devices such as complex multi-camera motion capture systems and wide variety of sensors such as accelerometers, gyroscopes, magnetoresistive sensors, force sensors, electromagnetic tracking systems, etc. In addition to the use of this expensive equipment, it implies strict and controlled laboratory setting that in some cases can influence the naturalness of the subject’s movement. In order to mitigate these limitations, in the recent years has been growing the use of wearable sensors as an alternative for gait analysis methods. These approaches relies on attach motion sensors such as accelerometers on the predefined landmarks of the subject’s body, in order to measure its motion characteristics during gait performance. These techniques use lesser expensive equipment and do not require laboratory environments [13], [29], [31], [32]. Although wearable sensors present advantages respect to the traditional gait analysis methods, they still requiring for using markers/sensors to capture the human motion, are time-consuming and sometimes are subjected to inaccuracies due to marker occlusions or marker displacement from its defined landmark. For that reason, with the development of new technologies, markerless-based methods have gained an increasing interest and have been started to be potentially used in biomechanics studies [32]. These systems offer attractive solutions to overcome the limitations described above. Several studies has been dedicated to characterize the reliability of marker-less captured data as comparison with the data determined with traditional marker based systems (gold standard). One of the most used markerless-based motion capture technologies is the Microsoft Kinect Sensor [32] [33], [34], [35]. Although it was first developed only for game industry, its innovative sensing technology has lead Kinect to become in a novel and cost-effective portable technology that allows to capture the movement without the need for a complex set-up of equipment neither to attach markers to the body’s subject [16], [36], [37]. Advantages in other dimensions of the cycle gait analysis have been also reported in the previous literature. Several studies analyzed the use of treadmill gait analysis versus the overground gait analysis. The use of this training equipment contributes to overcome the limitation of the space in the laboratories and allows more efficient motion data capture, as the subject is stationary in a controlled small area. It also allows to capture larger amounts of gait data [38]. As the captured gait data contains more than one cycle gait, an exhaustive analysis of gait generally requires that the gait data are temporally segmented into its gait cycles. Several studies in the previous literature have proposed algorithms to automatically partition the motion data. A great part of these studies reported that the gold standard for determining time events is based the data obtained of the ground reaction forces from force plates [39]. However, this method increases dramatically the cost and furthermore limits the number of cycles available for the analysis. Other techniques have been proposed in the literature to estimate the
13
gait events from the motion capture data from markers or motion sensors such as gyroscopes, and the subsequently application of algorithms that automatically determine the timing based on the limb displacement, velocity or acceleration of that data [40]–[42]. The extraction of important parameters beyond spatio-temporal measures during locomotion such as the human center of mass also has been reported in the previous literature [18], [43] [39], [44]. There has been an increasing interest to extract this feature, because the sinusoidal vertical displacement of the center of mass during locomotion plays an important role in the characterization of normal and abnormal gait and its analysis. Several studies computed this feature using different methods; specifically, in [43], a comparison different techniques frequently used to estimate this feature has been presented. The first method consists on the “body segmental analysis”. It consists on compute the individual center of mass of each segment that forms the full body and through a weighted sum, the whole body center of mass is estimated. In order to make possible this method, accurate and complete anthropometric data from the body is needed [43]. The second technique reported for the center of mass estimation is based on the double-integration of the ground reaction forces (obtained with force platform in biomechanical laboratory) through computations based on Newton’s Second Law [21], [43]. There are other methods less accurate to estimate center of mass trajectory: these are the techniques that use markers in sacrum, pelvis or trunk to estimate it, making assumptions maybe imprecise and/or unsophisticated in abnormal gait [21], [27], [43]. Several concepts about the previous literature regarding the second part of the project (the force analysis) have to be exposed. The analysis of the forces during gait focused on the ground reaction forces has given rise to a great number of studies. Almost all of them have reported that the gold standard device for the measurement of the ground reaction forces are the force platforms [19], [20], [27]. However, as they are stationary sensors, the measurements are limited to one single stride (low volume of gait data to analyze). In order to overcome this limitation, some studies has reported the ground reaction forces using an instrumented treadmill devices (by placing two force platforms under a treadmill), allowing to successively measure these ground forces during multiple gait cycles, useful for gait evaluation [31], [45]. As this instrumentation is expensive and need for a laboratory environment, few articles, [27], [46], [47], reported other techniques to carry out the analysis without the need of platforms: using position data obtained from motion capture systems. In order to obtain the position data, motion capture markers can be used, but it also requires laboratory setting. For that reason, the newest costeffective technique for capturing positional data is a markerless motion capture system, and in this project it has been done using Kinect sensor. The method aims to estimate vertical ground reaction force using the acceleration of the center of mass, obtained by the double differentiation of positional data of the center of mass tracking in each frame with Kinect and then, by simply using the relation between forces and acceleration (Newton’s 2n Law) [46].
14
METHODOLOGY The first part of the methodology has been devoted to the first experiments performed to familiarize with the device. Secondly, the experiments proposed for human gait characterization have been divided in two major parts. The first part has been dedicated to the motion analysis using Kinect sensor, whereas in the second chapter the analysis performed is devoted to the study of the forces (kinetics), specifically the ground reaction forces during the gait. This kinetic study has been carried out using two different approaches: the gold standard of the force platforms in a gait laboratory and the proposed estimation using Kinect, in order to compare the predicted results with the gold standard.
PART 1- FIRST STEPS Kinect as a 3D motion capture system in Matlab environment Several initial experiments have been carried out in order to become familiar with Kinect device used in this project. These experiments included the acquisition of color, depth and skeletal data captured with the device, data pre-processing and data visualization. These initial tests have been an essential requirement to understand and to proceed with the project. Microsoft Kinect sensor allows to acquire the captured data in a mathematical environment of Matlab R2014a (The MathWorks, Natick, MA, USA), through the use of Image Acquisition Toolbox. This tool provides a direct interconnection between the device and the software, allowing a user friendly environment for acquire images and videos, visualize, analyze and develop processing algorithms, and facilitating the management with the tracked data without the need of other computer languages.
Device Connection
Enable Color and Depth Streams
Device configuration and capture preview
Image Data Acquisition
Turn on the Skeletal Tracking
Visualization and preprocessing of Skeletal Data
Figure 8:Workflow for skeleton data acquisition using Kinect in MATLAB
Color and Depth Data Acquisition The first steps, hence, have been to install the Image Acquisition Toolbox and subsequently connect the device to the PC through an USB port (Device Connection). As it has been mentioned above, the Kinect for Windows has two sensors, the color sensor and the depth sensor. In the toolbox environment both data streams are treated independently as separated devices. Once the inputs for the acquisitions are created, the next steps have been to set up the
15
parameters for the acquisition (number of frames, etc.) and activate the necessary mechanisms to trigger or start the device. When the acquisition is properly terminated, depth and color data is acquired. As it has been mentioned in the introduction, the device is able to capture 30 frames in a second, and each of these frames consists of a matrix of 640x480 pixels of resolution. The depth images obtained (Figure 9), contains the information about the distance of each point of the scene to the sensor, giving a third dimension that a single color frame is not able to capture.
Figure 9: Depth Frame acquired with Kinect. The colorbar represents the distance from each point of the scene to the sensor, showing in red the far points and in blue the points more close to the sensor
In order to capture a good quality data, Kinect specifications have been taken into account. The most important is to ensure that the scene or subject of interest lie within the detection range of the sensor. A simple test has been proposed in order to demonstrate how the distance affects to the data resolution. To perform this test, a single depth frame from a scene has been firstly acquired (Figure 9). The procedure has been based on the definition of the resolution, being the resolution the smallest difference between adjacent pixels. The result of the accuracy test effectively shows that as the distance from the Kinect sensor increases, the resolution is getting coarser (Figure 10).
Figure 10: Resolution of the device
These specifications are important to take into account because, in almost all applications, a specific resolution range is required in order to obtain reliable results.
16
Ground Plane Detection Several studies (almost all from the robotics field) have reported the importance to develop algorithms to estimate the ground in a single frame (Figure 9) [48]–[51]. In this project a ground plane detection algorithm using depth information acquired with Kinect sensor has been proposed to approximate its 3D reconstruction in a single scene (frame). As this part deviates from the actual objectives of the project, the main goal of this part has been to manipulate and familiarize the data captured and Matlab programming tasks to proceed with the project (for example, to do three dimensional reconstructions from scenes captured with Kinect, Figure 12). Ground plane detection could have a particular interest for gait applications, as it allows to have a fixed reference, aiding to better determination of the events of foot contact with the ground, in the initial contact phase, and exactly knowing when and how the feet start to rise from the ground, in the toe-off phase, to start the swing. The ground plane detection also allows for determine the ground features that can destabilize the subject and affect the steps in gait when there is an uneven ground, in this way contributing to alter the magnitude and the direction of the ground reaction forces applied to the body when that appears when individuals hit the ground. Moreover, ground plane detection contributes to extract gait features important in kinematic analysis, such as the projection of the estimated body center of mass to the ground. The methodology followed has been explained step by step in the Appendix, Part 1.
Figure 11: Ground plane estimation in 2D space
Figure 12: Three-dimensional ground plane reconstruction
17
Skeleton Data Acquisition As it has been mentioned, skeleton data is acquired from the object of the depth device, so that depth data acquisition is needed to enable the skeleton tracking. Subsequently, several parameters that configure the mode of tracking have been defined before start the acquisition. The result of skeletal tracking is a human representation by 20 points corresponding to the body joints; each of these joints being represented by its 3D coordinates (Figure 13).
Figure 13: Visualization of the skeleton tracking in a single frame captured with Kinect
nº 1 2 3 4 5 6 7 8 9 10 11 12 13 14 15 16 17 18 19 20
Joint name Head Shoulder center Shoulder right Shoulder left Elbow right Elbow left Wrist right Wrist left Hand right Hand left Spine Hip center Hip right Hip left Knee right Knee left Ankle right Ankle left Foot right Foot left
Table 1: Representation of the joints provided by Kinect
Each frame captured with Kinect returns only the 3D positions (represented in red circles in Figure 13) as virtual markers representing body joint centers.
Data visualization and pre-processing Some pre-processing has been needed in order to obtain the entire skeleton visualization (Figure 13). Specifically a connection map that links each joint to build the body segments has been carried out. When the subject is turned sideways, some body parts are occluded by the rest of the body, the tracking algorithm is able to infer these occluded body joints, through a surrounding-joint context, but sometimes these inferences are poor, giving rise to these errors that has been mentioned in the introduction. As the skeleton data corresponds to the data of interest for project, a proper data pre-processing strategies and algorithms for joint data filtering has been proposed. The method used has been relied on identify the “outlier” values of the joint data obtained with Kinect. In statistics, an outlier is a sample point that is distant from the other observations, and may indicate the presence of experimental errors; in this case, primarily caused by the intrinsic body tracking algorithm. The method is explained step by step in the Appendix, Part 2.
18
PART 2- KINEMATIC GAIT ANALYSIS USING KINECT Participants Ten healthy participants were recruited to perform the experiments of this first part. All the volunteers gave its main physical information regarding the age, weight and height. This information is presented anonymously in Table 2. All the participants were aged between 21 and 24 years old and they are almost equally partitioned between genders. PARTICIPANTS
Gender
Age
Weight
Height
(kg)
(m)
Subject 1
F
22
52
1.72
Subject 2
M
22
63
1.76
Subject 3
F
22
50
1.62
Subject 4
M
24
85
1.82
Subject 5
F
21
52
1.67
Subject 6
M
21
65
1.76
Subject 7
F
21
51
1.66
Subject 8
F
23
55
1.69
Subject 9
M
22
70
1.81
Subject 10
M
21
64
1.75
Table 2: Main physical features of the participants collected for the experiments
In order to enrich even more this part of the project, a database used in [35] has been provided by Virginia O. Andersson (Federal University of Pelotas, Brasil). This database consists of a complete skeleton data of 166 healthy participants. Those subjects with incomplete physical data (gender, age, body mass and height, Table 3) have been discarded because body weight information is required in several parts of the analysis; essentially for the center of mass estimation. Min
Median
Max
AGE
17
21
45
HEIGHT [m]
1.5
1.74
2
WEIGHT [kg]
45
70
120
BODY MASS
15.99
23.191
39.635
INDEX GENDER
From 112 subject dataset: 39 females, 73 males
Table 3: Main physical features from the data base provided (166 healthy subjects)
19
Set Up and Data Collection -
Treadmill Experiments
The tests for the kinematic analysis part have been carried out in four different centers that dispose of treadmills; specifically in ETSEIB Biomechanic Laboratory (Universitat Politècnica de Catalunya, Barcelona), Eurofitness UBAE Can Dragó (Sant Andreu, Barcelona), CEM Marítim (Vila Olímpica, Barcelona) and in Cardiology Department at Vall d’Hebron University Hospital. It has been used the same set-up for carry out the tests at the four centers. The Kinect sensor was placed perpendicular to the treadmill, providing a sagittal view of the subject. The sagittal plane ensures to capture the data in an efficient manner for the posterior analysis. Furthermore, the Kinect was located at approximately 2-3 meters of distance from the subject, which allows to capture the data within the range of specification for Kinect sensor. Good lighting conditions were also ensured.
Once everything was set-up and the subject was prepared to perform the tests, the data collection procedure started. In order to acquire the Kinect captured data in mathematical software so that then it can be directly processed and analyzed, Image Acquisition Toolbox in Matlab has been used as a direct interconnection between the device and the software. Before proceeding to collect the data, a Matlab algorithm was created to enable a suitable skeleton tracking, allowing for the pre-selection of the acquisition parameters such as the number of frames that were acquired in the test. In the vast majority of tests, 600 to 800 frames were captured. Taking into account that Kinect captures data at 30 frames per second, the average range duration in the acquisitions were 20-40 seconds.
Volunteers were asked to perform several tests on a treadmill. They were first asked to walk at different gait speeds; slow walk (4 km/h) and fast walk (5.5 km/h). After these two tests subjects were asked to run at its preferred speed in order to avoid discomforts during the test, commonly at 8-10 km/h.
-
DATABASE Experiments
In the tests performed in this study, 166 healthy volunteers were instructed to walk in a semicircular trajectory while a spinning dish with the Kinect sensor was recording the scene. Each subject carried out five round trip walk from side to side to the room and in a free-cadence walk way [35].
20
Data Analysis All the data analysis has been performed in Matlab Software. Image Acquisition Toolbox provided a complete environment for acquiring images and videos, visualize, analyze and develop processing algorithms, so it makes easy to work with the tracked data without the need of another computer languages. The kinematic Data Analysis has been divided into three major parts: Gait Event Recognition, Spatio-Temporal Analysis and Gait Feature Extraction.
1. Gait Event Recognition from kinematic data A complete and consistent gait analysis commonly requires to have cycle gait data segmented, at least, into its cycles and frequently also into its two major phases; the stance and swing. As the data obtained in the treadmill and the data from the database are subjected to free cadence walk tests executed by the participants, the first step before proceeding with the motion data analysis has been to temporally segment the data into its cycles. Two different algorithms that segment the kinematic data into its cycles and its major phases has been proposed. Both algorithms have been based on the limb displacement data (positional data) to automatically determine the occurrence of the gait events: Algorithm 1: Gait Event Recognition based on the horizontal displacement between hip and foot Algorithm 2: Gait Event Recognition based on Step Length In both algorithms, the events have been automatically identified by detecting the maximum and minimums peaks (through creating peak detection algorithms) of both kinematic signals. Moreover, one of these two algorithms proposed (the second one) is able to further segment the data of the stance and swing phases in its respective subdivisions: initial contact, loading foot, midstance, terminal stance and pre-swing for stance and initial swing, midswing, terminal swing for swing. In that sense, this algorithm provides potential tool to be used for the identification of all gait events, usually a complex and tedious task and with a poor characterization in the previous studies reported. A more extended explanation about the methodology has been included in the Appendix, Part 3.
2. Kinematic Analysis Once the collected data has been segmented into cycle gaits and its correspondent events, the kinematic analysis has been carried out. This analysis has been subdivided into two different parts; the first one corresponds to a standard spatio-temporal gait analysis, whereas the second one is devoted to extract more complex gait features.
21
SPATIO-TEMPORAL GAIT ANALYSIS The segmented kinematic data have been used to proceed to the standard gait spatio-temporal analysis. This basic analysis has been carried out creating several algorithms to extract each one of the features of interest (Table 3) based on its definition.
TEMPORAL
Feature
Definition and method of extraction
Cycle Time
Time between two initial contact events detected
Stance Time
Time between initial contact to the initial swing
Swing Time
Time between initial swing and next initial contact
Step Length
Maximum distance between two opposite feet
Stride Length
Distance between two consecutive heel contacts of the same foot
ANALYSIS
SPATIAL ANALYSIS
Or
SPATIOTEMPORAL
2
Cadence Gait Speed
ANALYSYS
Table 4: Extraction of the spatio-temporal gait parameters
The definition of all these gait features has been explained in 2.2.1 part of the Introduction.
2.1.
GAIT FEATURE EXTRACTION FROM KINEMATIC DATA
First Gait Feature: Human Center of Mass Estimation The goal here is to track the center of mass of the user when walking/running, using skeletal tracking of Kinect sensor. The technique that I carried out is called “Segmental Method”. It consists on the estimation of the center of mass of whole body through a weighted sum of the center of mass of each body segment. In order to first obtain the segmental center of mass, anthropometric data is needed. Specifically, the mass of each segment (fractional body mass) and the center of mass location from proximal endpoint (information found in the previous literature) data has been needed. This table contains the complete anthropometric information that has been collected:
22
BODY SEGMENT
PROXIMAL
DISTAL
FRACTIONAL
COM LOCATION
ENDPOINT
ENDPOINT
BODY MASS
(% COM)
Foot
Ankle
Virtual Toe
0.0145
0.429
Shank
Knee
Ankle
0.065
0.433
Thigh
Hip
Knee
0.110
0.433
Upper Arm
Shoulder
Elbow
0.028
0.436
Fore Arm
Elbow
Wrist
0.016
0.430
Hand
Wrist
Virtual Finger
0.006
0.506
Trunk
Shoulder Center
Hip
0.497
0.54
Head
Virtual nose
Shoulder Center
0.084
0.4
Shoulder
Shoulder Center
Shoulders
-
0.50
Hip
Hip Center
Hips
-
0.50
Table 5: Anthropometric data used to compute the body center of mass. Dara extracted from [4][43], [52]
The skeleton provided by the sensor consists of 20 joints that link a set of 19 segments; hence, the estimation of the whole body center of mass consists on a nineteen-segment representation of the subject, where in each of them the segmental center of mass has been computed (Equations in Figure 14) Center of Mass Coordinates of each Body Segment
𝑥𝐶𝑀
𝑖
𝑋𝑃 + 𝑋𝐷 + 𝑋𝑃
𝐶𝑂𝑀
𝑦𝐶𝑀
𝑖
𝑌𝑃 + 𝑌𝐷 + 𝑌𝑃
𝐶𝑂𝑀
𝑧𝐶𝑀
𝑖
𝑍𝑃 + 𝑍𝐷 + 𝑍𝑃
𝐶𝑂𝑀
Whole body Center of Mass Coordinates
𝑋𝐶𝑀 𝑌𝐶𝑀 𝑍𝐶𝑀
∑𝑛𝑖 𝑚𝑖 𝑥𝐶𝑀 𝑖 𝑀 ∑𝑛𝑖 𝑚𝑖 𝑦𝐶𝑀 𝑖 𝑀 ∑𝑛𝑖 𝑚𝑖 𝑧𝐶𝑀 𝑖 𝑀
Figure 14: Equations used to compute the body center of mass
Where, i = each segment n = total number of segments = mass of segment “i” M = total body weight ∑
)
= coordinates of the distal end of the segment = coordinates of the proximal end of the segment = three-dimensional coordinates of the center of mass of segment “i” = three-dimensional coordinates of human body center of mass
23
Second Feature: Knee Angle The study of joint kinematics is of special interest in gait analysis. In this paper, a study of the knee joint angle is presented, as it is the joint that gives potentially useful information to describe the human locomotion. In this project, the algorithm proposed to compute the knee angle has been based on the definition of dot product between two vectors (Figure 15). Mathematically, the dot product is defined as followings:
𝑩
𝐷𝑜𝑡 𝑝𝑟𝑜𝑑𝑢𝑐𝑡
𝐴 𝐵
𝐴
𝐵
𝑐𝑜𝑠𝛽
𝜷 𝑨 Figure 15: Knee Angle feature extraction from the dot product definition
From this definition, knee flexion angle has been predefined as the angle between two lines, corresponding to the two body segments adjacent to the knee joint, indicated as α (Figure 16). The first segment considered corresponds to the shank, while second segment is defined as the thigh. Subsequently this angle is further postprocesed in order to get the angle of interest (Figure 16), which corresponds to the knee flexion. This final angle is computed by making the complement angle of the first one. Hence, the final angle that has been obtained corresponds to
𝜶
𝐾𝑛𝑒𝑒 𝑓𝑙𝑒𝑥𝑖𝑜𝑛 → 𝜃
180
𝛼
Figure 16: Knee Angle feature extraction
Third Feature: Upper Body Leaning The upper body angle constitutes another important feature in kinematic analysis of the running/walking technique [53]; it describes the leaning when the body is moving forward during the locomotion task. The algorithm proposed to compute it follows the same methodology as the knee angle computation. The angle between two vectors is computed, but in this case the first vector corresponds to the segment between shoulder center and spine, that is essentially the
24
trunk or the upper body. On the other hand the second vector corresponds to a vertical line traced from the spine coordinates (Figure 17). Shoulder Center point
𝛽
Spine point
Figure 17: Body Leaning feature extraction
Fourth Feature: Distance between center of mass projection and landing foot It corresponds to another important feature in running efficiency and injury risk. This feature has been easily computed as the horizontal difference between the center of mass projection to the ground and the ankle joint of the landing foot.
COM
Distance between landing heel to COM projection Figure 18: Distance from center of mass projection to landing foot feature extraction
PART 3- GAIT ANALYSIS OF THE GROUND REACTION FORCES The analysis performed in this part of the project has been clearly separated in two sections. The first one has been devoted to the data analysis of the ground reaction forces acquired in a gait laboratory through the gold standard of force plates. On the other hand, in the second section a method for estimate or predict the forces obtained in the force platform has been proposed.
25
Participants Seven volunteers of the total eleven participants were collected to perform this part of the project. As for measuring ground reaction force a force platform device present only in laboratory conditions, the tests were performed in Laboratory of Biomechanics at ETSEIB (Universitat Politècnica de Catalunya, Barcelona).
Set up and Data Collection Force data were recorded using two consecutive AMTI Accugait force platforms (Figure 19), in order to measure the ground reaction forces on each foot. The sampling rate of each platform was 100 Hz, that is; the force was calculated every 0.01 seconds. The data were acquired using specific AMTI’s software package, called NetForce, to accurately transduce and display the forces captured on the plate sensors. Finally this data were saved in .txt file for visualization and posterior analysis in Matlab environment. Subjects were asked to perform three different tests in different conditions:
walking,
running
shod
and
running
barefoot.
Simultaneously to the force acquisition during each test, subjects were tracked using Kinect while performed the tests. Three dimensional skeleton data were recorded, using the same set-up as in the other experiments.
Figure 19: One of the subjects during the walking test on the force platforms in the UPC Biomechanics Laboratory
Data pre-processing Once the data was collected, .txt files were imported in Matlab to start the analysis. For each .txt file loaded, a variable consisting of an array composed by 3000 rows and 12 columns (3000x12) was created. The 3000 rows makes reference to acquisition data points (30 seconds at 100 Hz sampling rate) and 12 columns (Table 6) corresponds to forces (Fx, Fy, Fz) and moments (Mx,My,Mz) on each foot (right, left). Left FOOTSTRIKE (first platform) yGRF
xGRF
VGRF
M (x)
M (y)
Right FOOTSTRIKE (second platform) M (z)
yGRF
xGRF
VGRF
M (x)
M (y)
M (z)
Table 6: Ground reaction data obtained with the force platform
Ground reaction force obtained with the force platform considers a three-dimensional coordinate system (x, y, z as orthogonal dimensions). The GRF that has been taken into account for this project corresponds only to the vertical ground reaction force (Fz). As the other two components of the force (shear force: anterior-posterior and medio-lateral, Fy and Fx respectively) are less essential for the purpose of the project, this data together with the data regarding the moments of the force, were immediately discarded.
26
Data Analysis 1. Gait analysis of ground reaction forces using the gold standard of force platforms
-
Identification and Classification of the subjects according its foot-strike
Foot strike pattern can be simply identified based on subjective visual inspection when the test is performed, but it can lead to many errors as when the foot collides with the ground corresponds to a short instant. Prior to analyze the data obtained with the force platform, a method for automatically detect the foot strike pattern has been developed. The algorithm proposed relies on the peak detection in ground reaction force magnitude without the need to visualize the data. The algorithm proposed shows a message in the screen that determines which type of foot strike has the subject tested, in order to immediately know how the results (force data) of each subject have to be interpreted, making the analysis process more efficient.
-
Ground Reaction Force Data Analysis
The fundamental characteristics of the ground reaction force data has been extracted, analyzed and subsequently interpreted. The main features that have been selected to characterize the ground reaction force are the force peaks and its time of occurrence.
An algorithm to
automatically extract these major features from the force data has been proposed. The approach proposed has been basically relied on the peak detection of the magnitude of the ground reaction force data. Moreover, a deeply analysis has been performed in order to compute the loading rate (the speed at which forces are applied on our body) parameter and the impulse of the force. These quantities have been computed using the equations proposed in the literature [26], [28], [54], [15] and described (Figure 20) by: 20 ∫
→
80 →
Figure 20: Ground reaction feature extraction of loading rate and impulse
27
2. Ground reaction force estimation using kinect data The purpose of this experiment has been to explore the possibilities of obtaining ground reaction forces from kinematic data extracted with Kinect sensor. The method that has been proposed to estimate the ground reaction forces relies on the relationship between forces and acceleration during locomotion, specifically focused on the motion of the center of mass. The acceleration of the center of mass has been computed in order to estimate the ground reaction forces through the Newton’s 2
nd
Law, which relates forces
and acceleration. This corresponds to the main idea of the method, but the procedure has been described in the following three points. Step 1. Extract the kinematics of the COM from Kinect. The first step for the ground reaction force estimation has been to extract the motion of the center of mass. In the previous section a method to compute the human center of mass was presented. Hence, from the raw skeleton data obtained with Kinect during the test, the center of mass feature has been extracted for these new purposes. Specifically, as the goal is to produce en estimation of the vertical component of the ground reaction forces, only the vertical displacement of the center of mass has been required to extract. Step 2. Compute the COM acceleration from positional center of mass data. In order to obtain the acceleration of the center of mass (the parameter needed for the estimation of the forces), the vertical displacement of center of mass had to be differentiated twice. This step of the double-differentiation of positional data is a delicate process. It is know that the computation of higher order derivatives potentially increases the noisy power in the signal, producing distortion at the output, and, consequently, decreasing its quality [55]. This fact together with the fact that Kinect data is discrete (obtained in frames) has forced to use special methods for data interpolation and differentiation. The approach proposed has been relied on the use of splines. With the splines, the discrete data captured with Kinect has approximated to a continuous function, overcoming the limitations mentioned above. Many functions of the Curve Fitting Toolbox of Matlab allows to construct, evaluate and differentiate these splines. Specifically, the spline used has been a cubic spline (third order spline), in order to acquire a better data interpolation and differentiation. Afterwards the spline construction, it has to be evaluated in our positional data of the center of mass and subsequently differentiated twice.
Step 3. Force Estimation from acceleration data. Once has been computed the acceleration of the body center of mass, ground reaction forces have been derived using Newton’s 2
nd
Law
(Figure 21), which relates the acceleration and the force, described mathematically by the following equations [27], [46], [47]:
28
𝐹𝑜𝑟𝑐𝑒 𝐺𝑅𝐹𝑧
𝑀 𝑎
𝐺𝑅𝐹 + 𝑀 𝑔
𝑀 𝑎𝑍 + 𝑀 𝑔 𝐺𝑅𝐹𝑧 [𝐵𝑊]
𝑀 𝑎𝑍 + 𝑔
𝑎𝑍 + 𝑔 𝑔
Where, M – body mass a – vertical center of mass acceleration g –gravitational constant (9.81
𝑚 𝑠2
Figure 21: Equations based on Newton's 2nd Law, which relates the force with the acceleration
3. Comparison between two approaches In order to evaluate the accuracy of the proposed approach using Kinect, this data has been compared to the data obtained simultaneously in the force platform. A simple method to obtain the similarity between two vectors has been used.
1
29
RESULTS AND DISCUSSION While almost all of the previous studies usually only reports kinematic or kinetic data, one of the complementary goals of this project has been to put in the same context movement-related parameters and force-related parameters, achieving in that sense a better characterization of the human motion. The main findings from the experiments performed in this project are presented below. The recognition of the gait events from the data captured with Kinect has been an essential part in order to perform a good quality gait analysis. The two algorithms proposed to automatically segment this data in cycle gaits and determine its events are presented in Figure 22. The first algorithm, based on foot-hip displacements, was able to detect automatically the two major phases of the cycle gait. On the other hand, the second algorithm that used the step length as a signal was able to recognize and segment all the gait events of each cycle. Both results have been found to be well-correlated between them as the detected events between two algorithms have shown a maximum difference of occurrence of 4-5 frames, which correspond to a difference of 0.1667 seconds.
Figure 22: Two algorithms for Gait Event Recognition
The development of these algorithms allows not only to identity gait events, but also to analyze gait features such as knee angle or center of mass path at the exact instant points where these events occur. In this manner, can be determined, for instance, at which point of the cycle gait the knee angle reaches its maximum flexion. Hence, these algorithms provide potential advantages over the great quantity of algorithms reported in the previous literature. Results from the kinematic gait analysis performed with Kinect once segmented the data into its cycles are presented in Table 7 and Table 8, showing the results, separately, of spatio-temporal analysis and other kinematic features extracted. These two tables include the results of the analysis averaged to 10 randomly selected individuals from the database. Small standard deviation between all these measures was found in both spatio-temporal measures and gait extracted features.
30
SPATIO–TEMPORAL GAIT ANALYSIS Temporal Parameters Spatial Parameters Spatio-Temporal Parameters Cycle Stance Swing Step Stride Cadence Gait Time [s] Time (%) Time (%) Length Length (steps/min) Velocity [m] [m] [Km/h] Subject 1 1.0722 65.2863 34.7136 0.5753 1.1146 109.3458 3.7745 Subject 2 1.1444 62.6267 37.3820 0.5614 1.1773 103.0837 3.4722 Subject 3 1.1 61.61818 38.3818 0.6147 1.1745 106.8493 3.9411 Subject 4 1.14 62.5701 37.4298 0.6283 1.1867 103.1250 3.8877 Subject 5 1.1667 63.8038 36.1875 0.5978 1.1434 101.2987 3.6333 Subject 6 1.1111 61.0026 38.9973 0.6314 1.1806 105.8824 4.0112 Subject 7 1.0467 62.4152 37.5752 0.6784 1.2495 111.2360 4.5278 Subject 8 1.1733 60.2318 39.776 0.6568 1.3122 100.5076 3.961 Subject 9 1.0778 62.3677 37.6322 0.5814 1.1134 108.8372 3.7968 Subject 10 1.2381 62.3075 37.6948 0.5771 1.1355 96.0854 3.327 MEAN 1.1270 62.4228 37.5771 0.6103 1.1788 104.6251 3.8333 (STD) (0.0571) (1.4005) (1.4028) (0.038) (0.061) (4.6646) (0.3294) Table 7: Spatiotemporal gait analysis in each subject. Standard statistical test performed in 10 subjects
The results were found also to be accurately consistent with the actual normative for spatiotemporal basic gait parameters, a technical paper that includes reference data for these parameters in normal subjects aged between 10 and 79 years [56]. The other gait features extracted, such as the knee angle and the motion of the center of mass, are presented (directly averaged across the subjects) in Table 8. The results from this analysis also were found to be consistent with the reference data of the previous studies that measured these variables in gait laboratories. All these results reveal the potential of Kinect to estimate all these gait parameters without the use neither laboratory conditions nor more instrumentation than simply the single device. GAIT FEATURES EXTRACTION angle other gait features Initial Contact Upper Body COM distance Center of Mass Flexion Leaning to landing foot Displacement [degrees] [degrees] [m] [m] Mean 47.3534 6.1334 3.3973 0.2636 0.0473 (STD) (4.6102) (2.2456) (2.0639) (0.0302) (0.0102) Table 8: Gait feature extraction. Standard statistical test performed in 10 subjects knee Max Flexion [degrees]
The pattern of the knee angle was further analyzed because of its importance as a gait descriptor (Figure 23). Knee angle range of motion sometimes is called “double knee action” due to the maximum values reached: one in stance phase and the other in swing phase. The stance maximum angle has been demonstrated to be always lower than the swing phase angle. The maximum flexion of the knee corresponds to the description of its range of motion, being in normal walking about 50 degrees (Table 8).
Figure 23: Identification of all the events in the knee angle path during one gait cycle.
31
Two different values of this knee kinematics have been selected to be important descriptors of human gait: the angle exhibited at the first contact (flexion at the initial contact) and the maximum angle exhibited during the cycle, (parameter that defines the knee range of motion). To exhibit abnormal values would be related with an abnormal gait and, as a result, with an increased risk of injury. The body center of mass (Figure 24) also has been selected as an important variable to characterize the human gait.
Body Center of Mass
Figure 24: Body Center of Mass Estimation throrugh an Intersegmental Method
Figure 25: Center of Mass path during one gait cycle
The center of mass path during an entire gait cycle resulted in sinusoidal and rhythmic wave that oscillates in a range of about 4-5 cm in walking (Figure 25). The results showed that the maximum displacements correspond to single-support events, whereas the lowest point has been achieved where the weight loading is distributed on two limbs, in double-support event.
Further understanding of human motion has led to evaluate the same spatio-temporal and kinematic analysis in the transition between walking and running. Expected differences have been found between the gait parameters in both performances. Regarding the spatio-temporal parameters has been found that whereas gait cycle time decreases with the velocity, stride and step length and the cadence increases (Figure 26). In fact, the increased velocity that
32
characterizes the running performance is primarily reached by the shortening of the gait cycles, as the time to perform one step is reduced and the step length increased. The upper body leaning when running was also found to be higher as compared in walking. It can be easily reasoned due to tilt further forward, allowing and/or maximizing forward displacement.
Figure 26: The analysis of four features (cycle time, step and stride length and cadence) at increasing speed (from 4km/h to 10km/h)
Some of these parameters could be selected to study how to increase the efficiency of the performance in running. These parameters are the step length, the cadence and body leaning. Results indicate that the increase of these quantities contributes to achieve more velocity. Furthermore, the vertical displacement of the center of mass also plays an important role in the running technique. In contrast, a good runner will try to minimize its vertical displacement because energy must be used to move forward and not upward. The upper body leaning during the runner’s performance represents another important parameter and it can be related with the increased risk of back pain. In regards to the kinematics of the knee joint in running (Figure 27), although it shows similar pattern (“double knee action” pattern) as compared in walking, the knee joint in running was observed to have a higher range of motion, reaching higher peak values. Furthermore, differences were also observed in the knee flexion angle at the initial contact, being higher in running as well. It allows to characterize that the impact with the ground, in running, is performed with a higher flexion where in walking the leg is totally extended or exhibits small flexion values.
33
Figure 27: Knee Flexion at three different speeds: walking, slow running and fast running
Ground reaction forces Data analysis of the ground reaction forces captured with the force platform has been carried out in order to quantify the pattern of the VGRF (vertical component analyzed) and its main features: force magnitude peaks and its occurrence, the impulse and the loading rate from the force data were reported. In the previous literature has been found that the shape and the magnitude of the ground reaction forces are determined by the way in which the subject strikes the ground. For that reason, before the analysis of the forces, a classification of the footstrike patterns through an algorithm to determine the automatically the foot pattern was done (Figure 28). Results indicated that almost all the shod runners are heel strikers while barefoot are most likely to exhibit a fore-foot or mid-foot strike (non-heel strike).
Figure 28: Classification of the foot strike patterns of the subjects
Subsequently, the analysis of the ground reaction force data have been observed to exhibit potential differences across the three different tests performed in the laboratory (walking, running shod and running barefoot). These differences in are presented in Figure 29.
34
Figure 29: Ground Reaction Force patterns in walking, shod running and barefoot running conditions, respectively
It is important to note that, as the ground reaction force describes forces that acts on the body when the feet are in contact with the ground, all these data acquisitions are referred to the stance period, not the entire cycle gait. Ground reaction force during walking stance exhibited two noticeable peaks and one valley in at the mid-point. At the beginning of the stance phase, in heel strike event, the force has zero magnitude because no force is produced. Immediately, the force starts to increase and the first peak appears. As the gait progresses to the single-support stance phase, a minimum peak appears, corresponding to the end of mid-stance and the beginning of the terminal stance event. Soon after, the force starts to increase again reaching its second maximum point, which corresponds to the heel-off event, where the foot starts to leave the ground. As the stance phase ends, in pre-swing (or toe-off) event, the force falls to zero value again because the complete foot makes no longer contact with the ground, starting in this sense the swing phase. The ground reaction forces during both conditions of running exhibited different pattern as compared in walking (Figure 29). Running GRF exhibited a single appreciable high magnitude peak (active peak). The active peak appeared in all the running tests, but differences across these running tests also were appreciated: as it has been mentioned, it was found that depending on the foot pattern during the contact with the ground (heel strike patter or non-heelstrike pattern), another sizable peak appeared, called impact peak (Figure 29, B). The results showed that the impact peak always has a lower magnitude force than the active peak. Specifically, as in heel strike running the first impact with the ground is produced with the rearfoot (heel), it generates a nearly instantaneous peak in magnitude of VGRF (showing the impact
35
peak). In opposite, non-heel strike pattern does not show this first impact (or minimal impact force is produced) because the collision with the ground is directly produced with the mid or distal part of the foot, the toe (avoiding in this sense to hit the ground with the heel) Not only the magnitude, but also other variables from ground reaction force data were extracted and presented in Table 9. GRF cycle
WALKING
duration
GRF
Loading
Impulse of
(stance time)
Magnitude
Rate
the force
[s]
[BW]
[BW]
[BW·s]
0.8326 (0.0592)
1.0719
8.1680
0.6353
(0.0230)
(1.3670)
(0.0441)
Mean(STD) RUNNING
0.4550
2.0599
43.8940
0.3888
Mean(STD)
(0.0818)
(0.2011)
(24.2466)
(0.0261)
Table 9: Ground features extraction in walking and running performances. Standard statistical analysis has been performed across the subjects Note: Ground reaction forces have been normalized to each subject’s body weight in order to obtain reliable results in the statistical analysis.
In all of them differences were identified between walking and running tests. What shows these parameters was that running is characterized by short contact periods with the ground (i.e., short stance phase) and high peaks in ground reaction force magnitude as compared in walking. Impulse of ground reaction forces in walking was higher than in both forms of running. As impulse is a measure of time·force, these results can be reasoned based on that walking gives more time to produce the impulse, then the cumulative force in the time (impulse) is higher. Loading rate has been found to be higher in running than in walking. At single glance, what draws the attention in loading rate parameter (Table 9) is the highest standard deviation exhibited in running, but it can be perfectly reasoned with the Figure 30.
Figure 30: Loading Rate Parameter and its influence with the footstrike pattern
36
The loading rate extracted in heel strike runners was found to be higher and with a wide range of variability in comparison with the loading rate exhibited in non-heel strike runners. In fact, the loading rate feature has reported in the previous literature to be directly related with the footstrike pattern and with the injury risk. As heel strike running pattern exhibits higher impact loading rate, it is directly correlated with an increasing risk of injuries. On the other hand, barefoot runners tends to strike with the forefoot or midfoot, exhibiting lower loading rate and reducing the stress on the lower-limb joints. That’s why, nowadays, alternative running conditions such as barefoot running, are becoming more and more popular across the runners.
These results can be used as important information to deeply understand which factors, such as the already demonstrated, must be avoid to decrease the risk of injuries.
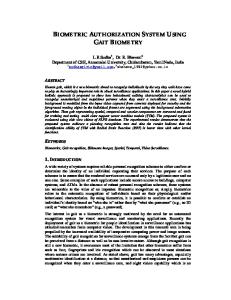
One of the novelties that this project has introduced is to characterize the magnitude of these ground reaction forces without the use of its standard instrumentation, the force plates. The results obtained with Kinect sensor to predict the ground reaction forces captured simultaneously in the force plates was found to correlate fairly well between them (Figure 31).
Figure 31: Comparison of the estimated ground reaction force maximum magnitude using Kinect with the ground truth magnitude from force plates Although in almost all of cases this force magnitude predicted with Kinect was under-estimated (Table 9), the mean error between in the peak force magnitude between ground truth data and the estimated/predicted data was found to be about 10% (by averaging all errors). The worst estimation was found to have a 73% of similarity with the gold standard technique, but in several cases the similarity achieved was higher than 95%.
37
Force Magnitude Peak Running SHOD
Running BAREFOOT
Ground
Estimation
Similarity
Ground
Estimation
Similarity
Truth
[BW]
[%]
Truth [BW]
[BW]
[%]
2.1694
1.7199
2.162
2.2271
1.6241
1.6744
1.6962
1.467
2.152
1.7541
1.7766
1.6085
[BW]
Subject 1
2.3436
2.2604
Subject 2
2.0447
2.0473
Subject 3
1.6114
1.4328
Subject 4
2.1679
1.8672
Subject 5
1.9598
1.7418
Subject 6
1.7342
1.6412
Mean (STD)
96.3193 99.87301 87.5349 83.8957 87.4843 94.3335
91.5734 (6.1806)
73.8662 97.077 96.996 84.3763 77.3161 89.5493
86.5301 (9.7959)
Table 10: Ground Reaction Force prediction and comparison using the gold standard of force plate results and the results estimated with Kinect
These errors can be reasoned. Some of them are introduced due to the intrinsic skeleton tracking errors when the data is captured with Kinect, but the major part of the error introduced in the estimation can be perfectly introduced in several stages of the methodology: the center of mass estimation through an inter-segmental method that uses anthropometric data of each segment is obvious that introduced inaccuracies. Also, the double differentiation of the center of mass using splines to estimate the forces can introduce some noise. Despite of these differences, results obtained show that is it could be a potentially useful as an alternative to make a prediction or an estimation of these ground reaction forces but cannot supply the gold standard technique of the force platforms in analysis requiring of higher accuracy.
CONCLUSIONS The increasing interest to expand the areas of application of gait analysis together with the recent emergence of novel technologies such as Kinect sensor, has brought new opportunities
38
for the improvement of human gait characterization; overcoming in this sense the common limitations regarding the cost, space and time in traditional gait analysis. The main purpose of this project has been to extract potential gait measures that could be useful in both clinical and sport context using a markerless motion system, the Kinect sensor. According to this aim, a good gait characterization has been achieved by combining the results obtained in both kinematic and kinetic experiments. Nor a large variety of devices used to perform the same analysis have been needed, overcoming in that sense the “cost” and “space” limitations of traditional gait analysis. As both kinematic and kinetic features have been automatically extracted through a proposed set of algorithms, the time-consumption traditional limitation in the analysis has also been improved. One of the most challenges part, consist on estimate gait forces using only Kinect sensor, has been positively achieved, encouraging even more the use of this technology as an alternative for these purposes when no equipment or laboratory conditions are available. The purpose for both kinematic and kinetic data obtained in the analysis is two-fold. On one hand, this analysis aims to provide useful data to characterize key aspects of the technique and style in walking and running (such as the step length, the knee flexion and the center of mass displacement gait features) in order to effectively detect those subjects that have an improper technique and body posture during the tests. At the same time, the extraction of this data could also be useful in the context of injury prevention, giving information about the way in which the subject hits the ground. Results from the footstrike pattern determination, the magnitude of the ground reaction forces and the loading rate parameter are useful for this second purpose.
FUTURE WORK The results obtained encourage further research in this field in order to take the maximum profit of this technology in both clinical and sports fields. A possible future work could be to carry out the same analysis using Kinect but in patients with movement abnormalities instead of healthy subjects, to identify which variables and gait features contribute to have an abnormal gait. A second option for possible future work could be to create a software that provides all these measures automatically at a real time (while the subject is performing the task), accelerating the process. Translation of this research lines into sports training field also could be even more of great interest. A possible project in this sense could consists of create an user-friendly software for runners to provide them with real-time feedback regarding their running performance, such as posture correction if needed. Through this system, Kinect could provide to the user a type of “mirror”, giving the necessary real-time indications in order to achieve the maximum efficiency.
REFERENCES [1]
Z. Zhang, “Microsoft kinect sensor and its effect,” IEEE Multimed., vol. 19, no. 2, pp. 4–10, 2012.
39
[2]
J. Han, L. Shao, D. Xu, and J. Shotton, “Enhanced computer vision with Microsoft Kinect sensor: A review,” IEEE Trans. Cybern., vol. 43, no. 5, pp. 1318–1334, 2013.
[3]
K. Khoshelham and S. O. Elberink, “Accuracy and resolution of kinect depth data for indoor mapping applications,” Sensors, vol. 12, no. 2, pp. 1437–1454, 2012.
[4]
A. A. Manasrah, “Human Motion Tracking for Assisting Balance Training and Control of a Humanoid Robot,” no. January, 2012.
[5]
a Blake, “Real-time human pose recognitiom in parts from single depth images,”IEEE Conf. Comput. Vis. Pattern Recognit. (CVPR), 2011.
[6]
K. Khoshelham, “Accuracy Analysis of Kinect Depth Data,” ISPRS - Int. Arch. Photogramm. Remote Sens. Spat. Inf. Sci., vol. XXXVIII–5/, no. August, pp. 133–138, 2012.
[7]
C. Y. Chang, B. Lange, M. Zhang, S. Koenig, P. Requejo, N. Somboon, A. a. Sawchuk, and A. a. Rizzo, “Towards Pervasive Physical Rehabilitation Using Microsoft Kinect,” Int. Conf. Pervasive Comput. Technol. Heal., pp. 159–162, 2012.
[8]
B. Galna, D. Jackson, G. Schofield, R. McNaney, M. Webster, G. Barry, D. Mhiripiri, M. Balaam, P. Olivier, and L. Rochester, “Retraining function in people with Parkinson’s disease using the Microsoft kinect: game design and pilot testing.,” J. Neuroeng. Rehabil., vol. 11, no. 1, p. 60, 2014.
[9]
Y. Mao, P. Chen, L. Li, and D. Huang, “Virtual reality training improves balance function,” vol. 9, no. 0, 2014.
[10]
M. Anderson, “Effectiveness of Gaming Systems on Balance in Older Individuals.”
[11]
L. Gallo, A. P. Placitelli, and M. Ciampi, “Controller-free exploration of medical image data: Experiencing the Kinect,” Proc. - IEEE Symp. Comput. Med. Syst., 2011.
[12]
M. W. Whittle, “Gait analysis: an introduction,” Library (Lond)., vol. 3, pp. 1–220, 2002.
[13]
W. Tao, T. Liu, R. Zheng, and H. Feng, “Gait analysis using wearable sensors,” Sensors, vol. 12, no. 2, pp. 2255–2283, 2012.
[14]
J. Perry, “Observational gait analysis handbook,” Pathokinesiology Serv. Phys. …, 1989.
[15]
A. Tongen and R. E. Wunderlich, “Biomechanics of Running and Walking,” Math. Sport., pp. 1–12, 2012.
[16]
R. M. Wham, “Three-Dimensional Kinematic Analysis Using the Xbox Kinect,” p. 23, 2012.
[17]
R. Baker, “Temporal spatial data , the gait cycle and gait graphs,” pp. 1–8.
[18]
A. González, M. Hayashibe, V. Bonnet, and P. Fraisse, “Whole Body Center of Mass Estimation with Portable Sensors: Using the Statically Equivalent Serial Chain and a Kinect,” Accept. Publ. Sensors, pp. 16955–16971, 2014.
[19]
T. Marasovič, M. Cecič, and V. Zanchi, “Analysis and interpretation of ground reaction forces in normal gait,” WSEAS Trans. Syst., vol. 8, no. 9, pp. 1105–1114, 2009.
[20]
C. R. Lee and C. T. Farley, “Determinants of the center of mass trajectory in human walking and running.,” J. Exp. Biol., vol. 201, no. Pt 21, pp. 2935–2944, 1998.
[21]
E. M. Gutierrez-Farewik, Å. Bartonek, and H. Saraste, “Comparison and evaluation of two common methods to measure center of mass displacement in three dimensions during gait,” Hum. Mov. Sci., vol. 25, no. 2, pp. 238–256, 2006.
40
[22]
R. N. Kirkwood, H. D. A. Gomes, R. F. Sampaio, E. Culham, and P. Costigan, “Análise biomecânica das articulações do quadril e joelho durante a marcha em participantes idosos,” Acta Ortopédica Bras., vol. 15, no. 5, pp. 267–271, 2007.
[23]
H. Y, “The Change in Knee Angle during the Gait by Applying Elastic Tape to the Skin,” 2014.
[24]
H. G. P. V. da Silva, A. Cliquet Junior, A. R. Zorzi, and J. Batista de Miranda, “Biomechanical changes in gait of subjects with medial knee osteoarthritis.,” Acta Ortop. Bras., vol. 20, no. 3, pp. 150–6, 2012.
[25]
K. Sasaki, R. R. Neptune, and S. a Kautz, “The relationships between muscle, external, internal and joint mechanical work during normal walking.,” J. Exp. Biol., vol. 212, no. Pt 5, pp. 738–744, 2009.
[26]
J. Perttunen, Foot loading in normal and pathological walking. 2002.
[27]
S. Winiarski and A. Rutkowska-Kucharska, “Estimated ground reaction force in normal and pathological gait,” Acta Bioeng. Biomech., vol. 11, no. 1, pp. 53–60, 2009.
[28]
B. Kluitenberg, S. W. Bredeweg, S. Zijlstra, W. Zijlstra, and I. Buist, “Comparison of vertical ground reaction forces during overground and treadmill running. A validation study.,” BMC Musculoskelet. Disord., vol. 13, p. 235, 2012.
[29]
A. Muro-de-la-Herran, B. García-Zapirain, and A. Méndez-Zorrilla, “Gait analysis methods: An overview of wearable and non-wearable systems, highlighting clinical applications,” Sensors (Switzerland), vol. 14, no. 2, pp. 3362–3394, 2014.
[30]
J. A. Garcia, “Step Kinection : A Hybrid Clinical Test for Fall Risk,” pp. 471–474, 2014.
[31]
S. E. M. L. R. G. Morris, R. Morris, and S. Lawson, “A review and evaluation of available gait analysis technologies, and their potential for the measurement of impact transmission,” Newcastle Univ., 2010.
[32]
E. Ceseracciu, Z. Sawacha, and C. Cobelli, “Comparison of markerless and marker-based motion capture technologies through simultaneous data collection during gait: Proof of concept,” PLoS One, vol. 9, no. 3, pp. 1–7, 2014.
[33]
M. S. Andersen, J. Yang, M. de Zee, L. Zhou, S. Bai, and J. Rasmussen, “Full-body Musculoskeletal Modeling Using Dual Microsoft Kinect Sensors and the Anybody Modeling System,” 14th Int. Symp. Comput. Simul. Biomech., pp. 1–2, 2013.
[34]
C. Granata, P. Bidaud, and U. Umr, “Human whole body motion characterization from a Kinect,” pp. 2–7.
[35]
V. Andersson, R. Dutra, and R. Araújo, “Anthropometric and Human Gait Identification Using Skeleton Data from Kinect Sensor,” pp. 60–61, 2014.
[36]
E. Stone and M. Skubic, “Evaluation of an inexpensive depth camera for in-home gait assessment,” J. Ambient Intell. Smart Environ., vol. 3, no. 4, pp. 349–361, 2011.
[37]
E. E. Stone and M. Skubic, “Unobtrusive, continuous, in-home gait measurement using the microsoft kinect,” IEEE Trans. Biomed. Eng., vol. 60, no. 10, pp. 2925–2932, 2013.
[38]
S. J. Lee and J. Hidler, “Biomechanics of overground vs. treadmill walking in healthy individuals.,” J. Appl. Physiol., vol. 104, no. 3, pp. 747–755, 2008.
[39]
M. Roerdink, B. (H ) Coolen, B. (H )E Clairbois, C. J. C. Lamoth, and P. J. Beek, “Online gait event detection using a large force platform embedded in a treadmill,” J. Biomech., vol. 41, no. 12, pp. 2628–2632, 2008.
[40]
P. Fraccaro, L. Walsh, J. Doyle, and D. O’Sullivan, “Real-world Gyroscope-based Gait Event Detection and Gait Feature Extraction,” eTELEMED 2014, Sixth Int. Conf. eHealth, Telemedicine, Soc. Med., no. c, pp. 247– 252, 2014.
41
[41]
H. Lau and K. Tong, “The reliability of using accelerometer and gyroscope for gait event identification on persons with dropped foot,” Gait Posture, vol. 27, no. 2, pp. 248–257, 2008.
[42]
J. a. Zeni, J. G. Richards, and J. S. Higginson, “Two simple methods for determining gait events during treadmill and overground walking using kinematic data,” Gait Posture, vol. 27, no. 4, pp. 710–714, 2008.
[43]
S. a. Gard, S. C. Miff, and A. D. Kuo, “Comparison of kinematic and kinetic methods for computing the vertical motion of the body center of mass during walking,” Hum. Mov. Sci., vol. 22, no. 6, pp. 597–610, 2004.
[44]
A. González, M. Hayashibe, and P. Fraisse, “Subject-specific Center of Mass Estimation for In-home Rehabilitation - Kinect-Wii board vs. Vicon-Force plate,” Converging Clin. Eng. Res. Neurorehabilitation, vol. 2, pp. 705–709, 2012.
[45]
F. AlGheshyan, “Comparison of Ground Reaction Force in Treadmill Walking and in Overground Walking,” p. 124, 2012.
[46]
M. F. Bobbert, H. C. Schamhardt, and B. M. Nigg, “Calculation of vertical ground reaction force estimates during running from positional data,” J. Biomech., vol. 24, no. 12, pp. 1095–1105, 1991.
[47]
“No Title,” 2012.
[48]
A. Cherian, V. Morellas, and N. Papanikolopoulos, “Accurate 3D ground plane estimation from a single image,” Proc. - IEEE Int. Conf. Robot. Autom., pp. 2243–2249, 2009.
[49]
F. B. Tek, “Ground Plane Detection Using an RGB-D Sensor,” pp. 1–8.
[50]
a. K. Nasir, C. Hille, and H. Roth, “Plane Extraction and Map Building Using a Kinect Equipped Mobile Robot,” IEEE/RSJ Int. Conf. Intell. Robot. Syst., 2012.
[51]
S. Se and M. Brady, “Ground plane estimation, error analysis and applications,” Rob. Auton. Syst., vol. 39, no. 2, pp. 59–71, 2002.
[52]
A. Gonzalez, M. Hayashibe, and P. Fraisse, “Estimation of the center of mass with Kinect and Wii balance board,” IEEE Int. Conf. Intell. Robot. Syst., pp. 1023–1028, 2012.
[53]
J. Bolibar, “Kinect Audio-Runner : Audio Feedback for Improving Performance in Long-Distance Running,” 2012.
[54]
L. Ballaz, M. Raison, and C. Detrembleur, “Decomposition of the vertical ground reaction forces during gait on a single force plate,” J. Musculoskelet. Neuronal Interact., vol. 13, no. 2, pp. 236–243, 2013.
[55]
J. Blom, B. T. H. Romeny, a Bel, and J. Koenderink, “Spatial Derivatives and the Propagation of Noise in Gaussian Scale Space,” Journal of Visual Communication and Image Representation, vol. 4, no. 1. pp. 1–13, 1993.
[56]
T. Oberg, a Karsznia, and K. Oberg, “Basic gait parameters: reference data for normal subjects, 10-79 years of age.,” J. Rehabil. Res. Dev., vol. 30, no. 2, pp. 210–223, 1993.
42
ACKNOWLEDGEMENTS I would like to thank deeply all those persons that have contributed to forge ahead this project. I want to begin by thanking to my project supervisor, Xavier Binefa Valls, for give me the opportunity to carry out this project with his support. Secondly, I would l like to really thank Virginia Anderson for the data provided from its study for “Person Identification Using Anthropometric and Gait Data from Kinect Sensor”, allowing me to expand my analysis to a solid and complete database. Also, I would like to express my gratitude to Josep Maria Font, Rosa Pàmies and Joan Mateu Pla for affords me the opportunity to capture the force data in its laboratory, at Universitat Politècnica de Catalunya. In this sense, I want to acknowledge the four different centers that allow me to capture the data in a treadmill, CEM Marítim, Eurofitness UBAE Can Dragó and the cardiology Department of Vall Hebron Universitary Hospital, specifically to Lydia Dux-Santoy for the help provided. For last, I would like to special thank all the volunteers who have participated in the experiments of the project, two of them being my classmates during these four years; Xènia Martínez Adiem and Irene Martín Martínez.
43
APPENDIX Part 1: GROUND PLANE DETECTION FROM A SINGLE SCENE In this project a ground plane detection algorithm using depth information acquired with Kinect sensor was proposed. The main goal of this algorithm has been to approximate a 3D reconstruction of the ground from a single scene.
Description of the approach used to infer the ground The first step has been to acquire a depth frame captured with the Kinect (Figure 32):
Figure 32: Depth Frame acquired with Kinect. The colorbar represents the distance from each point of the scene to the sensor, showing in red the far points and in blue the points more close to the sensor
As this is computed in 2D, a coordinates mapping from the ”screen coordinates” to the “real world coordinates” (three-dimensional coordinates from Kinect: Y(height), X(width), Z(deep)) has been carried out. The coordinates mapping that has been performed consists on:
𝑋
𝑥
𝐷
𝐷
𝑦
𝑌𝐷
𝐷
1 𝑠𝑖𝑧𝑒 𝑍𝑦 2 𝑓 1 𝑠𝑖𝑧𝑒 𝑍𝑥 2 𝑓
𝑍
𝑥 𝑍
𝑦
𝐷 𝐷
𝑋
𝐷
𝑍
𝑌𝐷
𝑍
1 𝑠𝑖𝑧𝑒 𝑍𝑦 2 1 𝑓+ 𝑠𝑖𝑧𝑒 𝑍𝑥 2
𝑓+
13
Where, 2 3
Once the Kinect coordinates mapping has been done, the next step has been to manually select three different points that, at a glance, belong to the scene’s ground. These points are selected satisfying conditions in order to choose noisy points and perform a bad estimation. A function in Matlab has been created in order to manually choose the three points with the cursor and automatically return its 3D coordinates (similar to ginput function in 2D).
44
The following step has been to calculate the plane passing for these three points, obtaining a plane equation in the form
+
+
+
0 . This is needed because the approach
proposed for ground estimation is based on the Euclidean distances of all the scene points to the virtual plane manually selected. In order to obtain these distances, the following equation has been used: A,B,C,D are the coeficients from the plane equation and
dist dist
++
++ ++ ++
++
P=(
) is a point selected from the scene.
The same process has been done for all the points within the frame, in order to obtain the distances of all points of the scene, to the defined plane. Those points that have the lowest distance, selected as a threshold, were considered as a ground points. In order to identify easily these points, compute the histogram of the distances has been useful.
Results The ground cloud points can be visualized in black (Figure 33 and 34). The algorithm is able to find discontinuities and obstacles on the ground and not consider them for the estimation. In order to better visualize this ground point cloud, we can perform the inverse coordinates mapping, from 3D to the 2D coordinates.
Figure 33: Ground plane estimation in 2D space and its reconstruction in 3D, respectively
The ground has been positively detected even if the subject is not in a frontal view with respect to the Kinect, as in the next image in which the individual is totally perpendicular to the camera.
Figure 34: Ground Plane Detection with perpendicular view. The center of mass projection to the ground is visualized in white
45
Part 2: JOINT COORDINATES FILTERING The proposed method to filter the joint data coordinates obtained with Kinect has been based on identify the “outlier” values of the data. In statistics, an outlier is a sample point that is distant from the other observations, and may indicate experimental errors; in this case, primarily caused intrinsically from the body tracking algorithm. When the subject is turned sideways, some body parts are occluded by the rest of the body, the tracking algorithm is able to infer these occluded body joints, through a surrounding-joint context, but sometimes these inferences are poor, giving rise to these errors that has been mentioned in the introduction. The method that has been used to detect these extreme values is based on the Z-score. This parameter is a measure of “how many standard deviations the value is from the mean”. Hence, in order to give this measure, the mean and the standard deviation of every joint across all the frames has been firstly computed. Identifying and outlier observation depends on the underlying data distribution, for that reason, the joint position data has been assumed to have an approximately normal distribution. By displaying joint data as a normal probability plot (Figure 36), these outlier values can be reflected at first glance: the lower and upper tails of this normal distribution
graph
are
identified
potential outliers.
as
Figure 35: Normal distribution. Standard deviation and Z-score definitions (http://jungminded.weebly.com/statistics/distribution-andz-scores)
Potential Outliers
Figure 36: Normal distribution of the x coordinates and y coordinates of a joint
Based on this assumption, and seen how they are values graphically, the method to find them can be defined: it relies on Z-score. As X-score is given in units of how many standard deviations is the actual observation from the mean, the outlier detection technique is based on define a fix value for Z-score; that is: if a value is deviated more than 3 times the standard deviation (isolating “z*std” from the formula in Figure 35, where z is predefined to be 3), it will be considered as an outlier sample.
46
This value is not fixed in a random manner; it has an explanation. It can be observed that almost all the data, specifically the 99.7% of data, will be covered between zero and three standard deviations (Figure 35). Once all the outliers detected, by applying this process to all joint markers across all the acquisition frames, the aim is not to exclude these distant points, but also to replace them with a weighted sum of the value of neighboring samples in order to reduce these suddenly changes in joint positions that appears in the captured data. As the Kinect sensor takes 30 frames in one second, between consecutive frames is impossible to have a high difference between consecutive coordinates values, because it would mean a significant change in a very short time (0.033 seconds between consecutive frames). To replace the outliers instead of remove them because is better due to is more desirable to not decrease the number of frames of the acquisition, avoiding causing problems in subsequent data analysis.
Part 3: GAIT EVENT RECOGNITION ALGORITHMS Algorithm 1: Horizontal displacement differences between hip and foot (Figure 37) The first algorithm for determining gait events relies on the evolution of the horizontal position of the hip and foot: -
Initial Stance has been determined as the maximum foot horizontal displacement relative to hip joint of the same lower limb.
-
Initial Swing has been determined as the minimum horizontal displacement difference of hip and foot joint of the same lower limb.
The maximum displacement occurs when the foot hits the ground, and this distance begins to decrease gradually as it approaches to swing phase.
Figure 37: First algorithm for Gait Event Recognition (based on foot-hip displacements)
47
Algorithm 2: Step Length (Figure 38) The step length consists on the distance between the heel contact of one foot and the heel contact of the opposite foot. This parameter is obtained by taking the highest value of the difference between two heels of the feet. The second algorithm developed has been based on the temporal evolution of the step distances during cycle gait. The maximum step difference between opposite heels is reached two events: in heel strike event, when the reference foot hits the ground (initial contact, 0% of the cycle), and in pre-swing event, when the opposite foot strikes the ground as well (50% of the cycle). On the other hand, the minimum step length distance is attained in the middle of stance and swing; that is, in mid-stance and in mid-swing. Hence, by detecting the maximum and minimums in heel distances, these events can be identified automatically. As the specific beginning of the swing phase is cannot be explicitly identified with the algorithm at single glance (because does not corresponds nor a maximum neither a minimum), the algorithm contain an estimation for detect this event by averaging the difference between its adjacent phases (pre-swing and mid-swing).
Figure 38: Second algorithm for all Gait Event Recognition (based on step length)
48