Field Techniques Manual: GIS, GPS and Remote Sensing • Section C: Techniques Chapter 10: Traditional Surveying
10 Traditional Surveying 10.1 Introduction Traditional surveying is at least 3000 years old, having been used by the ancient Egyptians to mark out fields after the annual Nile floods and refined by the ancient Greek and Romans in the Classical era. Survey techniques and instruments were then re-invented in the Italian Renaissance with reference to the Arabic scholars of the 1st Millennium. Survey methods were considerably enhanced by inventions in optics, metallurgy and mechanical engineering during the 17th and 18th Centuries, which allowed the development of instruments such as theodolites, levels, compasses and sextants. This generation of optical/mechanical instruments were used to measure the 19th Century primary triangulations on which the mapping of many nations is based. In the late 20th Century digital electronic techniques such as laser distance measuring, electronic logging, GPS and handheld computers revolutionised traditional surveying, although it introduced power demands that had not existed previously. This chapter covers traditional surveying of two kinds: •
Surveying with optical/mechanical devices requiring some experience and training in data capture and logging;
•
Surveying with digital electronic techniques requiring knowledge of devices, memory and data integration with computers.
No attempt is made to provide advice on how to operate particular surveying instruments and devices: this must be obtained from the instrument owner/device manuals. This chapter simply explains the way such devices may be used to survey features in field situations and the generic principles of their use. For more detailed coverage of traditional surveying the reader is referred to a field techniques booklet produced by Keith Miller (1993), published by the Expedition Advisory Centre. Details of GPS usage for surveying are given in Chapter 11 of this handbook and an example of a ‘hybrid’ surveying project, mapping a semi-desert site in Spain using optical/mechanical and digital equipment, is given in the case studies chapter at the end of this book.
10.2 Surveying context Traditional surveying techniques generally require a line-of-sight between the instrument and a roving surveyor, or they require ground access across areas to be surveyed, or they require you to be able to see over the whole area to be surveyed. The first step in any traditional survey is to check on access permissions and the physical practicality of visiting the locations from which the surveying is to take place. This may involve testing the instrument at a possible location, for example, to see if the range of an electronic distance finder is sufficient to cover the area of interest, or if it is possible to set up the theodolite precisely level. Locations from which surveys can take place are often places where a surveyor may spend a considerable time, so ensure that you will not cause erosion, disturb birds, affect the living of anyone usually working there or put yourself at risk. In cold
180
Chapter 10: Traditional Surveying
climates you can get hypothermic standing around making nothing but small hand movements at a survey location, while the roving surveyor can be tired out by traversing rough terrain. In hot climates you can be shaded at a survey location and protected from the sun, while the roving surveyor can get sunstroke. Hence sensible rotation of jobs and appropriate equipment and protection is required.
10.3 Surveying instruments/devices 10.3.1 Optical/mechanical instruments
10.3.1.1 Theodolite An optical/mechanical theodolite is a device for measuring angles horizontally and vertically from a survey 'station' (a known location) to a survey target at a location whose position is unknown. These instruments do not measure distances directly. Basic principles of trigonometry are used to work out the internal angles of triangles that are measured, and then co-ordinate geometry techniques are used to establish positions within a national or regional reference framework for the unknown points. Most pre-1985 optical/mechanical instruments have no internal storage and no power needs, but they are still sensitive to knocks and extreme changes of temperature. They are set up on tripods with adjustable legs. Surveying cannot be carried out without tripods, so avoid damaging them or using them to hang out washing! In the case of a horizontal survey the theodolite will first be set up at a ‘station’ with known co-ordinates: this will often be a physical benchmark marked with a metal spike or nail. The station needs to be set precisely level using two bubbles arranged at right angles to each other. This is often quite time consuming, as when the theodolite is set level it is no longer directly over the benchmark; and when it is directly over the benchmark it is no longer level! A controlled iteration of these processes needs to be carried out: if one or other of these settings remains wrong, then picking up the tripod and starting again is usually better. At this point the height of the theodolite over the benchmark needs to be read precisely with a measuring tape. The horizontal angles are usually measured relative to a baseline connecting the benchmark station with another station at a visible point (a 'backsight' point) whose co-ordinates are known (usually set up for the purpose). Since the entire survey depends on the fidelity of the baseline, backsight points are usually survey targets set up on a stable tripod. The angle between the benchmark station and the backsight point will have an angle of zero degrees; all other measured angles will have values that should increase clockwise from the baseline. In the case of the vertical survey the reference datum is the horizontal, which is recorded as zero. Observed points above the horizontal range from 0 to +90 (vertically up); below the horizontal, from 0 to -90 (vertically down). Optical/mechanical theodolites can measure distances approximately using the techniques of tacheometry. The viewfinder of the instrument has three horizontal crosshairs (or ‘stadia’): the central one is used for pinpointing the centre of a survey target. The upper and lower stadia can be read off on a graduated survey pole: the distance between the two stadia when multiplied by a scale factor that varies by instrument (often 100 or 200) is equal to the distance between the instrument and the survey pole. Clearly, the accuracy
Field Techniques: GIS, GPS and Remote Sensing
181
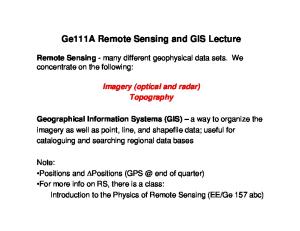
with which you can read a graduated survey pole defines the accuracy of the distance derived. Once set up and a baseline observed, a roving surveyor with a survey pole or target can be tracked by the theodolite operator who will record horizontal and vertical angles to the appropriate points as well as upper and lower stadia values for tacheometry. For precise work and as a basic check on accuracy, points can be read normally and then the instrument can be rotated 180° and the telescope 'turned over' so that the point can be read again (‘face left’ and ‘face right’ measurements). Stationary is available to structure the booking down of this kind of data. Examples are given in the EAC Simple Surveying booklet (Miller 1993). 10.3.1.2 Level To establish heights relative to a benchmark a device with a sighting telescope called a level is used (Figure 10-1), which is set up on a tripod and can be set to be precisely horizontal using a bubble. Once level, the cross hairs seen through the telescope will sight points with the same elevation, regardless of position, within the range of the instrument (typically a few hundred metres). We can now measure deviations above and below this precisely level line using a graduated measuring staff: the level operator records the values read off on a graduated survey pole through the telescope. Values read off the pole that are greater than the height of the level instrument above the benchmark indicate that the ground on which the pole stands is below the benchmark height and vice versa.
Figure 10-1 Sighting through a level mounted on a tripod.
182
Chapter 10: Traditional Surveying
10.3.1.3 Plane table Plane table surveys are a form of scale drawing. They establish the location of points on the ground relative to a baseline by viewing them from different locations and finding the intersection of lines of sight. The sightings are made from a small level table (hence ‘plane’ table) from two fixed points called 'stations' at either end of a measured baseline. Use a surveyor’s tape to measure the length of the baseline and to keep it as straight as possible. The sights, or ‘rays’, are made using a ruler with fold up sighting hairs called an ‘alidade’, and the rays are drawn on paper fixed to the plane table. You can also sight along the edge of a standard ruler, but the results will not be as accurate. Under extreme circumstances you can ‘sight’ and record a ray using a laptop screen as the ‘plane’ and draw the lines in a drawing package. 10.3.1.4 Barometer A barometer measures height above sea level using the (known) decline in atmospheric pressure with altitude. These need to be calibrated at known height, especially after being taken on a plane. Small lightweight devices are available that will give reasonable assessments of height on any given day, but absolute height values may vary between days if atmospheric pressure systems change with weather systems. They are usually rather volatile and cannot be used to measure small variations in height (less than ~20 m). Some GPS units can now be purchased, which have a barometric altimeter built into the unit. This can provide a good second source of altitude data to confirm the accuracy of the GPS location. 10.3.2 Digital electronic devices
10.3.2.1 Total station A total station is a theodolite that incorporates distance measuring using a laser or infrared beam, along with internal/external electronic data logging (Figure 10-2). These devices save the surveyor from collecting multiple measurements for each point location whose position needs to be known, as triangles can be constructed trigonometrically once you know one internal angle (between baseline and unknown point) and two edge lengths (the baseline and measured distance to unknown point). Total stations have LCD displays where you can set up the kind of survey task you want to carry out and it will prompt you for set up data (co-ordinates of the benchmark, height of the instrument over the benchmark etc.). The total station will then log the observations that you make, which can save on recording errors (unless you lose the data!). Rigorous checks need to be carried out on how the data is being stored to ensure its integrity and it should be downloaded and backed up as soon as the survey is complete. To prevent data loss, it is advisable to manually record data whilst surveying. If using a prism based system, the station operator will typically have to wait whilst the roving team member moves to the next location, giving the opportunity to record data. Newer total stations sometimes do not require a prism and second operator. The laser or infra-red beam is of sufficient intensity and the receiver sufficiently sensitive, that reflections from typical Earth surface materials (rocks, tree trunks, etc) are sufficient to provide a measurement. These units are especially useful when the area of interest is inaccessible due to hazards such as overhanging unstable rocks or slopes, deep or fast moving water or other limiting factors, such as disturbance to the feature to be surveyed. The range of the beam is somewhat limited (typically around 100-200 m) compared to
Field Techniques: GIS, GPS and Remote Sensing
183
traditional prism based stations (up to 4 km), but their advantages in close-range surveys is significant, particularly in reducing necessary manpower and increased speed of data collection (not having to wait for the prism holder to move to the next point). The biggest disadvantage with these units is their cost. As with all newer technology, they tend to cost more to hire or buy than traditional total stations.
Figure 10-2 Total station mounted and ready to use on tripod. Note the use of a prism with this system. LCD display shows Easting and Northing of prism position.
Integration of total stations and GPS, either differential or stand-alone, can enable field data to be integrated with other map information in real time. Surveying the baseline with a GPS system, or deriving the accurate location of the line in map co-ordinates in some other way, allows this information to be used in surveying subsequent points. The baseline information, when input into a total station with the correct functionality, will enable the total station software to convert all subsequent measurements to map co-ordinates in real time without the need for post-processing. This can aid in collecting and processing data, and allow the effectiveness of data collection to be gauged on site. This functionality is common in total stations and can provide so many advantages that potential users are encouraged to ensure this option is available to them. Total stations are relatively bulky items and are also easily damaged, particularly the internal sensors and optics. Careful packing and transport are essential, and vehicle transport is recommended wherever possible. 10.3.2.2 Ground-based laser scanners A number of companies now offer tripod mounted automatic laser scanning survey instruments. These effectively scan a horizontal and vertical field from a static location. The technology is similar to a total station, but the system scans a measurement beam at regular intervals across a field of view to build up a ‘cloud’ of points that can be used to
184
Chapter 10: Traditional Surveying
produce a 3D surface of the imaged area. These systems are complex and delicate pieces of equipment, and although necessarily relatively rugged, may be too bulky and delicate to transport to a very remote location. Power requirements for these systems are likely to be significant too in remote areas. As this is relatively new technology, the costs of this kind of kit are also high, the retail price of a Cyra scanner being over £50,000. The systems can be hired, but insurance may be impossible to arrange. Some University departments do own these types of scanner, so an enquiry may be worthwhile. 10.3.2.3 Handheld computers Hand held computers, personal digital assistants (PDAs) or smart-phones can be used with total stations and other equipment as external data loggers. Which units are compatible with which system is very variable and the method of data logging should be decided upon when considering which system to use. The use of data loggers raises more issues about power supply, however, as well as data security, so backups should always be in place. Some total stations and other surveying systems have limited ports for linking, a good example being the Leica TCS1600 series. These stations have a single power/data port, meaning that either an external battery can be used or a data logger, but not both simultaneously. As the internal battery is more prone to damage/discharge, an external battery and data recording in a field notebook would be recommended.
10.4 Survey techniques 10.4.1 Tacheometry Full scale mapping can be carried out using survey instruments to position features and connect them into a network of measured triangles using the procedures of tacheometry. This is beyond the scope of this chapter but is covered in full in the EAC Simple Surveying guide (Miller 1993). 10.4.2 Traversing with a level Firstly, unscrew the leg clamps on the tripod and extend the legs to their full length, reclamping them and setting the tripod upright. Now bed the legs in the ground firmly such that the apex of the tripod is roughly level. Taking the level instrument itself, place it on top of the tripod and using the screw rod under the apex screw it into the tripod, but not fully tight until after finalising the levelling process. To make the level sight horizontally the bubble in the oil filled capsule must be made to rest in the graduated circle. This is achieved by moving the level around slowly on top of the tripod until the bubble brought to rest in the circle. Once level look through the telescope and bring some distant object into focus. Now turn the eyepiece itself until the cross hairs are sharply in focus at the same time as the distant object. The crossing point of the two long lines at the centre is the horizontal level defined by the instrument. Practice focussing on the levelling staff and learning to read the graduations which are marked in 5 cm high 'E' shapes: first read the large number (e.g. 1.9) below the cross hairs, then estimate the two-figure number in mm up the 'E' shape (e.g. 33) and finally add together to get a reading (e.g. 1.933 m). Remember that the staff must be held absolutely vertically to reduce errors.
Since the level can only sight horizontally, we use the graduated staff to measure heights relative to this horizontal line. Hence if you read 1 m on the staff through the level in
Field Techniques: GIS, GPS and Remote Sensing
185
location A and 3 m on the staff in location B then location A is 2 m higher than location B. If location A is a benchmark then we know the height of location B. Note that the height of the level above the ground does not matter since you are establishing relative heights. The normal practice for levelling profiles (Figure 10-3) is to make sights both backwards onto a benchmark (a ‘backsight’) and forwards onto new target locations ('foresights'). Although you can measure many relative heights with the level located in one spot, to make a traverse you need to move the level position from time to time. In this case the staff must remain exactly in its last position (i.e. a foresight location) whilst the level is moved and re-levelled. Now you can measure a backsight onto the staff still in its last position, and work out the difference in height between the horizontal lines measured by the level. It follows from this that there is always only ONE backsight for each level location (onto a benchmark or previous staff location), whereas there may be many foresights, although one of them (the ‘change point’) is used to link to the next set of observations. The levelling readings should be recorded as shown in the table in Figure 10-3, indicating which measurements are backsights and which are foresights. Start with a backsight on a separate line and place the first foresight on the next line in the appropriate column. Further foresights are known as ‘intermediate sights’ and can be recorded one per line in that column, along with a full commentary on the location being heighted. Finally you will need to work out the 'rise' or ‘fall’ from one point to another and established the 'reduced level' of the location by relating these to the benchmark height. Once you have carried out the calculations you can plot the results up on graph paper to showing your long profile. An example of a levelling survey table and profile over a soil erosion plot in Zambia is shown in Figure 10-3.
x4 Bs
x1
x2
x5
Is
Fs x3
Is x6 x7
Bs
Is
Fs
x1 x3
Rise (FB)Level
x8
x9 x10
Comments Benchmark height
x2 x4 x5
x7 x9
x6 x8 x10
Figure 10-3 Profile cross-section and data recording table for levelling, showing 'backsights' and 'foresights' and method of data recording in the field.
186
Chapter 10: Traditional Surveying
Figure 10-4 Detailed contour map of a soil erosion plot, produced using a surveyor’s level and tachometry, from a geomorphology and land use map of river terraces in the Luangwa valley, Zambia (Teeuw, 1990).
10.4.3 Plane tabling First you need to establish a base line on the ground of an appropriate length (decide what is appropriate) using a measuring tape. This should be at right angles to the feature to be mapped, e.g. a salt marsh creek (see Figure 10-5). Place a peg in the ground at each end of the base line: these are the ‘stations’. Now move your plane table to one of the stations. Screw the tripod into the table and adjust the legs so that the table stands level and stable. Second, fix the paper squarely to the table using the masking tape; then get out the alidade and unfold the sights.
Next you need to draw a line along the long edge of the paper as in Figure 10-5, making the length of the line on the paper a scaled representation of the base line ground length, and marking the stations (use the maximum length of the paper). Now adjust the location of the plane table so that the station marked on the paper is exactly over the peg in the ground marking the location of the station. Place the alidade along the base line marked on the paper and rotate the table until you sight the position of the other station marked by a peg. Since you will not be able to see the peg someone will need to stand at the location with an arm raised or holding a pole. Now use the compass provided to mark the direction of magnetic north once your table is ‘oriented’. Finally, clamp everything, since nothing must now move until you finish work at this station.
Field Techniques: GIS, GPS and Remote Sensing
187
1 2
4
3 1
2 3
5 creek
4 5 rays
Station A
Base line
Station B
Figure 10-5 Example of plane table surveying.
You now need to send out group members to locate ‘significant’ points along the creek length which control its shape. The aim of this exercise is to capture the shape of the (say) salt marsh creek as effectively as possible using a conservative number of points. This process of data capture on the ground is a crucial step in any study and so you should consider how best to represent the actual shape of the landform in the necessarily simplified form of a map, either by choosing significant features you see or using other sampling techniques (such as mapping every 10 m along linear features). As illustrated in Figure 10-5, the location of each position must be tightly controlled (usually through placement of ground pegs or nails) as each location must be visited twice. Hence, start by sighting the first peg location using the alidade: place the edge of the alidade against the location on paper of the station from which you are sighting and swing it round until you sight the person stood at the peg location. Now draw a pencil line from the station to the edge of the paper and label it with a number. Continue sighting peg locations and marking rays from the first station until you have captured what you consider to be enough points. When you have finished at one station, move the table to the other and set up once again, remembering to rotate the table so that with the alidade placed along the paper base line you sight the location of the other station exactly. Now simply re-visit the peg locations drawing a second set of rays, which will now intersect the first set of rays. Mark each intersection with a circle when you make it. Make sure you collect all the pegs you have placed. Remember, if you miss a peg when measuring the second set of rays your locations will be completely wrong! The results of this exercise are all on the map that you have made as you carry out the survey. The big advantage of this method is that you can see any major mistakes during the survey as you plot them, allowing rapid corrective re-surveying. At the crossing of the rays sighted from each station to the same peg location you should have marked the intersections. You can now join up the intersections with an inked line: this should give
188
Chapter 10: Traditional Surveying
you the plan form of the creek to scale. One point to ponder - should you use a straight or curved line? 10.4.4 Resectioning You can find your current position if you can see at least three conspicuous landmarks that also appear on a map or whose positions you know. Simply measure a compass bearing as accurately as you can to each of the landmarks and correct them for magnetic variation to true north, preferably using a sighting compass. Then draw a line from each landmark on the map at the angle of the bearing. They should meet at a point, which is your current position. If there are errors in the bearing, then the lines may form a small triangle, which is a zone of uncertainty, known as a ‘triangle of error’. When checking or adjusting bearings to reduce these errors, bear in mind that the amount of each error – the amount of ‘swing’ from the true bearing - will be proportional to the length of that line. 10.4.5 Tape and compass traverse Basic surveys of small areas can be carried out using a surveyor’s tape and a compass to measure the length and orientation of features you can visit and delineate e.g. archaeological remains. Clearly, distances will only be true if the tape is straight and unknotted: this can be hard to ensure in windy conditions, in flowing water or where there is thick vegetation. Compass ‘bearings’ are measured relative to magnetic north and need to be corrected to true north by a small ‘magnetic variation’ angle to account for the fact that the magnetic north pole is in a slightly different place to the geographic north pole and is moving slowly (!), in a process known as ‘magnetic declination’. Information on this is usually given in the margins of local large scale maps, with a rate of change per year: however, you only need to correct bearings if you want to plot them on a map. Magnetic or metal objects worn on the body or carried with you like pendants, belt buckles and mobile phones can easily alter compass measurements unless you keep the compass clear of them. The compass traverse technique is particularly useful when surveying relatively flat terrain where there is poor inter-visibility of features: e.g. there are few prominent hills and/or the vegetation is too high and dense to make plane table or resection bearings. 10.4.6 Contouring Using a barometer (or GPS receiver), and where it is physically practical to do so, you can attempt to walk ‘around’ a hill or ‘across’ a slope while remaining at the same height. Given a suitable map you can plot your route (and that of the contour) directly. However, it is probably best to carry out a contour survey in conjunction with a plane table survey or a survey traverse. 10.4.7 Slope steepness surveys An inclinometer, such as those produced for foresters to estimate the heights of trees (e.g. by Suunto of Finland), or an Abney Level, can be used to produce very rapid surveys of slope steepness variations. Contours are not involved; instead, breaks of slope – whether sharp or gentle, convex or concave – are plotted to produce a morphometric map of the study area. This type of survey is often used in rapid geomorphological and geo-ecological surveys, and is particularly useful where details of soil type, drainage and vegetation cover are recorded at the same time as each slope steepness measurement. The slope steepness survey could follow existing footpaths as part of a compass traverse survey, but is most effective when following survey lines that run perpendicular to the main breaks of slope.
Field Techniques: GIS, GPS and Remote Sensing
189
An ideal setting for this technique is a set of parallel survey lines, 100 m apart and running perpendicular to a baseline along the floodplain of a river, up to the crests of adjacent hillslopes, where another cross-line allows access to the survey lines and provides a check that they are still 100 m apart. The first stage of this technique involves the observer standing as straight as possible, sighting the inclinometer against a nearby survey staff (or suitable piece of local timber!), while an assistant marks the height on that staff at which the inclinometer reads ‘0’ – i.e. the height of the observer’s eyes above the land surface. Inclinometer readings on the survey are typically taken at 25 m intervals, with the observer sighting the inclinometer on the ‘eye-height’ mark of the staff held by the assistant: the angle given by the inclinometer is the slope over the 25 m sample interval (see Plate 19). Small geomorphological features, such as gullies, can still be recorded using tape and compass measurements. An example of a slope morphometry survey sheet from a single survey line of a mineral exploration project in Indonesia is given in Figure 10-6. Many of the major advances in land surveying techniques over the past 400 years resulted from the demands of marine navigation, as the nations of Europe set about world-wide exploration and trade. A key aspect of determining the course travelled by a ship was based on ‘dead-reckoning’, with distance estimated from lengths of knotted rope – hence the use of ‘knots’ for nautical speed – and direction calculated from the positions of the sun and stars. In essence this is similar to the tape and compass traverse surveying technique discussed above. A modern variant of this technique uses the odometer (‘mileometer’) readings of vehicles, coupled with compass bearings or GPS readings to navigate. This is a particularly effective navigation technique in remote, featureless and relatively flat regions, such as the Sahara and Namib deserts. Tom Sheppard (1998) provides a useful summary of dead-reckoning navigation techniques, including use of remote sensing images and GPS, in his Vehicle-dependent expedition guide. A variant of dead-reckoning vehicle navigation can be used as a sampling technique when carrying out a reconnaissance survey: the odometer is used to determine the distance travelled, with samples collected every kilometre.
190
Chapter 10: Traditional Surveying
Figure 10-6 Slope steepness survey: transect line cross-section from an alluvial gold deposit, Indonesian Borneo.
10.5 Checking, logging and downloading survey data Surveys are only as good as the data you record. Sometimes data is wrongly recorded, sometimes it is lost and sometimes you do not know what it means when you get back home. To avoid such tragedies, check the work as it is done, record the essential survey metadata and backup your results. Do not throw away data that you cannot work out: an expert may be able to deconstruct it later, and do not dispose of paper records once you have the data in digital form once back home, office PCs can crash just as easily as fieldbased computers! A good survey can provide a framework for your project and can leave a record that future researchers can use. It is worth doing well and recording for posterity, you (or others) may want to expand your research in the future and your current survey may form the basis that underpins that future project.