Estimates of the Equilibrium Exchange Rate of the Renminbi: Is There a Consensus and, If Not, Why Not? William R. Cline and John Williamson Peterson Institute for International Economics Paper presented at the Conference on China's Exchange Rate Policy Peterson Institute, Washington DC October 12, 2007 © Peterson Institute for International Economics. All rights reserved.
Introduction The answer to the first of the two questions addressed to us is clearly “No.” The 18 studies summarized in Table 1 reveal widely differing answers being offered in the literature, even sticking to post-2000 estimates, and even when one recognizes (as not everyone has done) that an effective exchange rate is a totally different creature from a bilateral dollar exchange rate and that one should expect estimates of undervaluation on each concept to be quite different.1 Nonetheless, of all 18 studies, only one (Wang) tries to argue that the renminbi might be overvalued. Moreover, the average estimates indicate substantial undervaluation. The simple average for the 14 estimates of the correction needed in the real effective exchange rate is 20 percent appreciation; the corresponding simple average for the 16 estimates for the bilateral rate against the dollar is an appreciation of 40 percent.2 The undervaluation shows signs of growing worse over time, as the average real effective appreciation needed rises from 17 percent in studies using data in the period 2000–04 to 27 percent in those using data for 2005–07 (table 1).3 Thus, although most of this paper concerns the answer to the second question, the source of differences among the estimates, dispersion of the individual results should not divert policy attention away from the forest and onto the trees.4
1
Moreover, several leading economists wish (or wished, prior to July 21, 2005) to maintain an unchanged bilateral dollar exchange rate, and therefore presumably do not regard it as meaningful to speak of misalignments, including Robert Mundell (2004); Ronald I. McKinnon (2006); and Michael Dooley, David Folkerts-Landau, and Peter Garber (2003). 2
The extreme Big Mac estimate of 138 percent needed appreciation is omitted from this average because the “simple” PPP approach is widely regarded as inappropriate. 3 The corresponding drop in the bilateral correction from 42 percent to 38 percent is misleading because none of the enhanced purchasing power parity (PPP-E) studies are for the latter period, and it is this approach that systematically produces the highest estimates of undervaluation. 4 Thus, we fundamentally disagree with Dunaway, Leigh, and Li (2006) and Cheung, Chinn, and Fujii (2007) that the variations are so wide as to preclude drawing policy implications.
2 Table 1 Estimates of Renminbi Appreciation Needed to Eliminate Undervaluation (percentage) Study
Year
Anderson (2006) Bénassy-Quéré et al (2004) Bénassy-Quéré et al (2006) Big Mac Bosworth (2004) Cheung, Chinn & Fujii (2007) Cline (2005) Cline (2007) Coudert & Couharde (2005)
2006 2001 2004
REER range
16
(a) FEER BEER
31–45
30–59
BEER
138 67 ≈ 100
PPP-S PPP-E PPP-E
45 34–39 41–50
FEER FEER PPP-E
18
BEER
44–54 56 12–14
FEER PPP-E BEER
21 11–18
2002
Frankel (2006) Funke & Rahn (2005)
Goldstein (2004) Goldstein & Lardy (2006) Goldstein & Lardy (2007) Jeong & Mazier (2003) MacDonald & Dias (2007) Stolper & Fuentes (2007) Wang (2004)
Approach
18–25 41–44
2007 2004 2007 2005 2007 2003
Bilateral dollar rate range
2002–03 2000 2002
23–30
2004 2004
15–30 20–35
FEER FEER
2007
35–60
FEER
2000
29
2007
8–42
3–6
2007 (b) 2007 (c) 2003
67
FEER BEER
7
BEER
15 5
FEER BEER
0–5
FEER
FEER 0 to –5 Wren-Lewis (2004) 2003 19–22 FEER Average All 20 40 (d) Average A 2000–2004 17 42 (d) Average B 2005–07 27 38 (d) Notes: (a) BEER: behavioral equilibrium exchange rate. FEER: fundamental equilibrium exchange rate. PPP: purchasing power parity. –S: simple. –E: enhanced. (b) GS-DEER model. (c) Elasticities model (d) Excluding Big Mac.
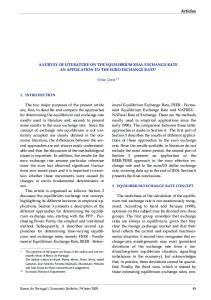
3 This study first reviews methodological issues associated with the three main measurement approaches: purchasing-power parity (PPP), behavioral effective exchange rate (BEER), and fundamental effective exchange rate (FEER), as well as the concepts of multilateral (real effective) and bilateral misalignment. Next it examines the results of each of the studies considered, grouped by each of the three approaches. The paper concludes with a summary overview of the estimates and the reasons for the differences among them. Approaches and Methodological Issues5 PPP – One ancient if not very well-respected approach to identifying equilibrium exchange rates is to find the exchange rate that would lead to purchasing power parity (PPP). The Big Mac index of the Economist falls squarely into this category, even if the price index used to establish PPP contains only one good. Much more meaningful are the several estimates based on an “enhanced PPP” approach. This approach starts from the strong empirical regularity linking per capita income with the real effective exchange rate and rationalized by the Balassa-Samuelson analysis which suggested that the productivity rise associated with development is concentrated primarily in tradables. The consequence is that the ratio of the market exchange rate to the PPP exchange rate is well below unity for low-income countries, and eventually rises to approximately unity at the per capita income levels of the rich countries, as illustrated in Figure 1.6 Undervaluation or overvaluation is defined as the percentage by which a country’s exchange rate diverges from the regression line linking per capita income and the RER.7 It is possible for the regression line to take account of other variables beyond real per capita income that may systematically influence RERs, such as net foreign assets or the terms of trade. In this case, enhancement of the PPP approach goes well beyond including a Balassa-Samuelson effect and incorporates variables that often feature in the BEER approach, such as productivity growth and net foreign assets.
5
Throughout this paper we measure the real effective exchange rate (REER) in the normal way, as the price of a nation’s output relative to the trade-weighted price of other nations’ outputs, typically as deflated over time by consumer price indexes. The Salter-Swan-Scandinavian-Chicago-Latin American alternative definition as the ratio of the domestic price of tradables to the domestic price of non-tradables will correspond to this measure so long as the price of tradables moves 1:1 with the exchange rate and the price of non-tradables is unaffected by the exchange rate. 6 Data are for 2005 for 138 countries with population exceeding 1 million (World Bank, 2007). 7 Note that this relationship is also used by Rodrik (2007) and Bhalla (2007) to identify undervaluation. Both authors argue that undervaluation can contribute to growth, Rodrik because of the need to offset purported greater contracting difficulties in the tradable sector and Bhalla more simply in a neo-mercantilist sense that does not take account of pressures on inflation that would result from chronic current account surpluses (Meade’s “internal imbalance).
4 Figure 1 Ratio of Market Exchange Rate to PPP Exchange Rate and Real Per Capita Income 1.8
1.6
Market Exchange Rate/PPP Exchange Rate
1.4
1.2
1.0
0.8
0.6
0.4
0.2 China 0.0 6.0
6.5
7.0
7.5
8.0
8.5
9.0
9.5
10.0
10.5
11.0
Log of per capita GDP, PPP
We are skeptical of the enhanced-PPP approach in general and its application to China in particular. One major limitation of the approach is that by definition it means the United States can never be over- or undervalued: the United States is the numeraire for PPP exchange rate equal to market rate. This is a gaping hole for an analytical approach, considering that the US current account deficit currently absorbs the vast bulk of combined surpluses of the rest of the world. More generally, there is ample historical experience (including that of China today) to show that the deviation of the PPP/market exchange rate ratio (PPP/er) from the international norm can be a wholly misleading guide as to whether the country has a current account surplus or deficit, let alone whether the balance is a meaningfully sustainable equilibrium. For China, it is well known that the available price surveys are much less reliable than for most countries.8 It is also well known that China is an extreme outlier, with low domestic prices. The presumption is thus that China’s prices have been measured unreliably at below actual levels. If so, then the percentage shortfall of x from the actual level will not only impute an undervaluation of x percent. It will also overstate the real per capita income on the horizontal axis, thereby making the seeming shortfall from the international line even greater and registering an undervaluation greater than x percent.
8
Lardy, 1995; Cooper, 2005; Heston 2001.
5 Figure 2 illustrates these problems with interpreting divergence from adjusted PPP as a guide to exchange rate policy. The figure shows the ratio of the PPP exchange rate to the actual exchange rate on the left vertical axis and current account surplus as a percent of GDP on the right vertical axis. 9 When the PPP/er measure is higher, the currency is asserted to be more undervalued. The first panel, for Japan, shows a clear correlation between the degree of exchange rate undervaluation and the current account. Direct comparisons can be made for Japan because it is now at about the same per capita income as the United States and so does not require Balassa-Samuelson adjustment. Thus, from 1995 to 2006 the PPP/er ratio has risen from 0.54 to 0.95, and over this period the current account surplus has risen from 2.1 percent of GDP to 3.9 percent. Importantly, however, the PPP metric would seriously misjudge even the case of Japan’s misalignment, because the level for the entire period would judge Japan to have been continuously overvalued rather than undervalued (i.e. for 1986 and all years thereafter the ratio of the PPP exchange rate to the actual exchange rate is below unity). If we take 2 percent of GDP as a more appropriate current account equilibrium range for Japan than 4 percent, then the equilibrium PPP rate for Japan implied by the figure is only about 0.6. That is, the international basket of goods and services can cost about 50 percent more in Japan than in the United States with external equilibrium still being maintained. So the Japan example suggests that the PPP approach may be useful in examining trends but not in identifying over- or undervaluation at a point in time. Figure 2 PPP/Actual Exchange Rate and Current Account Balance (ratio, left, and percent of GDP, right) A. Japan
B. China
1.4
5
6
10
1.2
4.5 4
5
8
4
0.8
3.5 3
0.6
2.5 2 1.5 1
0.4 0.2
0.5 0 1984 1985 1986 1987 1988 1989 1990 1991 1992 1993 1994 1995 1996 1997 1998 1999 2000 2001 2002 2003 2004 2005 2006
0
ppp/er ca%
6 4
ppp/er
2
ca%
3 2
0
1
-2
0
-4 1988 1989 1990 1991 1992 1993 1994 1995 1996 1997 1998 1999 2000 2001 2002 2003 2004 2005 2006
1
The PPP approach is even less coherent with the current account outcome for China. The current account surplus soared from 1 percent of GDP in 1994–96 to 9 percent in 2006 in a period when there was a small reduction registered in the PPP-
9
Data are from the IMF WEO data base. The PPP/er ratio is the ratio of GDP in dollars at purchasing power parity to nominal dollar GDP at the current exchange rate.
6 gauged undervaluation. This rough comparison does not incorporate a BalassaSamuelson adjustment, but such an adjustment would merely accentuate the conclusion. BEER. A behavioral equilibrium exchange rate (BEER) aims to estimate the index level to which the market exchange rate might be expected to revert in the medium or long run, given an absence of shocks.10 Unlike enhanced-PPP, which deals in direct price comparisons for internationally comparable baskets of goods, the BEER deals with indexes over time of domestic versus international prices and exchange rates. It implicitly assumes that the currency was on average in equilibrium over the period for which the estimation was made, which means that it is only possible to use the BEER to determine whether the country is under- or overvalued in comparison with its own past averages, not on an absolute basis. The analysis typically examines the departure of the country’s observed REER at the latest date available from the equation-predicted BEER to determine whether the country is under- or overvalued, but this is only as good as the assumption of an equilibrium average real exchange rate over the sample period. The BEER is typically specified as a function of productivity (or, what amounts to the same thing, of relative productivity in the tradable and nontradable goods sectors); net foreign assets (NFA); openness (high protection implies a limited need for exports to balance the current account and therefore allows an uncompetitive currency); and sometimes the level and/or composition of government expenditure. It may also be specified as a function of the average current account balance or variables (such as demographic variables) that are thought to influence the average current account balance. Other variables are occasionally added. BEERs are the basis on which estimates of equilibrium real exchange rates (ERERs) are usually calculated.11 A problem with some BEER estimates is that they are calculated from a regression for a single country rather than from cross-country experience. Such studies are surely incapable of examining whether a country’s policy intervention is or is not making the country over- or undervalued. Suppose a country persistently intervenes to keep its currency from appreciating, while accumulating ever-rising reserves. By most definitions this country will be increasingly undervalued. But if a regression is run for this country alone, comparing today’s exchange rate against an earlier exchange rate using such variables as net foreign assets, the premise that the country must have been in equilibrium for the full period on average will simply force a negligible coefficient on net foreign assets, whereas a larger coefficient estimated from cross-country data would diagnose increasing undervaluation. FEER – The third approach is the Fundamental Equilibrium Exchange Rate (FEER), or macroeconomic balance, concept of equilibrium. This is a concept that was introduced into academic analysis by one of the present authors (Williamson 1983) and has been widely employed by the IMF, including as the basis for the first and third approaches to estimating equilibrium exchange rates described in IMF (2006). The basic idea is to search for a set of exchange rates that will simultaneously achieve internal and external 10
The BEER approach was introduced by Clark and MacDonald (1998). They also provide the basis for the second of the IMF calculations of exchange-rate equilibria (IMF 2006).
11
7 balance in every country (Meade, 1951). Internal balance is defined as noninflationary full employment or whatever is judged to be the optimal pressure of demand. In an era when long-run Phillips curves are widely believed to be vertical (except, perhaps, at minimal inflation rates), there is not much room for arguing about levels of internal balance. External balance is far more controversial. Everyone agrees that a current account balance has to be sustainable to be called “external balance”, but it is easy to argue that this does not pin down values uniquely. Many authors have argued that it has to be a normative concept, and that is certainly one interpretation.12 Traditionally the assumption has been that the current account target should be either a moderate deficit (e.g. 1 to 3 percent of GDP) or at most a modest surplus for most developing countries, and a surplus for rich countries, on grounds that capital should be expected to flow from the latter to the former. Two additional elements are key to estimating under- or overvaluation, beyond identifying the target current account. First, it is necessary to determine how much of the present current account divergence from target is strictly cyclical and transitory, a step that turns out to be critical for China. Second, it is necessary to know the appropriate price elasticities and pass-through ratios for exports and imports in order to calculate how much the exchange rate would need to move to close the gap between the (cyclically-adjusted) actual and target current account balances. For China, an important consideration in judging trade elasticities is the relatively large share of imported intermediates used in the production of exports. Even after taking account of this influence, China’s current account should be expected to show relatively high response to the real exchange rate in light of its large share of trade in GDP.13 Bilateral versus multilateral misalignment – Whichever of the three approaches is used, it is important to recognize the difference between estimates of bilateral undervaluation against the US dollar and multilateral undervaluation of the currency on a trade-weighted real effective basis. The central point in this regard is that the relationship between them is contingent: the degree of difference will depend on whether there is a generalized realignment of other currencies against the dollar or instead a correction just by China. In the extreme case of revaluation solely by China, the two measures are identical. In the more policy relevant context in which much of Asia would also tend to revalue if China were to do so (including Japan, Malaysia, Singapore, Taiwan, and arguably Philippines, 12
It was presumably an attempt to escape from a normative definition of external balance that led the IMF to introduce its third concept of equilibrium exchange rates, which defines these as the set that would achieve current account outcomes that would keep ratios of NFA/GDP unchanged. 13
Without special treatment for component imports used in exports, Cline (2005) estimates that a 1 percent rise in the real exchange rate should be expected to reduce China’s current account balance by 0.3 percent of GDP. Exports of goods and services were 40 percent of GDP and imports 32 percent in 2006. Perhaps 40 percent of imports are for intermediates used in exports, so half of imports are re-exportable components and half are final goods. Suppose the price elasticity is unity for exports and for final-good imports. With unitary elasticity, appreciation will leave the renminbi value of final-good imports unchanged. The other half of imports will decline linearly with exports. So a 1 percent real appreciation will reduce exports by 1 percent or 0.4 percent of GDP, while reducing component imports by 1 percent or 0.16 percent of GDP, placing the overall result at 0.24 percent of GDP reduction in the current account.
8 India, and Thailand), the bilateral appreciation against the dollar will be considerably larger than the real effective appreciation. Otherwise the appreciation of the other currencies against the dollar would erode the real appreciation of the renminbi and leave the current account in surplus above the target level. A Review of Estimates PPP-Based Studies. The only simple direct PPP comparison is The Economist’s Big Mac index. Specifically, we have included the latest calculation found on the internet at the time of writing this article, which suggested an undervaluation of 58 percent in mid-2007 published in the issue of July 5, 2007. Correspondingly, it would require a rise of 138 percent in the renminbi against the dollar to place the cost of a Big Mac at the same price in dollars in the two countries.14 The first enhanced PPP study in table 1 is that by Barry Bosworth (2004), prepared for the Tokyo Club. Most of this paper was devoted to expounding the principles involved in calculating misalignments, but the one time the author mentions figures he points out that, while a simple PPP comparison would suggest that the renminbi’s value would need to quadruple, the standard Balassa-Samuelson analysis implies that this would be excessive. Taking account of per capita income, the renminbi is still undervalued, but “only” by an estimated 40 percent, indicating a revaluation of 67 percent would be needed to eliminate undervaluation. However, Bosworth notes the fragility of this approach and points out that the departure from the PPP line is “even larger for India, a country whose exchange rate has attracted little claim of being undervalued” (p. 11) Coudert and Couharde (2005) have entries in all three schools of approaches. Their enhanced PPP estimate places Chinese undervaluation between 41 percent and just over 50 percent, depending on whether they omit some countries from the regression. Frankel (2004) is primarily concerned to discuss the merits of various exchangerate regimes for China, but his paper also utilizes the enhanced PPP approach and on that basis estimates that the renminbi was about 36 percent undervalued relative to the dollar in the year 2000 (i.e. a revaluation of 56 percent would be required to eliminate undervaluation). Frankel also finds, however, that the undervaluation was almost identical to this amount in 1990 (at 34 percent). The unchanged degree of undervaluation in the face of far higher current account surpluses in recent years raises further doubts about the reliability of the enhanced-PPP approach in general. The most recent enhanced-PPP study for China is that by Cheung, Chinn, and Fujii (2007). They estimated their model on annual data over 1975–2004, and had by far the largest country sample, of 132 countries. The equation for price level relative to US price level is estimated on a joint time series/cross-section basis, and a correction for serial correlation is introduced. The renminbi is estimated to be undervalued by about 50 percent in various alternative specifications, implying a needed revaluation of about 100 14
For an undervaluation of x percent, the appreciation needed for correction is: 100 ([1/(1-.01x] -1).
9 percent. However, the authors then argue that there is no evidence of undervaluation because the results lie within 2 standard errors of zero. We suspect that the authors have conducted the wrong test. The relevant standard deviation is not that for the observations (i.e. square root of sum of squared residuals) but instead the standard deviation of the regression line itself based on the standard errors of the parameter estimates. These are actually estimated quite tightly: the standard error is only 8 percent of the constant coefficient and 2 percent of the coefficient on the log of relative income. The central regression line states that China’s ratio of actual to ppp exchange rate should be 0.481, at China’s relative ppp per capita income. Dropping the line by two standard deviations of the regression estimates places the lower corridor at 0.449, at the same relative income. In contrast, China’s actual er/ppp ratio is only 0.21, far below two standard deviations of the regression estimate.15 So although we consider the enhanced-PPP approach to be fragile and less reliable than the BEER and FEER alternatives, we do not consider the statistical inference by Cheung, Chinn, and Fujii to provide a sound basis for rejecting the approach. The simple average for needed real appreciation bilaterally against the dollar in the four enhanced-PPP approaches in table 1 is 67 percent, considerably above the average of the other approaches. Even after enhancement for the Balassa-Samuelson effect, then, the PPP approach appears to give high estimates for the amount of correction needed. This may reflect a bias introduced by understatement of the price of an internationally comparable basket of goods in China, as suggested above. BEER Estimates. BEER estimates can differ because of differences in independent variables, estimation periods, country samples, and estimating techniques. All of the BEER studies include the productivity variable, and all except one (MacDonald-Dias) include net foreign assets. It turns out, however, that the crucial distinction in this set of studies is whether the model is estimated using an international panel approach or instead uses data solely for China. The two BEER studies in table 1 by Agnes Bénassy-Quéré and her coauthors (Bénassy-Quéré et al., 2004, 2006) aimed to estimate the equilibrium exchange rate of the renminbi in the context of simultaneous estimation of the equilibrium exchange rates of all the major currencies whose countries are members of the G-20. The first study placed the real effective appreciation needed to eliminate undervaluation at 16 percent and the corresponding bilateral rise of the renminbi against the dollar at about 40 percent. The second study, estimated using quarterly data for 1980–2004 for 15 countries, paid special attention to how much impact the treatment of the residual countries has on the estimate of misalignment. Unfortunately this seems to be considerable. In one treatment they consider the 15 major currencies as though they were the whole world, while in the other 15
The regression estimate is z = -.134 (.011) + 0.299 (.006) ln (y*/y*u), where z is the logarithm of the ratio of the market to the ppp exchange rate, standard errors are in parentheses, and the final term is the logarithm of China’s ppp per capita income relative to that of the United States (which turns out to be -2). The lower corridor for two standard deviations of the regression coefficients would turn this equation into: z = -.156 +0.311 ln(y*/y*u). Taking the corresponding exponents yields the text estimates.
10 they add a rest of the world sector. The effective misalignment of the renminbi is calculated to vary between 31 percent and 45 percent depending on which of these treatments is used, while the corresponding implied revaluation against the dollar varies from 30 percent to 59 percent.16 For their entry in the BEER school, Coudert and Couhart (2005) apply a panel data estimation of the Balassa-Samuelson effect in 21 emerging markets over the period 1980(1) to 2002(4). The dependent variable is a real exchange rate index against the dollar. The authors obtain an estimate that China was substantially less misaligned (18 percent undervalued in 2002) than identified in their enhanced PPP test. They discuss why there is no Balassa-Samuelson effect noticeably at work in China over the period 1998(1) to 2004(4) for which they have data, but do not note the obvious candidate: that China’s exchange rate policy thwarted adjustment. Funke and Rahn (2005) start off by noting, like others, that the renminbi appears highly undervalued on a PPP comparison and that a substantial undervaluation remains after introducing adjustment for the Balassa-Samuelson effect. However, they quickly move on to the calculation of a BEER and then a PEER (a permanent equilibrium exchange rate, which is a BEER with the independent variables set at their permanent values). They estimated their model on quarterly data for China alone, from 1985(1) to 2002(4), and when they discovered that their data told them there had been a break in the series estimated their final model only over 1994(1) to 2002(4). They find that the renminbi was undervalued by only 3–6 percent in 2002 on a real effective basis and by 11–12 percent bilaterally against the dollar. The paper of MacDonald and Dias (2007) was presented to the February 2007 workshop at the Peterson Institute on what would be necessary to reduce the global imbalances.17 The paper aimed to estimate a BEER model and use it to predict what exchange rate changes would be consistent with the three different patterns of global current account outcomes. In addition to the standard productivity variable (but omitting the usual net foreign assets), MacDonald and Dias also included the trade balance (though its coefficient was small), the terms of trade, and the real interest rate; the latter variable was insignificant, which is not surprising since real interest rates are now more a world rather than a national variable. They calculate changes in the effective exchange rate rather than the dollar rate, and again get a wide range, from 8 percent to 30 percent undervaluation. Since the target current account outcomes were suggested by the conference organizers, the authors should not be held accountable for the wide range of estimates.18 16
The authors use a higher index for more units of domestic currency per unit of foreign currency, so these estimates they cite for “undervaluation” are equivalent to percent revaluation implied. 17 Workshop on Policy to Reduce Global Imbalances, organized by the Peterson Institute, Bruegel, and the Korea Institute for International Economic Policy. Washington, February 8-9, 2007. Papers from the workshop are available at: www.PetersonInstitute.org (events). 18 In a subsequent letter to The Economist (July 14, 2007) the senior author gave a BEER estimate of renminbi undervaluation of 30 percent.
11 The paper of Stolper and Fuentes (2007), of Goldman Sachs, was also presented to that workshop. They made the point that the implicit implication of the finding of no dollar overvaluation in the Goldman-Sachs DEER model is that the US deficit would asymptotically approach a sustainable level at the current exchange rate of the dollar. Hence any renminbi adjustment would permit a depreciation of other currencies, like the euro, against the dollar. The recent introduction of the terms of trade into their model did, however, point to a modest renminbi undervaluation, of about 7 percent against the dollar. Wang (2004) includes a section on determinants of the medium-run path of the real exchange rate in her chapter in an IMF study of the Chinese economy. She estimated an ERER model for China alone using annual data over the period 1980–2003. Her variables included productivity changes, net foreign assets, and openness. She found that the estimated equilibrium exchange rate was only about 5 percent more than the actual exchange rate in 2003, and concluded that any undervaluation was small. The salient difference within the BEER group results is between those studies that use international panel data and those that use only Chinese data. The former tend to find much larger estimates of the degree of undervaluation whereas the latter find only small estimates. In the China-only studies, Wang’s finding implies that undervaluation was only about 5 percent greater in 2003 than on average during the estimation period (1980– 2003). Even that is surprising, since everyone agrees that the renminbi was severely overvalued in the early 1980s. Similarly the asserted finding by Funke and Rahn that undervaluation was modest in 2003 should really be read as a finding that it was only modestly larger than over the period 1994–2003 as a whole. What one concludes from BEER models therefore depends critically on whether one uses them to evaluate the path of the real exchange rate over time based on movements that would have been expected from international experience of response to changes in productivity, net foreign assets, and other explanatory variables, or whether one relies exclusively on Chinese experience. FEER Estimates. The first FEER study listed is that by Jonathan Anderson for UBS. This estimates that the Chinese current account balance was artificially boosted in 2006 by factors such as the excess heavy industrial capacity, and that the cyclically-adjusted current account surplus was 5 percent of GDP. The underlying FDI inflow is estimated as 1 percent of GDP, giving a target adjustment of 6 percent of GDP. Applying a model with export elasticities of 0.5 and an import elasticity of 0.8, he estimated that this adjustment would require a revaluation of 18 percent to 25 percent (undervaluation of 15 percent to 20 percent). This is subsequently interpreted as appreciation against the dollar in the same range, implying that Anderson does not anticipate that other countries would appreciate against the dollar in response to an appreciation of the renminbi. The assumption of cyclical causes of the surplus is crucial because in 2006 the actual current account surplus was 9 percent of GDP, so the target adjustment would
12 widen to about 10 percent of GDP if one did not believe there is a cyclical component that will naturally unwind without currency appreciation. In view of the still larger prospective surplus in 2007, on the order of 12 percent of GDP, it seems difficult to give much weight to the notion that a large portion of the surplus will naturally reverse as the cycle runs its course.19 The next two studies in the FEER school are by one of the authors of the present paper (Cline 2005, 2007). The first of these was a study of the optimal way of achieving a target adjustment of the US current account (to reduce it to 3 percent of US GDP by 2010). It assumed that as part of a multilateral adjustment process, current account surpluses of China and other countries would decline by 40 percent (from 4.2 percent of GDP in 2004 to 2.5 percent, for China). His second study accepted the IMF projection that the Chinese current account is on track for a surplus of 6.3 percent of GDP in 2011 on present trends. He interpreted the three objectives he was given by the conference organizers as being to seek what would be necessary to reduce the current account (a) to a surplus of 1.7 percent of GDP; (b) to create a balanced current account; and (c) to create a deficit of 1.4 percent of GDP. Cline calculated that this would imply an effective appreciation of the renminbi of 21 percent and a bilateral appreciation of 45 percent. Note that Cline is like Agnès Bénassy-Quéré et al. in estimating simultaneously a set of exchange rates for all the major economies. Coudert and Couharde (2005) complete their study with a FEER-type estimate of undervaluation. They do not state explicitly what outcome they are expecting on present trends, but their calculations are intended to illuminate the revaluation of the renminbi that would be needed (a) to induce a current account deficit of 2.8 percent of GDP and (b) to induce a current account deficit of 1.5 percent of GDP. They obtain corresponding estimates of 23 percent or 30 percent for undervaluation of the effective exchange rate and 44 percent or 54 percent for the dollar rate. Goldstein (2004) uses the underlying balance approach to estimate a FEER for the renminbi. He takes a net capital inflow of 1.5 percent of GDP as normal, and therefore assumes that China should target a current account deficit of that size. His estimate is that China had a normal current account surplus of 2.5 percent of GDP, implying the need for an adjustment of 4 percent of GDP. He stated that a “small, barebones, elasticity-based trade model” (that was nonetheless sufficiently sophisticated to recognize that the answer needs to reflect China’s important role in processing intermediate goods for assembly) implied a need for a renminbi appreciation in the upper half of a 15 percent to 30 percent range (p. 201). He appears to have been thinking of an effective appreciation that size, though this is not explicit. He also presents an analysis based on the need for global payments adjustment, in which he argues rather informally that the Chinese adjustment just advocated would be consistent with the needs of the global economy. Goldstein and Lardy (2006) adopt a similar approach, though with a little more history behind them they argue that the underlying Chinese current account surplus in 2005 was in the range of 5 percent to 7 percent of GDP (against their predicted 2005 19
Goldstein and Lardy (2007) estimate the 2007 outcome at 12 percent of GDP or more.
13 actual outcome of 7 percent to 9 percent, which reflected somewhat slower domestic growth and some real appreciation in 2005). The barebones elasticity model now gave them answers in the upper part of a 20 percent to 40 percent range. Although this may seem to be a rather modest response to an increase of at least 2.5 percent of GDP in the need for adjustment, the final figure is consistent with the elasticities and current account response suggested in the first section of this paper.20 A footnote gives the range of 20 percent to 35 percent effective undervaluation taking a broad view across several methodologies: this is stated in the table as their estimate. However, the new paper is quite unambiguously speaking of an undervaluation of the effective rate. Goldstein and Lardy (2007) raise their estimate of needed appreciation to eliminate undervaluation to a range of 35 to 60 percent. Once again their framework is the elasticity approach. They place the range for the parameter relating real exchange rate change to current account change at 2 to 3.5 percent of GDP adjustment for a 10 percent real exchange rate change. Their range results from applying this parameter range to a 12 percent current account surplus for 2007, and by implication assumes that no part of this surplus is cyclical and likely to decline without exchange rate change. Jeong and Mazier (2003) also aim to calculate FEERs, in a model which comprises China, Japan, Korea, the United States, Euroland, and the rest of the world. They estimate the influence of various variables (FDI, demographics, income, etc.) on the current account balance for industrial and countries and emerging markets separately, and then estimate from those variables the equilibrium current account of each of their countries. “Internal balance” is estimated by the OECD approach (or, in the case of China, by a Hodrick-Prescott filter).21 Like Coudert and Couharde, Jeong and Mazier did not state explicitly a figure for the underlying current account surplus, but calculated what would be necessary to induce a deficit of 1 percent to 1.5 percent of GDP. The exchange rate that would reconcile internal and external balance is compared graphically with actual exchange rates. The graphs (p. 1177) indicate that by the final year in the estimates, 2000, the actual real effective exchange rate was 22 percent below the equilibrium level (indicating 29 percent needed appreciation) and the bilateral rate against the dollar was correspondingly undervalued by 40 percent (67 percent needed appreciation). In addition to their BEER model, Stolper and Fuentes (2007) estimated a supplementary elasticities (i.e. FEER) model designed to address some of the questions addressed to them by the conference organizers. Their results suggested the need for a dollar decline of about 15 percent, in which China would be expected to play a proportionate part. Exploring the macroeconomic balance approach to supplement her BEER approach, Wang (2004) estimated the underlying Chinese current account balance as 2.1 20
The Goldstein-Lardy implicit parameter of 0.25 percent of GDP reduction in current account surplus for a 1 percent rise in the real exchange rate is virtually the same as suggested in note 13 above. 21 The first measures capacity by connecting cyclical peaks in output over time; the second generates a smooth non-linear representation of the time series.
14 percent of GDP, and contrasted this with (a) a target surplus of 3.1 percent of GDP that she estimated would be appropriate based on savings and investment, and (b) a 1.0 percent of GDP surplus that would stabilize NFA/GDP at its 2001 level. These targets would have required a small depreciation or a small appreciation of the effective rate of the renminbi respectively. (These conclusions are interpreted as changes of 0 to 5 percent in Table 1.) The last study reported in Table 1 is that of Simon Wren-Lewis (2004). He used a global model that calculates the bilateral exchange rates that would produce target current account outcomes in equilibrium, and undertook a special extension to estimate values of the renminbi consistent with various current balance adjustments. This is a FEER-like approach. He estimated that China had an underlying current account surplus equal to 3.4 percent of GDP in 2002. To reduce this to a 1 percent surplus would have needed a bilateral appreciation against the dollar of 19 percent, while eliminating the surplus entirely would have needed an appreciation of 22 percent. It should be emphasized that most of these estimates were calculated in the period 2000–2005, when China’s current account surplus averaged 3.2 percent of GDP. With a surplus almost four times this large in 2007, the magnitude of undervaluation appears larger today. It should also be stressed that the studies that attribute a large part of China’s surplus to temporary cyclical factors raise special questions. It seems increasingly implausible that China’s “underlying” current account surplus after removing cyclical factors is only 2.1 percent of GDP (Wang) or 5 percent (Anderson; Goldstein and Lardy low alternative), and thus that the great bulk of today’s much larger surplus can be expected to disappear naturally without exchange rate appreciation as the business cycle runs its course. Among the FEER estimates, assumptions about how large a change in the current account of the balance of payments should be targeted are in practice probably the major source of discrepant estimates. It also turns out that a key source of divergence is in identifying whether the present level of the current account is representative of the longer-term trend or needs to be adjusted because of cyclical factors. After that come different assumptions about the price elasticities of demand, including under that heading assumptions about the import content of exports. Most of the FEER estimates suggest a widespread judgment that an appropriate target for China is a current account outcome that is not enormously different from a balanced current account. The biggest surplus is one of Wang’s targets, rationalized by China’s high savings propensity. The next biggest is one of Cline’s targets, which resulted from a desire to treat all surplus countries equally rather than a belief that it is China’s national interest to export real resources.22
22
His biggest deficit target is one that was suggested by Williamson and a coauthor, in a period when it was widely held that developing countries ought to be importing real resources and there was little concern about having a competitive exchange rate.
15 Wang’s view implicitly assumes that world welfare is maximized by allowing countries that wish to save in excess of the level of investment that is efficient at the world interest rate to do so, and export the resulting savings in the form of a current account surplus. The counter-argument is that this assumes (a) that a national government’s decision should be accepted uncritically as the judge of what is in the social interest of its citizens and (b) that there is no problem of world consistency of current account objectives that needs to be dealt with. On (a), it is relevant to note that there are still about a hundred million desperately poor people in China, who save a lot partly because much of the saving is corporate and is not their decision at all, and partly because they are afraid of the future because of the lack of a safety net. Their interests deserve to be taken into account by the international community even if they are ignored by the Chinese government. If one holds this view, then a current account close to balance seems a more natural target than a large surplus. Chinese policy should be aiming to reduce the savings rate (as indeed it is, at least in theory). We do not attempt to deal with problem (b) here. Another obvious source of difference in FEER estimates is differing assumptions about the trade elasticities.23 Anderson uses an export elasticity of 0.5 (which he asserts is probably too high) and an import elasticity of 0.8. Cline assumes that all price elasticities, both of exports and imports, are of unity. Couhert and Couharde take their elasticities from the NiGEM model, in which all elasticities satisfy the Marshall-Lerner condition (though in the case of the United States they only just satisfy it) and vary from 0.50 to 1.19 for the export price elasticity and from 0.41 to 0.95 for the import price elasticity. Neither Goldstein nor Goldstein and Lardy state their assumed elasticities, but they state that they are conventional. Jeong and Mazier also take their elasticities from other models, with specifications similar to their own, and compare the estimated elasticities from different models. Wren-Lewis uses export price elasticities of 2 and import price elasticities of 0.5.
Conclusion Figure 3 summarizes the estimates of Table 1 grouped by each of the three approaches used, showing separately the multilateral and bilateral estimates.24 For studies showing a range, the midpoint is indicated in the figure. The studies are ordered by descending magnitudes of estimated misalignment within each approach. It is evident that the largest undervaluations are found in the enhanced-PPP estimates. 25 The simple average for the four enhanced PPP studies is a needed real appreciation against the dollar of 67 percent 23
One study not included here that investigated the impact of variations in the trade elasticities is that of Dunaway, Leigh, and Li. Their estimates of the impact of increased export and import elasticities from 1 to 1.5 are interdependent with those of the current account adjustment to be accomplished: if this is only 1 percent of GDP, lower elasticities would increase undervaluation by about 4 percent, whereas with a gap of 3 percent of GDP the impact on undervaluation would be about 13 percent. The difference is substantial. 24 25
None of the enhanced PPP estimates include multilateral realignment, so all are treated as bilateral. The Big Mac simple PPP is excluded as conceptually flawed.
16 for the renminbi, whereas the simple averages for the bilateral real appreciations given by the BEER and FEER approaches are smaller, at 25 and 36 percent respectively. The simple averages for the multilateral real revaluations in the BEER and FEER approaches are more moderate still, at 18 percent and 21 percent respectively. It is evident in the figure that there is considerably more agreement among the PPP-E estimates than among the BEER estimates. The FEER estimates also show more agreement than the BEER estimates if the two outliers proposed by Wang (2004) are excluded.
Figure 3 Percent Real Renminbi Appreciation Needed to Eliminate Undervaluation A. Enhanced PPP (bilateral against dollar) 120 100 80 60 40 20 0
B. BEER and FEER (1) Real Effective 50
(2) Bilateral against Dollar 80 70
40
60 30
50 20
40 30
10
20 0
10 0
-10 BEER
FEER
BEER
FEER
17 It seems likely that the enhanced PPP estimates overstate the needed degree of appreciation. Although the approach relies on a robust empirical generalization about the ratio of the PPP exchange rate to the market rate, it does not give an estimate of what one is conceptually seeking to measure. Moreover, the enhanced-PPP seems to show chronic undervaluation for China going back a quarter century, whereas policy concerns about undervaluation have escalated only in recent years. In addition, there is the exaggeration that may have been introduced by erroneous estimation of China’s price level. Among the BEER approaches, the two based purely on Chinese data (Funke and Rahn, 2005, and Wang, 2004) suggest a much smaller undervaluation, but government intervention to prevent appreciation may have made them misleading BEER approaches that make use of cross-sectional panel data do indeed show a much larger degree of undervaluation, similar to that suggested by the FEER approach. The average in figure 3 excluding the China-only estimates is 23 percent needed appreciation in the real effective multilateral rate and 32 percent bilaterally against the dollar. Thus the renminbi seems to be substantially undervalued by normal international standards in the BEER approach. Attempts to measure a FEER assume that one is seeking a normative measure of undervaluation. FEERs depend primarily upon the target current account that is fed into them as an objective. The view that China should aim for a large current account surplus because it is a high-saving country was acknowledged, but it was argued that a normative exercise should not automatically accept the government-stated social objective but should ask whether such phenomena as China’s high savings rate are calculated to maximize social welfare. When this is done, an objective in the vicinity of zero, similar to that taken by most of the FEER exercises, seems reasonable. Among the FEER estimates, we consider the Wang (2004) calculations seriously understated because they assume that China’s cyclically adjusted current account surplus is running at only 2 percent of GDP rather than the actual 9 percent last year and 12 percent this year. Excluding these two estimates, the average for the FEER estimates in figure 3 is a needed appreciation of 27 percent in the real effective exchange rate (close to the international BEER estimates) and 36 percent in the bilateral exchange rate. Because of its underlying fragility and likely bias in Chinese price comparison estimates, we consider the estimates in the enhanced-PPP school to be unreliable. In contrast, the BEER estimates using cross-country data and the FEER estimates using plausible cyclical components of the current account surplus arrive at the same range for undervaluation of the renminbi, with about 25 percent real effective appreciation needed to remove undervaluation in both of these sets of estimates. Methodologically our preference is for the FEERs approach, because the necessary assumption of average equilibrium over the estimation period makes even the internationally-based BEER approach less reliable. Within the FEER school of estimates, the main need would seem to be to work toward agreement on, first, how much of China’s current account surplus is underlying and how much is cyclical, and second, what magnitude of surplus if any makes sense over the medium term. On the latter issue, it seems highly likely that most analysts as well as the Chinese authorities themselves would agree that the medium-term current account surplus should not be any where near
18 double digits as a percent of GDP, so the needed correction is several percentage points of GDP. Finally, it should be reiterated that most of the studies surveyed here were conducted using the lower earlier levels of the current account, so the needed real effective appreciation could be larger than the 25 percent or so real effective range suggested by the international-BEER and most of the FEER studies if there have been structural changes toward a current account surplus. For example, using the parameter suggested both here and in Goldstein and Lardy (2007), that a 10 percent real exchange rate change with supporting expansion of internal demand leads to a change of about 2.5 percent of GDP in the current account, complete elimination of the 2007 surplus could require as much as a 48 percent real effective appreciation. However, it seems likely that a significant part of the surplus is cyclical. In particular, application of this same parameter to the effective real depreciation of the renminbi in recent years cannot explain the full surge in the surplus. The IMF and BIS place the real effective depreciation of the currency from 2002 to 2006 at 8 percent, deflating by consumer prices. The decline reflected the renminbi riding the dollar down. If one adopts the Goldstein-Lardy argument of additional productivity influences and places the relative price change for China’s exports at zero (rather than the cumulative CPI inflation of 8 percent) over these four years, the real effective depreciation would have been about 16 percent. But application of the parameter just discussed would then have implied a rise of the surplus by 4 percent of GDP, not by 9 percent of GDP (the increase from 2003 to 2007). Anderson (2006) suggests that excess capacity in heavy industry following unusually large investment spurred atypical exports in 2005 and after, indicating one possible source of cyclical exaggeration of the surplus this year. As a consequence, whereas some of the studies surveyed in this study using data before 2004 may have understated the extent of exchange rate correction needed by 2007, application of a FEERs approach to the full magnitude of the 2007 surplus rather than some cyclically adjusted estimate would seem likely to overstate the correction needed.
19 References
Anderson, Jonathan. 2006. The Complete RMB Handbook (fourth edition). (Hong Kong: UBS.) Bénassy-Quéré, Agnès, Pascale Duran-Vigneron, Amina Lahrèche-Révil, and Valérie Mignon. 2004. Burden Sharing and Exchange Rate Misalignments Within the Group of Twenty. In C.F Bergsten and J. Williamson, eds., Dollar Adjustment: How Far? Against What? (Washington: Institute for International Economics). Bénassy-Quéré, Agnès, Amina Lahrèche-Révil, and Valérie Mignon. 2006. World Consistent Equilibrium Exchange Rates. (Paris: CEPII working paper no. 2006-20.) Bhalla, Surjit S. 2007. There Are No Growth Miracles. Paper presented to a seminar at the IMF. Bosworth, Barry. 2004. Valuing the Renminbi. Paper presented to the Tokyo Club Research Meeting, Feb. Cheung, Yin-wong, Menzie D. Chinn, and Eiji Fujii. 2007. The Overvaluation of Renminbi Undervaluation. NBER Working Paper no. 12850. Clark, Peter, and Ronald MacDonald, 1998. Exchange Rates and Economic Fundamentals: A Methodological Comparison of BEERs and FEERs. IMF Working Paper 98/67. Cline, William R. 2005. The United States as a Debtor Nation. (Washington: Institute for International Economics and Center for Global Development.) ---- 2007. Estimating Reference Exchange Rates. Paper presented to a workshop at the Peterson Institute sponsored by Bruegel, KIEP, and the Peterson Institute, Feb. Cooper, Richard, 2005. Whither China? Japan Center for Economic Research Bulletin, September. Coudert, Virginie, and Cécile Couharde. 2005. Real Equilibrium Exchange Rates in China. CEPII Working Paper no. 2005-01. Dooley, Michael, David Folkerts-Landau, and Peter Garber. 2003. An Essay on the Revived Bretton Woods System. NBER Working Paper no. 9971. Dunaway, Steven, Lamin Leigh, and Xiangming Li. 2006. How Robust are Estimates of Equilibrium Real Exchange Rates: The Case of China. IMF Working Paper no. 06/220.
20 Dunaway, Steven, and Xiangming Li. 2005. Estimating China’s “Equilibrium” Real Exchange Rate. . IMF Working Paper no. 05/202. Frankel, Jeffrey. 2006. On the Yuan: The Choice between Adjustment under a Fixed Exchange Rate and Adjustment under a Flexible Rate. CESifo Economic Studies. Funke, Michael, and Jőrg Rahn. 2005. Just How Undervalued is the Chinese Renminbi? The World Economy, 28(4), April. Goldstein, Morris. 2004. Adjusting China’s Exchange Rate Policies. Paper presented to the IMF seminar on China’s Foreign Exchange System at Dalian, China, May. Goldstein, Morris, and Nicholas Lardy. 2006. China’s Exchange Rate Policy Dilemma. American Economic Review, 96(2), May, pp. 422-26. Goldstein, Morris, and Nicholas Lardy, 2007. China’s Exchange Rate Policy: An Overview of Some Key Issues. Paper prepared for the conference on China’s Exchange Rate Policy, Peterson Institute for International Economics, Washington, October 19. IMF. 2006. Methodology for CGER Exchange Rate Assessments. (Washington: International Monetary Fund). Heston, Alan, 2001. Treatment of China in PWT6. Philadelphia: University of Pennsylvania, processed. Available at: http://pwt.econ.upenn.edu/Documentation/China.PDF Jeong, Se-Eun, and Jacques Mazier. 2003. Exchange Rate Regimes and Equilibrium Exchange Rates in East Asia. Revue économique, 54(5), Sep., pp. 1161-82. Lardy, Nicholas R., 1994. China in the World Economy (Washington: Institute for International Economics). MacDonald, Ronald, and Preethike Dias. 2007. BEER Estimates and Target Current Account Imbalances. Paper presented to a workshop at the Peterson Institute sponsored by Bruegel, KIEP, and the Peterson Institute, Feb. Meade, James E. 1951. The Balance of Payments. Oxford: Oxford University Press. Nurkse, Ragnar. 1945. Conditions of International Monetary Equilibrium. Princeton Essays in International Finance no.4. (Princeton: International Finance Section.) Rodrik, Dani. 2007. The Real Exchange Rate and Economic Growth: Theory and Evidence. Harvard University: processed.
21 Stein, Jerome. 1994. The Natural Real Exchange Rate of the US Dollar and Determinants of Capital Flows. In J. Williamson, ed., Estimating Equilibrium Exchange Rates. (Washington: Institute for International Economics). Stolper, Thomas, and Monica Fuentes. 2007. GSDEER and Trade Elasticities. Paper presented to a workshop at the Peterson Institute sponsored by Bruegel, KIEP, and the Peterson Institute, February. Wang, Tao. 2004. Exchange Rate Dynamics. In E. Prasad, ed., China’s Growth and Integration into the World Economy: Prospects and Challenges, IMF Occasional Paper no.232 (Washington: International Monetary Fund). Williamson, John. 1983. The Exchange Rate System. 1st edition, 2nd edition 1985. (Washington: Institute for International Economics). Williamson, John, and Molly Mahar. 1998. Current Account Targets. In S. Wren-Lewis and R. Driver, Real Exchange Rates for the Year 2000 (Washington: Institute for International Economics). World Bank, 2007. World Development Indicators (Washington: World Bank). Wren-Lewis, Simon. 2004. The Needed Changes in Bilateral Exchange Rates. In C.F. Bergsten and J. Williamson, eds., Dollar Adjustment: How Far? Against What? (Washington: Institute for International Economics).