Elasticity of Supply
107
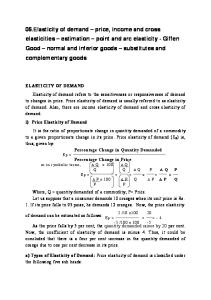
Perfectly Elastic and Perfectly Inelastic Supply. As in the case of demand. perfectly elastic supply: there can be perfectly elastic supply or perfectly inelastic supply, as shown in supply for which the price Figure 9. The vertical supply curve is perfectly inelastic; it has zero elasticity. Such elasticity is infinite, indicating supply curves are not unusual. For example, there is only one Mona Lisa. A higher an infinite response of quantity price cannot bring about a higher quantity supplied, not even one more Mona Lisa. supplied to a change in price and But the supply curve for most goods is not vertical. Higher prices will encourage therefore a horizontal supply coffee producers to use more fertilizer, hire more workers, and eventually plant more curve. coffee trees. Thus the quantity supplied increases when the price rises. perfectly inelastic supply: The horizontal supply curve is perfectly elastic. In this case, the price does supply for which the price not change at all. It is the same regardless of the quantity supplied. It is easier elasticity is zero, indicating no to understand the horizontal supply curve if you view it as an approximation to a response of quantity supplied to a supply curve that is nearly horizontal, one with a very high elasticity. Then only change in price and therefore a a small increase in price brings forth a huge increase in the quantity supplied vertical supply curve. by firms. Why the Size of the Price Elasticity of Supply Is Important. Now let us look at the importance of knowing the size of the supply elasticity even if it is not at one of these two extremes. Figure 10 shows two different supply curves for coffee. The horizontal axis shows the quantity of coffee supplied around the world in billions of pounds; the vertical axis shows the price in dollars per pound of coffee. For the supply curve in the top graph, the quantity supplied is very sensitive to the price; the price elasticity of supply is high. For the supply curve in the bottom graph, the price elasticity of supply is much lower.
PRICE
Perfectly inelastic supply
\ Perfectly elastic supply QUANTITY SUPPLIED
FIGURE 9 Perfectly Elastic and Perfectly Inelastic Supply When the quantity supplied is completely unresponsive to the price. the supply curve is vertical and the price elasticity of supply is zero; this case is called perfectly inelastic supply. When the quantity supplied responds by large amounts to a price change, the supply curve is horizontal; economists then say that supply is perfectly elastic. Số hóa bởi Trung tâm Học liệu – ĐH TN
http://www.lrc-tnu.edu.vn
1 08
CHAPTER 4 Subtleties of the Supply and Demand Model: Price Floors, Price Ceilings, and Elasticitv
COFFEE PRICE (DOLLARS PER POI ND)
Quantity supplied is very sensitive to the price.
Supply curve w ith a high price elast icily of supply
1411 COFFEE PRICE (DOLLARS PER POUND)
QUANTITY SUPPLIED (BILLIONS OF POUNDS OF COFFEE)
Supph cune with a low price elasticity of supply Quantity supplied is not very sensitive to the price.
140 Ql.O ' TITV SUPPLIED (BILLIONS OF POUNDS OF COFFEE FIGURE 10 Comparing Different Sizes of the Price Elasticities of Supply In the top graph, the quantity supplied is much more sensitive to price than in the bottom graph The price elasticity of supply is greater between points A and B at the top than between points A and Cat the bottom. The price elasticity of supply is important for finding the response of price to shifts in demand. This is shown in Figure 11. where the demand for coffee declines. perhaps because of concerns about the effect of the caffeine in coffee or because of a decrease in the price of caffeine-free substitutes for coffee. In any case, if the price elasticity of supply is high, as in the top graph, the price does not change as much as when the price elasticity of supply is low. as in the bottom graph. With a high price elasticity, a small change in price is enough to getfirmsto bring the quantitv supplied dow n to the lower quantity demanded. Số hóa bởi Trung tâm Học liệu – ĐH TN
http://www.lrc-tnu.edu.vn
Elasticity of Supply
109
COFFEE PRICE (DOLLARS PER POUND)
Supply curve with high elasticity
3.00 2.00 1.00
..leads tn a smal change in price.
COFFEE PRICE D ( OLLARS PER POUND)
Old demand New demand 10I 0 12I 0
140
QUANTITY (BILLIONS OF POUNDS OF COFFEE)
Supply cune with low elasticity
:l.(lll 2.011 FIGURE 11 Importance of Knowing the Size of the Price Elasticity of Supply When demand changes, the price will also change. If the price elasticity of supply is high, there will be a small change in price. II the price elasticity of supply is low, there will be a large change in price.
1.00 so
Old demand New demand 1I00 12 I0
140 QUANTITY
(BILLIONS OF POI NDS OF COFFEE)
R E V I E W
-The price elasticity of supply is a number that tells us how sensitive the quantity supplied is to the price. It is defined as the percentage change in the quantity supplied divided by the percentage change in the price. • The attractive features of the price elasticity of demand are also true for the price elasticity of supply. Its size does not depend on the units of measurement of either price or quantity. • The price elasticity of supply is useful for determining how much prices will change when there is a change in demand.
Số hóa bởi Trung tâm Học liệu – ĐH TN
http://www.lrc-tnu.edu.vn
110
CHAPTER 4 Subtleties of the Supply and Demand Model: Price Floors, Price Ceilings, and Elasticity
CONCLUSION In this chapter, we have extended our analysis of the supply and demand model in two directions. We first learned about what happens when the government intervenes to put a price ceiling or a price floor into the economy. Understanding howto use the supply and demand model with price floors and ceilings enables us to better understand policy debates such as the one surrounding the increase in the minimum wage. The second extension was to develop an understanding of how much the equilibrium price and quantity change in response to changes in supply or demand. The concept of price elasticity of demand helps us understand what happens to the quantitv demanded when there is a change in price or when there is a change in the supph of a good. We can also predict whether revenue will increase or decrease when prices are cut or raised. The related concept of the elasticity of supply is also useful in understanding what happens to the quantity supplied when there is a change in price or when there is a change in the demand for a good. We also discussed the concept of an income elasticity of demand, which can help clarify how the quantity demanded for various goods w ill change as incomes rise, and the cross-price elasticity of demand, which tells us how much the quantity demanded of a good changes as prices for substitute or complementary goods change. KEY POINTS 1. Governments will occasionally intervene in markets sophisticated analysis of minimum-wage law s, for because they think that the equilibrium price is too example, than we have done so far in this chapter. high or too low. When they act to impose a maximum 4. Elasticity is a measure of the sensitivity of one price on a market, because they think the price that economic variable to another. For example, the price buyers have to pay is too high, they are said to be elasticity of demand measures how much the imposing a price ceiling. When they act to impose a quantity demanded changes w hen the price minimum price on a market, because they think the changes. price that sellers are receiving is too low, they are said 5. Elasticity is a unit-free measure. The price elasticity to be imposing a price floor. of demand is the percentage change in the quantitv 2. Price ceilings cause shortages, with the quantitvdemanded divided by the percentage change in supplied being less than the quantity demanded. price. It refers to changes in price and quantitv Shortages lead to rationing or black markets. Price demanded along the demand curve, all other things floors cause surpluses, with the quantity supplied being equal. being greater than the quantity demanded. Surpluses 6. Demand is said to be elastic if the price elasticity of lead to resources being diverted away from other demand is gteater than 1 and inelastic if the price productive activities to deal with the extra output elasticity of demand is less than 1. that needs to be stored or disposed of. 7. When the elasticity is greater than 1. an increase in 3. Rent controls are a classic application of a pricethe price reduces the quantity demanded by a ceiling, and minimum wages are a classic application percentage greater than the percentage increase in of a price floor. The supph' model helps us the price, thereby reducing revenue. When the understand some basic issues related to these elasticity is less than 1. an increase in the price policies, which frequently appear in the news today. reduces the quantity demanded by a percentage less We will go on to develop the supply and demand than the percentage increase in the price, thereby model further, which will allow us to do a more increasing revenue. Số hóa bởi Trung tâm Học liệu – ĐH TN
http://www.lrc-tnu.edu.vn
Problems
111
and have a positive income elasticity of demand. 8. The elasticity of demand for a good depends on Inferior goods have a negative income elasticity whether the good has close substitutes, whether its of demand. value is a large or a small fraction of total income, 10. The price elasticity of supply is defined as the and the time period of the change. percentage change in the quantity supplied divided 9. Whereas the price elasticity of demand refers to by the percentage change in the price. If a good has a movements along the demand curve, the income high price elasticity of supply, then a change in price elasticity of demand refers to shifts in the will cause a big change in the quantity supplied. demand curve caused by changes in income, Conversely, if a good has a low price elasticity of and the cross-price elasticity of demand refers to supply, then a change in price will have only a small shifts in the demand curve caused by changes in impact on the quantity supplied. the price of other goods. Most goods are normal KEY TERMS price control price ceiling price floor rent control minimum wage
price elasticity of demand perfectly elastic demand unit-free measure income elasticity of elastic demand demand inelastic demand cross-price elasticity of perfectly inelastic demand demand
price elasticity of supply perfectly elastic supply perfectly inelastic supply
QUESTIONS FOR REVIEW 1. Why is the price elasticity of demand a unit-free 6. Why is the price elasticity of demand lower in the measure of the sensitivity of the quantity demanded short run than in the long run? to a price change? 7. For what values of the price elasticity of demand do 2. What factors determine whether the price elasticity increases in the price increase revenue? of demand is high or low? 8. What is the income elasticity of demand? 3. What is the difference between elastic and inelastic 9. What is the difference between the price elasticity demand? of demand and the income elasticity of demand? 4. Why is the price elasticity of demand useful fur 10. What is the slope of a perfectly elastic supply curve? finding the size of the price change that occurs when supply shifts? 5. If the price elasticity of demand for textbooks is 2 and the price of textbooks increases by 10 percent, by how much does the quantity demanded fall? PROBLEMS 1. Consider the market for automatic teller machinehappens to quantity supplied and quantitv services in a city. The price is the fee for a cash demanded? withdrawal. d. Economists frequently argue against price a. Sketch the demand curve and the supply curve for controls because of the shortages and associated ATM transactions. problems that they create. What are some of the b. I low is the equilibrium price determined? potentially negative side effects of interference in c. If the town council imposes a ban on ATM fees— the ATM market? equivalent to a price ceiling in this market—what
Số hóa bởi Trung tâm Học liệu – ĐH TN
http://www.lrc-tnu.edu.vn
112
CHAPTER 4 Subtleties of the Supply and Demand Model: Price Floors, Price Ceilings, and Elasticity
6. Consider the follow ing data for a supply curve: 2. In 1991 the price of milk fell 30 percent. Senator Leahy of Vermont, a big milk-producing state, Price Quantity Supplied supported a law in the U.S. Congress to put a floor on 2 10 the price. The floor was SI3.09 per hundred pounds 3 20 of milk. The market price was $11.47. 4 30 a. Draw a supply and demand diagram for milk 5 40 6 50 and show how the equilibrium price and quantity 7 1,0 would he determined in the absence of the 8 70 9 80 price floor. b. Using the diagram you just drew, explain the a. Use the midpoint formula to calculate the effects of the legislation. price elasticity of supply between a price of S7 c. The dairy farmers supported the legislation, while and $8. consumer groups opposed it. Why? b. Use the midpoint formula to calculate the d. Economists frequently argue against price floors price elasticity of supply between a price of S3 because of the surpluses and associated problems and $4. that they create. What are some of the potentially c. How does supply elasticity change as you move up negative side effects of interference in the milk the supply curve? market? d. Why does the supply elasticity change even 3. More than twenty states have laws outlawing price though the slope of the supply curve is unchanged gouging during a state of emergency, w hich might be as you move up the supply curve? declared after a hurricane or an earthquake. These 7. Given the following income elasticities of demand. laws prohibit price increases on basic necessities, would you classify- the following goods as normal or such as gasoline. Which of the arguments against inferior goods? price ceilings might not be very significant during a a. Potatoes: elasticity = 0.5 state of emergency? b. Pinto beans: elasticity = -0.1 4. Donors of organs for transplantation or medical c. Bottled water: elasticity = 1.1 research are prohibited from charging a price for d. Video cameras: elasticity = 1.4 Price Quantity these organs (there is a price ceiling of zero). Will this 11 10 market cope with 8. Calculate the cross-price elasticity for the following result in a shortage? How will the goods. Are they substitutes or complements? 20 the shortage?10 9 30a demand curve: a. The price of movie theater tickets goes up bv 10 5. Consider the following data for 8 111 percent, causing the quantity demanded for video 7 50 6 60 rentals to go up by 4 percent. 5 70 b. The price of computers falls by 20 percent. 4 80 causing the quantity demanded of softw are to 3 90 increase by 15 percent. c. The price of apples falls by 5 percent, causing the a. Use the midpoint formula to calculate the quantity demanded of pears to fall by 5 percent. elasticitv between a price of S10 and SI 1. d. The price of ice cream falls by 6 percent, causing b. Use the midpoint formula to calculate the the quantity demanded of frozen yogurt to fall by elasticity betw een a price of S3 and S4. 1 percent. c. Since this is a linear demand curve, why does the 9. Food items often have low elasticities of demand. elasticity change? Suppose excellent weather leads to bumper yields of d. At what point is price times quantity maximized? agricultural crops. Why might farmers complain What is the elasticity at that point? about market conditions? 10. The board of directors of an airline wishes to increase revenue. One group favors cutting airfares. and the other group favors raising airfares. What are Số hóa bởi Trung tâm Học liệu – ĐH TN http://www.lrc-tnu.edu.vn the assumptions group is making about the price elasticity ofeach demand?
Problems 11. Compare a market in which supply and demand are very (but not perfectly) inelastic to one in which supply and demand are very (but not perfectly) elastic. Suppose the government decides to impose a price floor $1 above the equilibrium price in each of these markets. Compare, diagrammatically, the surpluses that result. In which market is the surplus larger? 12. In 1992, the federal government placed a tax of 10 percent on goods like luxury automobiles and
Số hóa bởi Trung tâm Học liệu – ĐH TN
113
yachts. The yacht-manufacturing industry had huge declines in orders for yachts and laid off many workers, whereas the reaction in the auto industry was much milder. (The tax on yachts was subsequently removed.) Explain this situation using two supply and demand diagrams. Compare the elasticity of demand for luxury autos with that for yachts based on the experience with the luxury tax.
http://www.lrc-tnu.edu.vn
Số hóa bởi Trung tâm Học liệu – ĐH TN
http://www.lrc-tnu.edu.vn
Số hóa bởi Trung tâm Học liệu – ĐH TN
http://www.lrc-tnu.edu.vn
C h a p t e r
5
T h e
D e m a n d
B e h a v i o r
T
o f
C u r v e
a n d
t h e
C o n s u m e r s
his is a true story about a college professor who loves to teach introductory
economics. The professor is younger than most college professors, but is hard of hearing and wears hearing aids in both ears. The professor teaches one of those large lecture courses, and most students aren't even aware that the professor wears the hearing aids. In the middle of one of the lectures, the professor simultaneously brings one hand to one ear and the other hand to the other ear and suddenly pulls out both hearing aids, saying, "I can't hear a thing. If it were not for these hearing aids. I wouldn't be here. I couldn't be a teacher. Do you know how much benefit I get from these hearing aids? Certainly more than from my car and maybe even more than from my house. If I had to give you a dollar amount, I would say that the benefit to me is about $60,000. Without the hearing aids, I would probably earn less, and 1 know my life would not be as enjoyable. Of course, 1 had to buy these hearing aids, and they are not very cheap. They cost me $500. But, you know, they cost me a lot less than they benefit me. The difference between $60,000 and $500 is $59,500. a huge amount. That difference is a measure of what the hearing aid market delivers to me over and above what I had to pay for the hearing aids. Most people would call that a good deal. but because I am an economics professor, I call it a consumer surplus." In this chapter we show how and why the demand curve for any good—whether hearing aids, MP3 players, grapes, or bananas—can be used to measure the "good deal," or the "consumer surplus." that markets deliver to people. Figure 1 shows a typical demand curve, with price on the vertical axis and quantity demanded on the horizontal axis. The demand curve is for an entire market. which might consist of millions of consumers. But consumers do not go to the market with a demand curve; they go w ith certain preferences and objectives. In this
116 Số hóa bởi Trung tâm Học liệu – ĐH TN
http://www.lrc-tnu.edu.vn