Economic Policy and Prospects In Iraq Harvard University Department of Economics Econ 1010b Prof. Chris Foote April 28, 2008
Source: Petraeus Testimony April 8-9, 2008
Source: Petraeus Testimony April 8-9, 2008
Source: IMF Survey (March 2008)
Ir aq: Population % Change - Year to Year
Millions
3. 6
3. 6
3. 2
3. 2
2. 8
2. 8
2. 4
2. 4
2. 0
2. 0
1. 6
1. 6 60
65
70
75
80
85
Sour ce: Inter national Monetar y Fund /Haver Analytics
90
95
00
05
Ir aq: Population % Change - Year to Year
Millions
U. S. : Population % Change - Year to Year
Millions
3. 5
3. 5
3. 0
3. 0
2. 5
2. 5
2. 0
2. 0
1. 5
1. 5
1. 0
1. 0
0. 5
0. 5 55
60
65
70
75
80
85
Sour ce: Inter national Monetar y Fund /Haver Analytics
90
95
00
05
Outline 1. Iraq’s economy before the 2003 war 2. Effects of 2003 War 3. Post-War Monetary Policy 4. CPA Economic Reforms: Influences 5. CPA Economic Reforms: Implementation
Outline 1. Iraq’s economy before the 2003 war 2. Effects of 2003 War 3. Post-War Monetary Policy 4. CPA Economic Reforms: Influences 5. CPA Economic Reforms: Implementation
• Oil reserves: – Proven reserves: ~100B barrels (BB) – Potential may be as high as 200 BB – 16% of Middle East reserves
• Two distinct production areas: – Southern fields – dominated by the Rumaila field • Production capacity of 2.4M BPD (~1.80M BPD today) – Northern fields – dominated by Kirkuk field • Production capacity of 0.9M BPD (~0.5M BPD today)
Turkey Turkey pipeline Mosul
Kirkuk Oilfield
Iran
Syria Tikrit Syria pipeline
Baghdad
Saudi Arabia
Basrah Rumalia Oilfield
Crude Oil Pipeline Crude Oil Field Scale 100 KM
Kuwait Non-operational pipeline
14
Early Historical Dates • 1914-1921: Britain invades Mesopotamia – Creates Iraq out of three Ottoman provinces
• 1921: Britain establishes monarchy – League of Nations mandate to govern Iraq
• 1932: Iraq becomes independent – U.K. retains military presence
• 1958: Military coup led by Abdul Karim Qasim and Abdel Salam Arif – Leaders fall out over potential union with Egypt
Post-Monarchal Regimes • 1958-1963: Abdul Karim Qasim – Land reforms significantly curtail holdings – Expands public sector, attempts to raise living standards
• February 1963-November 1963: Baath-military coup – Arif, military join with Baathist civilians – Brutal backlash against communists ensues, near anarchy
• November 1963-July 1968: Arif brothers – Banks, largest firms nationalized in 1964
• July 1968-April 2003: Baathist era – Saddam assumes full power in 1979
The Baath Party: “Pan-Arab Socialists” • Importance of Arab unity – Other Arabs often enjoy same rights as Iraqis – Rejection of non-Arab foreign influence
• Ambiguous definition of “socialism” – No role for class struggle that conflicts with Arab unity – Property and inheritance are two “natural rights. They are protected within the limits of the national interest.” – “Socialism constitutes … the ideal social order which will allow the Arab people to realize its possibilities and to allow its genius to flourish…”
Labor Market in 1997 Men
Women
4.3 million
0.5 million
66.8%
7.5%
Mining and Quarrying
0.6
0.7
Manufacturing
4.3
6.4
Agriculture
18.3
24.1
Public Administration
20.1
8.6
Education
2.6
37.4
Unemployed
17.9
2.4
Labor Force Size Labor Force Percent of Population Aged 10+ Shares of Labor Force Employed in:
Note: Military employed about 315,000 conscripts and 237,000 officers.
Microeconomics and Markets • Government on both sides of agricultural transactions • Gasoline/LPG subsidies • Government controls entry of new firms • Government forces firms to be in concert with the “national plan”
Why is Iraq underachieving? • Bad foreign policy – Wars, international sanctions
• Bad economic policy – Government control of markets – Corruption – Closed to trade & investment even w/o sanctions
• Bad luck – Falling oil prices in 1980s
Key dates in recent economic history • 1972-1974: Oil industry nationalized • 1973-74: First “oil shock” • 1974-1979: State-owned industries (SOEs) • 1979: Second “oil shock” • 1980-88: War with Iran
Key dates in recent economic history (con’t) • 1990-91 Invasion of Kuwait, first Gulf War • 1990s: Sanctions regime, Iraq as “handout state” – Food Distribution Service begins
• 1996: Oil for Food begins • 2003: Most recent war begins / CPA installed • 2004: Iraqi sovereignty restored
Spot Oil Pr ice: West Texas Inter mediate [Pr ior '82=Posted Pr ice] $/Bar r el 120
120
100
100
80
80
60
60
40
40
20
20
0
0 75 80 85 90 Sour ce: Wall Str eet Jour nal /Haver Analytics
95
00
05
Real Oil Pr ice = (Spot Oil Pr ice / CPI)
50
50
40
40
30
30
20
20
10
10
0
0 70
75
80
85
90
95
00
05
Source: Energy Information Office: U.S. Department of Energy 2004
2003
2002
2001
2000
1999
1998
1997
1996
1995
1994
1993
1992
1991
1990
1989
1988
1987
1986
1985
1984
1983
1982
1981
1980
1979
1978
1977
1976
1975
1974
1973
Thousands of Barrels Per Day
Iraqi Oil Production
4000
3500
3000
2500
2000
1500
1000
500
0
Ir aq: Cr ude Petr oleum Pr oduction 2000=100 150
150
125
125
100
100
75
75
50
50
25
25
0
0 70 75 80 85 90 Sour ce: Inter national Monetar y Fund /Haver Analytics
95
00
05
2001
2000
1999
1998
1997
1996
1995
1994
1993
1992
1991
1990
1989
1988
1987
1986
1985
1984
1983
1982
1981
1980
1979
1978
1977
1976
1975
1974
1973
1972
1971
1970
1969
1968
2002 U.S. Dollars
Figure 1: Per Capita GDP in Iraq (1968-2001)
2500
2000
Total
1500
Oil Sector
1000
Non-Oil Sector
500
0
35 37 31 30 43
1992 1993 1994 1995 1996
2002
2001
2000
1999
1998
1997
19
1991
1990
237
646
596
544
359
941
931
1,282
1,027
1988 1989
1,037
657
1,115
1,049
1,170
1987
1986
1985
1984
889
`
1983
1982
1,380
1500
1981
1980
1979
1978
1977
899
2,652
2,647
2,571
2,354
3000
1976
1975
559
2500
1974
1973
1972
688
0 1971
500 643
1000
1970
2002 U.S. Dollars
3,013
4,163
4,158
4500
Figure 5: Real Value of Oil Export Revenues Per Capita (1970-2002)
4000
3500
2000
Macroeconomic Response to Iran-Iraq War: Foreign Debt • Imports rise 400 percent from 1978 to 1982, mostly for non-military goods • By 1990, debt service payments soak up 55 percent of oil revenues • Saddam Hussein blames Kuwait for driving down prices in 1990 • Debt reached $120 billion, or around 6x GDP
Macroeconomic Response to Sanctions: Printing Money • Traditional last resort of a governments that can’t pay its bills • Inflationary spiral takes off as people “flee” the depreciating currency
Figure 7: Growth Rates for Prices and Money (1989-2002) 600.0 Consumer Price Index M1
492
500.0
400.0 Percent Rate of Growth
351
300.0
208 187
200.0
176
100.0 52
61
84 78
195
97 36
6
-15
23
16
23
16 25 2001
15 14
13 10
5
1998
1999
2000
19
40
0.0 1989
-100.0
1990
1991
1992
1993
1994
1995
1996
1997
2002
Macro Response to 1980s/90s Problems: Lower Investment • Development programs scaled back in 1982 • Gulf War Allies attack infrastructure in 1990 (electricity, telephones) • Early 1990s sanctions prohibit imports of spare parts • Lack of government revenue also reduces investment
Figure 6: Gross Capital Formation (1980-2001) 9000.0
8000.0
7000.0
5000.0
Socialist Sector (Government-Owned)
4000.0
3000.0
2000.0
Private Sector 1000.0
01 20
00
20
99
19
98 19
97
19
96
19
95 19
94
19
93
19
92 19
91
19
90 19
89
19
88
19
87 19
86
19
85
19
84 19
83
19
82
19
81 19
80
0.0
19
Millions of 1988 Iraqi Dinar
6000.0
Outline 1. Iraq’s economy before the 2003 war 2. Effects of 2003 War 3. Post-War Monetary Policy 4. CPA Economic Reforms: Influences 5. CPA Economic Reforms: Implementation
Effects of 2003 War • No good economic statistics for months – Central Statistical Organization looted – Central Bank looted; doors to vault held (fortunately)
• Electricity production declines by 25 percent – Baghdad no longer at the head of the line for power
• Oil production ceases – Exports resume in late June
• Many banks, state-owned enterprises looted
Real GDP Growth in Iraq 80 60 46.5
Percent Per Year
40 20
8.2
6.2
0
6.3
5.3
-0.7 -7.8
-20 -40 -41.4 -60 1998-2002 (Average)
2002
2003
2004
Source: IMF Regional Economic Outlooks (September 2006 and October 2007)
2005
2006
2007 2008 (Estimate) (Projection)
Real GDP Growth in Iraq and Components 80 Overall GDP 60
Non-Oil GDP 46.5
Oil GDP Percent Per Year
40 20
8.2
6.2
6.3
5.3
0 -0.7 -7.8
-20 -40
-41.4 -60 1998-2002 (Average)
2002
2003
2004
Source: IMF Regional Economic Outlook (September 2006 and October 2007)
2005
2006
2007 2008 (Estimate) (Projection)
Figure 3: Fractions of Poll Respondents Reporting Economic Improvement for Iraq as a Whole (1st %) and for Respondent’s Own Family (2nd %)
Sulamaniyah: (in Kurdish region) 98% & 68% Tikrit: 5% & 11%
Mosul: 16% & 23% “Sunni Triangle”
Samarra: 2% & 2%
Ramadi: 15% & 43% Baghdad: 62% & 59%
Diyala: 43% & 40%
Karbala: 50% & 43%
Babylon: 56% & 57%
Basra: 62% & 57% Note: Figures for Karbala, Tikrit, and Samarra from Jan 2004 poll. All other cities from Feb 2004 poll. 33
Outline 1. Iraq’s economy before the 2003 war 2. Effects of 2003 War 3. Post-War Monetary Policy 4. CPA Economic Reforms: Influences 5. CPA Economic Reforms: Implementation
Monetary Situation in Summer 2003 • “Saddam” dinar had been used in areas under the former regime’s control – Only two bills circulate • 250-dinar note • 10,000-dinar note (introduced in Sept 2002)
– Plates and paper for larger bill stolen; counterfeits feared – 10,000-dinar note exchanges at a discount relative to 250
• “Swiss” dinar used in the three autonomous Kurdish areas – Low denominations because no new bills had been printed – Often held together with tape and staples – Begins to strengthen sharply in early 2002
The July 7 2003 Currency Plan • Use the designs on the old Swiss dinar • Use the “denominations” of the Saddam dinar – 1 New Dinar = 1 Saddam dinar – In this way, nominal price level in the largest part of the country doesn’t have to change • Conversion rate: – 1 New dinar = 1/150 Swiss dinar
5/ 1/ 2 5/ 00 3 8/ 5/ 200 15 3 / 5/ 20 0 22 3 / 5/ 20 0 29 3 /2 6/ 0 03 5/ 6/ 200 12 3 / 6/ 20 0 19 3 / 6/ 20 0 26 3 /2 7/ 0 03 3/ 7/ 200 10 3 / 7/ 20 0 17 3 / 7/ 20 0 24 3 / 7/ 20 0 31 3 /2 8/ 0 03 7/ 8/ 200 14 3 / 8/ 20 0 21 3 / 8/ 20 0 28 3 /2 9/ 0 03 4/ 9/ 200 11 3 / 9/ 20 0 18 3 / 9/ 20 0 25 3 / 10 20 0 /2 3 / 10 20 0 /9 3 10 /20 /1 03 6 10 /2 0 /2 03 3 10 /2 0 /3 03 0/ 11 2 00 /6 3 11 /20 /1 03 3 11 /2 0 /2 03 0 11 /2 0 /2 03 7/ 20 03
Dinars per US Dollar
Figure 11: Exchange Rates for the Iraqi Dinar
3000
Values on May 5
2500
500 (Missing data for 10K)
10,000-dinar note
2000 250-dinar note
1500 New Dinar
1000
↑ Weaker dinar (more dinars required to get 1 $)
Banknote Exchange Announced (July 7) Banknote Exchange Begins (Oct 15)
0
The Fixed Exchange-Rate Regime • As the new dinar came on line, the Central Bank of Iraq (CBI) adopted a fixed exchange rate regime – Advantages: Transparent, encourages trade, allows CBI to earn credibility, does not require calculating and targeting M or P – Disadvantages: Reduces ability to use M policy for other ends (though this could be sees as an advantage). Also susceptible to a run on the dinar if confidence in the new government falls
• Higher oil prices in after the war put upward pressure on Iraq’s real exchange rate – More $ wanted to turn themselves into dinars – CBI had promised to fix the exchange rate, so they had to print the dinars that the market demanded (recall role of arbitrageurs) – This put upward pressure on the dinar money supply … – … and therefore upward pressure on the domestic price level
Effects of the Fixed Exch-Rate Regime e
LM* ε = e (P / P*)
IS* Y
Effects of the Fixed Exch-Rate Regime (con’t) e
LM* ε = e (P / P*)
Higher demand for oil raises NX for any given level of e. IS* shifts out IS*’ IS* Y
Effects of the Fixed Exch-Rate Regime (con’t) e
LM*
LM*’ ε = e (P / P*) Domestic M supply automatically expands in order to keep nominal exchange rate fixed
IS*’ IS*
Eventually, higher M brings about higher P, so real exchange rate rises in the long run – just as we would expect from first part of the course (higher demand for exports raises the real exchange rate ε) Y
Consumer Price Inflation in Iraq 70
64.8
60
Percent Per Year
50
38.5
40
35.1 30.0
30
19.3
20
12.7
12.0 7.8
10
0
1998-2002 (Average)
2002
2003
2004
Source: IMF Regional Economic Outlooks (September 2006 and October 2007)
2005
2006
2007 2008 (Estimate) (Projection)
A tale of two inflations • In the 1990s, inflation in Iraq was a case of “too many dinars chasing too few goods” – The government printed the dinars, because they could spend them first – Midterm question: Hyperinflations stem from budget deficits
• In 2005-2007 the story was different – Dinars being printed to keep the exchange rate from getting stronger – But increases in prices in were higher than the rate of money growth – Why?
Other inflationary influences in 2005-2007 • When prices increases outstrip increases in M, this typically signals a drop in M demand – In this case, this is equivalent to a “velocity shock,” as velocity rises – MV = PY, so higher M and V tend to raise P – This could have occurred b/c of lower confidence in the government as violence worsened – Economy also began to “dollarize,” perhaps b/c people saw the dollar as a more robust store of wealth
• Another influence: “too few goods” rather than “too many dinars” – A drop in Y will also cause P to rise for given M and V – Supply disruptions in 2006 played a very big role in inflation – Gasoline and fuel-oil disruptions were especially severe
Source: IMF Article IV Consultation with Iraq, August 2007
Late 2006 Anti-Inflationary Policy • Central Bank allowed the dinar to appreciate • This reduced growth in the supply of dinars and therefore reduced inflationary pressure • Stronger dinar would also reduce import prices • Iraqi government didn’t want stronger dinar – Government receipts were in dollars (oil revenues) – Government outlays were in dinars (e.g., salaries) – But real exchange rate had to rise, so Iraqi government had to bite the bullet one way or another • Pay more $$ to get a dinar (if higher ε via higher e) • Pay more dinars in salaries/expenses (if higher ε via higher P)
• Stronger dinar also put a stop to incipient dollarization of Iraqi economy
Ir aq: Exchange Rate: Mar ket or Par EOP, Dinar s/US$ 1500
1500
1450
1450
1400
1400
1350
1350
1300
1300
1250
1250
1200
1200 04 05 06 Sour ce: Inter national Monetar y Fund /Haver Analytics
07
Outline 1. Iraq’s economy before the 2003 war 2. Effects of 2003 War 3. Post-War Monetary Policy 4. CPA Economic Reforms: Influences 5. CPA Economic Reforms: Implementation
Three Influences on CPA Reforms 1. Empirical evidence on markets and institutions across countries 2. Lessons from 1990s “transition” economies 3. Lessons from developing economies
1. Markets and Institutions Across Countries • Markets allocate resources efficiently • Assume markets work well unless proven otherwise • Role of government is limited
Key goal in Iraq: Install good institutions • Bremer speech (WEF, Amman, 6/30/2003): “…Iraq’s private sector needs a clear commercial code, honest courts, low barriers to entry and transparent corporate governance arrangements… Countries around the world are rediscovering these prerequisites to growth, and a burgeoning academic literature confirms their importance in empirical data.”
2. Lessons from Transition Economies • Market reforms undertaken in many postsocialist countries in 1990s • World Bank summarized lessons from transition in 2002 report – Discipline the state-owned enterprises (“SOEs”) – Encourage the creation of small and medium sized enterprises (“SMEs”)
Typical Patterns in Transition Economies • Big recession early on when government-run structures unraveled • Labor and resources released from SOEs • Unemployment rises – and doesn’t necessarily fall later on. • Reason: New SMEs are far more productive than old SOEs
Size of “Transition Recessions” Years of Output Decline
Cumulative Output Decline (%)
Real GDP in 2000 (as % of 1990 GDP)
Bulgaria
4
16
81
Czech Republic
3
12
99
Poland
2
6
112
Georgia
5
78
29
Russia
7
40
64
Ukraine
10
59
43
US Great Depression
4
27
--
Country
Unemployment and Per Capita GDP in Poland 18
4000
Per Capita GDP (left scale)
3500
16
14
3000
10
Unemployment (right scale)
2000
8 1500 6 1000
4
500
2
0
0 1990
1991
1992
1993
1994
1995
1996
1997
1998
1999
2000
Percent of Labor Force
Constant 1995 Dollars
12 2500
Unemployment and Per Capita GDP in Russia 4000
16
14
Unemployment (right scale)
3000
12
2500
10
2000
8
Per Capita GDP (left scale) 1500
6
1000
4
500
2
0
0 1990
1991
1992
1993
1994
1995
1996
1997
1998
1999
2000
Percent of Labor Force
Constant 1995 Dollars
3500
How is Iraq different from other transition economies? Bad news: • Less support for market reforms per se • More need for infrastructure improvement • Less proximity to nearby markets (like Germany) • Higher exchange rate reduces exports Good news: • Oil revenues can keep taxes low • Reconstruction of infrastructure provides early boost to aggregate demand
3. Lessons from developing economies • Openness to international trade and investment is a good idea • Import substitution programs usually don’t work • Foreign trade and FDI encourage technology transfer • Developing countries have opened greatly in past decade
Openness is a hard sell in Iraq, Middle East • Openness is a hard sell in the United States, too (ask Greg Mankiw) • Previous Iraqi regime outlawed foreign investment from non-Arabs • Many in Iraq, Middle East are concerned that foreigners will dominate their economy
FDI levels are low in MENA region FDI-GDP Ratio 3.5
Other Developing Countries
3.0 2.5 2.0 1.5 1.0
MENA
0.5 0.0 -0.5
1990 1991 1992 1993 1994 1995 1996 1997 1998 1999 2000 2001
Arguments in Favor of Openness in Iraq • Iraq needs capital to rebuild • Technology transfer enhanced by openness • Host-country residents working for foreign firms earn higher wages • FDI important for growth of SMEs in transition economies • If Iraq is closed, then only former Baathists will have economic power
Was it worth pushing for openness? • Foreigners didn’t rush to invest in transition economies • Security problems will hamper Iraqi FDI But… • Key was to provide a good investment climate for both foreigners and Iraqis • If Coalition didn’t push for openness, it wasn’t going to happen • Recent investment law protects foreign investors as well as domestic ones
Outline 1. Iraq’s economy before the 2003 war 2. Effects of 2003 War 3. Post-War Monetary Policy 4. CPA Economic Reforms: Influences 5. CPA Economic Reforms: Implementation
“Uncontroversial” Reforms 1. New currency + fixed exchange rate (see above) 2. Pay state-sector salaries and pensions • •
Use Saddam dinars in the beginning to improve confidence in the dinar Airlifted millions of dollars into the country
3. Legal reform 4. Reopen banks and encourage lending
“Controversial” Reforms 1. Reopening the country to trade and investment 2. Dealing with inefficient or nonfunctioning SOEs 3. Monetizing the food ration 4. Liberalizing oil prices
Controversial Reform: Reopening the country to trade and investment •
Free-Market – Trade restrictions bad – Should have no barriers to trade across or within borders
•
Pragmatic – Need to protect domestic industries to maintain employment – Free-trade regime no guarantee of growth – May not be what Iraqis want
Controversial Reform: Reopening the country to trade and investment •
CPA policy – At first, a “tariff holiday” – no tariffs or duties on imports or exports – “But please, don’t export subsidized gasoline or import guns and explosives” – Trade supports living standards by allowing dollars dropped on the country to buy imports – Later, an open trade/investment regime with a small (5%) “reconstruction levy” – International investment (except in oil industry) encouraged; protection for domestic investors
Controversial Reform Inefficient SOE employment •
Free-Market – – – –
SOE subsidies drain the budget Inefficient production, shoddy goods Need to release labor for private sector Close them down (after paying workers large severance payment) or … – Sell them off (privatization)
•
Pragmatic – Not a good idea to put 500,000 unemployed Iraqis on the streets
Controversial Reform Inefficient SOE employment •
CPA policy – Learned that privatization was difficult b/c of legal constraints – Kept SOEs open, paying workers (even if they weren’t producing anything) – Greatly reduced subsidies – Froze bank accounts of SOEs – Canceled inter-SOE debts; everyone “starts over” where they are now – Could be viewed as a “middle-of-the-road” solution – or the worst of both worlds
Controversial Reform Monetization of Food Ration •
Free-Market – People are almost always better off with money rather than goods – Giving people spending power would boost private production – the ultimate goal of CPA economic policy
•
Pragmatic – No margin for error if something goes wrong and some people go hungry
Controversial Reform Monetization of Food Ration •
CPA Policy – Stuck with the status quo – Recent efforts to limit the food ration to “poor” families only
“Controversial” Reform Liberalizing Oil Product Prices •
Free-Market – – –
•
Subsidies very expensive for government, mostly helped the rich (who were more likely to own cars and ACs) 5-cent per gallon gasoline, unmetered electricity also encourages inefficient purchases of cars and appliances Set price = marginal cost
Pragmatic –
Not a good idea for US troops to raise gasoline prices when many Iraqis think that we were there to steal their oil in the first place
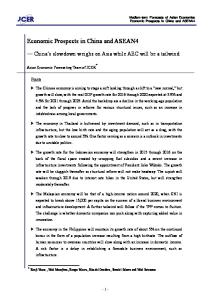
Figure __: Reasons for Coalition Invasion of Iraq In your opinion, why did the U.S. and U.K decide to invade Iraq? To rob Iraq's oil
43%
To depose Saddam Hussein
37%
To benefit the U.S. people
15%
To colonize/occupy and weaken the Middle East
14%
To control Iraq's wealth
11%
To control Iraq's mineral resources (e.g. sulphur, phosphate)
7%
To change the Middle East "map" as U.S. and Isreal want To assist the Iraqi people To destroy weapons of mass destruction All other responses No response/don't know
6% 5% 4% 10% 10%
Note: Question w as open-ended, and respondents could give more than one answ er.
Source: The Gallup Organization, poll of 1,178 residents of Baghdad, August 28 to September 4, 2003.
Controversial Reform Liberalizing Oil Product Prices •
CPA Policy – Stuck with the status quo – Recent efforts to eliminate subsidies, at the strong insistence of the IMF – These effects have recently borne fruit, leaving more resources for reconstruction
Source: IMF Survey, May 7, 2007
Figure ___: Political Attitudes of Iraqis "I w ould be m ore likely to support a party that advocated or prom ised … "
More Government Jobs
48.9%
Strengthening Iraqi Police
32.9%
Improving Electrical Service
29.1%
Lowering the Price of Basic Goods
26.8% 25.5%
Strengthening Iraqi Army Improving Border Protection
23.1% 17.2%
Promoting Religion as a Basis for Government Departure of Coalition Forces
14.8% 13.8%
Improving Education Improve Housing, Pensions, and Health Care
11.3%
Promote Ethnic and Religious Harmony Higher Salaries Separating Religion and Government
9.0% 7.1% 6.5%
More Private Sector Jobs
4.6%
Keep Coalition Forces Until Security is Good
4.2%
Get Telephones Working
3.8%
Note: Respondents could give more than one answ er.