CONTAMINANTS IN NEW ORLEANS SEDIMENT An Analysis of EPA Data
Gina M. Solomon, M.D., M.P.H. Miriam Rotkin-Ellman
Natural Resources Defense Council february 2006
TABLE OF CONTENTS
Overview……………………………………………………………………………. 3 Arsenic ........................................................................................................................4 Figure 1: Average and Maximum Arsenic Levels by District...........................5 Table 1: Locations with Sediment Arsenic Levels Greater than 100 Times the EPA Soil Cleanup Guideline (39 mg/kg).................................. 5 Table 2: Summary of EPA Arsenic Sampling in Greater New Orleans Area ...6 Diesel Fuel …………………………………………………………………………. 7 Figure 1: Average and Maximum Diesel-range Organics Levels by District .. 8 Table 1: Locations with Sediment Diesel Fuel Levels Greater than 100 Times LDEQ Screening Standard (65mg/kg)............................................ 8 Table 2: Summary of EPA Diesel Fuel Sampling in Greater New Orleans Area....................................................................................................................9 Benzo(a)pyrene .........................................................................................................10 Figure 1: Average and Maximum Benzo(a)pyrene Levels by District............11 Table 1: Locations with Highest Levels of Benzo(a)pyrene in Sediment .......11 Table 2: Summary of EPA Benzo(a)pyrene Sampling in Greater New Orleans Area..................................................................................................................11 Lead ..........................................................................................................................12 Figure 1: Average and Maximum Lead Levels by District .............................13 Table 1: Locations with Sediment Lead Levels Greatly Exceeding the LDEQ RECAP Cleanup Level. (>400 mg/kg)………………………………………13 Table 2: Summary of EPA Lead Sampling in Greater New Orleans Area......14 Endnotes....................................................................................................................15 Map of Arsenic Levels in New Orleans Area Sediment Samples ............................16 Map of Diesel-range Organics in New Orleans Area Sediment Samples ................17 Map of Benzo(a)pyrene Levels in New Orleans Area Sediment Samples ...............18 Map of Lead Levels in New Orleans Area Sediment Samples.................................19 Health Advisory for New Orleans Residents............................................................20
Natural Resources Defense Council
February 2006
Overview The floodwaters from hurricanes Katrina and Rita swept a mixture of soil, mud from Lake Pontchartrain, and debris into the greater New Orleans area. When the water receded, it left behind a caked layer of muck on streets, yards, porches and playgrounds across the region – sediment that was likely contaminated with heavy metals and toxic chemicals swept up from industrial areas. The U.S. Environmental Protection Agency (EPA) collected hundreds of samples of this sediment throughout the New Orleans region from September 10, 2005 to January 15, 2006, and released the data – absent any analysis – to the public on its website (http://oaspub.epa.gov/storetkp/dw_home) in January 2006. NRDC has now analyzed the EPA’s sediment data, and the Greater New Orleans Community Data Center has created maps to demonstrate patterns of contamination in the sediment. Although the EPA tested for a variety of contaminants, this analysis focuses on four toxic contaminants that are most widespread in the sediment samples: arsenic, lead, diesel fuel and benzo(a)pyrene. All of these contaminants were detected in sediment throughout the greater New Orleans area, often in concentrations in excess of EPA and Louisiana Department of Environmental Quality (LDEQ) cleanup guidelines for soil in residential areas. Our analysis of EPA data shows that most districts in New Orleans contain concentrations of arsenic, lead, diesel fuel or cancer-causing benzo(a)pyrene above levels that would normally trigger investigation and possible soil cleanup in the state of Louisiana. Some hot spots in residential neighborhoods have levels of contamination that are ten times, or even more than a hundred times normal soil cleanup levels. For example, a location in Gert Town, Mid-City has arsenic in the soil at a level 6.5 times the Louisiana cleanup level for residential soil, and 200 times the federal health-based level of concern for soil in residential neighborhoods. The Lake Terrace neighborhood in Gentilly has lead in the soil at a level three times the Louisiana cleanup level. Locations in Chalmette and in the St. Roch neighborhood have diesel fuel contamination more than 200 times the Louisiana soil screening cleanup level. A hot spot for benzo(a)pyrene contamination is in Bywater, at the Agricultural Street Landfill, where the levels exceed Louisiana soil cleanup levels by more than fiftyfold. The EPA did not sample unflooded areas, such as the East Bank and West Bank neighborhoods; soil conditions in these areas are unknown. People returning to New Orleans should take precautions to limit their exposure to the sediment (see Health Advisory, pg. 20). Young children should not play in any areas where there is still sediment on the ground, and it would be best to keep children out of the city until cleanup has occurred. Government agencies must clean up contaminated sediment, and must provide assistance – including information and protective equipment – to people who are trying to clean up their own property. As schools reopen in previously flooded areas, the playgrounds and school yards should be tested to ensure that they have been adequately cleaned before children come back to school.
Page 3 of 21
www.nrdc.org/health/effects/katrinadata/contents.asp
Natural Resources Defense Council
February 2006
Arsenic The levels of arsenic in 95 percent of the sediment samples collected by the EPA in the greater New Orleans area would potentially pose a significant cancer risk, according to EPA guidelines. Thirty percent of samples could trigger cleanup under the weaker Louisiana guidelines. The average level of arsenic found by the EPA in the greater New Orleans area is 10.6 milligrams per kilogram (mg/kg) of soil, and in Orleans Parish the average is 11.8 mg/kg. In comparison, the Region 6 EPA health-based soil screening level for residential areas is set at 0.39 mg/kg to protect against cancer.1 According to the LDEQ, the background arsenic level in soil in Louisiana is approximately 7 mg/kg, and the state has set a soil evaluation or cleanup guideline for arsenic at 12 mg/kg.2 Arsenic is toxic to humans and is known to cause cancer; no amount is considered fully safe. Many scientific studies, including numerous reviews by the National Academy of Sciences, have determined that arsenic can cause cancer of the bladder, skin and lungs; likely causes other cancers; and can cause a variety of other serious health problems including birth defects, cardiovascular disease, skin abnormalities, anemia and neurological disorders.3 Arsenic may be so widespread in the New Orleans area because of past use of arsenicbased pesticides, trash incineration, leakage from industrial sites and the use of building materials pressure-treated with chromium-copper arsenate. Alternatively, the arsenic may have been in the sediment at the bottom of Lake Pontchartrain and distributed throughout the city with the floodwaters. Regardless of where the arsenic came from, the flooding spread it on the surface of the ground, where people can easily touch it, breathe it or get it in their eyes and mouths. The districts in New Orleans with the highest average arsenic concentration in the soil are near Lake Pontchartrain, including Lakeview, Gentilly and New Orleans East; the average soil arsenic levels in Mid-City and Bywater also exceed the LDEQ soil cleanup guidelines (Figure 1). There are serious hot spots of arsenic contamination in several neighborhoods, including Lakeview, Gentilly, Mid-City and New Orleans East (Table 1). The highest level of arsenic found in New Orleans is in the Gert Town neighborhood of Mid-City. This location has an arsenic level that is 6.5 times the LDEQ soil cleanup level, and 200 times higher than the EPA health-based level of concern for arsenic in soil.
Page 4 of 21
www.nrdc.org/health/effects/katrinadata/contents.asp
Natural Resources Defense Council
February 2006
Figure 1:
Table 1: Locations with Sediment Arsenic Levels Greater than 100 Times the EPA Soil Cleanup Guideline (39 mg/kg) Arsenic Concentration (mg/kg)
Street Location
Neighborhood
District
78.0 61.2 55.2 53.3 52.0 50.0 45.5
Euphrosine and S. Lopez St Crescent Street near St. Bernard Cadillac and Senate 33rd and Fleur de Lis Franklin and Lombard Streets Porteus and Argonne 11025 Chaucer
Gert Town Fillmore St. Bernard Area West End Gentilly Terrace Lakeview Neighborhood Read Blvd East
Mid-City Gentilly Mid-City Lakeview Gentilly Lakeview New Orleans East
Page 5 of 21
www.nrdc.org/health/effects/katrinadata/contents.asp
Natural Resources Defense Council
February 2006
Table 2: Summary of EPA Arsenic Sampling in Greater New Orleans Area District
# samples # samples Average per square (mg/kg) mile
Upper 95% Maximum Exceed Exceed Exceed confidence (mg/kg) EPA Louisiana LDEQ interval screening background cleanup level (%) guideline (%) (%)
Central City/Garden District
8
1.8
7.4
10.0
12.1
100%
63%
13%
Uptown/Carrollton
22
2.9
3.1
4.7
17.0
69%
0%
0%
Mid-City
21
3.0
15.9
24.4
78.0
95%
48%
43%
Lakeview
21
2.8
17.2
23.4
53.3
100%
71%
52%
Gentilly
28
3.5
13.7
19.1
61.2
100%
64%
39%
Bywater
31
5.3
13.0
15.9
28.9
100%
68%
52%
Lower Ninth Ward
23
10.1
9.2
10.7
15.8
100%
70%
17%
N.O. East
44
3.1
16.0
18.8
45.5
100%
82%
68%
Arabi
22
10.4
8.7
10.6
20.3
100%
41%
23%
Chalmette
52
6.6
8.0
9.2
21.4
100%
58%
15%
Meraux Greater New Orleans Area Orleans Parish
17
3.6
5.4
6.4
11.5
100%
18%
0%
10.6 11.8
11.7 13.3
78.0 78.0
95% 93%
56% 59%
30% 37%
Page 6 of 21
389 228
www.nrdc.org/health/effects/katrinadata/contents.asp
Natural Resources Defense Council
February 2006
Diesel Fuel The levels of diesel fuel (measured as diesel-range organics) in 59 percent of the sediment samples collected by the EPA in the greater New Orleans area, and in 91 percent of the samples the EPA collected in Orleans Parish, would potentially trigger soil cleanup, according to LDEQ guidelines. The average level of diesel fuel found by the EPA in the greater New Orleans area is 524.1 milligrams per kilogram (mg/kg) of soil, and in Orleans Parish the average is 956.8 mg/kg. In comparison, the LDEQ soil screening level for residential areas is set at 65 mg/kg. LDEQ also uses a level of 650 mg/kg for Management Option 1 (MO-1) RECAP standards, which probably do not apply to this situation.4 Even so, more than 17 percent of samples in the greater New Orleans area (35 percent in Orleans Parish) exceed 650 mg/kg. According to the EPA and the Centers for Disease Control and Prevention (CDC), even brief skin contact with sediment contaminated by fuel oil can cause itchy, red, sore and peeling skin. Breathing dust contaminated with these chemicals, especially over the course of many days, can also cause illness. Inhalation of the vapors released from diesel fuel can damage the kidneys, increase blood pressure and decrease the ability of blood to clot.5 The high levels of diesel fuel found in the sediment are likely a result of the many fuel spills that occurred during hurricanes Katrina and Rita. The sources of these spills ranged from submerged vehicles and gas stations to refineries such as Murphy Oil in Chalmette, St. Bernard Parish. The flooding spread diesel fuel around many parts of the city, and even after the waters receded it remained in the soils where people can easily touch it, breathe it or get it in their eyes and mouths. The districts in the greater New Orleans area with the highest average levels of diesel fuel in the soil are Central City/Garden District, Mid-City, Lakeview and Bywater; the average soil diesel fuel levels in Gentilly and New Orleans East also exceed the LDEQ soil cleanup guidelines (Figure 1). There are serious hot spots of diesel fuel contamination in several neighborhoods, including Chalmette, Bywater, Lakeview, Central City and Mid-City (Table 1). The highest level of diesel fuel contamination in the New Orleans area is in Chalmette, where the concentration is nearly 280 times the LDEQ MO-1 RECAP screening level. A location in the St. Roch neighborhood of Bywater is contaminated with diesel fuel at a level more than 218 times the LDEQ soil screening level for residential areas. Note: Because the EPA testing for diesel-range organics had extremely high and variable detection limits, this analysis only includes samples where diesel-range organics were detected.
Page 7 of 21
www.nrdc.org/health/effects/katrinadata/contents.asp
Natural Resources Defense Council
February 2006
Figure 1:
Table 1: Locations with Sediment Diesel Fuel Levels Greater than 100 Times LDEQ Screening Standard (65 mg/kg) Diesel-range Organics (mg/kg) 17400 14200 9920 9160 9140 8250 7740 7590
Page 8 of 21
Street Location 2908 Blanchard Franklin and Abundance Jacob and Judge Perez 33rd and Fleur de Lis S. Galvez and Fourth Castine and Frey 2909 Delambert 2515 Jacob
Neighborhood
St.Roch West End Central City Fairgrounds
District Chalmette Bywater Chalmette Lakeview Central City/Garden District Mid-City Chalmette Chalmette
www.nrdc.org/health/effects/katrinadata/contents.asp
Natural Resources Defense Council
February 2006
Table 2: Summary of EPA Diesel Fuel Sampling in Greater New Orleans Area District
# samples # samples Average diesel fuel per square (mg/kg) detected mile
Upper 95% confidence interval (mg/kg)
Maximum (mg/kg)
Exceed Exceed LDEQ LDEQ screening RECAP MO-1 (%) (%)
Central City/Garden District
5
1.1
2533.0
5823.5
9140
100%
60%
Uptown/Carrollton
14
1.9
617.3
1060.5
2610
100%
21% 38%
Mid-City
21
3.0
1317.7
2176.1
8250
95%
Lakeview
20
2.7
1220.3
2131.0
9160
85%
35%
Gentilly
28
3.5
765.2
991.9
2050
96%
46%
Bywater
32
5.5
1116.1
1989.7
14200
94%
28%
Lower Ninth Ward
19
8.4
148.0
197.2
481
53%
0%
N.O. East
42
3.0
773.1
1057.1
5565
93%
48%
Arabi
22
10.4
239.7
361.5
1230
91%
9%
Chalmette
430
54.2
343.6
460.0
17400
43%
10%
Meraux
20
4.2
239.9
643.4
4150
15%
5%
Greater New Orleans Area
679
9.5
524.1
630.0
17400
59%
17%
Orleans Parish
207
3.7
956.8
1193.0
14200
91%
35%
Page 9 of 21
www.nrdc.org/health/effects/katrinadata/contents.asp
Natural Resources Defense Council
February 2006
Benzo(a)pyrene The levels of benzo(a)pyrene in 43 percent of the sediment samples collected by the EPA in the greater New Orleans area would potentially trigger soil cleanup, according to LDEQ guidelines. The average level of benzo(a)pyrene found by the EPA in the greater New Orleans area and in 57 percent of samples from Orleans Parish is 975.5 micrograms per kilogram (ug/kg) of soil, and in Orleans Parish itself the average is 1,359.6 ug/kg. In comparison, the LDEQ soil cleanup level for residential areas is set at 330 ug/kg.6 Benzo(a)pyrene is part of a group of chemicals known as polycyclic aromatic hydrocarbons (PAHs). These chemicals are found in soot and are also in many petroleum products. Benzo(a)pyrene is one of the most toxic PAHs. It can cause chromosome damage, cancer, immune suppression and risks to normal fetal development.7 The high levels of benzo(a)pyrene found in the sediment may be due to the numerous spills of petroleum products such as diesel fuel during the hurricanes, or can be due to historic contamination from burning of debris or petroleum. The flooding spread the benzo(a)pyrene around many parts of the city, and even after the waters receded it remained in the soil where people can easily touch it, breathe it or get it in their eyes and mouths. In the majority of the city, districts with high levels of diesel fuel contamination were also found to have correspondingly high levels of benzo(a)pyrene. The exception to this pattern is in the Bywater district, where some of the highest levels of benzo(a)pyrene – in some instances more than 50 times the LDEQ soil cleanup level – were found around the former Agricultural Street Landfill (see Table 1). Contamination at this site, resulting from the disposal of burned materials, is a likely source of the high levels of benzo(a)pyrene found here. In addition to the Bywater district, the average levels of benzo(a)pyrene in the Central City/Garden District, Uptown/Carrollton, Mid-City, Lakeview, Gentilly and New Orleans East exceed the LDEQ soil cleanup levels (see Figure 1).
Note: Because the EPA testing for benzo(a)pyrene had extremely high and variable detection limits, this analysis only includes samples where benzo(a)pyrene was detected.
Page 10 of 21
www.nrdc.org/health/effects/katrinadata/contents.asp
Natural Resources Defense Council
February 2006
Figure1:
Table 1: Locations with Highest Levels of Benzo(a)pyrene in Sediment Benzo(a)pyrene (ug/kg)
Street location
Neighborhood
District
17700 13900 10100
Ag Street Landfill Ag Street Landfill Ag Street Landfill Jefferson Davis & Palmetto Carondelet & Napoleon
Desire Area Desire Area Desire Area
Bywater Bywater Bywater
Gert Town
Mid-City
Uptown
Uptown/Carrollton
4160 2870
Table 2: Summary of EPA Benzo(a)pyrene Sampling in Greater New Orleans Area District
# samples B(a)P detected
# samples per square mile
Average (ug/kg)
Upper 95% confidence interval (ug/kg)
Maximum (ug/kg)
Exceed LDEQ cleanup guideline (%)
Central City/Garden District
5
1.1
908.8
1736.7
2530
80%
Uptown/Carrollton
15
2.0
478.5
823.7
2870
47%
Mid-City
8
1.2
974.9
1889.0
4160
63%
Lakeview
9
1.2
463.8
645.3
1020
78%
Gentilly
12
1.5
656.5
895.7
1680
75%
Bywater
15
2.6
3218.2
6121.3
17700
53%
Lower Ninth Ward
5
2.2
219.2
372.9
519
20%
N.O. East
16
1.1
365.3
493.1
1120
44%
Arabi
10
4.7
149.8
242.4
533
10%
Chalmette
37
4.7
225.0
321.8
1580
16%
Meraux
1
0.2
166.0
---
166
0%
Greater New Orleans Area
144
2.0
975.7
1557.8
35500
43%
Orleans Parish
96
1.7
1359.6
2223.1
35500
57%
Page 11 of 21
www.nrdc.org/health/effects/katrinadata/contents.asp
Natural Resources Defense Council
February 2006
Lead
The levels of lead in 5 percent of the sediment samples the EPA collected in the greater New Orleans area would potentially trigger soil cleanup, according to LDEQ guidelines. However, as much as 28 percent of samples taken in Orleans Parish might be classifiable as hazardous waste according to EPA guidelines.8 The average level of lead found by the EPA in the greater New Orleans area is 93.5 milligrams per kilogram (mg/kg) of soil, and in Orleans Parish the average is 108.3 mg/kg. In comparison, the LDEQ soil cleanup level for residential areas is set at 400 mg/kg, and a concentration that could meet the EPA definition of a hazardous waste is 100 mg/kg.9 Very high lead levels were found at specific locations in five districts in the greater New Orleans area. Lead is very toxic to humans, especially children. Lead can harm many parts of the body, causing neurological problems, high blood pressure and kidney damage. Even very low levels of lead are known to harm brain development in children. Many scientific studies have found that lead can cause children to have lower IQ scores, behavioral problems and difficulty concentrating on tasks in school.10 The high levels of lead found in the sediment are likely due to past use of lead in paint and gasoline, or from leakage from industrial sites. The flooding spread the lead on the surface of the ground where people, especially children, can easily touch it, breathe it, or get it in their eyes and mouths. The districts in the greater New Orleans area with the highest average levels of lead in the soil are Central City/Garden District, Mid-City, Gentilly and Uptown/Carrollton. Hot spots in these neighborhoods as well as in Bywater, the Lower Ninth Ward and Arabi greatly exceed the LDEQ soil cleanup guidelines (see Figure 1). The highest level of lead detected in New Orleans is in the Lake Terrace neighborhood of Gentilly, where the soil concentration is nearly three times the LDEQ soil cleanup level, and more than ten times the level that may qualify as hazardous waste under the EPA’s guidelines.
Page 12 of 21
www.nrdc.org/health/effects/katrinadata/contents.asp
Natural Resources Defense Council
February 2006
Figure 1:
Table 1: Locations with Sediment Lead Levels Greatly Exceeding the LDEQ RECAP Cleanup Level. (>400 mg/kg) Lead (mg/kg) 1160 752 689 655 641 627 613
Page 13 of 21
Street Location Leon C Simon & Milneberg Port & Robertson Tupelo & Dauphine Treme & St. Philip Roman St & Mandeville Touro & N. Claiborne Franklin and Lombard
Neighborhood Lake Terrace St. Claude Holy Cross Treme/Lafitte St. Roche Seventh Ward Gentilly Terrace
District Gentilly Bywater Lower Ninth Ward Mid-City Bywater Mid-City Gentilly
www.nrdc.org/health/effects/katrinadata/contents.asp
Natural Resources Defense Council
February 2006
Table 2: Summary of EPA Lead Sampling in Greater New Orleans Area District
# #samples per samples square mile
Average (mg/kg)
Upper 95% confidence interval (mg/kg)
Maximum (mg/kg)
May be classified as hazardous waste (%)
Exceed LDEQ cleanup guidelines (%)
Central City/Garden District
8
1.8
278.5
471.4
427
88%
38%
Uptown/Carrollton
22
2.9
166.2
235.7
445
64%
25% 24%
Mid-City
21
3.0
246.7
352.2
655
62%
Lakeview
21
2.8
94.6
135.1
313
33%
0%
Gentilly
27
3.4
194.6
268.0
1160
56%
15%
Bywater
53
9.1
75.9
96.3
752
19%
4%
Lower Ninth Ward
34
15.0
57.1
76.3
689
3%
3%
N.O. East
43
3.1
54.6
70.9
295
7%
0%
Arabi
22
4.6
89.2
126.5
522
14%
9%
Chalmette
58
7.3
55.5
69.8
145
7%
0%
Meraux
23
10.8
21.8
30.6
31.2
0%
0%
Greater New Orleans Area
364
93.5
107.5
1160
22%
5%
Orleans Parish
261
108.3
126.9
1160
28%
7%
Page 14 of 21
www.nrdc.org/health/effects/katrinadata/contents.asp
Natural Resources Defense Council
February 2006
ENDNOTES 1
EPA Region 6 Human Health Medium-Specific Screening Levels. November 2005. http://www.epa.gov/earth1r6/6pd/rcra_c/pd-n/screen.htm 2 Louisiana Department of Environmental Quality. State-Specific Background Arsenic Level in Soil. November 2001. http://cleanuplevels.com/Page.htm. Louisiana Department of Environmental Quality Risk Evaluation/Corrective Action Program (RECAP) October 20, 2003. Screening Standards for Soil and Groundwater. http://www.deq.louisiana.gov/portal/Portals/0/technology/recap/2003/RECAP%202003%20Text%20Table%20 1.pdf 3 Agency for Toxic Substances and Disease Registry (ATSDR). ToxFaqs: Arsenic. http://www.atsdr.cdc.gov/tfacts2.html 4 The LDEQ Management Option 1 (MO-1) RECAP standard applies only when (1) there are “no sensitive subpopulations on or near the [site],” (2) there is no likelihood of “ingestion of sediment” or “dermal contact with sediment,” (3) “the area of impacted soil is approximately 0.5 acre or less,” and (4) “activities that may generate high dust levels” are not present. None of these conditions hold in the greater New Orleans area, so the RECAP MO-1 level of 650 mg/kg is not an appropriate comparison number to use. 5 EPA. Summary of results from September 10-19, 2005. http://0www.epa.gov.library.unl.edu/katrina/testresults/sediments/. ATSDR. ToxFaqs: Fuel Oils. http://0www.atsdr.cdc.gov.library.unl.edu/tfacts75.html 6 Louisiana Department of Environmental Quality Risk Evaluation/Corrective Action Program (RECAP) October 20, 2003. Screening Standards for Soil and Groundwater. http://www.deq.louisiana.gov/portal/Portals/0/technology/recap/2003/RECAP%202003%20Text%20Table%20 1.pdf 7 ATSDR ToxFaqs: Polycyclic Aromatic Hydrocarbons. http://0www.atsdr.cdc.gov.library.unl.edu/tfacts69.html 8 The Toxicity Characteristic Leaching Procedure (TCLP) is a test that is used to determine if a waste material may meet the definition of a hazardous waste [RCRA (40 CFR Part 261)]. The EPA allows for a total constituent analysis instead of the standard TCLP extraction procedure. If a waste is 100 percent solid, then the results of the total constituent analysis may be divided by 20 to convert the total results into the maximum leachable concentration. The regulated level for lead is 5 ppm, meaning that any soil lead concentration over 100 mg/kg could be considered a hazardous waste. http://www.epa.gov/sw-846/faqs_tclp.htm 9 Louisiana Department of Environmental Quality Risk Evaluation/Corrective Action Program (RECAP) October 20, 2003. Screening Standards for Soil and Groundwater. http://www.deq.louisiana.gov/portal/Portals/0/technology/recap/2003/RECAP%202003%20Text%20Table%20 1.pdf 10 ATSDR. ToxFaqs: Lead. http://0-www.atsdr.cdc.gov.library.unl.edu/tfacts13.html.
Page 15 of 21
www.nrdc.org/health/effects/katrinadata/contents.asp
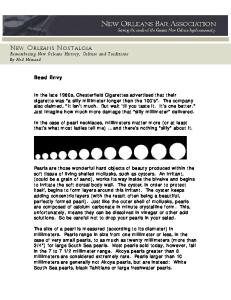
Arsenic Levels in New Orleans Area Sediment Samples LDEQ Standards Below statewide average* concentration in soil 0.4 - 7.0 Above soil screening level Below statewide average (1 in 1,000,000 cancer risk) concentration in soil 7.1 - 12.0 Above soil screening level Greater than statewide average concentration in soil 12.1 - 39.0 Above soil screening level Above residential evaluation/cleanup level 39.0 - 202.5 Above soil screening level Above residential evaluation/cleanup level (1 in 10,000 cancer risk) Units in milligrams per kilogram of soil (mg/kg) *Arithmetic mean ! EPA Standards 0.0 - 0.39 Below level of concern
www.nrdc.org
0
! ! !
!
!
!
! ! ! !
!
Jefferson ! Parish
!!
! !
! !
! !
( !
! !
!
!
! ! !
! !
! ! Uptown/Carrollton ! ! (
! ! ! ( ! !! ! ( !
!! ! !
!
! !
!
! ! (
!
!
!
!
!
! !
! ! ! !
Bywater
!
French Quarter/CBD
! !
Central City/Garden District
!
!
! ( !
! ! ( !
! !
!
! ! ! ! ! ! ! ! ! ! ! !
( ! !
!
( !
! ( !
( !
!
! !! !! !!! !! !
N.O. East
!
!
! !
!
Mid-City
!! !
!
!
! !
!
!
! !
!
! !
( !
!
!
!
! ! !
!! !! ! !!! ! ! ! ! !
!
!
! !
!
( !
Gentilly
!!
Lakeview
! ! !
! !
!
! !
!! ! ! ! !
! !
! !
!
!
! ! ( !
! !
!
!
! !
!
!
!
!
!
!
!
Village de l'Est Area
! !
2 mi
!
!
!
1
! ! Viavant/Venetian Isles
! ! ! ! !
! ! ! !
!
!
St. Bernard Parish ! ! ! !! ! ! ! Lower Ninth Ward ! ! ! ! ! ! ! ! ! ! ! ! !! ! ! !!!! ! ! !! ! ! ! ! ! ! ! ! ! ! !! ! ! Arabi ! ! ! ! !! Mi ! ! ! ! ! ! ssis ! ! ! ! sip ! ! pi R ! !! ! !! !! ! ive ! ! r !!! ! ! ! Chalmette ! ! !
Meraux
Algiers
! ! New Aurora/English Turn
Jefferson Parish
Created Feb 2006, www.gnocdc.org
Sources: Sediment samples, Environmental Protection Agency, Sept 10, 2005-Jan 15, 2006, ; soil screening levels, Louisiana Department of Environmental Quality (LDEQ) Risk Evaluation/Corrective Action Program 2003 & EPA’s Region 6 Human Health Medium-Specific Screening Levels ; planning districts & neighborhood boundaries, New Orleans City Planning; streets & water, Census TIGER; data analysis, NRDC.
Levels of Diesel-Range Organics in New Orleans Area Sediment Samples ≤ 65 Below LDEQ management or evaluation level Above LDEQ screening level for management or evaluation 66 - 650 651 - 17,400.0 Above LDEQ level for more in-depth evaluation or management Units in milligrams per kilogram soil (mg/kg)
! ! (
! ( ! ! ! !
!
Jefferson ! Parish
!! (
!! ! ! ! ( !
! !
!
( !
!
! !
!
!
! ! !
! !
! ( !
Uptown/Carrollton
( !
! ! ! ! !!
! ( !
( ! ( !
!!
! !
! !
( ! ! (
!
( !
!
! !
! ! !
! !
!
! ( ! ! ( ! ! ! ( ( ! ( ! ! ! ( ! !
! !
( !
!
! !
!
!
! (! ! !! !!! !! !
N.O. East
!
( !
! !
! !! ! !
!
! ( !
!
!
!
! !
!
!
!
Mid-City
( ! !
! ! ( !
( !
!
!
!
!
!
!
!
! !!(! !! !! ! ! ! ! !
( !
!!
!
!
!
Gentilly
! !
! !
!
! !
!
!
!
! !
! ! (
!
! !
Lakeview
! !
! !
( !
!
( ! ! ( !
! !
!
!
!
!
!
!
Village de l'Est Area
! !
2 mi
!
!
!
! !
1
Lake Pontchartrain
Note: The Louisiana Department of Environmental Quality (LDEQ) has designated different levels of this contaminant as triggering different levels of review. Note: Due to extremely high and variable limits of detection in the EPA sampling, the non-detections were excluded from this map.
www.nrdc.org
0
( ( ! ! Viavant/Venetian Isles
( !
!Bywater! ! ! ! !
!
French Quarter/CBD
! !
Central City/Garden District
( !
( !
! ! !!
! ( ( ! ( ! !
!
!
St. Bernard Parish
(( ! ( ! !! ! ! ! ! !! ! ( Ninth Ward! Lower ( ! ! ! ( ! ! ! ( ! !! ! ( ! (! ! ! ! !!! (! ( ! ! ! (! ! ! ! ( ! ( ! ( ! ! ! ! ! (! ! ( ! ! ( !! !! ! ! ! (! ( ! Arabi ! Mi ( ! ! (! ! ! (! ! ssis ( ( (! ( ! (! ! ( ! (! ! (! (! ( ! !( ( (! (! ! (! ! (! ( ! !! ! ( ! sip (! ! ( ( ! (! (! ! ( ! ! ( ( ( ! ( ! ( ! ( ! ( ! ( ! (! ! ( ( ! ! ! ( ! ! ( ! ( ! ( ! ( ! ! ( ! ( ! ( ! ( (! ! ( ! ( ! ( ! pi R ( ! ( ! ( ! ( ! ( ! ( ! ( ! ( ! ( ! ! ! ( ! ( ! ! ( ! ( ! ( ! ( ! ( ! ( ! ( ! ( ! ( ! ( ! ( ( ! ( ! ( ! ( ! ( ! ( ! ( ! ( ! ( ! ( ! ( ! ( ! ! ( ! ( ! ( ! ( ! (! ! ( ! ( ! (! ! ( ! ! ! (! ! ( ! ive (! ! ( ( ! ( ! ( ! ( ! ( ( ! ( ( ! (! ! ( ! ( ! ( ! ( ( ! ( ! ( ( ! ! ( ! ! ( ! ! ( ! (! ! ! ( ! ( ! ! ( ! ! ( ! ( ( ! ( ! ( ! ( ! ! ! ( ! ( ( ! ( ! ( ! ( r ( ! ( ! ( ! !! ! ( ! (! (! ! ( ! ((! ! ( ! ( ! ( ! ( ! ( ! ( ! ( ! ( ! ( ! ! ( ! ( ! ( ! ( ! ! ( ! ! ( ! ( ! ( ! ( ! ( ! ! ( ( ! ( ( ( ! ( ! ( ! ( ! ! ! ( ! ( ! ! ! ( ! ( ! ( ! ( ! ( ( ! ! ( ! ( ( ! ( ( ! ( ! ! ! ! ( ! ( ! ( ! ( !! ! ! ! ! ( ! ( ! ( ( ( ! ! ( ! ( ! ( ! ! ( ! ( ! ! ! ! ! ! ( ! ! ( !! ! ( ! ( !! ! ! ( ! ! ! ( ! ( ! !( ( ! ( ( !! ! ! (! ! ( ! (( ( ! ( ! ( ! ( ! ( ! ! ! ! ! ( ! Chalmette ! ( ( ! ( ! Meraux ( ! ( ! !! ( ! ( ! ! !!! ( ! ! ( !! ( ! ( ! ! ! ! (! ! ( ! ( ! ( ! ( ! ( ! ( ! ! ! ( !! ! ! ( ( ! (! ! ! !! ! ( ! ( ! ( ! ! ! ! ! !! ( ! ! ! !!! ! ( Algiers ( ! ( !
Jefferson Parish
New Aurora/English Turn
Created Feb 2006, www.gnocdc.org Sources: sediment samples, Environmental Protection Agency, Sept 10, 2005-Jan 15, 2006 ; soil screening levels, Louisiana Department of Environmental Quality (LDEQ) Risk Evaluation/Corrective Action Program 2003 ; planning districts & neighborhood boundaries, New Orleans City Planning; streets & water, Census TIGER; data analysis, NRDC.
Benzo(a)pyrene Levels in New Orleans Area Sediment Samples 0
≤ 330 Below LDEQ evaluation or management level 331 - 35,500 Above LDEQ evaluation or management level Units in micrograms per kilogram soil (μg/kg) Note: Due to extremely high & variable limits of detection in the EPA sampling, the non-detections were excluded from this map.
www.nrdc.org
Lake Pontchartrain
( !
!
( !
N.O. East
Jefferson Parish
!
!
! ! ( !
!
( !
( !
! ( !
! ( ! !
( ! !
( ! ! (
( !
( !
!
!
Mid-City
( !
!
( !
Viavant/Venetian Isles
Bywater
!
! !
! ( !
! !
( !
! !
! Uptown/Carrollton !
French Quarter/CBD
!
( ! ( !
!
! ( ( ! ( ( ! Lower Ninth Ward ! (! ( ! ! ! (! ! ( (! (! (! ! ( ( ( ! ! ! ( ! ( ! ( ! ( ! ( ( ! ! ! Arabi ( Mi ( ! ( ! ssis ! sip (! ! ( ! ! pi R ive ( ! r ( !
( !
!
!
!
( !
( !
( ! ( !
!
( !!! ( ! ( !
! !
( !
!
( ! !
!
( !
!
( !
Lakeview
! ( !
( ! ! (
Gentilly
!
! !
! !
!
( !
!
!
!
!
!
2 mi
Village de l'Est Area
( ! ! ! (
1
! ( !
Chalmette
Central City/Garden District
! Algiers
!
Jefferson Parish
St. Bernard Parish
! ( ( ! ! ( ! ( ( ( ! (! ( ( ! (! ! (! ! (! ! (! ! (! ! (! ! (! ( ( ! ( ! ( ! ( ( ( ( ! ( ! ( ! ( ! ( ! ( ! ( ! ( ! ( ! ( ! ( ! ( ! ( ! ( ! ( ! ( ! ( ! ( ! ( ! ( ! ( ! ( ! ( ! ( ! ( ! ( ! ( ! ( ! ( ! ( ! ( ! ( ! ( ! ( ! ( ! ( ! ( ! ( ! ( ! ( ! ( ! ( ! ( ! ( ! ( ! ( ! ( ! ( ! ( ! ( ! ( ! ( ! ( ! ( ! (! ! ( ! ( ! ( ! ( ! ( ! ( ! ( ! ( ! ( ! ( ! ( ! (! ! ( ! ( ! (! ( ! (! (! ! ( ! ( ! ( ( ! ( ! (! ! ( ! ( ( ! ( ! ( ! ( ! ( ( ( ! ( ! ( ! (! ! ( ! ( (! ! ( ! ( ( ! ( ( ! ( ! ( ! ( ! ( ! ( ! (! ! ( ! ( ! ( ! ( ! ( ! ( ! ( ! ( ! ( ! ( ! ( ! ( ! ( ! ( ! ( ! (! ( ! ( ! ( ! ( ! ( ! ( ! ( ! ( ! ( ! ( ! ( ! ( ! ( ! ( ! ( ! ( ! ( ! (! ( ! ( ! ( ! ( ! ( ! (! ! ( ! ( ! ( ! ( ! ( ! ( ! ( ( ! ( ! ( ( ( (! ! (! ! ( ! ( ! (! ! (! ! (! ! (! ( ! ( ! (! ( ! (( ( ! (! ! ( (( ! ( ! ( ! ( ! ( ! ( ! (! ! (! ! ( ! ( ! (! ! ( ! ( ! ( ( ! ( ! ( ! ( ! ( ! ( ! ( ! ( ! ( (! ! (! ! (! ! ( ( (! ( ( ! (! !
Meraux
( !
New Aurora/English Turn
Created Feb 2006, www.gnocdc.org
Sources: Sediment samples, Environmental Protection Agency, Sept 10, 2005-Jan 15, 2006 ; soil screening levels, Louisiana Department of Environmental Quality (LDEQ) Risk Evaluation/Corrective Action Program 2003 ; planning districts & neighborhood boundaries, New Orleans City Planning; streets & water, Census TIGER; data analysis, NRDC.
Lead Levels in New Orleans Area Sediment Samples 0
0 - 100 Below level that could qualify as hazardous waste by EPA RCRA criteria 101 - 400 Above level that could qualify as hazardous waste by EPA RCRA criteria 401 - 1370 Above LDEQ evaluation or management level & above EPA level of concern for residential soil Units in milligrams per kilogram of soil (mg/kg) Note: The U.S. EPA defines hazardous waste according to a test (TCLP) which can be estimated as a sediment lead level of 100 mg/kg
www.nrdc.org
Lake Pontchartrain ( ! ! ( ( !
!
( !
( ! ! ( ( ! !
( !
Jefferson ! Parish
( ! ! (
( !
( !
(! ! (
Lakeview
!! ( ( ! ( ! ! !
( !
! !
( !
( ! ! !
!
Mid-City
( !
!
( ! !
!
( !
! ( !
! ! !
! ( !
! ( !
Uptown/Carrollton
!
! ! ! ! !!
( ! !
! !
!
( !
!! ! ( !
! (! ! (! ( ( ! ( ( ! ( ! !! ( ( ! ( ! ( ! ( ! ( ! (! ! ( ! ( ! (! ! ( (( ! ! ( ( ! ( ! ( ! ( ! ( ! ( ! Bywater
! ( ! ! ( !
( ! ! (
( !
( !
( !
( !
( !
! ! ! !
( !
French Quarter/CBD
! !
Central City/Garden District
( ! ! (
( !
N.O. East
! ( !
( ! ( !
( ! ( ! ( !
( ! ( !
( !
! ! ( ! ( ! ( ( ( ! ! ( ! ( ( ! ! ! ( ! !
( ! ( !
!
( !
! ( !
( !
( ! ( !
( ( ! !
! !
( !
!
( ! ( !
! ( !
( !
! ( !
( !
!
( ! ! (
!
( ! ! !
!
( !
! ( ( !
Gentilly
( ! ( !
( ! ( ( ! !
! ! (
!
! !
( !
!
( ! !
!
( !
( !
( ! ( !
( !
Village de l'Est Area
( ! ( !
2 mi
( !
( !
( !
( !
( !
( !
( !
1
( ( ! ! Viavant/Venetian Isles
( !
(! ! ( ! ! ( ( ( ( ! ( ! ! ( ! (! ! ( ! St. Bernard Parish ( ! (! ( ! ( ! ( ! ( ! ( ! ( ! ! ( ! ! ! ( ! ! ( ! ( (! ( ! ( ( ! ( ! Lower Ninth Ward (! (! ! ( ! ( ( ! ! ( ! ! ( ! ! ( ! ( ! ( ( ( ! ( ! ( ! ( ! ( ! ( ! (! ( (! ! ( ! ( ! ( ! ( ! ( ( ! ! ( ! ( ! ! ( ! ( ! (! ! ! ( ( ( ! ( ! ! ( (( ! ! ! (! ( Mi ! ( ! ! ( ! ( ! ( ! ( ! ssis ( ! ( ! ( ! Arabi ( ! sip ( ( ! (! ( !! ! ( ! (! ( pi R ( ! ! (! ( ! ! ( ( ! ive ! ! ( ! ! ( r ( ! ((! ! ( ( ( ! (! ! ( ! ! ( ( ! ! Chalmette ( !
Meraux
!
Algiers
( !
( ! New Aurora/English Turn
Jefferson Parish
Created Feb 2006, www.gnocdc.org Sources: sediment samples, EPA, 9/10/05-1/15/06 ; Resource Conservation and Recovery Act (RCRA) levels ; soil screening levels, Louisiana Department of Environmental Quality (LDEQ) Risk Evaluation/Corrective Action Program 2003 & EPA’s Region 6 Human Health MediumSpecific Screening Levels ; planning districts & neighborhood boundaries, New Orleans City Planning; streets & water, Census TIGER; data analysis, NRDC.
( !
Natural Resources Defense Council
February 2006
Health Advisory for New Orleans Area Residents Due to high levels of mold, other air quality issues and contaminants in sediment, NRDC advises that children, the elderly, and people with serious allergies, asthma, heart conditions or compromised immune systems avoid previously flooded areas of the city at this time. We recommend the following short-term precautionary steps for people returning to New Orleans and surrounding areas. •
Do not bring young children into flooded areas, where they might touch sediment and put their fingers in their mouths.
•
Avoid activities that stir up dust, such as sweeping and shoveling. Dried dirt and mud in and around your house may contain harmful toxic chemicals. If you do want to clean up the sediment, wet it down slightly before sweeping or shoveling it up, and be sure to wear protective clothing and a respirator.
•
Wear an N95 respirator when entering homes or dusty areas in previously flooded areas of the city. These respirators will prevent inhalation of mold spores and particulate air pollution (a bandanna or dust mask will not) and can be purchased from a hardware store or building supply store for less than $10.
•
Wear a Tyvek protective suit, nitrile gloves and boot covers if you are working inside a previously flooded building or outside cleaning up sediment. A head-totoe protective suit can be purchased from a hardware or building supply store for about $40. Wearing protective gear keeps contaminants off your hands, clothing and footwear.
•
When you are finished working inside a flooded building, immediately discard your Tyvek suit, gloves and boot covers. These are single-use items. Do not wear them in your car or bring them home. A respirator, however, can be re-used if the interior is kept clean.
•
Wash well once you are out of the contaminated area and have access to clean water.
•
Avoid eating or smoking in contaminated areas.
•
Drink bottled water. Tap water in most of the city is contaminated and unsafe to drink. Boiling water only removes bacteria, but not other contaminants such as metals and toxics. To avoid dehydration, bring plenty of bottled water.
•
Keep non-contaminated areas clean. If you remove contaminated items from your house but want to keep them, seal them in a plastic bag and do not mix them with non-contaminated items. Avoid tracking dirt or dust into your car or back to other clean areas.
•
If your home was flooded, get rid of porous materials that may be contaminated with mold. Mold levels are extremely high in flooded homes and mold will continue www.nrdc.org/health/effects/katrinadata/contents.asp
Natural Resources Defense Council
February 2006
to grow in these materials. Take out carpets and other porous flooring material and remove drywall down to the studs -- simply cleaning mold off the surface of walls will not solve the problem. •
Throw away moldy wood, soft plastic or cloth, or anything made from these materials that came into contact with the floodwater. These porous items cannot be safely cleaned. Hard items, such as metal, hard plastic or ceramic, can be cleaned with soap and water, or with a diluted bleach solution (one part bleach to ten parts water).
•
Thoroughly air out your home. It is very important to get your home as dry as possible to keep more mold from growing, especially once you have cleared out affected belongings and removed any flooring and drywall that came in contact with floodwaters. It may also be helpful to run a dehumidifier to help reduce moisture in the air.
www.nrdc.org/health/effects/katrinadata/contents.asp