Indian J Med Res 132, October 2010, pp 390-394
Comparison of HPLC & spectrophotometric methods for estimation of antiretroviral drug content in pharmaceutical products A.K. Hemanth Kumar, V. Sudha, Soumya Swaminathan & Geetha Ramachandran
Tuberculosis Research Centre (ICMR), Chennai, India
Received July 17, 2009 Background & objectives: Simple and reliable methods to estimate drugs in pharmaceutical products are needed. In most cases, antiretroviral drug estimations are performed using a HPLC method, requiring expensive equipment and trained technicians. A relatively simple and accurate method to estimate antiretroviral drugs in pharmaceutical preparations is by spectrophotometric method, which is cheap and simple to use as compared to HPLC. We undertook this study to standardise methods for estimation of nevirapine (NVP), lamivudine (3TC) and stavudine (d4T) in single tablets/capsules by HPLC and spectrophotometry and to compare the content of these drugs determined by both these methods. Methods: Twenty tablets/capsules of NVP, 3TC and d4T each were analysed for their drug content by HPLC and spectrophotometric methods. Suitably diluted drug solutions were run on HPLC fitted with a C18 column using UV detection at ambient temperature. The absorbance of the diluted drug solutions were read in a spectrophotometer at 300, 285 and 270 nm for NVP, 3TC and d4T respectively. Pure powders of the drugs were used to prepare calibration standards of known drug concentrations, which was set up with each assay. Results: The inter-day variation (%) of standards for NVP, 3TC and d4T ranged from 2.5 to 6.7, 2.1 to 7.7 and 6.2 to 7.7, respectively by HPLC. The corresponding values by spectrophotometric method were 2.7 to 4.7, 4.2 to 7.2 and 3.8 to 6.0. The per cent variation between the HPLC and spectrophotometric methods ranged from 0.45 to 4.49 per cent, 0 to 4.98 per cent and 0.35 to 8.73 per cent for NVP, 3TC and d4T, respectively. Conclusions: The contents of NVP, 3TC and d4T in the tablets estimated by HPLC and spectrophotometric methods were similar, and the variation in the amount of these drugs estimated by HPLC and spectrophotometric methods was below 10 per cent. This suggests that the spectrophotometric method is as accurate as the HPLC method for estimation of NVP, 3TC and d4T in tablet/capsule. Hence laboratories that do not have HPLC equipment can also undertake these drug estimations using spectrophotometer. Key words Lamivudine - nevirapine - stavudine - tablet assay
retroviral therapy (HAART), and has significantly increased access to treatment in resource-limited regions1. Several reports about the integrity of
Production of antiretroviral medications by generic manufacturers since 2000 has dramatically reduced the price of combination highly active anti390
HEMANTH KUMAR et al: ESTIMATION OF ANTIRETROVIRAL DRUGS IN TABLETS
generic antiretrovirals have been quite satisfactory2-4. Although the growth in antiretroviral availability is encouraging, it must be accompanied by independent quality-control studies to check for adherence of amount of active ingredient in the tablet/capsule to the stated content. The most common method used for analysis of antiretroviral drugs is by HPLC. However, many laboratories in resource-constrained settings may not afford to have HPLC equipment, which also requires skilled personnel to operate it. An alternative is to carry out drug estimations by spectrophotometry which is relatively cheap and simple. There are a few reports describing estimation of certain antiretroviral drugs by HPLC, HPTLC and spectrometry5-8. But none of these studies have compared the drug content obtained by the different methods. We carried out this study to standardize methods for estimation of nevirapine (NVP), lamivudine (3TC) and stavudine (d4T) in single tablets/capsules by HPLC and spectrophotometry and to compare the content of these drugs determined by both these methods. Material & Methods Chemicals: Pure powders of NVP, 3TC and d4T were kind gifts from Cipla Limited, India. Acetonitrile (HPLC grade) from Merck, India and potassium dihydrogen orthophosphate (Analytical grade) from Qualigens, India were used in this study. Drugs: Twenty tablets/capsules of NVP (Nevirex 200, Aurobindo Pharma Limited, India), 3TC (Lamivox 150, Aurobindo Pharma Limited, India), d4T (Stavir 30, Cipla, India) each were analysed for their drug content by HPLC and spectrophotometric methods. The tablet/capsule contents were crushed into a fine powder and suitably diluted in methanol to yield a concentration of 1.0 mg/ml for each drug. Further dilutions were made using milli-Q water to obtain a final concentration of 25 µg/ml. The stock solution (1 mg/ml) of each drug was prepared by dissolving the pure powder in methanol and these solutions were stored at -20oC. All experiments were performed at Tuberculosis Research Centre, Chennai. Calibration curves containing known concentrations of each drug were prepared fresh individually and set up on each day by making suitable dilutions in water from the stock solution. The concentration curve was constructed for each
391
drug using a set of calibration standards (12.5, 25 and 50 µg/ml for NVP and 3TC and 6.25, 12.5 and 25 µg/ ml for d4T) that were prepared in water and run along with the unknown solutions with each run by HPLC and spectrophotometric methods. HPLC method: The HPLC system (Shimadzu Corporation, Kyoto, Japan) consisted of two pumps (LC-10ATvp), diode array detector (SPD-M10Avp) and auto sampler (SIL-HTA) with built-in system controller. ClassVP-LC workstation was used for data collection and acquisition. The analytical column was a C18, 150 x 4.6mm ID, 5µ particle size (Lichrospher 100 RP-18e, Merck, Germany) protected by a compatible guard column. For NVP tablet assay, the mobile phase consisted of 15mM phosphate buffer pH 7.5 and acetonitrile (80:20 v/v) with the UV detector set at 260 nm. Nevirapine got eluted at a retention time of about 6.7 min. For 3TC and d4T, the mobile phase was a mixture of 10 mM phosphate buffer, pH 6.9 and acetonitrile in the ratio of 96:04 v/v, and UV detector set at 260nm. The retention times of 3TC and d4T were 3 and 3.9 min respectively. The chromatogram was run for 10 min at a flow rate of 1.0 ml/min at ambient temperature. The active ingredient in each tablet/capsule was calculated from the height of the peak that was obtained on the chromatogram and compared with that obtained for the corresponding standard solutions of known drug concentration. Appropriate dilution factors were employed to calculate the drug content. Spectrophotometric method: The absorbance of the unknown drug solutions were read using one cm cell in a UV-Vis spectrophotometer (Cary 50 Bio, Varian, Netherlands). The instrument was set at 300, 285 and 270 nm for NVP, 3TC and d4T respectively. The drug content in the unknown solutions was calculated based on the absorbance values of known standard solutions. Prior to undertaking the drug assays, calibration standards of NVP, 3TC and d4T were run on six consecutive days by HPLC and spectrophotometric methods. The inter-day variability for each drug concentration was calculated. The linearity of the calibration standards was verified using estimates of correlation coefficient (r). Recovery experiments: Varying concentrations of NVP (50 & 100 mg), 3TC (25 & 50 mg) and d4T (10 &
392
INDIAN J MED RES, OCTOBER 2010
20 mg) were added to pre-analysed tablet solutions, and the drug amounts were determined by HPLC and spectrophotometric methods. Recovery experiments were carried out on three different occasions in duplicate.
Statistical analysis: Analysis of data was performed using SPSS (version 14.0) package (SPSS Inc., Chicago, IL, USA). Paired t-test was used to examine the level of significance in differences in drug content between the HPLC and spectrophotometric methods. Results
(B)
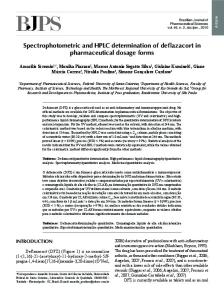
Simple methods to estimate NVP, 3TC and d4T in tablets/capsules were standardized by HPLC and spectrophotometer. In HPLC, the drugs were well separated and gave discrete peaks as shown in the representative chromatograms of NVP (Fig. A), 3TC (Fig. B) and d4T (Fig. C). The calibration curve of NVP, 3TC and d4T from six individual experiments for standard concentrations ranging from 12.5 to 50 µg/ml for NVP and 3TC and 6.25 to 25 µg/ml for d4T showed a linear relationship between peak height and concentration in the case of HPLC and absorbance and concentration in the case of spectrophotometric method. The linearity and reproducibility of the various standards used for constructing the calibration curves for NVP, 3TC and d4T are given in Table I. The inter-day variation (%) for NVP, 3TC and d4T ranged from 2.5 to 6.7, 2.1 to 7.7 and 6.2 to 7.7 respectively by HPLC. The corresponding values by spectrophotometric method were 2.7 to 4.7, 4.2 to 7.2 and 3.8 to 6.0. The mean per cent recoveries of NVP by HPLC and spectrophotometric methods were 100.1 and 99.7 per cent respectively. The corresponding values for 3TC were 101.1 and 100.9 per cent and for d4T were 102.6 and 99.1 per cent respectively (Table II).
(C)
The mean NVP content obtained by HPLC and spectrophotometric methods were 208.9 and 208.1 mg respectively. The per cent variation between these methods ranged from 0.45 to 4.49 per cent. Likewise, the mean 3TC and d4T contents were 151.2 and 151.9 and 28.6 and 28.6 mg by HPLC and spectrophotometric methods respectively. The per cent variation between these methods ranged from 0 to 4.98 per cent for 3TC and 0.35 to 8.73 per cent for d4T. The differences in the amount of NVP, 3TC and d4T content in tablets estimated by HPLC and spectrophotometric methods were not statistically significant (Table III).
(A)
Discussion Fig. Chromatograms of NVP (A), 3TC (B) and d4T (C) in tablets. The labelled peak seen in each chromatogram represents the corresponding drug.
A vast majority of HIV-infected patients in the developing world receive a NVP-based HAART,
HEMANTH KUMAR et al: ESTIMATION OF ANTIRETROVIRAL DRUGS IN TABLETS
393
Table I. Linearity and reproducibility of NVP, 3TC and d4T standards Drug concentration (µg/ml)
NVP HPLC
3 TC
6.25
-
Spectrophotometer** -
12.5
25684 + 652 (2.5) 53699 + 3585 (6.7) 119487 + 6204 (5.2) 0.9985 + 0.001
0.196 + 0.009 (4.2) 0.415 + 0.019 (4.5) 0.862 + 0.023 (2.7) 0.9995 + 0.0004
25.0 50.0 Correlation coefficient γ
*
d4T
HPLC -
Spectrophotometer** -
28356 + 2195 (7.7) 56545 + 1580 (2.8) 117370 + 2503 (2.1) 0.9998 + 0.0004
0.262 + 0.019 (7.2) 0.532 + 0.034 (6.4) 1.156 + 0.048 (4.2) 0.9988 + 0.002
*
HPLC
19282 + 1491 (7.7) 40521 + 2524 (6.2) 84259 + 6200 (7.4) -
Spectrophotometer** 0.295 + 0.018 (6.0) 0.568 + 0.024 (4.2) 1.105 + 0.042 (3.8) -
0.9997 + 0.0004
0.9990 + 0.001
*
The values are mean + SD of six experiments. Per cent variation is given in parentheses * Peak height; **absorbance Table II. Recovery studies of NVP, 3TC and d4T in tablets Drug
NVP
Stated content (mg) 200
3TC
150
d4T
30
*
Added amount (mg) 50 100 25 50 10 20
% Recovery* HPLC
Spectrophotometry
98.6 101.6 102.9 99.3 102.3 102.8
99.6 99.7 101.0 100.7 99.0 99.2
Values are mean of six observations
the common co-drugs being 3TC and d4T. Although several reports are available describing the integrity of generic antiretroviral drugs, there have also been reports of generic medications including antiretroviral agents, which contain little or no active ingredients9,10. Hence systematic quality control analysis of antiretroviral drugs is required for a successful AIDS control programme.
We standardized methods for estimation of NVP, 3TC and d4T in tablet/capsule by HPLC and spectrophotometric method and compared the drug content by both the methods. The linearity of the calibration standards of NVP, 3TC and d4T run by HPLC and spectrophotometric methods was good, as shown by a correlation coefficient (γ) value of >0.99. The overall recovery of the three drugs by both the methods ranged from 98.6 to 102.8 per cent. Hence the methods are free from interference due to excipients and other chemicals present in the tablets. The variation in the amount of all the three drugs estimated by HPLC and spectrophotometric methods was below 10 per cent, and the differences in the drug amount estimated by both the methods were not significant. This suggests that the spectrophotometric method was as accurate as was HPLC method for estimation of NVP, 3TC and d4T in tablet/capsule. Hence laboratories that do not have HPLC equipment can also undertake these drug estimations using spectrophotometer.
Table III. NVP, 3TC and d4T content in tablets (mg) NVP HPLC Mean ± SD (n=20) % Variation Mean difference SE
Spectrophotometer 208.1 ± 8.0 (190.7 - 223.5)
208.9 ± 10.2 (197.1 - 229.6) 2.5 (0.45 - 4.49) 0.81 1.32
3 TC HPLC 151.2 ± 9.4 (130.6 - 170.2)
Spectrophotometer 151.9 ± 8.3 (136.1 - 169.7)
D4T HPLC 28.6 ± 1.5 (25.3 - 30.7)
1.4 (0 - 4.98) 0.62 0.69
Range is given in parentheses; SD, Standard deviation; SE, Standard mean error Differences in drug amount estimated by HPLC and spectrophotometric methods were not statistically significant
Spectrophotometer 28.6 ± 1.4 (25.6 - 30.6)
3.1 (0.35 - 8.73) 0.05 1.19
394
INDIAN J MED RES, OCTOBER 2010
Acknowledgment The authors acknowledge to Dr V. Kumaraswami, Directorin-Charge, Tuberculosis Research Centre, Chennai, India for his encouragement and support. The technical assistance rendered by Ms. P. Vennila and statistical assistance by Ms. M. Vasantha are gratefully acknowledged.
References 1.
Kumarasamy N, Flanigan TP, Mahajan AP, Carpenter CCJ, Mayer KH, Solomon S. Monitoring HIV treatment in the developing world. Lancet Infect Dis 2002; 2 : 656-7.
2.
Penzak SR, Acosta EP, Turner M, Tavel JA, Masur H. Analysis of generic nevirapine products in developing countries. JAMA 2003; 289 : 2648-9.
3.
Ramachandran G, Perloff ES, von Moltke LL, Swaminathan S, Wanke CA, Greenblatt DJ. Analysis of generic antiretroviral formulations manufactured in India. AIDS 2004; 18 : 1482-4.
4.
Penzak SR, Acosta EP, Turner M, Tavel JA, Masur H. Antiretroviral drug content in products from developing countries. Clin Infect Dis 2004; 38 : 1317-9.
5.
Anbazhagan S, Indumathy N, Shanmugapandian P, Sridhar SK. Simultaneous quantification of stavudine, lamivudine and nevirapine by UV spectroscopy, reverse phase HPLC and HPTLC in tablets. J Pharm Biomed Anal 2005; 39 : 801-4. 6. Schuman M, Schneider S, Omes C, Wennig R, Fundira L, Tayari JC, et al. HPLC analysis of generic antiretroviral drugs purchased in Rwanda. Bull Soc Sci Med Grand Duche Luxemb 2005; 3 : 317-25. 7. Kapoor N, Khandavilli S, Panchagnula R. Simultaneous determination of lamivudine and stavudine in antiretroviral fixed dose combinations by first derivative spectrophotometry and high performance liquid chromatography. J Pharm Biomed Anal 2006; 41 : 761-5. 8. Sarkar M, Khandavilli S, Panchagnula R. Development and validation of RP-HPLC and ultra violet spectrophotometric methods of analysis for the quantitative estimation of antiretroviral drugs in pharmaceutical dosage forms. J Chromatogr B Analyt Technol Biomed Life Sci 2006; 830 : 349-54. 9. Apoola A, Sriskandabalan PS, Wade AAH. Self medication with zidovudine that was not. Lancet 2001; 357 : 1370. 10. Newton PN, White NJ, Rozendaal JA, Green MD. Murder by fake drugs. BMJ 2002; 324 : 800-1.
Reprint requests: Dr Geetha Ramachandran, Scientist ‘C’, Department of Clinical Biochemistry & Pharmacology, Tuberculosis Research Centre (ICMR), Mayor V.R. Ramanathan Road, Chetput, Chennai 600 031, India e-mail:
[email protected]