Chapter 6 -- SEDIMENT TRANSPORT AND MODEL RESULTS
129
Chapter 6 SEDIMENT TRANSPORT AND MODEL RESULTS 6.1 Introduction The influence of tides on sedimentation on beaches, estuaries, bays and on the continental shelf has been established in numerous studies. The greater is the tidal range, stronger is the currents and the clearer the signature of the tide on sediments. Macro-tidal regions (tidal range > 4 m) most clearly demonstrate the influence of the tides on sedimentation processes in the form of sediment dispersal patterns. The pattern of sediment dispersal results from the association of high tidal range with the variation in geometry of the basin, its geographic location, climate and the source and amount of sediments contributed to it. The differences in the sedimentation pattern in the basin, in turn, influence the sedimentation processes. Hydrodynamic action is the most important mechanism involved in sediment transport. It advects the suspended sediments, provides the force needed to erode the bed and, through turbulence, plays a major role in the flocculation of cohesive sediments. Relatively large velocities generally occur in tidal estuaries. Because the hydrodynamic processes involved in sediment transport are mainly non-linear, the sediments are very mobile in these estuaries. They are eroded and transported upwards during flood, deposits during slack water, erodes again and transport downwards during ebb and redeposit during the next slack water, to restart their movement in the forthcoming tidal cycle.
130
6.2 Sediment transport towards Gulf of Kachchh In this study, remote sensing techniques have been used to gather coastal morphological
details
and
to
collect
evidence
to
determine
sediment
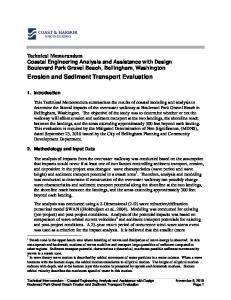
transportation from source (Indus river) to the Gulf of Kachchh. The sediments brought near the mouth of the Gulf are pushed in and out by hydrodynamic forces. The implications of their forces are then correlated with results obtained by the 3D Hydrodynamic model ‘COSMOS’ for studying sediment transport within and around the Gulf of Kachchh. To understand sediment transport within the Gulf of Kachchh, it is necessary to consider a larger area than just the Gulf as shown in Figure 6.1. The larger area is covered between latitude 210 to 240 N and Longitude between 670 to 710 E. Located about 100 km north west of the gulf is the mouth of the river Indus, one of the major rivers of the world. It is 3200 km in length, discharges an annual suspended load of 435 million tons and has a delta about 8500 km2 in area which is protruding the shelf. This makes the Indus river about the sixth largest river in the world in terms of suspended load discharge. The river is also the source of the thick accumulation of sediments in the Arabian Sea called the Indus Cone.
Figure 6.1 Inferred sediment transport direction (after Nair et al., 1982)
131
6.2.1 Determination of sediment transport direction Within the study area, the GoK is an east-west–oriented indentation, and hence alongshore wave currents will not be dominating sediment transport within the Gulf. Whereas, the northern part of the Gulf, from the Gulf to Indus river mouth and southern part of the Gulf are facing open ocean and are hence subjected to alongshore currents. The Indus River is a natural source of sediment input to the alongshore currents. Two major approaches are adopted to study the sediment transport or shore drift direction along the coast, a) by studying various coastal landform indicators b) by studying offshore turbidity distribution pattern The importance and utilization of these approaches have been discussed in Chapter III. Here only inferences and results are discussed. a)
Coastal landform indicators For determining net shore drift direction, following coastal landform
indicators are recognized using OCM images by visual interpretation. The utilization these indicators is described in Table 6.1: Table 6.1 Drift direction indicators and thumb rules. Indicators Stream Mouth Diversions Inlet Channel Migration Shifting of the River Course Spit Growth Plan View of deltas
Thumb rules and drift direction (dd) determination In study area, several stream mouths are seen diverted southwards (Figure 6.1). Hence dd is southwards. Creeks and channels have migrated towards the southwest (Figure 6.1). Hence dd is southwards The Indus river has shifted its course a few times south-wards. Hence dd is towards south. 3 spits at the southwestern tip and one large spit at northwestern tip of the delta have formed. Hence dd is towards south The southern part of the delta in the area-exhibiting major growth. Hence dd is towards south.
Based on these evidences, it is inferred that the bulk of the Indus riverborne sediments are probably funneled by the canyon head, present in front of
132
river mouth, to the depths of the Arabian Sea, giving rise to the Indus Cone. Lesser amounts of the sediments are deposited on the coast near mouth forming an Indus delta and remaining of it, are carried along in a southeasterly direction in the vicinity of mouth of the Gulf of Kachchh. b) Turbidity distribution pattern study Shore drift causes churning and subsequent transportation of submarine sediments along with suspended sediments discharged by rivers causes turbidity in nearshore waters. These turbid water masses are distinctly seen on the OCM images as well as Sea WiFS Images. These images provide a clear synoptic view of turbid water masses that helps in understanding distribution, variation and dispersion of these flumes. A detailed description of sediment plumes and their distribution, variation and dispersion is given in Chapter III. Based on the observations, it is inferred that considerable amount of suspended sediment (turbid waters) are entering the Gulf from the northwestern side. From the south, low turbid water masses travel northwards along the southeastern coast and finally move towards the northeast and east before entering the Gulf. The sediments remain in suspension due to the presence of several islands, pinnacles and turbulent tidal currents. The diffused textural and tonal patterns of turbid water indicate that these sediments consist mostly of clay particles, which remain in suspension for a long time before finally settle as mud flats towards the head of the Gulf. Equally strong ebb tides, which may be drawing suspended sediments out of the Gulf, are not visible on the image due to time of data observation. The above observations support the earlier study (Nair et al. 1982) in which the inferred sediment transport directions in the region were marked as shown schematically in figure 6.1. Within the Gulf, the sediments are in transit under the action of the high-velocity tidal currents. The ebb-tide jet transports
133
sediments out of the Gulf and to the shelf slope (>200 m). However, as revealed from the present study, the sediment contribution from the southern side, which is clearly indicated by northward pointing sediment plumes and shoals, remained unnoticed. Also the present the study could not detect the presence of any ebb-tidal jet. The above difference can probably be explained on the basis of seasonally changing wind patterns. The coastal currents have been reported to be northward during the northeastern monsoon months (December to March), whereas reversal in direction is observed during the southwest monsoon season (June to September) (Kunte at al. 2000). Hence, for the present study, OCM data that have been collected during January 2000 is showing the sediment contributions from south as well as from north. Whereas, the earlier study (Nair et al. 1982), probably had been carried out during the SW monsoon season, has demonstrated a sediment contribution from the north alone. 6.3 - Quantitative assessment of suspended sediments An algorithm proposed by Tassan (1994) was used to study quantification and distribution, dispersion of suspended sediments using SeaWiFS data and SeaDAS algorithm. Figures 3.2 and associated color-code bar provides quantifications. All the 5 data sets selected belong to Jan-2000 and Dec-1999 year. In these images, the black portion on northeastern side represents the land portion. A violet-bluish portion on southwestern side represents a very low concentration (> 0.1 mg/liters) of suspended sediments in deep water. Light blue and green color indicates a moderate (0.1-1.0 mg/liters) concentration of sediments whereas Yellow-red color indicates turbidity maxima (2-3 mg/liter). Maximum sediment concentration is observed near the mouths of Gulf and Indus River. Moderate sediment concentration is occupying much of inner gulf and is bordered by high turbidity. Around Ranware, Lushington and Gurur shoals, high turbidity is observed. Due to high tidal effects, the sediments are suspending and
134
re-suspending at the mouth and near shoals without indicating a distinct sediment movement direction. Suspended sediment distribution maps (Figure 3.2 a-f), derived after processing Sea WiFS data using SeaDAS software when correlated with residual current velocity map derived using 3D ‘COSMOS’ hydrodynamic modal, it was noticed that high velocity residual currents present at the mouth of the Gulf are represented by turbidity maxima whereas, low velocity residual currents are representing low turbidity regions on suspended sediment distribution map. Highest turbidity is observed at the mouth of the Indus River, around shoals and in the mouth region of the gulf. Low turbid regions are located within the centralsouthern region of the Gulf. The majority of residual currents are concentrated towards the mouth of the Gulf. This concentration is represented by high turbidity near the mouth.
Along elongated ENE-WSW trending depression,
turbidity is low. In figure 3.2 a, as remote sensing data is not captured in northern portion of the gulf, the same portion is marked by black color. 6.4 Sediment dynamics within the Gulf of Kachchh Strong tidal currents as indicated by flood currents shown in model results, push the sediments, which are brought near the mouth of the Gulf, inside (Figure 5.4). The shoals at the entrance to the gulf probably split the flood currents into 2 branches, one proceeding along the northern part and the other joining southern part. Equally strong the ebb current (Figure 5.3) transport the sediments out of the gulf and deposit them on the slope by-passing the outer shelf. The flood and ebb tidal currents form eddy type structures around islands. The main characteristic of the Gulf of Kachchh is its high tidal variation. M2 tidal current entering from the mouth amplifies 2.3 times before reaching the head of the Gulf due to a combination of quarter-wavelength resonance and geometric shape of Gulf.
135
Residual tidal current map (Figure 5.10, 5.11) obtained after simulating model for Dec-99, when compared with suspended sediment distribution map prepared after visually interpreting OCM image (Figure 3.5), it is observed that more suspended sediments occurred where high magnitude tidal currents are present and low to very low suspended sediments are occupying areas where tidal currents are low. Convergence and divergence areas on residual tidal current map are matching with the areas covered by sediment shoals. Whereas, eddies have generated around islands. The magnitude of residual tidal currents is less towards head of the Gulf and towards southern part of the Gulf, which have very less suspended sediments, and is covered by corals. Tidal currents and sediment distribution When the bottom sediment distribution map of the Gulf of Kachchh (Figure 1.2) is compared with FCC –2 and 3 images (Figure 3.5a,b), it is found that sediment distribution boundaries roughly match that of the same defined by colors and shades. Sandy clays from the northeast are co-relatable with the buff colored suspended sediments. Again, shallow waters surrounding islands represent sandy clays of the south central portion. Pink and light pink regions covered by submerged shoals match well with silty sands on the map. The sediment distribution covering the central and eastern portion of the Gulf is difficult to correlate as the same portion is occupied by deep waters (blue) on the images. When the surface sediment distribution map of the Gulf of Kachchh (Figure 1.2) is compared with Residual current velocity distribution map (Figure 5.10,11) for Dec-99, it is found that sediment distribution boundaries roughly match with those boundaries defined by current velocity distribution. The rocky area in central scar region of gulf matches well with high magnitude residual currents with areas of convergence, divergence and eddies. Whereas, low
136
magnitude residual currents are correlating well with clayey or silty part of gulf as these current allow light, fine grained particles to settle. Similarly when the Residual current velocity distribution map (Figure 5.10,11) for Dec-99 matched well with the map showing gross geomorphic subdivisions of Gulf of Kachchh (Figure 1.3). Particularly rough areas collaborate well with the high magnitude residual currents with areas of convergence, divergence and eddy. Even areas are comparable with areas having low magnitude residual currents and uneven areas are matching with moderate magnitude residual currents. Extensive occurrences of rocks are in the rough area of gulf, whereas, sediments are largely confined to the margins of the gulf. Apparently the high tidal ranges in the Gulf generate powerful currents that are not conducive to sediment deposition. A elongated ENE-WSW trending depression with very steep slope and very rough to rugged surface extending from the entrance to the Ranwara shoals is prominent. Since depression approximately follows the axis of the Gulf, this may be a deep tidal scour channel. The uneven and rough surface may owe their origin primarily to tectonic instability later accentuated by abrasion and erosion due to high velocity tidal currents that not only act as strong abrasive agents but also create the nondepositional environment. When a residual current pattern at the surface level having natural bathymetry is compared with pattern that form with 30 m fixed depth (Figure 5.13), it was noted that magnitude of the current reduces from 50 cm to 20 cm, however, areas of high magnitudes almost remains same. In case of fixed depth, areas with high magnitude spreads more as compare to other and eddy pattern diminishes in flat bottom or fix depth condition. From this modeling, it is inferred that tidal turbulence in the gulf is generated due to uneven bottom topography with pinnacles, steep slopes, and valleys. --------------------
-----------------------
137
-------------------
Chapter 7 - Summary and Conclusions
138
Chapter 7 SUMMARY AND CONCLUSIONS
The coast is a complex, dynamic large-scale system with an integrated arrangement of separate component systems, which vary in morphological form, pattern and configuration. It is a complex, decomposable, large-scale system that cannot be fully comprehended with conventional time-limited studies. The best way to gain insight into the structure, organization and functioning of coastal system is through the use of numerical models and satellite data. A fully 3D finite difference baroclinic hydrodynamic model is applied to study tidal variation, ocean currents, residual tidal current, sea surface temperature
distribution
etc.
within
the
Gulf
of
Kachchh.
The
hydrodynamic model is based on the hydrostatic and Boussinesq approximations and uses a vertical double sigma co-ordinate with a steplike grid. In addition to the momentum and continuity equations, the model solves two-transport equations for salinity and temperature and an equation of state to include the baroclinic effects. The other objectives of the present study were to quantitatively assess suspended sediments in the study area by digitally analyzing SeaWiFS data using SEADAS software and detect and monitor movements of dispersed suspended sediment pattern within the study area by image processing of ocean color monitor data and establish relationship between residual tidal current with erosion, movement and deposition of sediments. The study is conducted in the Gulf of Kachchh (GoK) which is 170 km long and 75 km wide (at the mouth), lies
139
approximately between latitudes 220 to 230 N and between longitudes 69000’E to 70045’ E. It is a 7300 km2 east west oriented indentation in the coastline of India at the western extremity. The GoK presents a complex setup of a macro-tidal region and currents are purely induced by tides with complete reversal over a tidal cycle. After studying various other algorithms and theories, an algorithm proposed by Tassan (1994) is used to study distribution, dispersion and quantification of suspended sediments using Sea WiFS data and Seadas software system. Ocean Color Monitor (OCM) Image data collected onboard IRS, is interpreted visually for understanding suspended sediment movements and for qualitative assessment. Considering model simulation requirements and availability of data, two separate (initial) input cards for two months November–99 and December –99 were prepared and used. The main input parameters were SST, Salinity, river input, meteorological parameters and five components of tide. Five boundaries were considered in this model like, land-ocean (coastal, island) boundary, air-sea (surface) boundary, sea bottom friction boundary, discharge from river boundary and the Gulf-open ocean (open) boundary. Programs constituting the COSMOS hydrodynamic model were executed along with initial input cards to simulate the hydrodynamic model using an Alpher mini-computer system at CEReS, separately twice for two different months, November and December of year 1999. While modeling, the water column is divided into five layers and at each layer the distribution of current velocity and direction, pressure water temperature, salinity and turbulent energy were computed. The model has been validated by comparing the simulated model results like temperature, salinity, tides, currents etc. with the diagnostic (monitoring) points with the measured data available for those locations.
140
As can be viewed from a literature survey, in this Gulf region, several surveys have been conducted along the coast and in Gulf waters and some point (station) data have been collected. Many studies have been carried out to understand the physical, chemical and biological and geological processes, however, only few numerical model analyses have been attempted to synthesize the information and understand the role of each process. Earlier one or two-dimensional models were used to study the Gulf. However, this 3-D model provided predictive capability and subsurface information. The model results showed that the dominant current system (tides and residual) is controlled by tide variation. The tidal and residual tidal currents simulated by the model are similar to the results obtained by previous researchers. Surface current distribution slightly changes if wind stress is applied to the model. Possible reasons may be that the average wind velocity in November is lower and surface currents are strongly controlled by high tidal variations in the Gulf of Kachchh. The subsurface layers and bottom layer display almost similar current distribution patterns. However, current speed reduces from surface towards bottom. Residual current velocity distribution displays an anti-cyclonic eddy, which was also observed during the previous studies. Several divergence and convergence areas were located in the center of the Gulf of Kachchh that is ignored in early studies. Further in-situ investigations are needed to confirm the existence of these features. The modeling of residual current velocity, when conducted assuming uniform depth of 30 meters, it was noted that the current velocity decreased from 50 to 20 cm/s and the eddy pattern vanishes under uniform depth. Hence it is concluded that bottom topography plays an important role in determining the distribution of residual current velocity.
141
The model results of sea surface temperature obtained for four different days in the month of December showed good agreement with temperature structure and pattern obtained from NOAA/AVHRR DATA. Sea surface temperature and salinity remained almost unchanged with or without considering wind stress factor. The river discharge effect is not clearly seen in the numerical model. Sediment distribution and dispersion is clearly seen from sediment plume pattern studies on processed Sea WiFS and OCM images. Figure 3.2 and associated color-code bars provides quantifications. It is concluded from the sediment pattern study that the sediments are transported to the Gulf from the north as well as south and are seasonally dependent. The Residual current velocity distribution map for Dec-99 matched well with the map showing gross geomorphic subdivisions of the Gulf of Kachchh. Whereas, it is observed that sediment distribution boundaries roughly match with those boundaries defined by current velocity distribution. Monitoring and understanding of sediment transport is important in relation to several engineering topics like reduction of sediment supply to estuaries due to damming of rivers and consequent erosional impact on adjacent shoreline, sedimentation and erosion around the coastal structures, back filling of dredge channels, changes in nearshore morphology, and long and cross shore sediment transport rate etc. High sedimentation load in normally clear coastal waters can be a problem to corals that leads to corals and reef degradation. The eventual deposition of such sediments may also have impacts such as siltation of harbors, accumulation of sand bars to create navigational hazards, or seasonal blockage of estuaries with associated impact on estuarine environment.
142
Hence, regular monitoring of sediment dynamics considering the hydrodynamics within a basin is essential. The conventional point measurement using ships or boats is limited which may provide accurate concentration measurements but provide extremely poor spatial coverage for a particular time. More over, the costs of conducting such surveys are very high. On the other hand, ocean color sensors provide synoptic, high repeatable and are excellent tools to map and monitor sediment pattern, estimate relative changes in sediment concentration, compute advective vectors using sediments as a tracer and the retrieved information that is useful for understanding and predicting shoreline changes. The modeling of the suspended sediments is important because pollutants may exist in a particulate phase or adhere to or be adsorbed on to particles and because particulates are an important part of ecological and water quality models. Nutrients and detritus exist as particles in turbid waters, which reduces light levels. In modeling, the analyzed remotely sensed data have been used to calibrate the model as well as to validate it. However, the remotely sensed SST and winds have not been fully exploited in the calibration/validation, as the model spatial resolution was low (2 km). In general, model results provided a reasonable picture of hydrodynamical parameter distribution in the Gulf of Kachchh. In the future, several improvements are required to be made. Model results can show better agreement between the numerical model predictions; remote sensing analysis and the corresponding field measurements provided appropriate data is made available in future.
143
Conclusion The hydrodynamic model, COSMOS, has been set up, and calibrated and validated for Gulf of Kachchh using remotely sensed data and by comparing with results of 2D hydrodynamic model available in the literature.
The COSMOS model has achieved reasonable success in
predicting tidal currents variation, residual currents, sea surface temperature and salinity distribution in the high tide dominated GoK. In its present form, the model would appear to have restricted use as a predictive
tool.
Possible
improvements,
which
might
reduce
its
shortcomings, include: ¾�use of higher spatial resolution, as in practice sediment movement occurs on a smaller scale involving higher current and sediment transport gradients than the present grid cell size of 2 km. ¾�the incorporation of detailed river inputs and density driven currents ¾�the incorporation of the spatially and temporally extensive field data into the modeling process.
If there are enough spatial and temporal observations, data assimilation may be used to bring the model results nearer to reality. Such a numerical models along with well correlated sediment transport study can provide a very useful contribution to the development of the coastal region, by providing a detailed description of the hydrodynamic field – including the wave induced circulation – and a continuous test of hypotheses. A properly validated hydrodynamic model and sediment transport study of the Gulf would be of interest for coastal defense, management and economic purpose. In the near future, an attempt will be made to collect/gather highresolution special and temporal data along several depth levels exactly as required by the COSMOS model and the model will be run hourly, daily, and on a monthly basis for a couple of years. It is hoped that such an
144
exercise will produce near reality hydrodynamic data for exact predictions. Similar modeling will also be carried out at different enclosed marine water bodies such as Khambhat Gulf, Zuari-mandovi estuary and other coastal lakes to understand processes involved and water quality management. ---------------------
------------------------------
145
------------------
REFERENCES
Biswas, S.K. 1971. Note on the Geology of Kutch. The Quarterly journal of the geological mining & metallurgical society of India, 43(4), 16p. Central Electricity Authority, 1985. Investigations and studies for tidal power development in the Gulf of Kutch, Interim Rep. Ministry of Irrigation and Power, Government of India, New Deli. Chauhan, P., Nayak S., Ramesh, R., Krisnamoorthy, R., and Ramachandran, S. 1996. Remote sensing of suspended sediments along the Tamilnadu coastal waters. Photonirvachak, 24(2), 105114. Clark, G. L., Ewing. G.C. and Lorenzen, C. J., 1970. Spectral of backscattered light from the sea obtained from aircraft as a measurement of chlorophyll concentration, Science, 167, 11191121. De Silva, A.A.C. Young and Levitus S, 1994. Atlas of surface marine data 1994, Volume 1, Algorithmic and procedures, NOAA atlas NESCIS 6. US Department of Commerce Washington D.C. 1914, Evans, R. H. and Gordon, H. R., 1994. Coastal zone color scanner "system calibration": A retrospective examination. Journal of Geophysical Research, 99, 7293-7307. Fox, W.T., 1985. Modeling coastal environments. In: R.A. Davis, Jr. (Editor), Costal Sedimentary Environments. Second Edition. Springer-Verlag, New York: 665-705. Gordon H.R., and Morel a., 1983. Remote assessment of ocean color for interpretation of satellite visible Imagery, A Review, Lecture notes on coastal and estuarine studies, R.T. Barber, N.K. Mooers, M.J. Bowman and B. Zeitzschel (eds.), Springer-Verlag, New York, 114p. Hashimi, N.H., Nair, R.R., and Kidwai, R.M., 1978. Sediments of the Gulf of Kutch - A high-energy tide dominated environment. Indian Journal of Marine Sciences, 7, 1-7. Horigucci, F. Nakata, K, Nishida, H. 1998a. The development of a sizebased mathematical eco-hydrodynamical model and application to
146
Tokyo bay. Journal of Advanced Marine Science Technology Society, 4(1), 95-122. Horiguchi, F., K. Nakata, P. Lee, W. Choi, C. Kim, and T. Terasawa, 1998b. Mathematical Eco-hydrodynamical model application in Chinhae Bay, 4(1), 81-94. Hovis, W. A., Clark, D. K., Anderson, F., Austin, R. W., Wilson, W. H., Baker, E. T., Ball, D., Gordon, H. R., Mueller, J. L., El-Sayed, S. Z., Sturm, B., Wrigley, R. C. and Yentsch, C. S., 1980. Nimbus-7 coastal zone color scanner: system description and initial imagery. Science. 210, 60-63. Klemas, V., Bartlett, D., Philpot, W. D., and Rogers, R., 1974. Coastal and Estuarine studies with ERTS-1 and skylab, Remote Sensing of Environment, 3, 153-174. Kunte P.D., 1994. Sediment transport along the Goa-north Karnataka coast, Western India. Marine Geology. 118(3/4), 207-216. Kunte P.D., Wagle B.G., and Sugimori Y., 2000. Remote assessment of net shore drift along the west coast of India. In: Proceedings of the 5th Pacific Ocean Remote Sensing Conference, Published by PORSEC 2000 Secretariat, Goa, India. Kunte P.D., Wagle B.G. and Sugimori Y., 2001. Littoral transport studies along west coast of India – A review. Indian Journal of Marine Science, 30, 57-64. Kunte P.D., Wagle B.G., and Sugimori Y., 2002a. A review and reassessment of sediment transport along the Goa Coast, India. Journal of Coastal Research, 18(4), 612-621. Kunte P.D., Osawa T., and Sugimori Y., 2002b. Chlorophyll and sediment distribution study of the Gulf of Kutch using remote sensing. In: Proceedings of the 6th Pan Ocean Remote Sensing Conference, Published by PORSEC 2002 Secretariat, Bali, Indonesia. Kunte P.D., Wagle B.G., and Sugimori Y., 2003. Sediment transport and depth variation study of the Gulf of Kutch using remote sensing. International Journal of Remote Sensing, 24(11), 2253-2263. Li, Y., Huang, W., and Fang, M., 1998. An algorithm for the retrieval of suspended sediments in coastal waters of China from AVHRR data. Continental Shelf Research 18, 487-500.
147
Morel, A. and Prieur, L., 1977. Analysis of variations in ocean color. Limnology and Oceanography, 22, 709-722. Morel A., 1991. Light and marine photosynthesis: a spectral model with geo-chemical and climatological implications. Prog. Oceanogr. 26, 263-306. Nakano, S. 1936, Tide, published by Kokin Syoin (in Japanese), pp 528. Nair, R.R., Hashimi, N.H., and Rao, V.P., 1982, On the possibility of highvelocity tidal streams as dynamic barriers to longshore sediment transport: Evidence from the continental shelf off the Gulf of Kutch, India. Marine Geology, 47, 77-86. Nakata K. 1993. Ecosystem model, its formulation and estimation method for unknown rate parameter, Journal of Advanced Marine Technological Conference, 8, 99-138. Nakata K., Kishi M., Taguchi K., 1983. Eutrophication model in coastal bay estuaries.Dev. Ecol. & Envi. Quality 2:357-366. Nakata K., Horigucci F. and Yamamuro, M., 2000. Model study of lakes Shinji and Nakaumi – a coupled coastal lagoon system. Journal of Marine System 26, 145-169. Platt, T., Caverhill, C. and Sathyendranath, S., 1991. Basin-scale estimates of oceanic primary production by remote sensing: The North Atlantic. Journal of Geophysical Research 96, 15,147-15,159. Platt T., Sathyendranath S., and White G., 2000, Ocean Primary Production Software Package for Calculation of Oceanic Primary Production, Biological Oceanography, Ocean Sciences Division, Bedford Institute of Oceanography, Dartmouth, Nova Scotia, Canada 2000. Prandtl, D., 1984. Simple theory for designing tidal power scheme, Adv. Water Resources, 7, 21-27. Ruddick, K., Ovidio, F., Eynde D.V.D., and Vasilkov A., 1998. The distribution and dynamics of suspended particulate matter in Belgian coastal waters derived from AVHRR imagery. In: Proceeding of 9th Conference on Satellite Meteorology and Oceanography, 25-29 May 1998,Paris, France, Pub: American Meteorological Society, Boston, MA.
148
Ruddick, K. G., Ovidio, F., and Rijkeboer, M., 2000. Atmospheric correction of SeaWiFS imagery for turbid coastal and inland waters. Applied Optics, 39(6), 897-912. Sathyendranath, S. and Morel, A., 1983. Light emerging from the sea – interpretation and uses in remote sensing. In: Remote Sensing applications in Marine science and Technology. A.P. Cracknell (ed.), D. Reidal Publishing Company, Dordrecht, 323-357. Singh R.P., Bhoi, S., and Sahoo, A. K., 2001, Significant changes in ocean parameters after the Gujarat earthquake. Current Science, 80(11), 1376-77. Srivastava, P.S., and John, V.C., 1977. Current regime in the Gulf of Kutch. Indian Journal of Marine Sciences, 6, 39-48. Sinha, P.C., Dube, S.K., Mitra, A.K., and Murty, T.S, 2000. A tidal flow model for the Gulf of Kachchh, India, Marine Geodesy, 23, 117132. Shetye,S.R., 1999. Tides in the Gulf of Kutch, India. Continental Shelf Research, 19, 1771-1782. Taggart, B. E. and Schwartz, M. L., 1988. Net shore-drift direction determination: A systematic approach. Journal of shoreline Management, 4, 285-309. Taguchi, K., Nakata, K., and Ichikawa, T., 1999. A 3-D simulation of longterm variability in the flow field and T-S structure in the Ise-Mikawa Bay estuary. J. Adv. Mar. Sci. Tech. Soci. 5(1-2), 37-48. Tang, W and Liu, T.W. 1996. Objective interpolation of scatterometer winds, JPL publication 96-99. Tassan S., 1994. Local algorithm using SeaWiFS data for retrieval of phytoplankton pigment, suspended sediments and yellow substances in coastal waters. Applied Optics, 12, 2369-2378. Tassan, S., and Strum, B., 1986. An algorithm for the retrieval of sediment content in turbid coastal waters from CZCS data. International Journal of Remote Sensing, 7, 643-655. Unnikrishnan , A.S., Gouvia, A.D. and Vethamony P. 1999, Tidal regime in Gulf of Kutch, west coast of India by 2D model. Journal of waterway, Port, Coastal and Ocean Engineering, 276-294.
149
Varkey, M.J., Sarma, R.V.N., and Nagarajan, R., 1977, Micro-fluctuations of temperature and salinity in the Gulf of Kutch. Mahasagar, Bulletin of National Institute of Oceanography, India, 10, 67-73. Vaidyaraman, P.P, Ghosh L.K. and Gokhale, D.P., 1987. Mathematical modeling of tidal propogation in the Gulf of Kachchh, Proc. Coast and Port Engg. In Developing Countries, Nanjing Hydraullic Research Institute, China Vol II, 2165-2173. Wagle, B.G. 1979, Geomorphology of the Gulf of Kutch, Indian Journal of Marine Science, 8, 123-126. Wright, J., Colling, A., and Park, D., 2002. Waves, tides and shallow-water processes. Prepared by the Open University course team and Butterworth & Heinemann, England. 2nd Edition, 1-227. Yanagi, T. and Osada S., 1993. Tidal fronts in the Seto Inland Sea. Memoirs of the Faculty of Engineering, Ehime University, 12-4, 337-343. Zhao, C., Kunte P.D., Sugimori Y., and Hara M., 2003. Analysis of multilayer numerical hydro-dynamical model simulation in Gulf of Kutch, India and it’s comparison with satellite data”. Paper submitted to La Mer Journal. Zingde, M.D. 1999, Pollution and it’s impact on ecology of the Gulf of Kachchh. In: Proceedings of the Workshop on Integrated Coastal and Marine Area Management Plan for the Gulf of Kachchh held at Ahmadabad, 23-24 Sept. 1999, organized by Dep. of Ocean Development; Integrated Coastal and Marine Area Management Project Directorate; Chennai (India) and Space application Centre, Ahmadabad. Pub: Department of Ocean Development, New Delhi, 1999, 1-17.
--------------
---------------------
150
-------------------