Chapter 17. Shipping Contributors: Alan Simcock (Lead member) and Osman Keh Kamara (Co-Lead member) 1. Introduction For at least the past 4,000 years, shipping has been fundamental to the development of civilization. On the sea or by inland waterways, it has provided the dominant way of moving large quantities of goods, and it continues to do so over long distances. From at least as early as 2000 BCE, the spice routes through the Indian Ocean and its adjacent seas provided not merely for the first long-distance trading, but also for the transport of ideas and beliefs. From 1000 BCE to the 13th century CE, the Polynesian voyages across the Pacific completed human settlement of the globe. From the 15th century, the development of trade routes across and between the Atlantic and Pacific Oceans transformed the world. The introduction of the steamship in the early 19th century produced an increase of several orders of magnitude in the amount of world trade, and started the process of globalization. The demands of the shipping trade generated modern business methods from insurance to international finance, led to advances in mechanical and civil engineering, and created new sciences to meet the needs of navigation. The last half-century has seen developments as significant as anything before in the history of shipping. Between 1970 and 2012, seaborne carriage of oil and gas nearly doubled (98 per cent), that of general cargo quadrupled (411 per cent), and that of grain and minerals nearly quintupled (495 per cent) (UNCTAD, 2013). Conventionally, around 90 per cent of international trade by volume is said to be carried by sea (IMO, 2012), but one study suggests that the true figure in 2006 was more likely around 75 per cent in terms of tons carried and 59 per cent by value (Mandryk, 2009). Not only has the quantity of cargo increased, the average length of voyages has also increased: between 2000 and 2013 the estimated amount of international seaborne shipments measured in ton miles increased by 65 per cent from 30,648 to 50,506 billion ton miles, while the total amount of international cargo rose by only about 50 per cent (UNCTAD, 2013). This growth in the average length of voyages has been largely in the carriage of coal, grain and ores.
© 2016 United Nations
1
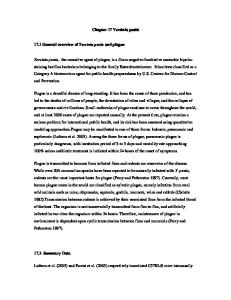
Figure 1. International Seaborne Trade: selected years 1980 – 2013. Millions of tons loaded. The “Five Major Bulks” are iron ore, grain, coal, bauxite/alumina and phosphate rock. “Other Dry Cargo” includes agricultural produce, metals, and forest products). Source: UNCTAD, 2013.
2. Nature and Magnitude of World Shipping Movements 2.1
Cargo traffic
Global shipping movements naturally mirror the world economy. The modern period up to 2008 therefore generally showed a steady increase. The economic crisis of 2008, not surprisingly, produced a drop in activity, but this was less than the drop in the world’s Gross Domestic Product, largely because of the continuing demand in eastern Asia for bulk movement of iron ore and coal (UNCTAD, 2013). Figure 1 shows the way in which world cargo movements are increasing. Figure 2 shows the distribution of total shipping movements around the world. The different main trades have substantially different distributions and patterns of sailings: the container routes are concentrated in the East/West belt around the southern part of the northern hemisphere and are very regular in their sailings, while both the five main bulk dry cargoes (iron ore, coal, grain, bauxite/alumina and phosphate rock) and the oil and gas trade are focused on the sources of these cargoes. Their sailings are also affected by changes in the market prices for these commodities. The carriage of bulk dry cargoes and oil and gas tends to have a higher proportion of return journeys in ballast. The mineral cargoes, in particular, have strong emphases on routes from Africa, South America, Australia and Indonesia to eastern Asia (Kaluza et al., 2010). Significant changes in maritime traffic routes could result from developments in extracting hydrocarbons from the earth: the growth of the shale gas industry of the United States of America, for example, is leading to major falls in United States imports, and growth of United States exports, with consequent changes in trade routes (EIA, 2014a). © 2016 United Nations
2
The boundaries and names shown and the designations used on this map do not imply official endorsement or acceptance by the United Nations.
Figure 2. Global Network of Ship Movements (data 2012). Data derived from daily Automatic Identification System (AIS) messages recorded for each 0.2º 0.2º grid square. The coloured scale shows the number of messages recorded over the year for the grid squares. Source: IMO, 2014o.
For a long time there was an imbalance in cargo movements between developed and developing countries: cargo volumes loaded in the ports of developing countries far exceeded the volumes of goods unloaded. This reflected the difference in volume of exports from developing countries (dominated by raw materials) and their imports (substantially finished goods). As Figure 3 shows, over the past four decades a steady change has occurred: loadings and unloadings in the ports of developing countries reached near parity in 2012, driven by the fast-growing import demand in developing regions, fuelled by their industrialization and rapidly rising consumer demand.
© 2016 United Nations
3
Figure 3. Cargoes loaded and unloaded in the ports of developing countries 1970 – 2012. Percentage share in tonnage of global loadings and unloadings. Source: UNCTAD, 2013.
General cargo transport has been transformed by the introduction of container shipping. Before 1957, when the first container shipment was made from Houston to New York in the United States, general cargo had to be loaded and unloaded package by package, with relatively long times needed to turn ships around, and high labour costs. The introduction of standardized containers (the Twenty-foot Equivalent Unit (TEU) and the Forty-foot Equivalent Unit (FEU)) enabled ships and ports to be constructed so that compatibility was not an issue. (Ninety per cent of current shipments are of FEU, but the TEU is widely used for statistical purposes) (Levinson, 2007). The convenience of being able to handle practically all forms of general cargo in this way is a major factor in producing the massive expansion of long-distance maritime transport. For a long time, growth in the volume of container traffic was three to four times the growth in world GDP (the average was 3.4 times over the period 1990–2005). A variety of factors now seem to be changing and some analysts suggest that the multiplier has fallen to only 1.5 times in 2012, and may continue at this level. This would imply that in future the global shipping industry would grow more slowly (UNCTAD, 2013). Table 1 shows how trade levels and the consequent distribution of container movements between parts of the world vary widely.
© 2016 United Nations
4
Table 1. Container movements on the 10 most heavily trafficked routes 2006.
Route
Number of TEU Movements ('000)
Far East to Far East
21,750
Far East to North America
13,764
Far East to North-West Europe
8,951
North America to Far East
3,950
Far East to Mediterranean
3,750
North-West Europe to Far East
3,571
Far East to the Persian Gulf and Indian Subcontinent
3,322
North-West Europe to North America
3,191
Latin America to North America
2,791
North-West Europe to North-West Europe
2,518
Source: Adapted from Mandryk, 2009.
Increases in the size of cargo vessels, and consequent efficiency gains, have been a major factor in enabling unit freight costs for containers, for oil and gas and for bulk traffic to be contained, thus encouraging growth in trade. It seems likely that the trend of increases in the size of vessels will continue. This trend is, however, constrained by the limitations on the size of vessels that ports can handle and by navigational choke-points. At present, three main choke-points constrain the size of vessels. These are the Panama Canal, the Suez Canal and the Straits of Malacca. The approximate maximum dimensions of vessels that can navigate these three passages are shown in Table 2. Vessels larger than these dimensions must seek alternative routes: around Cape Horn, around the Cape of Good Hope and around or through the Indonesian archipelago, respectively. These alternative routes add significantly to the costs of some of the main shipping routes, but may be offset by economies of scale in using larger vessels. Work is in progress to provide a new set of locks on the Panama Canal, which are expected to open in 2016, enabling ships within the “New Panamax” classification to pass through the canal (ACP, 2014). This is expected to result in significant changes in patterns of shipping between the Atlantic and Pacific. Proposals exist for a further canal through Nicaragua, which might (if completed) have even larger effects. Work has already started on expanding the Suez Canal. Subject to such changes and the emergence of alternative routes, the scope for efficiency savings from increasing the size of ships, and thus for containing costs, is likely to diminish, as the limits at the choke-points restrict further growth in the size of vessels.
© 2016 United Nations
5
Table 2. Choke-points in international shipping: maximum sizes of vessels.
Classification Length
Malaccamax
Beam
Draft
Air-draft (overhead clearance above water)
333-400 59 25 Unlimited 2 metres metres metres
Approximate Approximate dead-weight Twenty-foot tonnage 1 Unit (TEU) container capacity 300,000
15,000 – 18,000
Panamax
294.13 32.31 12.04 metres metres metres
57.91 metres
65,000 – 85,000
5,000
New Panamax
366 49 15.2 metres metres metres
57.91 metres
120,000
13,000
68 metres
120,000 – 200,000
14,500
Suezmax
Unlimited
50 20.1 metres metres
Largest current crude-oil tankers
415 65 35 metres metres metres
320,000 – 500,000
Largest current container ships
400 59 16 metres metres metres
184,600
19,100
Source: STH 2014.
The other source of potential increases in the deployment of larger vessels is the effects of climate change. As a result of the warming of the Arctic, it is becoming possible (at least in summer) to navigate between the Pacific and the Atlantic through both the North-West Passage (through the Canadian Arctic archipelago) and the Northern Sea Route (NSR - along the Arctic coast of the Russian Federation). These possibilities are currently only open to ice-class vessels. The extent to which larger vessels can be deployed depends on the routes that are feasible: Arctic shipping routes, especially the NSR, are subject to significant draft and beam restrictions (Humpert et al., 2012). Increases in the frequency and severity of northern hemisphere blizzards and Arctic cyclones may also limit the use these routes (Wassman, 2011). The Nordic Orion (75,600 dead-weight tons (dwt)) became the first commercial vessel to pass through the North-West Passage in October 2013 (G&M, 2014). The NSR has been used for Russian internal traffic since the 1930s. Some international transit traffic took place (with the aid of icebreakers) in the early 1
Dead-weight tonnage (DWT) is a measure of how much weight a ship can safely carry. It is the aggregate of the weights of cargo, fuel, fresh water, ballast water, provisions, passengers, and crew. 2 There are now proposals for a bridge across the Malacca Strait, which would introduce a limit.
© 2016 United Nations
6
1990s and the number of ships using the transit passage rose from four in 2010 to 71 in 2013 (Liu, 2010 and Economist, 2014). The route between Shanghai and Rotterdam via the NSR is approximately 4,600 km (about 40 per cent) shorter than the route via the Suez Canal, and would take 18–20 days compared to 28–30 days via the Suez Canal (Verny and Grigentin, 2009). Some estimates suggest that, in the longer term, up to 20 per cent - 25 per cent of global shipping movements could be affected by possible Arctic routes, which could offer up to 35 per cent savings in movement time and, hence, costs (Laulajainen, 2009). Others are more pessimistic, but can see some possibilities (Liu et al., 2010). The International Maritime Organization (IMO) has developed a new International Code for Ships Operating in Polar Waters (the Polar Code), covering both Arctic and Antarctic waters. The Code has been made mandatory under the International Convention on the Safety of Life at Sea (SOLAS) and the International Convention for the Prevention of Pollution from Ships (MARPOL) through the adoption of relevant amendments to those Conventions, respectively in November 2014 and May 2015. The expected date of entry into force for the Code is 1 January 2017. Nevertheless, the requirements in the Code will need support through infrastructure such as improved charts and emergency response plans and waste-reception and other facilities capable of dealing with activities on a much larger scale than at present exists (COMNAP 2005, TRB 2012). As well as the global, long-haul traffic, sea transport also carries much freight on shorter routes. Comparable statistics on this are difficult to find. Within Europe, a study for the European Commission in 1999 showed that 43 per cent of the total freight ton-miles within Europe (including both international and national traffic) were carried on short-sea journeys – an amount about the same as the ton-miles of road haulage. This high proportion was due to the fact that the average movement length by sea was much greater: the average sea movement was nearly 14 times that of the average road movement. Efforts are being made to increase the amount of freight carried on short-sea movements, in order to reduce both the pressure on roads and air pollution emissions (EC, 1999). Similar motives underlie the “America’s Marine Highway Program”, under which the United States is investing to increase the amount of short-sea freight movements along the Atlantic and Pacific coasts and from the Gulf of Mexico to the east coast (MARAD, 2014). Elsewhere, containerization is leading to rapid growth in short-sea coastal freight movements: for example, in Brazil, the volume of containers carried in coastwise traffic has grown between 1999 and 2008 from 20,000 TEU to 630,000 TEU (+3,050 per cent) (Dias, 2009). To a large extent, the scale of coastwise freight transport reflects the need to distribute more locally the large number of containers arriving in global movements in very large ships. Roll-on/roll-off ferries also play an important role in the more local movement of containers and other cargo, often combined with passenger traffic. One specialised form of maritime transport that attracts concern in some quarters is the transport of radioactive materials. A wide range of materials need to be transported, from supplies for nuclear medicine to the components in the nuclear fuel cycle. Since 1961 the International Atomic Energy Agency (IAEA) has published advisory regulations on the safe transport of radioactive material, which are © 2016 United Nations
7
generally adopted. Particular concern has been expressed about the shipment of used nuclear fuel for recycling. Since 1971, some 7,000 civil shipments of over 80,000 tons of used nuclear fuel have been reported, mostly to the reprocessing plants at Cap la Hague (France) and Sellafield (United Kingdom of Great Britain and Northern Ireland). These include 160 shipments (totalling 7,140 tons) from Japan to Europe (WNA, 2014). A 2011 survey of the transport of radioactive material in northern Europe confirmed that there had been no maritime transport accidents involving a release of radioactive materials (KIMO, 2011), and none have been reported since then (European Union, 2013). 2.2
Passenger traffic
Since the advent of large aircraft, maritime passenger traffic has effectively been confined to short-sea ferries and cruise ships. Every State with inhabited offshore islands too far offshore for the strait to be bridged has ferry services. States consisting of, or containing, archipelagos rely heavily on ferries for internal passenger transport. International passenger ferries are particularly important in the Baltic Sea, the North Sea and the Caribbean, where several States face each other across relatively short sea-crossings. Roll-on/roll-off ferries (where passenger vehicles and their passengers can make the journey together) have substantially aided the growth of short-sea passenger transport. Roll-on/roll-off ferries are also important for local freight movements, especially in Europe. Growth in passenger transport by ferries is governed mainly by improvements in the facilities and general economic growth in the countries concerned. Over the past decade, for example, the traffic on Greek passenger ferries has stagnated in the light of the Greek economic crisis, while traffic on passenger ferries in Indonesia and the Philippines has continued to grow substantially. Total ferry passengers worldwide in 2008 and its regional components are shown in Table 3. Table 3. World ferry traffic volume and distribution 2008.
Passengers Cars Buses Freight vehicles World traffic volumes (millions of journeys)
2,052
252 677
32
America and Caribbean
14.6 29.7 11.9
2.7
Baltic
10.9 33.7 38.6
24.3
Mediterranean
21.2 14.3 14.9
26.7
Percentages of world total in each region
North Sea
4.4
7.5 32.4
31.7
Pacific
1.5
0.4