Capital flows, commodity price movements and foreign exchange intervention Logan Rangasamy and Dubravko Mihaljek1
1.
Introduction
Economic growth for the African continent averaged 5.8% per annum between 2001 and 2008, significantly higher than the 2.3% average growth rate achieved during the 1990s. Key external factors that supported this improved growth performance have been strong capital inflows and rising commodity prices. Their beneficial impact on growth has been reinforced by the adoption of prudent macroeconomic policies, which promoted market-friendly initiatives after decades of heavy state intervention in many economies. Capital inflows have played an important role in financing investment and external deficits in many African countries. At the same time, higher commodity prices have helped improve external balances and growth outcomes in commodity-exporting countries. But large capital flows and volatile commodity prices have also led to greater macroeconomic volatility, real exchange rate appreciation, reduced external competitiveness and the build-up of balance sheet vulnerabilities in some countries. To inform a discussion of these issues, this note provides a broad outline of developments in capital flows and commodity price movements in Africa over the past decade. Section 2 analyses trends in capital flows before, during and after the global financial crisis, and discusses briefly some effects of these developments on African economies. Section 3 looks at commodity prices and their macroeconomic effects in Africa. Section 4 discusses some policy challenges associated with foreign exchange market intervention in the context of volatile capital flows and commodity price movements. Section 5 concludes.
2.
Capital flows
Developing countries and Africa During 2001–07, net private capital inflows to developing countries increased fivefold, peaking at around $1.1 trillion in 2007 (Table 1).2 As a ratio of GDP, net private capital inflows rose from around 4% in 2001 to just over 9% in 2007. The largest recipients at the regional level were East Asia and the Pacific, Latin America and the Caribbean, and Europe and Central Asia; together they accounted for 83% of all net private capital inflows to developing countries in 2007 (89% in 2001). There has also been a rapid increase in net private capital inflows to Africa: the inflows to sub-Saharan Africa amounted to $51 billion in 2007, four times higher than in 2001. While the share of sub-Saharan Africa in net capital inflows to developing countries remained fairly constant at around 5% during this period, the inflows increased as a share of the region’s GDP from 3% in 2001 to 7% in 2007. This compares quite favourably to most of the other developing country regions (Table 1).
1
The authors wish to thank Stephen Cecchetti, Serge Jeanneau, Philip Turner and Benedicte Vibe Christensen for comments, and Emir Emiray, Emese Kuruc and Agne Subelyte for research assistance.
2
For recent analyses of developments in capital flows to emerging market economies (EMEs), see BIS (2008) and CGFS (2009).
BIS Papers No 56
63
After the outbreak of the financial crisis, net private capital inflows to developing countries declined by 53% between 2007 and 2009. There has also been a regional redistribution of inflows: all developing regions were able to increase their shares at the expense of Europe and Central Asia. In particular, the share of sub-Saharan Africa increased to 8% of all net inflows to developing countries in 2009, from 5% in 2007, the peak year of inflows (see also Chauvin and Geis (2011); and IMF (2010a) and (2010b)). Table 1 Net private capital inflows by region As a percentage of total flows
In billions of US dollars
As a percentage of GDP
2001
2007
2008
2009
2001
2007
2009
223
1,110
716
522
100
100
100
4
9
83
286
184
186
37
24
32
5
7
8
113
53
68
4
10
13
1
8
29
413
251
58
13
40
15
3
15
5
28
23
26
2
2
5
1
3
Sub-Saharan Africa
11
51
34
36
5
5
8
3
7
Latin America and Caribbean
87
219
171
148
39
19
28
4
6
Developing countries East Asia and Pacific South Asia Europe and Central Asia Middle East and North Africa
2001
2007
Source: World Bank (2011).
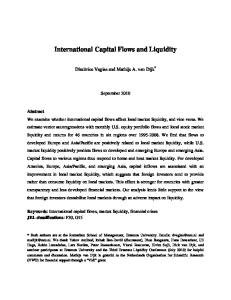
Regions within Africa For the 53 African nations for which the IMF’s World Economic Outlook data are available, net private capital inflows increased by a factor of 16 over the past decade, from $5 billion in 2001 to $79 billion in 2010 (Appendix Table A1). The largest increase in net inflows was recorded in Africa’s emerging markets (Algeria, Egypt, Morocco, South Africa and Tunisia), followed by frontier markets (Botswana, Cape Verde, Ghana, Kenya, Mauritius, Mozambique, Namibia, Nigeria, Seychelles, Tanzania, Uganda and Zambia) and financially developing countries (all the remaining ones). The emerging markets accounted for 54% of net private capital inflows to Africa in 2010 ($43 billion); the frontier markets for 20% ($16 billion); and financially developing countries for 26% ($21 billion) (Appendix Table A1). In terms of GDP, the net inflows were the highest for Africa’s frontier markets (10.3%), followed by the emerging markets (4.9%) and financially developing countries (2.9%). Graph 1 Net private capital inflows to Africa In billions of US dollars 100 FDI, net Portfolio investment, net Other investment, net
50
0
–50
–100 2001
2002
2003
2004
2005
2006
2007
2008
2009
2010
Source: Balance of payments data based on IMF and IFS.
64
BIS Papers No 56
The breakdown of private capital inflows into balance of payments components – foreign direct investment (FDI), portfolio investment and other investment – reveals some interesting cross-regional variation within Africa. Emerging markets experienced a strong increase in FDI from 2002 to 2008. However, over the past two years the crisis has led to the halving of FDI in these markets (Graph 2, left-hand panel). By contrast, portfolio inflows were surprisingly strong in 2010, exceeding FDI by some $5 billion. African emerging markets were also the largest recipients of net portfolio inflows before the crisis, especially in 2006–07. But their reversal in 2008 was pronounced. Graph 2 Net private capital inflows to Africa In billions of US dollars Emerging markets FDI Portfolio investment, net
Frontier markets 60
30
40
10
15
20
0
0
0
–10
–15
–20
–20
–30
Other investment, net
–40 01 02 03 04 05 06 07 08 09 10
Financially developing countries 20
–30 01 02 03 04 05 06 07 08 09 10
–45 01 02 03 04 05 06 07 08 09 10
Source: IMF, World Economic Outlook, October 2010.
Unlike Africa’s emerging markets, FDI inflows to the frontier markets and financially developing countries have been essentially undisturbed by the crisis (Graph 2, centre and right-hand panels). However, there have been very large net outflows of other investment in 2006 (discussed below), and – together with portfolio investment – significant outflows during the crisis in 2007–09, especially from financially developing countries. In frontier markets other investment inflows recovered in 2009 and 2010 (Graph 2, centre panel). Composition of capital inflows Private capital inflows to Africa have been dominated by foreign direct investment, which accounted for two thirds of all net inflows in 2010 (Graph 1). FDI was rising almost without interruption from 2001 until 2008, when it peaked at around $66 billion. It was remarkably resilient during the crisis, averaging around $50 billion per annum in 2009 and 2010, about 3% of Africa’s GDP. The steady growth of FDI in Africa is not surprising considering that the return on such investment is among the highest globally (UNCTAD (2008)). Much of FDI has taken place in natural resource-intensive sectors as a result of the strong rise in prices of metals, crude oil and natural gas. The major recipients have been Algeria, Egypt, Morocco, Nigeria, South Africa and Tunisia (Graph 3, left-hand panel). More recently, Africa has also strengthened its investment ties with developing countries as a result of growing South-South FDI flows. In particular, there has been a strengthening of investment relations between Asia and Africa (Graph 3, right-hand panel). Most of these investments involve Asia’s state-owned enterprises such as CNOOC (China), Petronas (Malaysia) and ONGC (India). China’s FDI stock in Africa amounted to around $8 billion in 2008, of which 40% was in South Africa (UNCTAD (2010)). In recent years, Chinese private investors have also increased their presence in many African countries (Gu (2009)). About 9% of India’s total outward FDI is destined for the African continent, with Ivory Coast, Senegal and Sudan being some of the major recipients. Intraregional FDI in Africa has also
BIS Papers No 56
65
increased over time. For example, the share of African countries in South Africa’s FDI stock increased from 5% in 2000 to 22% in 2008. According to UNCTAD (2010), there were a total of 2,250 South African projects in African countries in 2009, in areas such as infrastructure, telecommunications, energy and mining. Graph 3 Foreign direct investment in Africa FDI inflows by country, as a percentage of total Tunisia 5% Morocco 6%
Major developing country investors in Africa1
Algeria 5%
2609 2528 800 611
South Africa 14%
Rest of Africa 36%
600
400 Nigeria 16%
Egypt 18%
332
200 48
45
44
35
14
Chile
Turkey
Brazil
0 South Africa
1
China Malaysia India Chinese Korea Taipei
In millions of US dollars, 2006–08.
Sources: OECD (2010); UNCTAD (2010).
In terms of the sectoral composition of African FDI, particularly significant has been infrastructure investment, which plays an important role in expanding productive capacity, stimulating aggregate demand and improving resource allocation (McKinley (2009)). Infrastructure development has posed a serious constraint to Africa’s economic growth in the past. However, FDI by emerging Asian economies has started to stimulate infrastructure investment on the African continent in recent years. For instance, the World Bank estimates the total value of various multi-year infrastructure related financing agreements signed in 2010 between China and Korea on one side, and Cameroon, Democratic Republic of Congo, Ghana and Nigeria on the other, at over $22 billion (Appendix Table A2). Despite these developments, the narrowing of Africa’s infrastructure gap, especially in power and transport, is estimated to require investments of over $30 billion per annum for the foreseeable future (Foster and Briceño-Garmendia (2010)). There is little doubt that both public and foreign investment are vital to address the infrastructure constraints in many African countries. One should note in this regard that foreign infrastructure investment does not crowd out domestic private investment if it is accompanied by capital inflows. Nor should it stretch domestic resources too far and put pressure on domestic prices – in the case of China’s infrastructure investment in Africa, for instance, there is usually a large import content of material, services and labour, so any inflationary impact of such investment would tend to be small. Net portfolio capital inflows were also rising before the crisis, especially to Africa’s emerging markets (Graphs 1 and 2). In the past three years, however, portfolio flows on the continent became very volatile. In 2008, when the crisis struck, some $30 billion in portfolio capital flowed out of Africa. There were also small net outflows in 2009. But in 2010 portfolio capital flows recovered strongly, with some $25 billion returning to the continent (Graph 1). The returning inflows benefited almost entirely Africa’s emerging markets (Graph 2, left-hand panel). A more detailed breakdown for a subset of these flows – into dedicated funds for individual African countries and developing country funds for which country or regional decomposition is available – shows that South Africa has been by far the largest destination for portfolio capital in Africa (Graph 4, upper left-hand panel). Portfolio capital flows to South Africa were quite volatile already before the crisis in 2008. They rebounded very quickly in 2009 and 2010, reaching historical peaks in the second half of 2010. However, in the first quarter of
66
BIS Papers No 56
2011 there were net outflows from South Africa’s equity funds, though flows into its bond funds remained relatively large. For other African emerging markets, the pattern of portfolio flows was very similar to that of South Africa; one can notice especially the strong reflows into equity and bond funds in 2010, and the subsequent abrupt stop of inflows in the first quarter of 2011 (Graph 4, upper righthand panel). The same pattern was repeated – albeit with more volatility – for Africa’s frontier markets (lower left-hand panel) and financially developing countries (lower right-hand panel). Notice in particular the large outflows from the bond funds in these markets after the collapse of Lehman Brothers in the fourth quarter of 2008. Portfolio flows to financially developing countries were characterised by a much higher proportion of inflows to bond funds than in other regions and South Africa, where the equity inflows dominated. In 2011, after a strong start in January, virtually all African markets experienced net outflows from equity and bond funds in February and March. Graph 4 Net portfolio capital flows into African equity and bond funds1 In millions of US dollars Other African emerging markets2
South Africa Bond funds Equity funds
2,000
500
1,500
375
1,000
250
500
125
0
0
–500
–125
–1,000 2004
2005
2006
2007
2008
2009
2010
–250 2004
Frontier markets3
2005
2006
2007
2008
2009
2010
Financially developing markets4 375
75
250
50
125
25
0
0
–125
–25
–250
–50
–375 2004
2005
2006
2007
2008
2009
2010
–75 2004
2005
2006
2007
2008
2009
2010
1
Quarterly sums of weekly data up to 30 March 2011. Data cover net portfolio flows (adjusted for exchange rate changes) to dedicated funds for individual African countries and to developing country funds for which country or at least regional decomposition is available. 2 Algeria (bond funds only), Egypt, Morocco and Tunisia. 3 Botswana, Ghana, Kenya, Mauritius, Namibia, Nigeria, Tanzania (equity funds only), Uganda (equity funds only) and Zambia. 4 Bond funds: Democratic Republic of Congo, Gabon, Ivory Coast and Libya; equity funds: Ivory Coast, Malawi, Swaziland and Zimbabwe. Source: EPFR.
Country decomposition based on the balance of payments data indicates that, in addition to South Africa, which received net portfolio inflows of $4.6 billion per year on average, Nigeria accounted for the bulk of portfolio inflows during 2000–09 ($0.7 billion per year; Appendix Table A3). More recently, some of the other countries, including Ghana, Kenya, Tanzania, Uganda and Zambia, started receiving small amounts of portfolio inflows. But
BIS Papers No 56
67
several countries, in particular Egypt, experienced net outflows of portfolio capital during 2000–09. Other investment flows, which mostly comprise cross-border bank lending to African countries and deposits placed by African countries in foreign banks, were negative but fairly stable from 2001 to 2005 (Graph 1). In 2006, the outflows jumped to almost $75 billion (Graph 2), due to large placements of deposits by some oil-exporting countries (in particular Nigeria) in overseas banks. Since 2008, the pattern of these flows has reversed. As the crisis began and foreign investors withdrew from Africa and other emerging markets, many African countries withdrew their deposits from overseas banks to compensate for the loss of liquidity in local markets. This resulted in net inflows of other investment of about $10 billion per year. To obtain better insight into trends in other investment flows, it is useful to look at the BIS locational banking statistics, which provide detailed information on external positions (claims and liabilities) of BIS reporting banks (mostly large international banks from advanced economies) vis-à-vis banks and the non-bank sector in Africa.3 Claims of BIS reporting banks (which consist mainly of cross-border loans to African countries) vis-à-vis all sectors in Africa doubled between 2001 and 2010, with total amounts outstanding of close to $160 billion in the third quarter of 2010 (Table 2). The increase in cross-border lending was particularly pronounced for Africa’s frontier markets. Table 2 External positions of BIS reporting banks Amounts outstanding, in millions of US dollars 2001
2007
2009
Q3 2010
Vis-à-vis all sectors Emerging markets Frontier markets Financially developing economies
76,058 39,669 7,370 29,019
144,310 76,201 31,306 36,803
153,302 72,334 35,876 45,092
156,948 73,732 35,472 47,744
Vis-à-vis banks Emerging markets Frontier markets Financially developing economies
20,237 16,137 1,799 2,301
47,987 33,280 10,513 4,194
54,387 35,528 11,151 7,708
56,830 36,336 11,309 9,185
Vis-à-vis non-banks Emerging markets Frontier markets Financially developing economies
55,821 23,532 5,571 26,718
96,323 42,921 20,793 32,609
98,915 36,806 24,725 37,384
100,118 37,396 24,163 38,559
Liabilities to Africa Vis-à-vis all sectors Emerging markets Frontier markets Financially developing economies
108,945 52,466 21,862 34,617
358,019 136,494 90,089 131,436
278,595 93,570 67,002 118,023
285,618 92,279 69,327 124,012
Claims on Africa
Source: BIS locational banking statistics.
3
68
For an analysis of the determinants of cross-border bank lending to the emerging markets using these data, see Herrmann and Mihaljek (2010).
BIS Papers No 56
Most of the increase in cross-border lending to Africa took place up to 2007. Since the start of the crisis, there has been a decrease in lending to Africa’s emerging markets; a moderate increase (around 13%) in lending to frontier markets; and a strong rebound (30%) in lending to financially developing countries (Table 2). About two thirds of cross-border loans in the third quarter of 2010 were vis-à-vis the nonbank sector in Africa ($100 billion), and about one-third vis-à-vis African banks ($57 billion). One should note that the non-bank sector includes private non-financial and financial corporations as well as the public sector, including central banks. Relative to GDP, frontier markets had the largest share of total loans outstanding (30% of combined GDP of these markets, of which 20% to the non-bank sector). Unlike other developing regions of the world, African countries held in aggregate more deposits in the BIS reporting banks than they received loans from them. In the third quarter of 2010, for instance, total liabilities of BIS reporting banks vis-à-vis all sectors in Africa amounted to $286 billion, ie $130 billion more than their assets vis-à-vis all sectors in Africa (Table 2). This imbalance reflects the underdevelopment of Africa’s financial systems in general and its banking systems in particular. More specifically, it implies that a large part of revenues from exports of African oil and commodities is not intermediated by local banks. Rather, it lies more or less idle – from the African perspective – in overseas banks, which recycle about 60% of these deposits as cross-border loans back to African banks and the non-bank sector. Finally, it is worth noting that official capital flows – bilateral aid to African countries and lending by international financial institutions – became much less significant in the past 10 years compared to the previous decades. As shown in Graph 5, African countries were essentially repaying foreign official loans up to 2008. Particularly large repayments were made in 2006. Since the start of the crisis there has been some return of official capital flows to the continent, but the amounts involved ($6–8 billion per year) are small compared to private capital inflows. During 2004–08, African central banks also accumulated relatively large foreign currency reserves, on average around $25 billion per year (Graph 5). In 2009, the reserves fell as central banks in several countries provided foreign currency liquidity to the local markets to compensate for the retreat of foreign private capital. Last year, the reserves were partly rebuilt. Graph 5 Official flows and change in reserves in sub-Saharan Africa In billions of US dollars 40 Official flows, net Change in reserves, net 20
0
–20
–40 01
02
03
04
05
06
07
08
09
10
Source: IMF, World Economic Outlook, October 2010.
BIS Papers No 56
69
Some consequences of capital inflows The effects of capital flows depend to a large extent on the structural characteristics of the recipient economy. Several features of African economies are worth noting in this respect. First, the level of financial market development strongly influences the composition and size of capital inflows and their impact on the domestic economy and financial systems. Developed and highly liquid financial markets help reduce the risks posed by volatile capital inflows. This has been the experience, for instance, of South Africa, which is receiving the bulk of portfolio inflows to Africa. The impact of volatile capital flows on financial markets and the real economy has been attenuated by South Africa’s flexible exchange rate and very efficient financial intermediation. Most other African countries have considerably less developed financial markets, so it is not surprising that capital inflows come to them mainly via foreign direct investment. FDI inflows, in turn, affect the recipient economy directly, through investment and increases in output, rather than indirectly through the financial system. Second, the degree of flexibility of product and labour markets has a large bearing on the macroeconomic impact of capital inflows. For instance, large capital inflows could result in asset price and wage pressures and sub-optimal output outcomes in the presence of rigidities such as insufficient supply of urban land for development or labour shortages due to restrictive labour legislation. Finally, exchange rate, monetary and fiscal policies also condition the macroeconomic effects of capital inflows. Maintaining an exchange rate target requires the central bank to intervene in the foreign exchange market in order to neutralise the effects of capital inflows or outflows on the exchange rate. Sterilising the impact of FX interventions has consequences for the balance sheets of domestic financial institutions and the central bank, which in turn affects the economy via credit growth. On the other hand, maintaining an inflation target and letting the exchange rate float freely weakens the link between capital inflows and domestic prices, but affects resource allocation by changing the relative price of tradables and non-tradables. Similarly, a procyclical fiscal policy exacerbates the expansionary effects of capital flows or the contractionary effects of outflows, while a countercyclical fiscal policy attenuates these effects. How do these considerations relate to the economic circumstances of Africa over the past decade? Regarding output effects of the composition of capital inflows, African countries have benefited from the fact that the bulk of inflows has been in the form of foreign direct investment. FDI has made a key contribution to the financing of fixed capital formation in Africa: between 2006 and 2008, FDI on average accounted for 32% of gross fixed capital formation, with much higher shares recorded in Angola (165%), Democratic Republic of Congo (60%), Guinea (95%) and Nigeria (100%). One should note that FDI statistics include mergers and acquisitions of firms already in existence, so increases in FDI may not necessarily imply higher productive capacity. However, most of the FDI in Africa has involved greenfield investments and hence increased productive capacity along with technology transfers and improved business processes. During the period of surge in capital inflows from 2003 to 2007, the investment rate in sub-Saharan Africa increased from 17% to 21% of GDP on average. Although this rate is much lower than the average for developing countries (28% of GDP), and the increase of 4 percentage points over a four-year period is relatively modest, sub-Saharan Africa experienced the largest increase in potential output among developing country regions over this period (Table 3). About 80% of the increase was due to capital deepening and the remaining 20% to labour and total factor productivity growth. Similarly, in the Middle East and North Africa, two thirds of the increase in potential output was attributable to capital deepening.
70
BIS Papers No 56
Table 3 Change in potential output growth In percentage points Change due to capital deepening
Change in potential output growth1 Developing countries
1.5
0.6
Middle-income countries
1.5
0.6
Low-income countries
1.3
0.8
East Asia and Pacific (excl China)
0.4
–0.1
China
0.3
0.9
South Asia
1.4
1.1
Europe and Central Asia
0.8
0.6
Latin America and Caribbean
0.3
0.1
Middle East and North Africa
0.8
0.5
Sub-Saharan Africa
1.9
1.5
1
Change in the growth rate of potential output, 2003–2007 versus 1995–2003. Source: World Bank (2010).
FDI has taken place not only in the real sector of African economies but also in their financial sectors. Of note is that foreign banks account for almost 50% of financial intermediation in sub-Saharan Africa, measured by the share of foreign-owned banks in total banking system assets (Table 4). This share is the second highest among developing country regions (following Europe and Central Asia), and is considerably higher than 50% in many countries, given that the foreign bank presence in South Africa (which is financially the most developed country in the region) is relatively low. Reflecting the increased presence of foreign financial institutions, domestic bank credit to the private sector in sub-Saharan Africa expanded by almost 7% of GDP, and in the Middle East and North Africa by over 6% of GDP, between 2000 and 2007 (Table 4). This was higher than the average for other developing country regions. One should note, however, that the growth of private sector credit in Sub-Saharan Africa was underpinned by the strong expansion in South Africa (12% of GDP), where foreign-owned banks play a limited role. Table 4 Foreign banks and domestic financial intermediation Share of assets owned by foreign banks (%)
Private credit by banks, in % of GDP1 2000
2007
Developing countries
29.3
34.8
East Asia and Pacific
66.1
Europe and Central Asia
Change
2001
2005
5.5
…
…
55.4
–10.7
13.0
11.1
16.8
32.5
15.6
42.0
54.4
Latin America and Caribbean
24.9
27.1
2.2
30.4
35.6
Middle East and North Africa
33.0
39.2
6.2
8.3
10.9
South Asia
25.6
40.4
14.8
8.9
7.4
Sub-Saharan Africa
34.8
41.6
6.8
46.2
49.5
1
Simple average. Source: World Bank (2010), pp 56–7.
BIS Papers No 56
71
Another consequence of the greater presence of foreign financial institutions has been that cross-border bank flows increased considerably, both to the region’s banks and to the nonbank sector (Table 2). The empirical literature has generally established a strong positive relationship between financial intermediation and growth (see eg Levine and Zervos (1998)). It has also been shown that the development of financial markets can facilitate efficiency gains in production (Nourzad (2002)) and poverty reduction (Beck et al (2007)). The recent African experience would seem to confirm these findings, especially the important role played by foreign investment in local financial institutions and domestic financial intermediation. Exchange rate pressures associated with inflows of “hot” money have generally not been a major risk factor for African countries. One exception is South Africa, which has experienced significant currency appreciation as a result of “hot” money inflows. The appreciation of the rand has adversely affected the South African manufacturing sector, which accounts for over 15% of value added in the economy. The appreciation of the rand has also indirectly affected other currencies in southern Africa which form part of the Common Monetary Area (comprising South Africa, Lesotho, Namibia and Swaziland) and are effectively pegged to the rand, as it implies reduced international competitiveness and potentially reduced growth and employment for these countries. For countries whose currencies are not pegged to the rand, it implies better export prospects to the South African market. Similar effects apply to other African countries with currency pegs: for instance, fluctuations in the euro affect the external competitiveness of producers in the CFA member states (Benin, Burkina Faso, Cameroon, Central African Republic, Chad, Republic of Congo, Equatorial Guinea, Gabon, Guinea-Bissau, Ivory Coast, Mali, Niger, Senegal and Togo).
3.
Commodity prices
The surge in commodity prices has supported large FDI inflows to the extractive sector in many African countries. The implications of this surge for individual countries have depended, among other things, on whether they are net commodity exporters or importers. In the case of net commodity exporters, the effects of higher commodity prices have generally been expansionary. A positive terms-of-trade shock resulting from higher export commodity prices has stimulated economic growth, real income and employment. In the past, aggregate demand pressures resulting from terms-of-trade improvements have often resulted in inflationary pressures. However, the experience in the last few years has been more positive – most African countries have improved their inflation performance by not spending fully the windfall gains from commodity price booms. Greater expenditure restraint and the more consistent use of various commodity and sovereign wealth funds have contributed to these efforts. For net commodity importers, the effects of higher commodity prices have been similar to an increase in indirect taxes, ie they have reduced disposable income and domestic demand via income and substitution effects. Higher imported energy prices have also in some cases led to cost-push pressures, which have required particular attention by policymakers. Between 2002 and 2008, food prices doubled, metals prices nearly tripled, and energy prices almost quadrupled on the world commodity markets (Graph 6, left-hand panel). Since agricultural goods, minerals and crude oil make up almost 80% of African exports, the surge in commodity prices has had a significant positive impact on income and growth performance of many countries. For instance, the GDP growth rate for the group of commodity exporters in sub-Saharan Africa was on average 2¼ percentage points higher than that for the group of non-commodity exporters during 2003–08 (ie 7.6% vs 5.4%; Graph 6, right-hand panel).
72
BIS Papers No 56
Graph 6 Commodity prices and GDP growth Commodity prices (2000 = 100)
GDP growth in sub-Saharan Africa 350
Agriculture Energy Metals and minerals
9 2003–08 2009 2010
7.6
300 6.3
6.1
250
150
7 6
5.4 4.7
200
8
5 3.8
3.3
4 3
2.1 1.2
100
2 1 0
50 2000 2001 2002 2003 2004 2005 2006 2007 2008 2009 2010
Sub-Saharan Africa
Commodity exporters
Non-commodity exporters
Sources: IMF; World Bank; Bloomberg.
The downturn in global demand following the outbreak of the crisis in 2008 resulted in sharp declines in commodity prices. Between mid-2008 and early 2009, the dollar prices of energy fell by over 35% and those of metals by 30%, while agricultural commodity prices remained more or less stable (Graph 6, left-hand panel). This was reflected in a significant decline in the average GDP growth rate of commodity exporters, from 7.6% before the crisis to 3.3% in 2009. The decline in growth reflected the lack of diversification in exports of many African commodity exporters, as well as the sharp contraction in the US and EU markets, which account for two thirds of African exports. However, the steady increase in commodity prices over the past year revived growth in commodity-exporting countries, to over 6% on average in 2010 – almost double the growth rate in 2009. One should note, however, that the noncommodity exporters experienced even greater output variations. Large fluctuations in primary commodity prices relative to manufactured goods prices have led to significant shifts in the terms of trade for major commodity exporters and importers. These shifts have in turn affected trade balances and national incomes of both groups of countries. As shown in Graph 7, African countries relying on exports of primary commodities have experienced far greater trade shocks than the countries with more diversified export structures – shocks to export demand and the terms of trade for commodity exporters ranged from +9% of GDP in 2008 to –11% in 2009.4 By contrast, countries exporting manufactured goods and those with diversified export structures have experienced considerably milder variations in trade. The terms-of-trade shifts have also had very large effects on government revenue. As shown in Appendix Table A4, government revenue in commodity- and oil-exporting countries fluctuated from 31–36% of GDP in 2007–08 to 24% in 2009. Other African exporters have experienced considerably less variation in government revenue during the crisis period. While temporary fiscal – as well as external – deficits do not create major vulnerabilities, lasting imbalances require a tightening of fiscal policy, which has implications for growth performance. As noted above, many African countries also use commodity stabilisation funds to offset the adverse long-term effects of volatility in commodity prices.
4
Trade shocks in this calculation comprise shocks to export demand and the terms of trade. The export demand shocks reflect changes in the volume of exports, while the terms-of-trade shocks reflect the gains or losses of income arising from the change in export prices relative to import prices.
BIS Papers No 56
73
Graph 7 Trade shocks experienced by African countries classified according to export specialisation1 15 8.9
2.1
4.5
3.5
10 5.9
6.0
4.0
2.9 2.8
1.8
0.6 -0.9
2.1 0.4 0.3 -0.1
-1.7
-3.3
-11.1 Energy
Minerals
Agriculture
Manufacturing
5 0
-0.3 -0.7 2001–07 2008 2009 2010
-5.3
Whole group
3.3 1.0
–5 –10 –15
Diversified
Economies are considered as diversified if no major export category makes up more than 40% (for manufactures, 50%) of total exports. Any concentration exceeding 40% defines the export specialisation. 1
Changes in the US dollar value of total merchandise trade (exports and imports), as a percentage of GDP.
Source: United Nations (2011).
Since the weight of food and energy in the consumption baskets of many African countries is very high, fluctuations in the prices of food and energy have a significant bearing on inflation outcomes. The commodity price shock resulted in a sharp increase in the CPI inflation from 6¾% in 2007 to 11½% in 2008 (Appendix Table A5). Exchange rate depreciation has exacerbated domestic price pressures in many countries during the crisis. How should monetary policy respond to relative price changes? Theory suggests that monetary policy should not react to relative price changes judged to be temporary – in an economy largely free of distortions, relative prices should return to the configuration prevailing before the temporary disturbance. However, if the shift in relative prices is judged to be permanent, monetary policy should facilitate adjustment that will allow the economy to move to a new equilibrium. As it is extremely difficult to ascertain in practice if the change in relative prices is temporary or permanent, policymakers often consider the impact of relative price changes on inflation expectations as a guide in their policy decisions. As long as inflation expectations are well anchored and inflation remains in line with the medium-term target, central banks do not react to relative price changes. In practice, this means that one of the main challenges for monetary policy confronted with commodity price increases is to prevent second-round effects of higher commodity prices, ie their spillover to inflation expectations and wages. As discussed in Christensen (2011), the extent to which this is possible depends crucially on the availability of reliable indicators of inflation expectations and the effectiveness of the monetary policy transmission mechanism.
74
BIS Papers No 56
4.
Foreign exchange intervention
Monetary policy in EMEs has paid increasing attention to the pursuit of exchange rate stability and, hence, foreign exchange market intervention in recent years. One rationale for this shift is the finding that floating exchange rate regimes often display higher real exchange rate volatility than fixed rate regimes (the so-called “Mussa puzzle”).5 Another concerns the developments during the global financial crisis, but also features of the current conjuncture, including the exchange rate impact of volatile capital flows, low global interest rates and spillovers from changes in risk aversion in global financial markets. Central banks have been concerned about the impact of heightened exchange rate volatility on macroeconomic and financial stability, as well as on external competitiveness and resource allocation. As a result, many central banks are finding greater merit in stabilising exchange rates than in the past. Like in many other EMEs, exchange rate policies in Africa have tended to be asymmetric in that they generally “lean against the wind” by attempting to prevent currency appreciation but not currency depreciation (IMF (2008)). Thus, over 2001–08 nominal effective exchange rates in sub-Saharan Africa depreciated by 25% on average relative to their level in 2000, and in 2009–10 by a further 10% (Graph 8, left-hand panel). The weakening was entirely due to the floating currencies – before the crisis they depreciated by almost 40% on average relative to the 2000 level, and in 2009–10 by another 15%. By contrast, the sub-Saharan African currencies with fixed exchange rates strengthened by 6% in nominal effective terms before the crisis, and by another 2% after the crisis. Graph 8 Exchange rates and reserves accumulation NEER1
REER1 140
2001–08 2009–10
120
FX reserves (months of imports) 8
140
2001–08 2009–10
120
100
100
80
80
60
60
40
40
20
20
2003 2009 2010
6
4
0 Sub-Saharan Africa
Floating ER regimes
Fixed ER regimes
0 Sub-Saharan Africa
Floating ER regimes
Fixed ER regimes
2
0 Sub-Saharan Floating Africa ER regimes
Fixed ER regimes
1
Trade-weighted indices; 2000 = 100. Simple average of monthly indices for 15 countries in sub-Saharan Africa with floating and fixed exchange rate regimes. Sources: IMF, International Financial Statistics; IMF, World Economic Outlook, October 2010.
The pickup in inflation following the commodity price shock of 2008 has resulted in real appreciation of about 25% on average in countries with floating exchange rates, and 7% in countries with fixed exchange rates (Graph 8, centre panel). A key question is whether this appreciation reflects an improvement in the terms of trade. If this is the case, it could mean that equilibrium exchange rates have adjusted to more elevated levels.
5
See Filardo et al (2011) for a discussion of the policy dilemmas related to foreign exchange market intervention in EMEs; and Mihaljek (2005) for a review of the effectiveness of intervention in EMEs.
BIS Papers No 56
75
Although high real exchange rate volatility can have significant adverse effects on trade and investment flows, monetary policy has not been particularly successful in influencing real exchange rate movements over the medium term. In fact, evidence suggests that fiscal policy may be more effective in addressing issues of external competitiveness in Africa (Elbadawi et al (2007)). There is also evidence that targeting the exchange rate could lead to higher volatility of interest rates and output, and much higher inflation outcomes (Calvo et al (1995)). In addition, the pursuit of exchange rate smoothing as a secondary objective could confuse the public about the primary objective of monetary policy, and hence affect the credibility of the central bank. In summary, monetary policy in African developing countries is confronted with some difficult trade-offs in the face of capital inflows. Theory suggests that raising interest rates is appropriate if the upward pressure on the currency occurs at a time when the output gap is positive and inflationary pressures are strong. However, monetary tightening could attract additional capital inflows and fuel the growth of domestic asset prices. Sterilised interventions could assist in addressing disruptive exchange rate movements in such circumstances, and help build up foreign exchange reserves to cushion the effects of a sudden reversal of capital inflows. However, there are considerable risks and costs associated with prolonged foreign exchange market intervention, including sterilisation costs, valuation losses and domestic credit expansion if the sterilisation is incomplete or ineffective. On the other hand, while unsterilised intervention could alleviate exchange rate appreciation pressures, the increase in domestic money supply resulting from the expansion of banking system balance sheets could lead to higher inflation outcomes. In this case, countercyclical fiscal policy could assist monetary policy in dampening domestic demand pressures. However, this raises political economy and coordination issues that are difficult to deal with even in advanced economies with well functioning institutions, and all the more so in poorer developing countries with weaker institutions.
5.
Conclusion
Capital inflows and volatile commodity price movements pose significant policy challenges for developing countries. These challenges are of particular relevance to policymakers in Africa, where large capital inflows and rising commodity prices in recent years have strongly affected macroeconomic quantities (fixed investment, trade balances, domestic credit growth, government revenue, GDP growth) as well as prices (CPI inflation, terms of trade, exchange rates). How to respond to these developments is an important issue at the current juncture, given the uncertainty about the future course of commodity prices and global capital flows. While the impact of real exchange rate volatility on macroeconomic and financial stability is an important policy consideration in the African context, it remains unclear whether and how far central banks should incorporate exchange rate stability considerations into their monetary policy frameworks.
76
BIS Papers No 56
Appendix
Table A1 Net private capital inflows Amounts outstanding, in billions of US dollars 2001
2007
2009
2010
4.9
43.8
57.9
79.1
Emerging markets
0.0
35.5
33.2
42.8
Frontier markets
1.3
0.3
17.9
15.6
Financially developing countries
3.7
7.9
6.8
20.7
23.3
60.2
51.6
52.3
13.9
24.4
20.6
14.9
Frontier markets
3.4
12.4
11.6
11.3
Financially developing countries
6.0
23.5
19.4
26.1
Portfolio investment
–8.9
9.7
–2.3
18.7
Emerging markets
–7.6
14.1
1.3
22.1
Frontier markets
–0.2
–0.2
–0.4
0.0
Financially developing countries
–1.1
–4.1
–3.3
–3.4
Other investments
–9.5
–26.2
8.7
8.1
Emerging markets
–6.3
–2.9
11.3
5.8
Frontier markets
–1.9
–11.8
6.6
4.3
Financially developing economies
–1.2
–11.4
–9.3
–2.0
Total private capital inflows, net
Foreign direct investment Emerging markets
Totals include 53 African countries for which the IMF’s World Economic Outlook data are available. For the country composition of the subgroups (emerging markets, frontier markets and financially developing countries), see Section 2 of this paper. Source: IMF, World Economic Outlook, October 2010.
Table A2 Selected infrastructure-related financing agreements between Asian and African countries signed in 2010 Country of origin China Korea China China China
Beneficiary country Ghana Ghana Democratic Republic of Congo Cameroon Nigeria
Value (USD billions) 13.4 1.5 6.0 0.7 0.9
Source: World Bank (2011), based on national data and Thomson Reuters.
BIS Papers No 56
77
Table A3 Net portfolio capital inflows Annual average for 2000–09, in million of US dollars South Africa Nigeria Uganda Mauritius Namibia Togo Botswana Swaziland Tanzania Ivory Coast Kenya
4,567.4 707.0 45.4 13.6 9.9 8.0 7.2 4.2 2.9 2.8 1.6
Mali Cape Verde Zambia Niger Sierra Leone Benin Mozambique Burkina Faso Tunisia Cameroon Senegal Egypt
1.6 0.9 0.7 0.7 0.6 0.4 0.1 –0.1 –0.9 –3.0 –13.2 –209.4
Source: World Bank
Table A4 Government revenue in sub-Saharan Africa1 2004–08
2007
2008
2009
26
26
28
23
Commodity exporters
32
31
34
24
Oil exporters
34
31
36
24
Other exporters
23
23
24
23
Sub-Saharan Africa
1
Excluding grants, as a percentage of GDP.
Source: IMF.
78
BIS Papers No 56
Table A5 Consumer price inflation Algeria Angola Benin Botswana Burkina Faso Burundi Cameroon Cape Verde Central African Republic Chad Comoros DR Congo Djibouti Egypt Equatorial Guinea Eritrea Ethiopia Gabon Ghana Guinea Guinea-Bissau Ivory Coast Kenya Lesotho Liberia Libya Madagascar Malawi Mali Mauritania Mauritius Morocco Mozambique Namibia Niger Nigeria Republic of Congo Rwanda São Tomé and Príncipe Senegal Seychelles Sierra Leone South Africa Sudan Swaziland Tanzania The Gambia Togo Tunisia Uganda Zambia Zimbabwe Average
2000–06
2007
2008
2009
2010
2.3 109.2 3.2 8.5 2.5 9.6 2.5 1.1 3.0 3.8 4.2 140.6 2.2 4.6 6.1 18.1 5.2 0.7 19.6 15.7 2.4 2.6 7.9 6.8 8.5 –2.6 10.8 17.8 1.9 7.7 5.5 1.7 12.0 6.9 2.3 13.4 2.4 6.7 13.2 1.5 2.6 5.9 5.1 7.6 6.8 4.7 7.5 2.5 2.9 4.8 19.5
3.6 12.2 1.3 7.1 –0.2 8.3 1.1 4.4 0.9 –7.4 4.5 16.7 5.0 11.0 2.8 9.3 15.8 5.0 10.7 22.9 4.6 1.9 4.3 8.0 13.7 6.2 10.4 8.0 1.5 7.3 8.6 2.0 8.2 6.7 0.1 5.4 2.6 9.1 18.5 5.9 5.3 11.7 7.1 8.0 9.7 6.3 5.4 0.9 3.4 6.8 10.7
4.9 12.5 8.0 12.6 10.7 24.4 5.3 6.8 9.3 8.3 4.8 18.0 12.0 11.7 4.3 19.9 25.3 5.3 16.5 18.4 10.4 6.3 16.2 10.7 17.5 10.4 9.2 8.8 9.1 7.3 9.7 3.9 10.3 10.4 10.5 11.6 6.0 15.4 26.1 5.8 37.0 14.8 11.5 14.3 13.1 8.4 4.5 8.7 4.9 7.3 12.4
11.0
6.7
11.6
5.7 13.7 2.2 8.1 2.6 10.7 3.0 1.0 3.5 10.1 4.8 46.2 1.7 16.2 7.2 33.0 36.4 1.9 19.3 4.7 –1.6 1.0 9.3 7.2 7.4 2.8 9.0 8.7 2.2 2.2 2.5 1.0 3.3 8.8 1.1 12.5 4.3 10.3 17.0 –1.7 31.9 9.2 7.1 11.3 7.5 11.8 4.6 1.9 3.5 14.2 13.4 6.5 8.9
4.3 14.5 2.1 7.0 0.4 6.4 1.3 2.1 1.5 1.0 2.7 23.5 4.0 11.7 7.5 12.7 2.8 0.6 10.7 15.5 1.1 1.4 3.9 3.8 7.3 2.4 9.0 6.9 1.2 6.1 2.9 1.0 12.7 4.5 0.9 13.7 5.0 2.3 14.4 1.2 –2.4 17.8 4.3 13.0 4.5 10.5 5.0 3.2 4.4 9.4 8.5 3.0 6.1
Source: IMF, World Economic Outlook, April 2011.
BIS Papers No 56
79
References Bank for International Settlements (2008): “Financial globalisation and emerging market capital flows”, BIS Papers, no 44, December. www.bis.org/publ/bppdf/bispap44.htm. Beck, T, A Demirguc-Kunt and M S Martinez-Peria (2007): “Reaching out: access to and use of banking services across countries”, Journal of Financial Economics, vol 85 no 1. Calvo, G, C Reinhart and C Vegh (1995): “Targeting the real exchange rate: theory and evidence”, Journal of Development Economics, vol 47. Chauvin, S and A Geis (2011): Who has been affected, how and why? The spillover of the global financial crisis to sub-Saharan Africa, ECB Occasional Paper no 124, March. Christensen, B (2011): “Have monetary transmission mechanisms in Africa changed?”, in this volume. Committee on the Global Financial System (2009): “Capital flows and emerging market economies”, CGFS Papers, no 33, January. www.bis.org/publ/cgfs33.htm. Elbadawi, I, L Kaltani and R Soto (2007): “Real exchange rate misalignment in sub-Saharan Africa: how serious? How dangerous?”, World Bank (unpublished). Filardo, A, G Ma and D Mihaljek (2011): “Exchange rates and monetary policy frameworks in emerging market economies”, in BIS Papers, forthcoming. Foster, V and C Briceño-Garmendia (eds) (2010): Africa’s infrastructure: a time for transformation, World Bank. Gu, J (2009): “China’s private enterprises in Africa and the implications for African development”, European Journal of Development Research, Vol 21. Herrmann, S and D Mihaljek (2010): “The determinants of cross-border bank flows to emerging markets: new empirical evidence on the spread of financial crises”, BIS Working Papers, no 315, July. www.bis.org/publ/work315.htm. International Monetary Fund (2008): Regional economic outlook: sub-Saharan Africa, April. ––––– (2010a): Regional economic outlook: sub-Saharan Africa, IMF, April. ––––– (2010b): Regional economic outlook: sub-Saharan Africa, IMF, October. Levine, R and S Zervos (1998): “Stock markets, banks and economic growth”, American Economic Review, vol 88, no 3. McKinley, T (2009): “Meeting the macroeconomic challenges of LDCs”, background paper for the UNCTAD Least Developed Countries Report 2009, UNCTAD, Geneva. Mihaljek, D (2005): “Survey of central banks’ views on effects of intervention”, in BIS Papers, no 24, May. www.bis.org/publ/bppdf/bispap24.htm. Nourzad, F (2002): “Financial development and productive efficiency: a panel study of developed and developing countries”, Journal of Economics and Finance, vol 26, no 2. OECD (2010): Geographical distribution of financial flows to developing countries: disbursements, commitments, country indicators, 2005–2009, OECD. UNCTAD (2010): World investment report 2010: investing in a low-carbon economy, United Nations. ––––– (2008): World investment report, 2008: transnational corporations and the infrastructure challenge, United Nations. United Nations (2011): World economic situation and prospects, 2011, United Nations. World Bank (2010): Global economic prospects: crisis, finance, and growth, December. ––––– (2011): Global economic prospects: navigating strong currents, January.
80
BIS Papers No 56