Camscan Series II Scanning Electron Microscope Users Guide Division Analytical Facility North Mudd 108/109 Dept of Geology, Caltech Chi Ma, Manager 626-395-6126
[email protected] Version 2.0 (1999) by P. Carpenter, L. Wasylenki, C. Ma
1
About this manual This is a "users guide" to the use of the Division Analytical Facility Camscan Series II Scanning Electron Microscope. This guide is under continuing development, and does or will contain instructions for all standard SEM operations. It is understood that you have received a checkout on the instrument by Lab Manager, and that these instructions do not replace that checkout procedure. If you find the instructions to be in error or confusing, please make a note in the margin of the lab copy of the manual. Indicate what is confusing and how it should be restated. If a problem occurs where the instructions do not fully address the procedure for solving the problem, it is your obligation to indicate what the fix was for that problem. In this way the manual can be made better, since it is for your own benefit. Comments and suggestions on how to improve the manual are welcome and should be addressed to Lab Manager.
Prerequisites for use of the Camscan SEM In order to use the Camscan in an unsupervised capacity, you must have received a checkout on the instrument by Lab Manager. Checkout sessions are conducted for groups of no more than 6 persons, and are held about every 2 months. If you need more immediate access to the instrument, you should first contact someone from your research group who has been checked out on the Camscan. This person will run the instrument for you and will help you obtain your results. You agree to provide this help for others in your group in return for your checkout on the instrument. If you are unable to find someone to help you, Carpenter will set you up on the instrument (but you will still need to get a checkout). During the checkout procedure, you will be given a summary of electron microscopy and microanalysis. This summary may not address the type of problems that you will be solving on the instrument. The best source for you to educate yourself is the Goldstein text (see below). All users of the SEM are expected to have read the appropriate chapters from the Goldstein text in order to achieve an understanding of the many facets of imaging and microanalysis. A reference database for microscopy and microanalysis as applied to physical problems (i.e. materials rather than biological sample problems) is given at http://www.gps.caltech.edu/facilities/analytical/refs.html.
2
Reference List General Reviews of Geochemical Analytical Techniques These texts discuss various analytical techniques, including electron microprobe analysis. They are appropriate for the novice. AUTHOR TITLE IMPRINT COLLATION NOTE SUBJECT Geology
Potts, P. J. A handbook of silicate rock analysis / P.J. Potts. Glasgow : Blackie ; New York : Chapman and Hall, 1987. ix, 622 p. : ill. ; 29 cm. Bibliography: p. 587-610. Includes index. Rocks, Siliceous --Analysis. QE438 .P68 1987
AUTHOR TITLE EDITION IMPRINT COLLATION NOTE SUBJECT Geology
Zussman, J. Physical methods in determinative mineralogy / edited by J. Zussman. 2d ed. London ; New York : Academic Press, 1977. xiv, 720 p. : ill. ; 24 cm. Includes bibliographies and indexes. Mineralogy, Determinative --Methodology. QE367 .Z8 1977
Scanning Electron Microscopy and Microanalysis Scanning Electron Microscopy and X-ray Microanalysis (A Text for Biologists, Materials Scientists, and Geologists) is the single best reference for scanning electron microscopy and x-ray microanalysis. All users of the scanning electron microscope and electron microprobe are expected to read the pertinent chapters from this text. Your research group should purchase a copy that can be shared among users of the facility. The second edition is generally better than the first edition, but some material did not make the transition; see the first edition if you want the whole picture. Goldstein, et al., Scanning Electron Microscopy and X-ray Microanalysis (A Text for Biologists, Materials Scientists, and Geologists), 2nd ed. New York: Plenum Press, 1992. ISBN 0-306-44175-6. Geology library QH 212.S3 S29 1992 (The first edition of this book is very good too -- Geology QH212.S3 S29 1981) Chapter 2 Electron Optics Chapter 3 Electron - Specimen Interactions Chapter 4 Image Formation and Interpretation Chapter 5 X-ray Spectral Measurement: WDS and EDS Chapter 6 Qualitative X-ray Analysis Chapter 7 X-ray Peak and Background Measurements Chapter 8 Quantitative X-ray Analysis: The Basics Chapter 9 Quantitative X-ray Analysis: Theory and Practice Chapter 10 Compositional Imaging Chapter 11 Specimen Preparation for Inorganic Materials: Microstructural and Microchemical Analysis Chapter 12 Sample Preparation for Biological, Organic, Polymeric, and Hydrated Materials Chapter 13 Coating and Conductivity Techniques for SEM and Microanalysis Chapter 14 Database The workbook Scanning electron microscopy, X-ray microanalysis, and analytical electron microscopy : a laboratory workbook is a companion of sorts for the Goldstein textbook (it is used by the Lehigh short courses). It has exercises that may be used in the lab during more advanced demonstrations, and the answers are in the back of the book! TITLE IMPRINT
Scanning electron microscopy, X-ray microanalysis, and analytical electron microscopy : a laboratory workbook / Charles E. Lyman [et al.] New York : Plenum Press, c1990.
3
COLLATION NOTE SUBJECT
xi, 407 p. : ill. ; 26 cm. Includes bibliographical references and index. Scanning electron microscopes --Laboratory manuals. X-ray microanalysis --Laboratory manuals. Electron microscopy --Laboratory manuals. ALT AUTHOR Lyman, Charles E. Millikan 9 Fl QH212.S3 S335 1990
Scanning and transmission electron microscopy: an introduction is another general reference for electron microscopy. It is written with the TEM in mind and does not go into the detail that Goldstein et al does. It is appropriate for those who do not understand anything in the Goldstein text. Flegler, et al., Scanning and transmission electron microscopy: an introduction. Oxford: Oxford University Press, 1994. Geology library QH212.S3 F58 1993 AUTHOR TITLE IMPRINT COLLATION NOTE SUBJECT ALT AUTHOR Geology
Flegler, Stanley L. Scanning and transmission electron microscopy : an introduction / Stanley L. Flegler, John W. Heckman, Jr., Karen L. Klomparens. New York : W.H. Freeman, c1993. viii, 225 p. : ill. ; 27 cm. Includes bibliographical references and index. Scanning electron microscopy. Transmission electron microscopy. Heckman, John William. Klomparens, Karen L. QH212.S3 F58 1993
The Reimer text Scanning electron microscopy : physics of image formation and microanalysis discusses the physics of imaging and microanslysis, and approaches the subject in a elegant but terse manner. It is at the same or more advanced level than the Goldstein text. AUTHOR TITLE
Reimer, Ludwig, 1928Scanning electron microscopy : physics of image formation and microanalysis / Ludwig Reimer. IMPRINT Berlin ; New York : Springer-Verlag, c1985. COLLATION xviii, 457 p. : ill. ; 24 cm. SERIES Springer series in optical sciences ; v. 45. NOTE Bibliography: p. [405]-446. Includes index. SUBJECT Scanning electron microscopes. Millikan 9 Fl QH212.S3 R452 1985
Images of Materials offers examples of images collected by various techniques. TITLE
Images of materials / edited by David B. Williams, Alan R. Pelton, Ronald Gronsky ; with a foreword by Peter B. Hirsch. IMPRINT New York : Oxford University Press, 1991. COLLATION xiv, 379 p., [32] p. of plates : ill. (some col.) ; 29 cm. NOTE Includes bibliographical references and index. CONTENTS Imaging by light optical microscopy / G.F. Vander Voort -Scanning electron microscopy / D.C. Joy and J.I. Goldstein -Analytical imaging with a scanning ion microprobe / R. Levi-Setti Acoustic microscopy / G.A.D. Briggs and M. Hoppe Transmission electron microscopy / G. Thomas -Electron diffraction images / D.B. Williams and K.S. Vecchio -Atomic-resolution microscopy / R. Gronsky Surface imaging by Millikan 6 Fl TA418.7 .I44 1991
Electron Microprobe Analysis Quantitative electron-probe microanalysis is a good text on aspects of quantitative microanalysis, and goes into more detail than Goldstein et al. It covers ZAF and PRZ correction schemes. TITLE
Quantitative electron-probe microanalysis / editors, V.D. Scott
4
IMPRINT COLLATION SERIES NOTE SUBJECT ALT AUTHOR Geology
and G. Love. Chichester, West Sussex, England : E. Horwood ; New York : Halsted Press, 1983. 345 p. : ill. ; 24 cm. Ellis Horwood series in physics. Bibliography: p. [320]-336. Includes index. Electron probe microanalysis. Microchemistry. Chemistry, Analytic --Quantitative. Scott, V. D. (Victor D.), 1928QD117.E42 Q36 1983
An introduction to X-ray spectrometry : X-ray fluorescence and electron microprobe analysis is a relatively good text which discusses both instrumentation and quantitation aspects of microanalysis (and related aspects of x-ray fluorescence). AUTHOR TITLE IMPRINT COLLATION NOTE SUBJECT
Geology
Williams, K. L. An introduction to X-ray spectrometry : X-ray fluorescence and electron microprobe analysis / K.L. Williams. London ; Boston : Allen & Unwin, 1987. xiii, 370 p. : ill. ; 25 cm. Bibliography: p. 364-366. Includes index. Rocks --Analysis. Mineralogy, Determinative. X-ray spectroscopy. Fluorescence spectroscopy. Microprobe analysis. QE435 .W55 1987
Electron probe quantitation is a collection of papers that discuss the state-of-the-art of microprobe analysis. It is relatively new. It is not an introductory text. TITLE IMPRINT COLLATION NOTE SUBJECT ALT AUTHOR Geology
Electron probe quantitation / edited by K.F.J. Heinrich and Dale E. Newbury. New York : Plenum Press, c1991. viii, 400 p. : ill. ; 26 cm. "Result of a gathering of international experts in 1988 at ... National Institute of Standards and Technology"--Pref. Includes bibliographical references and index. Electron probe microanalysis --Congresses. Microchemistry --Congresses. Spectroscopy. Heinrich, Kurt F. J. Newbury, Dale E. QD 117 .E42 E44 1991
Electron Microprobe Analysis is another text which discusses the technique as an overview. There is a new edition which we do not have a copy of. AUTHOR Reed, S. J. B. TITLE Electron microprobe analysis / S. J. B. Reed. IMPRINT Cambridge [Eng] ; New York : Cambridge University Press, 1975. COLLATION xvi, 400 p. : ill. ; 23 cm. SERIES Cambridge monographs on physics. NOTE Bibliography: p. 381-395. Includes index. SUBJECT Microprobe analysis. Millikan 8 Fl QD117.E42 R43
Fundamentals of Energy Dispersive X-ray Analysis is an introduction to EDS and offers an indepth discussion of the instrument and its pros and cons. It is enlightening for the novice and should be read for those sem users who do EDS analysis. AUTHOR
Russ, John C.
5
TITLE Fundamentals of energy dispersive x-ray analysis / John C. Russ. IMPRINT London ; Boston : Butterworths, 1984. COLLATION 308 p. : ill. ; 24 cm. SERIES Butterworths monographs in materials. NOTE Bibliography: p. 295-304. Includes index. SUBJECT X-ray spectroscopy. Millikan 8 Fl QD96.X2 R87 1984
Microbeam analysis are the proceedings volumes of the annual meeting of the Microbeam Analysis Society. These volumes contain almost all research papers (as extended abstracts) concerning various aspects of electron microprobe analysis. A bibliographic database of papers from these proceedings is under construction. TITLE COVERAGE IMPRINT FREQUENCY COLLATION LIB. HAS NOTE Geology
Microbeam analysis. 14th (1979)San Francisco, Calif. : San Francisco Press, c1979Annual. v. : ill. ; 29 cm. GEOL has: 14th (1979)+ Millikan 9th floor has: 16th (1981), 17th (1982), 19th (1984)+ Proceedings of the 14thAnnual Conference of the Microbeam QH212.E4 N3 1981
X-ray fluorescence analysis in the geological sciences : advances in methodology TITLE IMPRINT COLLATION SERIES NOTE SUBJECT ALT AUTHOR Geology
X-ray fluorescence analysis in the geological sciences : advances in methodology / S.T. Ahmedali, editor ; contributors, S. Abbey [et al.] St. John's, Nfld. : Geological Association of Canada = Association geologique du Canada, 1989. xii, 297 p. : ill. ; 28 cm. Short course notes (Geological Association of Canada) ; v. 7. Includes bibliographical references. X-ray spectroscopy. Analytical geochemistry. Ahmedali, S. T. (Syed Tariq), 1941Geological Association of Canada. QD96.X2 X729 1982
Advances in x-ray analysis : proceedings of the annual Conference on Application of X-ray Analysis are the proceedings of an annual conference on x-ray analysis. These volumes contain older papers on x-ray analysis. AUTHOR TITLE COVERAGE IMPRINT FREQUENCY COLLATION LIB. HAS Geology
Conference on Application of X-ray Analysis. Advances in x-ray analysis : proceedings of the annual Conference on Application of X-ray Analysis. Vol. 1 (6th/1957)New York, London, Plenum Press, 1960Annual. v. ill. 24-28cm. GEOL has: v.1 (1957)-v.24 (1980), v.26 (1982)+ TA417.65 .C6 v.1 (1957)
6
4 10
5
3
2
1
8
7
6
9 11
Camscan Console
7
8
Diff
Panel 4
Diff
mm µm nm
Lens
W
Set Up
20
Photo
Off
SA1
SP LP
SA2
Low
Med
Magnification
Split - Scan Mode
x2 x1
x5 x3
x10
EXT
Photo Magnification
High
SEI
BEI
AEI
1 x 2
Right Screen
Panel 5
Filament Photo
CamScan
Level
INV
Image Shift
D-Focus
off
Gamma
L|R
L - Gain
Left Screen a3
a1
a2
m
2
Photo 1
R
Zoom
TV
T2
S1
S2
Scan Speed
L
1 Off
Panel 3
A 2 3 4 5
Integrated Image Storage
Input
R
E
L
1 range
5
3
Resolution
7
1
-4 10
mbar
35 10-3
Ready
L - amp
SEI
R - amp
0 1 2 3 4 5
Panel 1
Console
Yellow
Power
Brightness
Stigmator
5 = off = 5
Image
Orange
F L1 L2 L3 AUX
Emission
KV÷10
Filament
High Vacuum
-5 10
Vent
Green
Specimen Red
Contrast
mm
Panel 6
off
9
KV
30 40
20
Auto - Level
11
5
15
C1 - Fine
A
fine
off
10
INV
Panel 2
Gain
1.50 AEI
Focus
Focus
coarse
Focus
Level
X
10-12 10-11 10-10 10-9 10-8 10-7 10-6
Camscan Console Master Diagram
Stop
-2 10-1 10
Panel 7
Brightness
Contrast
BEI Control
Pirani
1 mbar
2.25
Start
Red
Vacuum Blue
[A]
SEM Startup Begins Here Initial Startup Settings and Final Shutdown Settings This section covers where the controls are and what the correct startup and shutdown settings are for the SEM. Figure 1 shows the location of the controls. Go through the following sequence and verify that each control is in its correct default position before you start your work. You will also use this section to set the controls back to the startup settings at the end of your run. You will be charged a penalty if you fail to put the controls back to their startup settings at the end of a run. If you come to use the SEM and the controls have not been put back to their startup settings, make a note in the logbook. For advanced users: Note that the appropriate action is indicated by a bullet • next to the required setting. If you have used the instrument many times, you may scan down the page to the next bullet without the need to read all the explanatory text. However, do not skip any steps.
Panel 1: The system status lights are as follows, from left to right: Specimen Vent (red): The Specimen Vent push button is used to vent the entire column including the sample chamber. This is normally done ONLY for large samples. Do not use this without supervision. NOTE: do not confuse this with the vent button on the column which is used to vent the sample exchange chamber when you put samples in! • Verify Specimen Vent is NOT pressed in and not illuminated. Specimen Ready (green): The Specimen Ready push button is illuminated when the vacuum is below 10-4 torr. We run the instrument at 10-5 torr, so this light being on is a necessary but not sufficient condition for turning on the high voltage. (The high vacuum gauge below the system status lights should be at 10-5 torr before high voltage is turned on.) If the light is not on, there is a vacuum leak or the machine was just vented and is still pumping down. Either wait a few minutes or get help. NOTE: The Specimen Ready push button is used to turn off the high voltage when you are about to do a sample exchange. The high voltage is turned on by pressing the Image push button, and it is turned off by pressing the Specimen Ready push button. • Verify that the Specimen Ready is illuminated. Image (orange): The Image push button turns on the high voltage when it is pushed in (the
9
Speciment Ready push button is pressed to turn off the high voltage). The instrument vacuum level must be lower than 10-4 torr in order for the Specimen Ready light to come on (and high voltage to be enabled), and we prefer to run the instrument at 10-5 torr. It is also necessary for the viewport cover on the column to be in place and rotated fully clockwise (this cover protects the secondary electron collector from being swamped by room light). • The Image button should not be illuminated at this time. You will turn it on prior to filament saturation. Console Power (yellow): The Console Power push button is used to supply power to the console, display screens, and stage motors. • Turn on Console Power power. Vacuum Start (blue): The Vacuum Start push button turns on the vacuum system (roughing and diffusion pumps) and attempts to reach high vacuum. This is always left on. • Verify that the Vacuum Start push button is illuminated. Vacuum Stop (red): Turns off the vacuum system for full instrument shut down. DO NOT PRESS this button! We leave the instrument under vacuum at all times. If the vacuum logic of the camscan detects a problem, the instrument will automatically "retreat" back to vacuum stop after shutting down the diffusion pump. If you observe the Vacuum Stop light on, get help immediately. • Verify that the Vacuum Stop push button is NOT illuminated. High Vacuum gauge: Measures pressure inside the column. This should be at 10-5 torr before high voltage is turned on. • Verify that the High Vacuum gauge is reading close to 10-5 torr (far left of scale). Digital readout monitor: The Digital readout monitor (between WD mm and Filament Current displays) is used to read the filament current when the selector is set to F. • Verify that the Digital readout monitor is set to F.
Panel 2: Absorbed current range selector: the absorbed current range selector is used to set the range for digital readout of the absorbed current. It is set to 10-6 range except for filament saturation and EDS analysis. • Verify that the Absorbed current range selector is set to 10-6 range (fully counterclockwise). C1 Fine condenser lens: the C1 fine condenser lens is used to set the fine adjustment of the probe current via excitation of the condenser lens system. This control is set fully counterclockwise except for EDS analysis and variable current backscattered-electron imaging. • Verify that the C1 Fine condenser lens is fully counterclockwise.
Panel 3: Integrated Image Storage: The Integrated Image Storage unit (or "frame store") is controlled on this panel and the frame store controller pad (number 11 on console perspective diagram). This
10
unit is used to average subsequent frames of the scanning image, which serves to reduce the noise and increase the signal to noise ratio of the image being viewed. • Verify that the Integrated Image Storage selector switches are set to the following: top left switch (input) set to L top right switch set to a3 • Verify that the Integrated Image Storage power switch (lower right corner) is off NOTE: The orange Photo push button on the Integrated Image Storage unit is used to dump the contents of the frame store buffer to the polaroid camera. This buffer has only 500 line resolution and will result in a grainy picture. For this reason, do not push the orange Photo button for photography, use instead the blue Photo button on panel 5.
Panel 4: Image Selector: The Image Selector has two banks which are used to select which image is viewed on the left and right viewing screens of the SEM. The instrument is normally run with the secondary electron image on the left screen (bank 1 controls), and the backscattered-electron image on the right screen (bank 2 controls). • Verify that the Image Selector bank 1 (left screen) is set to SEI (i.e. secondary electron image) with the SEI button pressed in, and no other buttons on this bank are pressed in. • Verify that the Image Selector bank 2 (right screen) is set to BEI (i.e. backscattered-electron image) with the BEI button pressed in, and no other buttons on this bank are pressed in.
Panel 5: Linewidth measurement >||
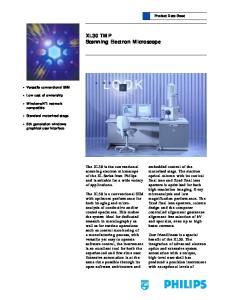
slightly above the saturation point to verify that you are at this minimum current setting for saturation. (When you have saturated properly, turning the Filament current down just a little will cause the curve to drop quickly. It is better to be slightly undersaturated than oversaturated.)
A B C D Filament Current -> Screen Image
Line Profile Image Brightness ->
A: Below False Peak
B: False Peak (Profile changes with slight increase in Filament current)
C: Below Saturation
D: Saturated (Profile immediately drops with decrease in Filament current)
Filament Saturation Diagram 10. Turn off the [•] Filament button. Return to a scanning image by pressing the Scan Speed TV-rate raster display (Panel 5, lowest button). Set the magnification to the lowest value for the current working distance by turning the magnification and zoom knobs on Panel 5 fully counterclockwise. 11. Set the Absorbed Current meter to a scale range that displays current to x.xx format. Do not allow a number higher than 9.00 to be displayed (i.e., set the scale to a higher number to reduce the displayed value). It will probably be on 10-10.
31
12. Adjust the filament centering knobs located on the front and right-hand side of the electron gun assembly on top of the column. Adjust these knobs one at a time to obtain the highest possible absorbed current on the absorbed current meter. Iterative adjustment is required. You should check this adjustment repeatedly while you do your work, every ten minutes while the machine warms up, and then every half hour or so. 13. Return to the console and check the filament saturation level again using steps 7-9. A slight dip in the filament profile may persist; do not oversaturate to overcome this. Now write in the log book the filament current value displayed next to [A] on the console. This level may need to be checked every 30-45 minutes if the filament was cold at startup.
32
Imaging, focusing, stigmation 14. If you are using 35mm working distance, check that the COARSE FOCUS control is set to 35mm and displayed in the WD mm window. Set the coarse focus to the correct working distance if using a different WD. Once set, this control is not changed; all focusing is performed with the Z-axis control. 15. The FINE FOCUS knob is a ten turn adjustment. Rotate the knob until you reach a stop, and then rotate in the opposite direction five turns. This ensures that you are at a standard working distance. 16. Use the arrow buttons on the stage controller to locate a feature that has a sharp detail (cleavage, pits, etc.). Use the magnification and zoom controls to set the magnification high enough to see this feature -typically 5000-10000x. Adjust the Z-axis control until this feature is as clearly resolved as possible. Coarse focusing is now performed with the Z-axis control for most flat samples. 17. Focus the feature by adjusting the X and Y STIGMATOR controls (iteratively) until you get the sharpest possible image. You will need to turn these knobs fairly quickly to see any effect. If adjustment of these controls does not visibly change the image, you must go to a higher magnification; conversely, if no adjustment works and the image is blurry no matter what you do, you are at too high a magnification. 18. You should now have a clear image. If there are problems, check the filament saturation, the electron gun alignment, the coarse focus (Z-axis), and finally the stigmators. NOTE: DO NOT raise the sample unless you are absolutely sure that it will not hit the secondary or backscatter detectors. Lowering the sample is OK. Verify the clearance throught the viewport at the time of sample exchange.
33
Digital Frame Store The frame storage device is used to view the average of several rastered images on the left screen in order to cut down noise and see details more clearly. The frame storage has many different capabilities, but most users just use it for seeing a low-noise image. The instructions that follow tell you how to obtain a lownoise image. If you are interested in other features of the frame storer, consult the separate frame storer manual (1" binder). 1. Turn the frame storer on by turning the (unlabeled) knob on Panel 2 clockwise one notch. An "A" will be displayedright above the knob. 2. Push the "CONT" button in the lower lefthand corner of the frame storage keyboard. You will have to push this button again occasionally if the frame storer times out while you are taking a picture, doing an analysis, etc. 3. Adjust the number of averaged frames from 1 to 10 to get the image quality you like. A higher number results in a clearer image, but when you are moving around the sample with the stage controller arrow buttons, you may want a lower number so that the image will refresh itself fast enough for you to tell where you are on the sample. If you don't understand this, play with changing the number of averaged frames a little bit to see what it's like to drive around the sample with the frame storer on. Of course, the right screen is not an averaged image, so you can always watch there while you move around.
34
Photography This section describes how to take polaroid photos of your samples. Not only do photos serve as a permanent record of the images of your samples, but in many cases you can see more detail in photos than you can on the screen because the noise level is lower and the resolution is better. ========== To take a photograph: Set the focus and stigmation at a magnification at least two times higher than the photo magnification. Set the brightness and contrast while in Photo linescan mode (Photo linescan push button pressed in) so that the signal spans the central 2/3 of the brightness range. Set the polaroid film holder to L for "load". Insert the polaroid film with the number side up (and the side that says "This side toward lens" should be facing down) -- If you put the film in upside down it will eject developer jelly all over the inside of the film holder and YOU will clean it up. Push the film in until it is fully inserted. Pull the film jacket out to expose the film inside the camera. Press and HOLD the left blue Photo button until the fast scan has finished and the shutter to the polaroid camera has opened. When the exposure has finished, the sem will return to a normal scanning image. Push the film jacket back into the polaroid film holder all the way in. Switch the polaroid handle from L to P for "print". Pull the film pack all the way out WITHOUT STOPPING. Use your fingers to help spread the developer all the way down to the corners (next to the metal strip) because the picture will not develop there unless it gets developer jelly over the full area of the print. After the required time, opent the film jacket and peel the print away from the other portion of the jacket. Remove the print and throw away the used jacket (Do not stack the used jackets on any surface in the lab). Do not do any coating of Type 52 film in the lab! ======== 1. Get a box of film ready. There is usually film sitting next to the camera which you can use, but you have to indicate how many photos you took in the log book. If you prefer, you can bring your own film (cheaper). Film can be purchased from various stockrooms on campus, including the VWR stockroom in Beckman. 2. Next you need to check the f-stop on the camera. Go around to the right side of the SEM table and stand by the camera. On the right side of the camera (as you view it) is a small silver knob that says "open" and "lock" with a silver dot next to "lock". Turn it counterclockwise to "open" (i.e. the word "open" is next to the silver dot). 3. Carefully lift the whole camera out of the hole it rests in. Try not to knock the camera against the table, and try very hard not to let dust or debris fall inside the hole. The screen that is used for photography is at the bottom of the chamber, and any dust that falls in there will land on top of the photo screen. 4. Check the f-stop setting. It should be at f-11 for Polapan 400 or f-18 (the dot between f-11 and f-22) for Type 53 film. Change it if necessary. 5. Carefully replace the camera. Turn the silver knob back to "lock" (i.e. the word "lock" is next to the silver dot). 6. Now you're ready to put film in. Using the arrows on the film as a guide, insert a piece of film into the slot on the front of the camera. Be careful to put the film in straight so that it can be pushed all the way in fairly easily. The film should go in until less than an inch remains visible.
35
7. Now pull the film back out gently until it stops. The film is now ready for you to take the picture. 8. Check that the screen selection button marked with "L" and "R" is on "L," and get the image you want to photograph framed and focused on the left screen. 9. Check that the photo scan speed selector is on "2" (slow, scan takes ~2 minutes). 10. If you want to type in a label, do so with the keyboard next to the camera. 11. Now you need to set the brightness and contrast for the camera. The camera has a different display tube from the screens, so the brightness and contrast you see on the screen may be a little different from the camera. Push the "photo" button on Panel 5 to get a linescan of the brightness and contrast the camera sees. (This is the same photo button you pushed a while ago to get a linescan of the filament during the saturation procedure.) 12. You should now have a fuzzy linescan on the right screen. Adjust the brightness and contrast knobs until the fuzzy line is just a bit to the right of the center of the two solid lines and is about 1/4" wide on the screen. 13. Now push the "L" button and hold it in for 10 seconds before letting go. The slow linescan will begin after a moment. Wait for the regular image to come back, which will take about 2 minutes. 14. When the slow scan is over, push the film all the way back into the camera again. 15. Push the lever arm on the front of the camera to "P." 16. Pull the film straight out of the camera. You may have to pull firmly at the end to get the spine of the film out. 17. Wait about a minute (or the length of time specified on the film or film box), then grasp the two tabs on the film and pull them apart to reveal the picture. The gooey chemicals inside the film are not particularly good for you, so avoid touching them if possible, and refrain from eating them. 18. If you are unhappy with the result, you can try again with different brightness and contrast settings, better focus, etc. Keep in mind, however, that the photos are not cheap!
36
Shutdown You say you've had enough? This section will tell you what to do to finish up and how to leave the instrument when you're done. 1. Slowly turn the filament current down to 0.00. 2. Turn the emission current down to 0. 3. Turn off the high voltage by pressing the green "READY" button on Panel 1. 4. Set the Link EDS detector to 10 cm (withdrawn position) if it is at the analysis position of 6 cm. 4.a. Set the magnification to 20X. 5. Move the sample stage back to the sample exchange position (Z=35.5, X=Y=000, etc.) and remove your sample using the instructions in the section on sample exchange. 6. Return all controls to their default positions as listed in Section I. 7. Turn off the console power by pressing the yellow "CONSOLE" button on Panel 1. 8. Finish filling out the log book and the charge sheet. 9. Clean up the area.
37