®
Asset Allocation Guide:
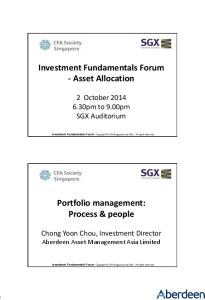
Standout Investing in 2015 Understanding the Behaviors of People and Markets to Uncover Potential Opportunities and Strategies to Avoid Pitfalls
RegentAtlantic
1200 Mount Kemble Avenue Morristown, NJ 07960 (973) 425-8420
www.regentatlantic.com
1
RegentAtlantic – What � � We� Believe �
�
�
Our core� belief is that value investing is the largest, most persistent investment opportunity. To implement a � � � � � � � � � � � � � �� � � � value strategy well, we believe that investors should be prepared to look different than the crowd, have a long � � � � � � � � � � � � � � � � � � time horizon in mind, incorporate quality metrics, and seek out as many different areas around the world where � � � � � � � � � � � � � � � � � values are attractive to stay diversified. � � � � � � � �
Value Investing – Buying Low and Selling High: � Value investing �at its simplest assets � � is buying � investment � � � on �the cheap and selling when they are expensive. If
� � for a sale, � � trying � to get a good � � �whether � � store � � or while you have ever �shopped� around deal it� was� at the� grocery � a�new car, � you � already � know� one� of � the� core principles � � � � of value � �investing.� Finding � � � a bargain � shopping for is� about� � price paid � �to� the �value � received. � � Identifying � � cheap � � investible � � � classes � can be � done � comparing the asset by� � � � price to� some � � � � measure � � of its value �� � � � � comparing an investment’s underlying as an� investment. Some commonly � � stocks � � earnings, � � � enterprise � value. �Data � going � � � to� the 1920s used measures for include sales,� book� value, and back � a value strategy � � has delivered � � superior � � � stock � market. � � � � �� has shown that returns in the � � � � � � � � � � � � � � � � � � �
�� � � � �� �
� Source: Morningstar, for the period 9/30/1927 to 9/30/2014 �
�
�
�
�
� �
�
� Be Prepared to Look Different: � � �in such � simple terms � may understate one of the primary costs of being a value investor Describing value investing
� � Investment � � markets � � millions� of �human � � minds � � � � � set – looking different� than �the crowd. put to work in� trying to � � � � based � � or on short � � term market � � � � � Many� prices and many� people invest irrationally on� � recent news movements. � � to� buy whatever � � � done� the best � recently� and avoid � � whatever � � � � � not� been investors will want has investment has � � � to bubbles � � � and crashes � in� investment � � markets. � � � � able to keep up. This� �mentality contributes � � � � � � � �� � � � � � � � � ��� of investing differently is not easily quantified, though it is a very real cost that investors The emotional cost
� � � � �
must bear to earn potentially higher returns. Oftentimes, the least expensive asset classes to buy are the ones � � � � � � � � � � � � � � � � � � � that everyone else is trying to avoid – that is why they are cheap! � � � � � � �� � � � � � � � � � � � � � � � � � � � � � � � � � 2
�
Have a Long Time Horizon:
Investors who have had the conviction to own portfolios of asset classes that are good values have reaped higher returns over the long term. There have been times when herd behavior among other investors has led a value strategy to have lower performance than the market. To implement a value strategy well, an investor has to be prepared to look different to do well in the long term, even if that means having a lower return for some periods in the short term.
Focus on Quality:
Sometimes investments are cheap for a reason. Within our value oriented strategy, we maintain a focus on quality. When viewing companies some of the key areas we focus on are profitability and debt levels. Companies that have historically made wise decisions and earned a competitive return on equity relative to their competitors are more likely to do so in the future. Maintaining reasonable debt levels within a corporate structure helps position a firm for stable long-term growth and provides safety in times of recession or specific disruptions to a particular industry.
Diversification is Critical:
Investors have many tools to identify investments that are good values, but few tools, if any, to fine tune their timing. No one has perfect foreknowledge of the markets and the turning point for when out-of-favor assets classes will become investor darlings again cannot be known with any certainty. That means that to implement a value strategy well, investors should be prepared to buy low and sell high in as many different asset classes around the world as possible. This could help to limit the risk of getting the timing wrong in any one asset class or investment. Taking a broad, global view of value investing increases the opportunity set and diversifies the portfolio across a range of different investments.
3
� � � � � � � � �
�
�
� �
�
� �
� � � �
� � � � � � � � � � � � � � � � � � � � � � � � � � � � � � � � � � �� �� � � � � � � � � � � � � �� � � � � � � � � � � � � � � � �
�
� �
�
�
�
� �
�
� �
�
�
�
�
�
� � �
� �
�
� �
�
�
�
�
�
�
�
ASSET ALLOCATION OVERVIEW
Other than market timing mistakes that are all too prevalent among investors today, the allocation of a client’s portfolio to different asset classes is the single greatest determinant of investment performance*. We diversify the portfolio across a broad spectrum of different asset classes in an effort to reduce overall portfolio volatility. RegentAtlantic’s Investment Committee evaluates the relative risk and return characteristics of 16 separate asset classes and cash on an ongoing basis. The objective is to select appropriate mixes of asset classes and within each asset class, to carefully select the investments to comprise that allocation. Through this arduous process, RegentAtlantic has chosen 14 different assets as potentially desirable for portfolio allocation. These include 5 “Wait List” Alternative asset categories that we may use when the portfolio managers deem market valuations to be attractive. We have rejected two asset classes and will not use them. This guide will describe each of the chosen asset classes and why we view them as potentially attractive portfolio components. We will also explain briefly the rationale behind the Rejected Assets.
CHOSEN, WAIT LIST, AND REJECTED ASSET CLASSES
Growth Growth Assets Assets
Cur Current rent Allocation Allocation
Wait Wait List List Assets Assets
Rejected Rejected Assets Assets
Cash Cash
0%
G Global lobal LLarge arge C Cap ap Stocks Stocks
61%
He edging Strategies Strategies Hedging
Ma anaged Futures Futures Managed
Global Short Short Term Term Bonds Bon nds Global
40%
US Small Small Cap Cap Stocks Stocks US
5%
H igh Yield Yield Bonds Bonds High
G od ol Gold
Inflation Protected Protected B onds Inflation Bonds
15%
Int’l Small Small Cap Cap Stocks Stocks Int’l
10%
R eal Estate Estate Real
Opportunistic Opportunistic Bonds Bonds
45%
Emerging Em merging Markets Markets
15%
Commodities C o modities om
Frontier Markets Frontier M arkets
3%
Emerging Em merging Market Market Debt De ebt
Infrastructure Infrastructure
6%
* Brinson, Gary P., Hood, L. Randolph, and Beebower, Gilbert L., “Determinants of Portfolio Performance”, The Financial Analysts Journal, July/August 1986
4
�
� � �
�
�
Cur Current rent Allocation Allocation
�
�
• Behavioral Counseling - we seek to align the client’s portfolio to the client’s time horizon and risk tolerance and to avoid the behavioral mistakes made by many investors • Asset Allocation – we combine uncorrelated asset classes in an effort to seek higher returns for a given level of risk (or lower risk for a given level of return) • Security Selection – we seek the best tools to implement portfolio exposure within each asset class • Spending Strategy – we seek to enhance after-tax returns by evaluating which accounts should fund retirement spending first, and which should be left invested longer term • Asset Location – we seek to enhance after-tax returns by skewing securities that generate most of their growth from appreciation to taxable accounts and securities that generate most of their growth from income � to tax deferred accounts. Moreover, if tax-free growth accounts (ex. Roth IRA) exist, they are filled with securities containing the highest growth potential • Rebalancing – we use this disciplined strategy in an effort to buy low and sell high
Fixed F ixed IIncome ncome A Assets ssets
� �
�
RegentAtlantic Wealth Advisors and team members seek to add value� in portfolio management in six � � � � � � � � important ways: � �
�
� � �
�
�
SIX WAYS WE SEEK TO ADD VALUE
�� �
� � �
�
� �
� � �
�
�
� � �
� �
�
�
�
FIXED INCOME ASSETS
GLOBAL SHORT-TERM BONDS
• • • •
� �
�
�
�
�
�
�
� �
� �
�
� �
�
�
�
� �
Debt securities issued by corporations and governments to raise capital.
Offer a fixed, semi-annual payment to the investor based on the credit �quality � of the� issuing entity. �
Upon maturity, barring any� extreme event, the � � original principal is returned to the investor in o ��� ��� full. �
�
Provide a level of return with lower volatility � � than other asset classes. �
� � � ���
� ���
� �
�
���
�� �
�
� �
�
�
�
�
��
�
�
�
�
� �
�
� �
� �
Source: Morningstar, for the period 4/1/1954 to 11/30/2014
�
�
� �
�
�
�
� �
�
� �
�
�
The short-term nature of these securities reduces exposure to interest rate risk which is the risk that interest � � � � � � � � � � � � � rates rise and shrink the value of a bond. For example, for� $100 � � if a bond � paying � � a 4%� coupon was ��� purchased � � � and interest rates increased to 5%, the original is less � 4% coupon � � attractive and would be worth less than the $100 originally paid. Since interest� rates are typically slow to move, short-term bonds are less likely to experience � � � � � long-term � � � bonds � � do � not receive � � � a large change in value. The chart illustrates that investors in sufficient � risk they � are � taking. Since � � use �this asset � �class as a means � � � of compensation relative to the additional we �use this � � � � � � � � � � � � � protecting capital, the portfolio typically invests in high quality bonds, which mitigates this credit risk. This allows � �� the portfolio to generate a steady stream� of income with� minimal risk to an investor’s principal. �� � � � � � � � � � � � � � �
�
�
�
�
INFLATION INDEXED BONDS
� � �
�
�
�
�
�
��� �
�
� �
� �
�
� � �
�
� �
� � �
� �
� �
�
� �
�� � � � �
� � �
�
� �
� � �
•
Explicit inflation protection is typically accomplished in two ways. � o Invest in Treasury Inflation Protected Securities (TIPS) issued by the U.S. Treasury. � o Invest in Inflation Swap contracts in conjunction with a corporate or municipal bond portfolio.
•
TIPS offer interest payments plus a built-in inflation adjustment tied to the consumer price index.
•
Inflation Swap contracts allow the investor to own a portfolio of corporate or municipal bonds, which may be more appropriate than treasuries based on market conditions. The swap contracts are also purchased � � Source: JP Morgan, calculated for the rolling 12 month total return to provide a hedge against unexpected inflation. �
�
�
�
�
returns for the period 12/31/2005 to 12/31/2012
� � � � � � � � � � � � � � � Protecting a client’s portfolio against inflation is one of� our top priorities in �portfolio management. Currently, � we favor using strategies that incorporate inflation swaps rather than direct investment in TIPS. This is due to � the high level of volatility that the Treasury market has experienced. At various recent intervals the yield on a � 10-year TIPS bond has fallen into� negative territory. A buyer of a TIP with a negative yield is locking in a negative real return (return minus inflation) over the life of the bond. We believe that corporate or municipal bonds have the potential to offer better value than treasuries and the high correlation of the Inflation Swaps to CPI can provide a more direct hedge against rises in inflation.
5
�
�
�
OPPORTUNISTIC BONDS
•
•
•
�
�
�
�
�
�
�
�
�
�
� �
�
� �
�
�
�
�
�
�
�
� �
�
�
�
� �
�� Seek total return and value across various� segments � of the global bond market (corporate, sovereign, � than � mortgage, high yield, convertible, etc.)� rather � being limited to one distinct geographic area � �or � segment. � � and� A key characteristic is the flexibility to buy long � sell short specific sectors, �which may help to� � � capitalize on economic events other asset classes � cannot. �
�
� � �
� � �
�
�
� � �
� �� �
��� � �
�� ��
�
� ��
�
�
� � � �
� �
�
�
�
�
�
� �
�
� �
�
�
� �
Success of traditional bond strategies � � is largely ��� � � � � � � � � � � driven by movements in interest rates. Success of � � � � � � � � � opportunistic bond managers is largely� driven�� by � � � � � � � � � � � Source: Morningstar, for the period 01/01/1980 to 12/31/1989 � � � � � � their security selection. (“1980s”); 01/01/1990 to 12/31/1999 (“1990s”); 01/01/2000 to ���
���
���
���
���
���
���
�
�
�
�
�
� �
� � �� � � 12/31/09 � (“2000s”) �� � � �� � � � � � � � � � � �� � � � � � � � � � � � � � In addition to interest payments, price as � � appreciation � � has� played �� �a notable � � role� in the overall � � return � of bonds � � � interest rates have declined over the past investors� face � 34 years. �� With� interest � rates� at all-time � lows, � � fixed income � � � � � � payments � � �and little opportunity � � � capital � � appreciation � � �from � falling � � � � two major headwinds today: low interest for rates. � � we � are utilizing � � opportunistic � � � bond strategies �� These headwinds are the primary reason that seek to minimize � interest rate risk and enhance returns over and above interest payments through security selection and credit risk. �
�
��
GLOBAL LARGE CAP STOCKS
•
Comprise the largest segment of the investible universe.
Many companies have similar qualities: 1) scale and scope of their operations frequently lends a degree of stability to their earnings, 2) their size typically � results in a global presence, and 3) they frequently compete in the same industries and in many of the same markets. Considered a long-term core portfolio holding.
Source: Bloomberg for the period 01/31/1954 to 11/30/2014
� � � � � � � � Among equity asset classes, large cap stocks have historically exhibited the lowest levels of volatility in their � � prices and earnings. These stocks represent an array of different sectors and industries. Examples include IBM (information technology), Johnson & Johnson (pharmaceuticals), Exxon Mobil (energy), and Procter & Gamble � (consumer goods). These stocks also provide the benefit of geographic diversification, often sourcing their revenues � from countries around the world.
The S&P 500 Index has achieved �annualized returns of 10.5%/year from January 1, 1970 through November 30, � 2014. International Large Caps have achieved a similar 9.3%/year annualized return over this same time period. Over the long-term, one reason that large cap stocks have produced such strong returns is because companies have grown their earnings. Earnings growth enables companies to pay dividends to shareholders as well as make investments to help grow the firm. Ultimately, these earnings help to drive the returns of stocks that have been substantially higher than the 4.2% inflation rate from 1/1/1970 to 10/31/2014. �
6
� �
�
GROWTH ASSETS - STOCKS
•
�
�
�
•
���
�
� � �
�
•
•
�
� �
U.S. SMALL CAP STOCKS
•
�
Stocks of small companies domiciled in the U.S. that have a market capitalization of less than $2.5 billion.
Small cap stocks derive revenue through the production of goods and services. Their business success is generally tied to the growth of their local � �� economies.
��"��������"������� ��"��������"������� ��� ����� � ����� ����#�'� ���������(����$������+-,,� ����#�'� ���������(����$������+-,,�
F LII� FLII�
��D��NII� D��NII�
F KNI� FKNI�
�-++�$$�KIII� � -++�$$�KIII�
F KII� FKII�
�
Considered a long-term� core portfolio holding.
F JNI� FJNI�
���
F JII� FJII�
Historically, small cap � stocks have achieved FNI� FNI� � stocks. � � � � � � � � � � � � significantly higher returns than large �cap FI� F I� � We believe that one reason for this additional � return is the byproduct of a small� company’s � � � � � � � � � � � �� � caps stocks have potential to grow at much higher� rates � � than �a � US small � � � historically � enjoyed significantly higher � investment US� large caps� stocks.� Source: � � �Since� � � � returns than � � � Bloomberg, � � �� � mature, established business. small �� �� �� the� period 12/31/1999 � � – 11/30/2014 for � � � company stocks also tend to be more volatile � � ��� ��� ��� � � � � � � than large company stocks, we ��� take care to��� � � � � � � � � � � � � � � � � � limit our allocation to this asset class within the � ��� ��� ��� ��� ��� ��� � � � � � � � � context of a well-diversified portfolio. KIJL� K IJL�
KIJK� K IJK�
KIJJ� K IJJ�
KIJI� K IJI�
K IIR� KIIR�
KIIQ� K IIQ�
K IIP� KIIP�
K IIO� KIIO�
K IIN� KIIN�
K IIM� KIIM�
KIIL� K IIL�
K IIK� KIIK�
�
KIIJ� K IIJ�
�
K III� KIII�
�
JRRR� J RRR�
�
� � � � �� �� �� ��� � � � � � Within small cap stocks, one of Stocks � our areas � � � of focus is value. � ��� that are less expensive when comparing their prices to company fundamentals such as earnings, sales and book value have tended to produce � � � � � � � � � � � � stronger returns in this asset class � � � � � � � � � � � � � � INTERNATIONAL SMALL CAP STOCKS � � • Stocks of companies domiciled in developed �
•
•
�
�
foreign markets that have� a market capitalization of less than $2.5 billion.
Small cap stocks derive revenue through the production of goods and services. Their business success is generally tied to the growth of their local economies. Considered a long-term core portfolio holding.
FLNI�
� �
�
��
�
��"��������"�����)�� ���������#�'� ���������(����$������+-,,� ��� ������
FLII�
��� ���������
FKNI� FKII� FJNI�
KIJL�
KIJK�
KIJJ�
KIJI�
KIIR�
KIIQ�
KIIP�
KIIO�
KIIN�
KIIM�
KIIL�
KIIK�
KIIJ�
KIII�
JRRR�
Historically, international small cap stocks have FJII� achieved significantly higher returns than FNI� FI� international large cap stocks. We believe that one reason for this additional return is the byproduct of a � small company’s potential to grow at much higher � International small caps stocks have historically enjoyed significantly rates than a mature, established business. higher investment returns than international large caps stocks. � Since small company stocks also tend to be more Source Bloomberg, for the period 12/31/1999 – 11/30/2014 � � � � � � � � � � � � volatile than large company stocks, we take to� � � � care � � � � � � limit our allocation to this asset class in the context of a well-diversified portfolio. International developed market small companies span countries in Europe, Asia, and the Far East. Currently, the largest country weightings are Japan 29%, United Kingdom 22%, Australia 6%, Germany 6%, and Switzerland 5%.
7
�
�
�
�
� � � �
EMERGING MARKET STOCKS
•
� �
�
� �
� � � �
�
� � �
� �
�
�
�
� �
�
�
�
� �
��� �
�
�
�
�
� �
�
� �� � �
Stocks of companies located in countries considered less developed when compared with major economies of the U.S., Japan, and Europe. These countries tend to have younger populations, faster economic growth, and legal and financial systems that are not yet at the standard of the developed world.
F LNI� FLNI�
��"��������"����#�������#�'� ��"��������"����#�������#�'� ���������� �������(����$������+-,,� �������� �������(����$������+-,,�
F LII� FLII� FKNI� F KNI� F KII� FKII�
Major regions include Eastern Europe, most of Asia excluding Japan, and Latin America. The largest country weightings within Emerging Markets belong to a diverse group that includes, South Korea, China, Tawain, Brazil, India, South Africa and Mexico.
F JNI� FJNI� FJII� F JII�
KIJL� K IJL�
KIJK� K IJK�
KIJJ� K IJJ�
KIJI� K IJI�
KIIR� K IIR�
KIIQ� K IIQ�
KIIP� K IIP�
KIIO� K IIO�
KIIN� K IIN�
KIIM� K IIM�
KIIL� K IIL�
KIIK� K IIK�
FI� F I�
KIIJ� K IIJ�
FNI� F NI�
� Considered a long-term core portfolio holding. Emerging Markets companies have � historically enjoyed significantly Emerging markets companies �continue to expand returns market � � � higher� investment � � than � developed � � � companies. � their role in the world economic� landscape. Over � Source: Bloomberg, for the period 12/31/1999 – 11/30/2014 � � � � � the past few decades, many emerging market � companies have capitalized on cheap labor and abundant local, natural resources to become exporting � powerhouses. Samsung from South Korea is a great example of this trend. More recently, companies have capitalized on the positive demographic trends within many of their home countries to gradually develop more profits. For example, China Mobile is benefitting from increased cell phone usage among China’s massive population. The long-term growth of emerging market companies has been impressive relative to developed market� companies. emerging market companies to continue to have substantial potential to grow � � We expect � their profits in the future.
�
FRONTIER� MARKET�STOCKS�
•
•
��� ���.�$'(��� &��0� � �� ���.�$'(��� &��0�
��� ��%�*�!&����*#�,+� &��0� � �� ��%�*�!&����*#�,+� &��0�
� � � countries� with � Stocks of� companies in� developing � � � � � � � smaller, less developed and less liquid capital markets. �
Member countries generally fall into three groups: 1) � of relatively � � � � that are � small countries high development � � � � � � � too small to be considered emerging markets (e.g., � � � � � � � � Estonia), 2) countries with investment restrictions that � � � � � � � have recently� begun to � loosen (Gulf Cooperation � � � � Council and 3) countries � countries), � � � that are � at a lower � development level than existing emerging � � � � � � mainstream � � � markets� (e.g.,� Kenya, �Vietnam). � � � �
�
�
�
�
������������ � �
����%�� �
�' '� ��������� � � �
�D��NII���� � � �
I7NM��
�������� ��������� � � �
��� ��������� � � �
I7OJ��
�' '� ��������� � � �
� �� �$�KIII���� � �
�������������� ��������� � � �
��� ������ � �
��������� ������� � �
��� ��
����������� � �
�$� ��������� �� � � ��
�������������
������� � �
��������"��"����
$�� &���
&�� ����� � � �
I7MO�� (���� � � *#�,+���� � � ,1��� ������ � � � ,1���� � �
I7OJ�� I7NQ�� I7MJ�� I7NI�� I7LL��
� � We view frontier markets as� an effective diversification A correlation of 1.0 means that the two asset classes have generally � risen and fallen in value at the same time during a time period. tool historically, of frontier � because � � � � the � correlations � � � Source: Bloomberg, for the period 6/1/02- 11/30/13 � � � � � � � � � � � markets� to both� developed and equity � � � emerging � � � � � � � � � � markets have been � � � low. The� low correlations � � are� in part � due to the strong economic growth of frontier markets, which have been generated by domestic (rather than export) frontier offer the ��� � � � � � � � � � � �� activity. �� ��Additionally, �� �� markets �� �� �� potential� for and of their markets to the global economy. �� � � opening � � � � � � the � � development �� �� � � � � �
�
� � � � � � � � � � In many respects, frontier markets are positioned where emerging markets stood 20 years ago. As such, we believe � � these� markets � will � grow faster � � developed � � � fueled � � by ��several � � � including � � �a it� is possible that than countries, trends � � educated � �population, � � surging � � � � � � as well � � � � growing� young and penetration in telecommunications as booming trade � � � � � � � � � �� � � � � � and investment.
8
�
�
�
� ��� � � �
�
� �
� �
�
KIII� K III�
•
� �
JRRR� J RRR�
•
� � �
�
�
�
�
�
�� � �
GROWTH ASSETS - ALTERNATIVES
�
� �� �
�� �
� � �
�
��
�
�
�
� �
�
�
INFRASTRUCTURE MASTER LIMITED PARTNERSHIPS �
�� � �
�
� �
�
�
� � � � � � � � � � �
�
�
�
�
�
��� � �
� �
� �
�
�
•
� � �
� �
� Oil and natural gas MLPs are companies focused primarily on the transportation, �storage, mid� of energy stream processing and distribution � products, with the bulk of the assets focused on � gas pipelines. �
Revenues are largely derived from� the usage of � commodity. energy rather than the price of the � Think of them as toll collectors as the commodity � passes through a fairly monopolistic system.
� � Infrastructure MLPs offer an excellent source of � income and potential for capital appreciation. This �
Bloomberg, for the period 01/01/1996 – 12/31/2013 asset class provides significant diversification� benefits� Source: � � � � � � as infrastructure exhibits relatively low correlations to bond, stock, and other alternative asset classes. We focus � on those companies that transport natural resources from extraction sites to the refinery sites (i.e. pipelines and � particularly attractive because � of its long-lived assets, low sensitivity to storage facilities). We find this segment commodity prices, stable revenue streams, and fee-based, longer-term contracts. As illustrated below, MLPs have produced steady growth in their cash distributions to investors, which are a big driver of their long term value.
GROWTH ASSETS–ALTERNATIVES–WAIT LIST
“Wait List” alternative asset categories are those that may not be employed today, but may be used when we deem market valuations to be attractive.
HEDGING STRATEGIES
•
•
Hedging strategies that can be accessed through investment in open-end equity mutual funds.
We do not invest in hedge funds. Hedge funds and hedging strategy mutual funds can employ similar tactics, but mutual funds offer full transparency, daily liquidity, lower fees, more stringent regulatory oversight, and ease of access.
We utilize hedging strategy mutual funds to help mitigate the volatility experienced by other growth asset classes. These funds can buy those stocks they view as attractive/under-valued and sell short those stocks they deem to be unattractive and/or over-valued, which can generate returns with less market risk than funds that do not sell stocks short. Over full market cycles, hedging strategies have exhibited less market risk than other traditional asset classes.
�
�
�
�
•
� �
�
The Dow Jones Credit Suisse All Hedge Fund Index is a useful proxy for how we might expect these strategies to perform. The index tracks the performance of Hedge Funds and not hedging mutual funds. Hedge funds achieved lower risk over this period, though at the cost of lower returns. Source: Bloomberg, for the period 9/30/04 to 10/31/14
Historically, this had yielded a reduction of overall portfolio volatility. When stocks returns are strong, it can be difficult for hedging strategies to achieve similar returns. 9
� �
� �
� �
� �
� �
� � �
�
�
� �
(
�
� �
� �
�
� �
� �
� �
�
� �
� �
� � �
�
�
�
�
�
HIGH YIELD MUNICIPAL BONDS �
•
• •
Debt obligations issued by states, local governments and other public authorities with a non-investment grade credit rating.
Standard & Poor’s credit scale ranges from AAA (best) to D (worst). Bonds rated below BBB are � considered high yield or Junk bonds.
�
Generally pay higher yields than investment � grade bonds due to the higher risk that the issuer will be unable to make its required payments. �
�
� �
�
�
�
�
�
� �
� � � � �
�
�
�
�
�
�
�
�
� �
�
�
�
�
� �
�
We do not believe that High Yield Bonds (HYB) should � � � � � � � � � be viewed as a core allocation for client portfolios. Over �� �� �� �� � � � full market cycles, HYBs are unlikely to produce enough Source Bloomberg, for the Period 12/31/99 to 11/30/14 � � � � � � � � � � � ��� � As shown in the chart return to justify their higher risk. � � � � �higher�returns than � � investment � to the right, municipal HYBs have historically produced grade bonds. However, the � � HYB investors were on a relative roller-coaster ride. The� BarCap Muni High Yield Index had a standard deviation � � a �standard deviation � � of 4.4%. � � � � � � � (volatility) of 7.5%, while the Barcap Municipal Bond Index had �
�
�
�
�
�
�
���
�
� � � � � � � � � � � Though HYBs are not always attractive as a whole asset class, bond pick� from yield � � � managers � � that � selectively � � the � high � � � � � bond universe as well as from� other parts of the bond market may be nimble enough to add value in many market � � � � � � � � � � � � � � � � � � � � � � � � � � � � environments. Our allocation to opportunistic bond managers gives us access to the best thinking of these managers. � �levels. � This � generally � � � after a crisis � � � � Municipal HYBs can be an excellent investment when yields rise� to elevated occurs � containing one or more high-profile defaults. � � REAL ESTATE INVESTMENT TRUSTS � • REITs are liquid pools of commercial real estate � � that trade on stock exchanges and must pay out � 90% of its earnings in dividends. � • Two types: 1) mortgage REITs that loan money and � � 2) equity REITs that own properties. � • Equity REITs can provide geographic diversification � by owning properties in different regions of the US. � International REITs own properties in foreign � � countries. � • REITS can own different types of properties, such � as shopping malls, apartment buildings and � Source: Bloomberg, for the period 12/31/1995 – 11/30/2014 � office buildings. � � � � � � � � ���� �
REITS have experienced low correlation to the S&P � 500 Index and the Barclay’s Aggregate Bond Index over the � the portfolio. past 10 years. Therefore, they are useful in diversifying
As shown in the chart, the average dividend yield on the NAREIT index has been approximately 5.4%. Investing in � REITs contains significant risk and the best time to invest in REITs is when you are being compensated to take that � risk with high dividend payments. While REITs are a component of our diversified portfolios during most time � periods, we generally don’t believe that REITs are a reasonable investment when yields fall below 4%. �
10
� � � � �
�
COMMODITIES
•
�
�
�
�
Investing in this asset class can be defined as the process of purchasing futures contracts on physical commodities.
•
Commodity investing can be done in a diversified manner by allocating to various sectors, including energy, agriculture, precious metals and industrial metals, and livestock.
Commodities have historically made a useful contribution to a diversified portfolio by having low correlations to both stocks and bonds. Yet in recent years extremely steep contango across most commodity � futures markets has stripped investors of positive Source: Bloomberg, for the period 06/30/04 to 11/30/14 � returns. Contango describes a price relationship in � � � � � � � � commodity futures where prices in the spot market (prices for immediate delivery) are lower than prices in the futures � market. This situation is bad � for commodities investors because an investor would need to pay a higher price to invest into a future and will need � to sell the future at a lower price before it expires to prevent taking delivery of the � commodity. This loss is known� as a negative roll yield and has been a substantial drag on returns for the past seven � spot commodity prices have appreciated � � over 100%. However, if an investor purchased a fund or note years. In fact, � � designed to replicate the DJUBS commodity index with futures contracts; his total return over this period would have � �-8.5%.� � been approximately �
�
� � � � � � � EMERGING MARKET DEBT � � � � � � � • Bonds issued by countries considered less � � � � � � developed compared with the U.S. and other � � � � � �� developed countries (e.g. Brazil, Russia, Turkey, & � � � � � � debt� the Philippines).� Sovereign (or government) � � � � in this� � space. Emerging � � is the main issuance � markets companies � are � �a growing � source� of� supply� � as well. � � � � in local � currencies � � of emerging � � • May be issued market countries or in a foreign currency (e.g. US� � � � � � � Dollar.) Local currency bonds account for over 75% � � � �� � � of the EM Debt market. � � � � � � � � � We do not believe� that Emerging Markets Debt should
represent a core holding in client portfolios. As with Chart Sources: iShares, Aberdeen Asset Management, Bloomberg, � �risk �debt instruments, � � � � � for the� period: 08/04/2008 � � � to 10/27/2008 � � � 08/03/2011 �� �to other higher Emerging Markets and � � � � � � � � � � � � � Debt has produced somewhat higher returns than 10/04/2011 investment grade bonds, but � � � � at� the � cost � � of � � �� � � � � � � substantially higher risk. As shown in the chart, though Emerging Markets Debt’s relative risk may be higher � � � � � � � � � � � � � � � � than� many investors’ comfort levels, there may be times when it can play a role in a� diversified portfolio. When inflation � � � � � � � �� � � � � � � � � adjusted yields are especially high in Emerging Market Debt and the issuing currencies present a good value, we � this � asset � � for inclusion � in our � �client �portfolios. � � � � � � � � � � may consider class �
��
� �
�
�
�
�
�
�
�
�
�
�
� �
�
�
� �
�
�
11
� � � � � �
� �
�
� �
� � � �
�
�
�
�
�
� � � � �
�
�
� � �
�
�
�
� �
�
�
�
�
� �
� � � � � � � � �� � � � � � � � � � REJECTED ASSETS � �� � � � � � � � � � � � � �that we have ������ reviewed � � and have � � deemed � � inappropriate � � � for our� client � � “Rejected Assets” are asset categories � � � � � � � � � � � � � � portfolios. � � � � � � MANAGED FUTURES �
• •
•
� �
��� �
�
�
�
�
�
�
� �
�
� �
�
�
�
� �
�
�
Investment vehicles that trade futures contracts on one of the world’s futures exchanges.
Futures contracts are typically written on financial assets, such as currencies, or commodities.
Can follow different strategies; most follow one based on studying recent price movements of assets known as “trend-following.” A trend-follower tends to buy assets that have risen recently and sell assets � short that have fallen recently. � �a 2% These funds tend to be very expensive, charging
� base fee as well as an incentive fee equal to 20% of all � profits. �
BarclayHedge, � � � � � � for�the period � 1990 � to 2014 � � � � Transactions charges can also be hefty requiring� many Managed Futures Assets Under Management ($ Billions) � � � � � � � � � managers to produce 4-5% in trading profits simply to �
�
��
� � �
�
� �� also� seen � ��� �� �� �� break even for the investor. They � ��have �� � ��a �� � �� �� �� �� �� �� �� �� � � � significant component of their returns―collateral yield―evaporate over the past few years. Futures contract � � � � � � � � � � � � � � purchases are required to post�collateral at the inception of the agreement, which would earn interest during the � � � � � � � � � � � � � � term of the futures contract.. �With interest rates at all-time lows, this source of return has disappeared. Lastly, � � � � � � � � � � � � � � � � � has as shown in the chart below, cash flooded this �asset class over the� past several years; predominantly a technical � � � � � � � � � � � � � � � � � � � � of dollars to this area may wash � trading strategy, the recent influx away any trading inefficiencies that might present � � � � � � � � � � � � � � � � � � � themselves. �
�
�
GOLD
•
•
�
��� � �
�
� �
��
�
�
�
�
�
�
�
�
�
�
� � �
�
� � � �
�
�
�
� �
�
� Gold is a dense, soft, shiny, malleable and ductile metal commonly looked to by investors as a store of value during economic disruptions.
The most popular use of gold by investors is as an inflation hedge or a hedge against currency depreciation.
When reviewing potential asset classes for inclusion in client portfolios, one of the primary characteristics we look for is whether the asset class has clear fundamentals that can be used to explain price movements and behaviors exhibited by the asset class. Gold, however, lacks clear valuation factors, making it difficult to � calculate its intrinsic value and measure the true worth Source: Bloomberg for the period 12/31/78 to 10/31/14 � of an ounce of gold. Gold has also not always been an � � � � � � � � effective way to hedge against rising prices. After hitting a relative high point in 1981, gold’s price fell and hovered � around the price of $400 per ounce for the next 25 years. Over the same period the Consumer Price Index, a measure of inflation, went up 129%. Gold did not do a good job of keeping pace with rising consumer prices over that period and has rarely been a good inflation hedge.
12
�
��
�
�
Important Disclosure Information
Please remember that different types of investments involve varying degrees of risk, including the loss of money invested. Past performance may not be indicative of future results. Therefore, it should not be assumed that future performance of any specific investment or investment strategy, including the investments or investment strategies recommended or undertaken by RegentAtlantic Capital, LLC (“RegentAtlantic”) will be profitable. Please remember to contact RegentAtlantic if there are any changes in your personal or financial situation or investment objectives for the purpose of reviewing our previous recommendations and services, or if you wish to impose, add, or modify any reasonable restrictions to our investment management services. A copy of our current written disclosure statement discussing our advisory services and fees is available for your review upon request. This guide is not a substitute for personalized advice from RegentAtlantic. This information is current only as of the date on which it was sent. The statements and opinions expressed are, however, subject to change without notice based on market and other conditions and may differ from opinions expressed in other businesses and activities of RegentAtlantic. Descriptions of RegentAtlantic’s process and strategies are based on general practice and we may make exceptions in specific cases.
The allocations shown in this guide are the current allocations recommended by the Investment Committee. These allocations are subject to change based on the Investment Committee’s recommendations and is current as of December 31, 2014.
The index returns listed show the total return for various investment indices and include the impact of the reinvestment of dividends. A comparison to indices may not be a meaningful comparison. Comparisons to benchmarks have limitations because benchmarks have volatility and other material characteristics that may differ from the performance of a client's portfolio. The investments in a client's portfolio may differ substantially from the securities that comprise each index and are not intended to track the returns of any index. One cannot invest directly in an index, nor is any index representative of any client's portfolio. Actual client accounts will hold different securities than the ones included in each index. The index returns are gross of applicable account transaction, custodial, and investment management fees. The actual investment results would be reduced by such fees and any other expenses incurred as an investor. The definition of the indexes used in this guide are listed below.
Definitions of Indexes Used:
BarCap Aggregate Bond Index: A broad-based benchmark that measures the investment grade, U.S. dollardominated, fixed-rate taxable bond market, including Treasuries, government-related and corporate securities, MBS (agency fixed-rate and hybrid ARM pass-throughs), ABS, and CMBS. The index was created in 1986, with index history backfilled to January 1, 1976. BarCap TIPS Index: The index measures the total return of all publicly issued US treasury inflation protected securities that have at least 1 year remaining to maturity, are rated investment grade and have $250 million or more of outstanding face value. BarCap High Yield Corporate Bond Index: The Barclays Capital High Yield Index measures the total return of publicly issued U.S. dollar denominated, non-investment grade, fixed-rate, taxable corporate bonds that have a remaining maturity of at least one year, and are rated high-yield (Ba1/BB+/BB+ or below) using the middle rating of Moody’s, S&P, and Fitch, respectively. BarCap Municipal Bond Index – The Barclays Capital U.S. Municipal Bond Index measures the total return of the long term tax exempt bond market. The index includes bonds with a par value of at least $7 million, have at least 1 year until final maturity, and have a minimum credit rating of Baa3/BBB-/BBB- using the middle rating of Moody’s, S&P, and Fitch, respectively. BarCap Municipal High Yield Index – The Barclays Capital U.S. High Yield Municipal Bond Index measures the total return of the long term, sub investment grade, tax exempt bond market. The index includes bonds with a par value
13
of at least $3 million, have at least 1 year until final maturity, and are rated high-yield (Ba1/BB+/BB+ or below) using the middle rating of Moody’s, S&P, and Fitch, respectively. JP Morgan EM Debt Index: Tracks total returns for traded external debt instruments in the emerging markets. The EMBI includes U.S dollar denominated Brady bonds, loans, and Eurobonds with an outstanding face value of at least $500 million. S&P 500 Index: The S&P 500 is an index consisting of 500 stocks chosen for market size, liquidity and industry grouping, among other factors. Each constituent in an index is weighted by its market-capitalization, as determined by multiplying its price by the number of shares outstanding after float adjustment. Total returns for the index include the impact of reinvested dividends. Russell 2000: The Russell 2000 Index is a small-cap stock market index of the smallest 2,000 stocks in the Russell 3000 Index. The index is market cap weighted and considered representative of small capitalization stocks. MSCI EAFE Index: The MSCI EAFE Index is a free float-adjusted market capitalization weighted index that is designed to measure equity market performance in Europe, the Far East and Australia. It is considered representative of large capitalization stocks in developed markets outside the U.S. MSCI EAFE Small Cap Index: The MSCI EAFE Small Cap Index Fund targets 40% of the eligible small cap universe in each industry group of each country represented by the MSCI EAFE Index. MSCI defines the small cap universe as all listed securities that have a market capitalization in the range of $200 - $1500 million USD. The index is considered representative of small capitalization stocks in Europe, the Far East and Australia. MSCI Emerging Markets Index: The MSCI Emerging Markets Index is a free float-adjusted market capitalization index that is designed to measure equity market performance in the global emerging markets. The MSCI Emerging Markets Index is a free float-adjusted market capitalization index that is designed to measure equity market performance in the global emerging markets and which aims to capture 85% of the (publically available) total market capitalization. MSCI Frontier Markets Index: A free float-adjusted market capitalization index that is designed to measure equity market performance of frontier markets. MSCI World Index: The MSCI World Index is a free float-adjusted market capitalization weighted index that is designed to measure the equity market performance of developed markets. FTSE NAREIT Equity REITs: FTSE NAREIT Equity REITs Index represents the full universe of publically traded equity REITs. Stocks are free-float weighted to ensure that only the investable opportunity set is included within the index. Dow Jones UBS Commodity Index Total Return: The Index is a broadly diversified index that allows investors to track total returns of a fully collateralized holding of commodity futures through a single, simple measure. It includes 19 commodity futures in five groups. No one commodity can comprise less than 2% or more than 15% of the index, and no group can represent more than 33% of the index (as of the annual reweightings of the components). Dow Jones UBS Commodity Index Spot Return: The Index is a broadly diversified index that allows investors to track price returns of commodity futures through a single, simple measure. It includes 19 commodity futures in five groups. No one commodity can comprise less than 2% or more than 15% of the index, and no group can represent more than 33% of the index (as of the annual reweightings of the components). Alerian MLP Total Return Index: The index is a market-cap weighted, float-adjusted index created to provide a
14
comprehensive benchmark for investors to track the performance of the energy MLP sector. It is a composite of the 50 most prominent energy master limited partnerships calculated by Standard & Poor's using a float-adjusted market capitalization methodology. The Index components are selected by Alerian Capital Management, LLC. Credit Suisse AllHedge Index: The Credit Suisse AllHedge Index is a diversified investable index of hedge funds. It is comprised of 10 underlying indexes, representing the performance of hedge funds that specialize in the following categories: Convertible Arbitrage, Dedicated Short Bias, Emerging Markets, Equity Market Neutral, Event Driven (Distressed), Event Driven (Multi-Strategy), Event Driven (Risk Arbitrage), Fixed Income Arbitrage, Global Macro, Long/Short Equity, Managed Futures, and Multi-Strategy. Consumer Price Index: A measure that examines the weighted average of prices of a basket of consumer goods and services, such as transportation, food and medical care. The CPI is calculated by taking price changes for each item in the predetermined basket of goods and averaging them; the goods are weighted according to their importance. Changes in CPI are used to assess price changes associated with the cost of living. IA SBBI 30 Day T-Bills: A measure of total returns for a one bond portfolio holding the on-the-run 6 month treasury bill. IA SBBI 6 Month T-Bills: A measure of total returns for a one bond portfolio holding the on-the-run 6 month treasury bill. 1 Year T-Notes: A measure of total returns for a one bond portfolio of a single treasury with a maturity near 1 year. The index is considered representative of short term government bonds. IA SBBI 5 Year T-Notes: A measure of total returns for a one bond portfolio of a single treasury with a maturity near 5 years. The index is considered representative of intermediate term government bonds. IA SBBI 20 Year Government Bonds: A measure of total returns for a one bond portfolio of a single treasury with a maturity near 20 years. The index is considered representative of long-term government bonds.
15