Mapping the evolution of regional atrophy in Alzheimer’s disease: Unbiased analysis of fluid-registered serial MRI Rachael I. Scahill*, Jonathan M. Schott*, John M. Stevens*†, Martin N. Rossor*†, and Nick C. Fox*‡ *Dementia Research Group, Department of Clinical Neurology, Institute of Neurology, University College London, Queen Square, London WC1N 3BG, United Kingdom; and †Division of Neuroscience and Psychological Medicine, Faculty of Medicine, Imperial College of Science, Engineering and Medicine, London SW7 2AZ, United Kingdom
Alzheimer’s disease (AD) is characterized by progressive cerebral atrophy, which may be assessed by using volumetric MRI. We describe a voxel-based analysis of nonlinear-registered serial MRI to demonstrate the most statistically significant (P < 0.001) regions of change at different stages of the disease. We compared presymptomatic (n ⴝ 4), mild (n ⴝ 10), and moderately affected (n ⴝ 12) patients with early- and late-onset AD, with age- and sexmatched controls, and demonstrated increasing global atrophy with advancing disease. Significantly increased rates of hippocampal atrophy were seen in presymptomatic and mildly affected patients. There was a shift in the distribution of temporal lobe atrophy with advancing disease; the inferolateral regions of the temporal lobes showed the most significantly increased rates of atrophy by the time the patients were mildly or moderately affected. Significantly increased rates of medial parietal lobe atrophy were seen at all stages, with frontal lobe involvement occurring later in the disease. Our results suggest that the sites showing the most significant rates of atrophy alter as the disease advances, and that regional atrophy is already occurring before the onset of symptoms. This technique provides insights into the natural history of AD, and may be a valuable tool in assessing the efficacy of disease-modifying treatments, especially if these treatments were to have region-specific effects.
A
lzheimer’s disease (AD), the most common cause of dementia, is a progressive neurodegenerative condition, characterized histologically by the presence of neurofibrillary tangles and neuritic amyloid plaques (1). These microscopic changes are accompanied by progressive brain atrophy, which has been demonstrated in vivo by using volumetric MRI (2). The emergence of potentially diseasemodifying therapies for AD (3) has made both early diagnosis and monitoring of disease progression increasingly important. Postmortem studies have suggested that the sites of earliest change in AD are the medial temporal lobe structures, and in particular the entorhinal cortex and hippocampus (1). Many volumetric MRI studies in AD have focused on these regions and support their early involvement; even in mild AD the entorhinal cortex and hippocampus show volume reductions of 20–25% relative to controls (4–8). Other areas (such as the cingulate gyrus) have been assessed and implicated at early stages of the disease by using volumetric MRI (9); however, such regions are difficult to quantify reliably using conventional MRI volumetry. Functional studies have highlighted deficits in the posterior parietotemporal lobes rather than medial temporal lobe structures. Metabolic reduction has been shown in the general region of the posterior cingulate gyrus in early AD (10) and even in asymptomatic individuals at genetic risk for the disease (11–13). To date, most volumetric MRI studies in AD have been cross-sectional. Such studies have inherent problems. First, there may be considerable overlap between patients with AD and controls because of large inter-individual variability in brain volumes. Second, because of the laborious nature of regionbased manual outlining, these studies require a priori assump-
www.pnas.org兾cgi兾doi兾10.1073兾pnas.052587399
tions as to which brain areas should be assessed; such methods also involve a degree of subjectivity in the definition of structural boundaries. By contrast, longitudinal volumetric analyses, by using subjects as their own controls, reduce problems caused by inter-individual variability. Such studies have shown that change within individuals may be more sensitive at discriminating AD from normal aging, and in particular, that individual rates of global atrophy distinguish patients with AD from controls (2). Longitudinal volumetric analyses of particular brain substructures have also been used to compare patients with AD with controls, and have shown increased rates of hippocampal atrophy in AD (14), in presymptomatic patients with familial AD (15), and in subjects with mild cognitive impairment (16). However, judgements as to which substructures should be assessed are still required. There is, therefore, an increasing need for automated techniques that can accurately localize regional atrophy in an unbiased manner. Nonlinear registration of serial MRI provides a means of modeling change over the whole brain. Repeat scans can be matched onto baseline images by using voxel-level deformation fields based on a viscous fluid model (17). This technique has been validated in both AD and control subjects (18). Jacobian determinants from this model can be used to quantify volume change at the voxel level, and color overlays can be used to create voxel compression maps. We have used this technique to demonstrate changes within individuals with AD (19). This model has also been validated against manual volumetric measurements for the automated regional segmentation of serial scans (20). To determine changes that are truly disease-related, groups of individuals need to be compared by using robust statistical techniques. Statistical parametric mapping (SPM) (21) is a well-validated automated technique for performing such group comparisons. Initially applied to functional imaging, SPM has recently been used to detect cross-sectional structural differences between groups; this technique has been termed voxelbased morphometry (22). Such methodology has been used in cross-sectional studies of AD. In one study, reduction in gray matter density was shown in the medial temporal lobe, posterior cuneus, cingulate gyrus, and associated neocortical areas (23); in another, significant changes were seen in the hippocampus, insula, and caudate nucleus (24). Thompson et al. (25) describe a statistical analysis of cross-sectional three-dimensional cortical maps to identify significant areas of gray matter loss between groups of patients with AD and controls. These authors have This paper was submitted directly (Track II) to the PNAS office. Abbreviations: AD, Alzheimer’s disease; SPM, statistical parametric mapping; MMSE, mini mental state examination. See commentary on page 4135. ‡To
whom reprint requests should be addressed. E-mail:
[email protected].
The publication costs of this article were defrayed in part by page charge payment. This article must therefore be hereby marked “advertisement” in accordance with 18 U.S.C. §1734 solely to indicate this fact.
PNAS 兩 April 2, 2002 兩 vol. 99 兩 no. 7 兩 4703– 4707
NEUROBIOLOGY
Edited by Tomas Ho¨kfelt, Karolinska Institute, Stockholm, Sweden, and approved January 11, 2002 (received for review November 2, 2001)
Table 1. Subject demographics Age, years
Interval, days
Baseline MMSE,兾30
43.3 (⫾6.1)
560 (⫾173)
29.0 (⫾1.4)
40.6 (⫾5.3)
517 (⫾169)
29.6 (⫾0.5)
Mild (5 male, 5 female) 61.9 (⫾11.8) 368 (⫾82) Moderate (6 male, 6 female) 58.3 (⫾9.0) 398 (⫾184) Control group 2 (6 male, 6 59.2 (⫾11.5) 394 (⫾152) female)
24.0 (⫾1.8) 13.8 (⫾3.0) 29.6 (⫾0.7)
Group (make up) Presymptomatic (2 male, 2 female) Control group 1 (4 male, 4 female)
Numbers given as mean (⫾SD).
recently applied a similar technique, using longitudinal MR imaging, to identify altering patterns of gray matter loss during the progression of childhood schizophrenia (26). In this study we investigated longitudinal changes in regional atrophy. We used fluid registration to localize longitudinal changes within individuals, and subsequently used SPM to determine consistent changes within groups. By comparing regional volume changes in presymptomatic, mild, and moderate AD patients with matched control subjects, we were able to assess patterns of atrophy at different stages of the disease. Methods Subjects. All subjects were assessed at the Dementia Research
Group at the National Hospital for Neurology and Neurosurgery, and gave informed written consent. Ethical approval was obtained from the local ethics committee. All patients underwent comprehensive diagnostic evaluation, including clinical assessment (with a history taken from a close informant), detailed neuropsychology, and standard screening blood tests. T1- and T2-weighted MR images were acquired and reviewed by an experienced neuroradiologist. As part of the research study, all subjects underwent at least two volumetric MRI and mini mental state examination (MMSE) (27) assessments. By the end of the study, all patients fulfilled National Institute of Neurological and Communicative Disorders and Stroke and Alzheimer’s Disease and Related Disorders (NINCDS-ADRDA) diagnostic criteria for probable AD (28). Subject details are shown in Table 1. Three groups of AD subjects were examined: patients with mild AD, moderate AD, and presymptomatic individuals. The presymptomatic patients were all from kindreds with autosomal dominant early-onset familial AD; they were involved in a longitudinal research project for which they underwent annual MRI and neuropsychological assessments. During this study, four individuals exhibited early symptoms of the disease and eventually fulfilled the NINCDS-ADRDA criteria for probable AD. In this group, the earliest available scans were compared with the first scans after the onset of symptoms. Clinical details (29) and qualitative assessments of individual patterns of atrophy (19) have been described. Twenty-two subjects with established AD were investigated. We used the MMSE score at first scan to divide these subjects into 10 mild (MMSE 20–27兾30) and 12 moderate cases (MMSE 8–19兾30); there were 5 familial cases in each subgroup. A qualitative assessment of regional atrophy on 13 of these patients (7 with mild AD, 6 with moderate AD) has been published (19). Groups were compared with appropriately age-matched controls (presymptomatic AD: control group 1; mild-to-moderate AD: control group 2). MRI Acquisition and Preprocessing. Serial T1-weighted volumetric MR scans were acquired by using a 1.5-T Signa unit (General Electric Medical Systems, Milwaukee, WI) with a spoiled 4704 兩 www.pnas.org兾cgi兾doi兾10.1073兾pnas.052587399
gradient-echo technique. Imaging parameters were as follows: time to echo, 5 ms; time to repeat, 35 ms; flip angle 35°; and field of view 24 ⫻ 24 ⫻ 19.2 cm. This sequence yielded 124 contiguous 1.5-mm-thick slices, which were transferred to a Sun Enterprise 250 workstation (Sun Microsystems, Mountain View, CA) for analysis. Image processing was performed by using the MIDAS software tool (30). The brain was outlined by using a semiautomated technique. A 9 degrees of freedom registration was performed to align the repeat scan onto the baseline image (31). Fluid Registration: Detecting Change Within Individuals over Time.
The fluid registration model has been described by Freeborough and Fox (18) and used parameters outlined in Crum et al. (20). With the rigidly aligned repeat scan used as a starting point, a viscous fluid model was used to compute a deformation field throughout the image at the voxel level. This model gives an estimate of the volume change occurring at each voxel within the image. This estimate is referred to as a Jacobian value. To examine the change within individuals over time, logarithms of the Jacobian values for each voxel within the image were analyzed. Two images were created, one for voxel expansion (Jacobian values ⱖ 1) and one for voxel contraction (Jacobian values ⬍1). This separation was performed to prevent cancellation errors during smoothing. Statistical Analysis: Detecting Differences Between Groups. Analysis
was performed by using SPM99 (Wellcome Department of Cognitive Neurology, London) running in MATLAB 6 (Mathworks, Sherbourn, MA). The images were spatially normalized to a customized template in standard stereotactic space (32), after which they were convolved with a mask to exclude scalp, and smoothed with an isotropic Gaussian kernel of 8-mm full width at half maximum. A single subject condition and covariate model was used for analysis (21). The logarithm of the time interval between scans was used as a covariate, and age and sex were included as nuisance variables. An explicit mask was used to ensure that all brain voxels were included in the analysis. Significance levels were set at P ⬍ 0.001, uncorrected. Results
Regions of Expansion. The analysis revealed significant expansion
of the lateral ventricles in all three disease groups compared with controls, which increased with increasing clinical evidence of the disease (Figs. 1–3). In the mildly affected group there were significant rates of expansion in the lateral and third ventricles (Fig. 2), whereas in the moderately affected patients there was also clear expansion in perihippocampal spaces and both Sylvian fissures compared with controls (Fig. 3).
Regions of Compression. Compression images in the presymptomatic group revealed strikingly increased rates of volume loss in each hippocampus and precuneus compared with controls. There was also a small area of significantly increased volume loss within the anterior frontal lobe cortices (Fig. 4). Compression images from the mildly affected group showed significantly increased rates of volume loss to be occurring not only in the hippocampi, precuneus, and anterior frontal lobe cortices, but also in the inferior and lateral parts of the temporal lobes, and the posterior part of the cingulate gyrus (Fig. 5). At the same significance level (P ⬍ 0.001), the moderately affected group no longer showed significant rates of hippocampal atrophy compared with controls. In this group, large portions of the inferior and lateral temporal lobe structures, the posterior cingulate gyrus, precuneus, and both anterior cerebral cortices showed significantly increased rates of atrophy (Fig. 6). The areas of increasing volume loss became more extensive as the disease progressed. In all three patient groups, the left cerebral hemiScahill et al.
sphere appeared more extensively involved than the right. The cerebellum did not change significantly in any of the groups. Discussion We report a statistical assessment of disease progression in AD based on fluid-registered longitudinal MRI. Our results suggest that the sites showing the most significant rates of atrophy alter as the disease advances, and that, at least in familial AD, regional atrophy is already occurring before the onset of symptoms. Relation to Prior Findings. Our finding of significantly increased rates of expansion of cerebrospinal fluid (CSF) spaces is consistent with previous volumetric studies (33, 34). As expansion of
Fig. 2. Statistical parametric maps for mild AD (expansion images). See legend of Fig. 1 for description of color.
Scahill et al.
Fig. 3. Statistical parametric maps for moderate AD (expansion images). See legend of Fig. 1 for description of color.
CSF spaces correlates with total brain volume loss, it is reasonable to conclude that these results demonstrate increasing global atrophy with advancing disease. The presence of significantly enlarging CSF spaces in presymptomatic individuals is consistent with a previous volumetric study, which illustrated increased rates of global atrophy in preclinical patients with AD (35). By using these methods, we have been able to demonstrate changes in the localization of the most active areas of volume loss as the disease progresses. Presymptomatic individuals and mildly affected patients showed significant rates of volume loss in each hippocampus, in accordance with a previous very selective volumetric analysis (15). By contrast, in subjects with moderately severe disease, the focus of greatest rates of atrophy appears to have moved away from the medial temporal lobe structures to the inferior and lateral temporal lobe cortices. This change of focus is likely to reflect accelerating atrophy rates in the temporal neocortex. Relative decline in the rate of atrophy of the hippocampus may be due to the fact that prominent early atrophy in a small structure is likely to lead to a reduction in the rate of atrophy of that structure as the disease progresses. Indeed, several cross-sectional MRI studies have shown that hippocampal and entorhinal cortex volumes are already severely reduced by the time patients are mildly affected (4–6, 8). Our findings are also consistent with a longitudinal volumetric study by Jack et al. (14), who reported that patients with minimal cognitive impairment who subsequently developed AD had higher rates of hippocampal atrophy than patients with established AD. Our results also suggest that significant rates of atrophy are already present in some neocortical areas from the very earliest stages of the disease. We demonstrated significantly increased atrophy of the precuneus from symptom onset of the disease. In established but still mild AD, areas showing most significant change were the precuneus and adjacent posterior part of the cingulate gyrus. The moderately affected subject group showed more widely distributed increased rates of atrophy throughout the posterior region of the medial parietal lobes. Using conventional volumetric MRI, atrophy of the cingulate has been demonstrated in one study (9); to our knowledge, atrophy of the precuneus has not been shown using this technique. This may reflect the difficulties in manually defining the boundaries of these structures. Our results concur with the finding of atrophy PNAS 兩 April 2, 2002 兩 vol. 99 兩 no. 7 兩 4705
NEUROBIOLOGY
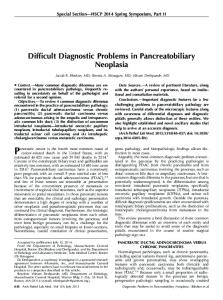
Fig. 1. Statistical parametric maps for presymptomatic AD (expansion images). In Figs. 1– 6, the color overlays show regions of statistically significant (P ⬍ 0.001) differences in rates of change compared to controls. The overlays are displayed on an averaged customized MRI template with the same sagittal, coronal and axial sections shown to facilitate comparison across groups.
Fig. 4. Statistical parametric maps for presymptomatic AD (contraction images). See legend of Fig. 1 for description of color.
Fig. 6. Statistical parametric maps for moderate AD (contraction images). See legend of Fig. 1 for description of color.
in the posterior cingulate gyrus and precuneus in a crosssectional voxel-based morphometry analysis (23). Reduced metabolism in the posterior cingulate gyrus in early AD has been reported in functional studies (10). Furthermore, positronemission tomography studies in individuals at genetic risk of AD showed consistent reductions in glucose metabolism in the parietal and temporal lobes (11–13), and in anterior frontal lobe cortices (11). These findings concur with the atrophy progression we report. Longitudinal neuropsychological studies report that memory loss precedes widespread cognitive decline in early AD (29, 36). There is increasing evidence that posterior medial parietal lobe
structures, particularly the precuneus, and the posterior cingulate also have roles in successful memory retrieval. Functional studies have implicated the precuneus in episodic memory retrieval (37), in linking new information to prior knowledge (38), and in autobiographical memory retrieval (39). The posterior cingulate also has strong reciprocal connections with both the entorhinal and parahippocampal cortices (39). It may be, therefore, that atrophy of the precuneus and posterior cingulate contribute to some of the memory deficits in early AD. Other cognitive deficits either accompany or rapidly follow the early symptoms of forgetfulness. In particular, word finding and calculation difficulties are very early features, as are subtle changes in confidence, spontaneity and orientation. These deficits may also be a consequence of early atrophy in neocortical areas. The structural changes we have illustrated were bilateral at all stages. However, there appeared to be slight preferential atrophy of the left hemisphere compared with the right, which concurs with previous MRI (15, 25) and biochemical studies (40). This observation may be caused by true excess vulnerability of the left hemisphere to the disease process. Alternatively, this observation may reflect the fact that subtle early dysfunction in the dominant temporal lobe, by producing early speech deficits, comes to the attention of patient or clinician at an earlier stage. Consistent with clinical observations, neuropathological studies (41), and cross-sectional whole-brain analyses (23, 25), we found that atrophy rates were significantly increased neither in the primary sensory nor motor cortices nor in the cerebellum.
Fig. 5. Statistical parametric maps for mild AD (contraction images). See legend of Fig. 1 for description of color. 4706 兩 www.pnas.org兾cgi兾doi兾10.1073兾pnas.052587399
Limitations of the Technique. Subject groups. A strength of the study is the fact that presymptomatic subjects were followed from before symptom onset through to the development of multiple cognitive deficits and fulfilment of a diagnosis of probable AD. However, these subjects were included by virtue of being at risk of familial AD. Therefore, some caution needs to be exercised in extrapolating our findings to the more common sporadic form of the disease. Nonetheless, we think it is likely, given very similar pathological findings in sporadic and familial cases, that these forms are likely to have a similar pattern of atrophy progression. Overall, the patients studied were generally Scahill et al.
established. We conclude that SPM analysis of fluid-registered longitudinal scans in AD shows increasing global atrophy and changing patterns of regional atrophy as the disease progresses. Measures of hippocampal change may be most useful in the earliest stages of the disease. However, the precuneus and posterior cingulate, which show significant, consistent and increasing rates of atrophy with increasing severity, may prove to be useful indices of progression throughout the course of the disease. The fluid model provides a measure of change within an individual, reducing the problem of inter-subject variability inherent in group comparisons. SPM allows automated comparison between groups of individuals, without the need for a priori judgements as to which regions should be assessed. The combination of the techniques that we describe may thus provide insights into disease progression in AD and related disorders, and may be useful for tracking progression in clinical trials of new therapies.
Implications. In this study we have examined presymptomatic, mild and moderate AD subjects, and illustrated the progression of the disease from its earliest stages to the time when it is well
We thank Dr. John Ashburner for his helpful comments regarding the SPM analysis. This work is supported by United Kingdom Medical Research Council Program Grant G9626876. R.S. holds an Alzheimer’s Research Trust Ph.D. scholarship, and N.F. holds a Medical Research Council Clinician Scientist Fellowship.
Braak, H. & Braak, E. (1991) Acta Neuropathologica 82, 239–259. Fox, N. C., Freeborough, P. A. & Rossor, M. N. (1996) Lancet 348, 94–97. Kelly, C. A., Harvey, R. J. & Cayton, H. (1997) Br. Med. J. 314, 693–694. Jack, C. R., Petersen, R. C., Xu, Y. C., Waring, S. C., O’Brien, P. C., Tangalos, E. G., Smith, G. E., Ivnik, R. J. & Kokmen, E. (1997) Neurology 49, 786–794. Lehericy, S., Baulac, M., Chiras, J., Pierot, L., Martin, N., Pillon, B., Deweer, B., Dubois, B. & Marsault, C. (1994) Am. J. Neuroradiol. 15, 929–937. Juottonen, K., Laakso, M. P., Partanen, K. & Soininen, H. (1999) Am. J. Neuroradiol. 20, 139–144. Bobinski, M., de Leon, M. J., Wegiel, J., Desanti, S., Convit, A., Saint Louis, L. A., Rusinek, H. & Wisniewski, H. M. (2000) Neuroscience 95, 721–725. Xu, Y., Jack, C. R., Jr., O’Brien, P. C., Kokmen, E., Smith, G. E., Ivnik, R. J., Boeve, B. F., Tangalos, R. G. & Petersen, R. C. (2000) Neurology 54, 1760–1767. Killiany, R. J., Gomez-Isla, T., Moss, M., Kikinis, R., Sandor, T., Jolesz, F., Tanzi, R., Jones, K., Hyman, B. T. & Albert, M. S. (2000) Ann. Neurol. 47, 430–439. Minoshima, S., Giordani, B., Berent, S., Frey, K. A., Foster, N. L. & Kuhl, D. E. (1997) Ann. Neurol. 42, 85–94. Reiman, E. M., Caselli, R. J., Yun, L. S., Chen, K., Bandy, D., Minoshima, S., Thibodeau, S. N. & Osborne, D. (1996) N. Engl. J. Med. 334, 752–758. Kennedy, A. M., Rossor, M. N. & Frackowiak, R. J. S. (1995) Alzheimer Dis. Assoc. Disord. 9, 17–20. Small, G. W., Ercoli, L. M., Silverman, D. H., Huang, S.-C., Komo, S., Bookheimer, S. Y., Lavretsky, H., Miller, K., Siddarth, P., Rasgon, N. L., et al. (2000) Proc. Natl. Acad. Sci. USA 97, 6037–6042. Jack, C. R., Petersen, R. C., Xu, Y., O’Brien, P. C., Smith, G. E., Ivnik, R. J., Boeve, B. F., Tangalos, E. G. & Kokmen, E. (2000) Neurology 55, 484–489. Fox, N. C., Warrington, E. K., Freeborough, P. A., Hartikainen, P., Kennedy, A. M., Stevens, J. M. & Rossor, M. N. (1996) Brain 119, 2001–2007. Jack, C. R., Petersen, R. C., Xu, Y. C., O’Brien, P. C., Smith, G. E., Ivnik, R. J., Boeve, B. F., Waring, S. C., Tangalos, E. G. & Kokmen, E. (1999) Neurology 52, 1397–1403. Christensen, G. E., Rabbitt, R. D. & Miller, M. I. (1996) IEEE Trans. Image Proc. 5, 1435–1447. Freeborough, P. A. & Fox, N. C. (1998) J. Comput. Assist. Tomogr. 22, 838–843. Fox, N. C., Crum, W. R., Scahill, R. I., Stevens, J. M., Janssen, J. C. & Rossor, M. N. (2001) Lancet 358, 201–205. Crum, W. R., Scahill, R. I. & Fox, N. C. (2001) Neuroimage 13, 847–855. Friston, K. J., Holmes, A. P., Worsley, K. J., Poline, J.-P., Frith, C. D. & Frackowiak, R. S. J. (1995) Hum. Brain Mapp. 2, 189–210.
22. Ashburner, J. & Friston, K. J. (2000) Neuroimage 11, 805–821. 23. Baron, J. C., Chetelat, G., Desgranges, B., Perchey, G., Landeau, B., De La Sayette, V. & Eustache, F. (2001) Neuroimage 14, 298–309. 24. Rombouts, S. A., Barkhof, F., Witter, M. P. & Scheltens, P. (2000) Neurosci. Lett. 285, 231–233. 25. Thompson, P. M., Mega, M. S., Woods, R. P., Zoumalan, C. I., Lindshield, C. J., Blanton, R. E., Moussai, J., Holmes, C. J., Cummings, J. L. & Toga, A. W. (2001) Cereb. Cortex 11, 1–16. 26. Thompson, P. M., Vidal, C., Giedd, J. N., Gochman, P., Blumenthal, J., Nicolson, R., Toga, A. W. & Rapoport, J. L. (2001) Proc. Natl. Acad. Sci. USA 98, 11650–11655. 27. Folstein, M., Folstein, S. & McHughs, P. (1975) J. Psychiatr. Res. 12, 189–198. 28. McKhann, G., Drachman, D., Folstein, M., Katzman, R., Price, D. & Stadlan, E. M. (1984) Neurology 34, 939–944. 29. Fox, N. C., Warrington, E. K., Seiffer, A. S., Agnew, S. K. & Rossor, M. N. (1998) Brain 121, 1631–1639. 30. Freeborough, P. A., Fox, N. C. & Kitney, R. I. (1997) Comput. Methods Prog. Biomed. 53, 15–25. 31. Freeborough, P. A., Woods, R. P. & Fox, N. C. (1996) J. Comput. Assist. Tomogr. 20, 1012–1022. 32. Talairach, J. & Tournoux, P. (1988) Co-planar Stereotaxic Atlas of the Human Brain (Thieme, Stuttgart). 33. DeCarli, C., Haxby, J. V., Gillette, J. A., Teichberg, D., Rapoport, S. I. & Schapiro, M. B. (1992) Neurology 42, 2029–2036. 34. Shear, P. K., Sullivan, E. V., Mathalon, D. H., Lim, K. O., Davis, L. F., Yesavage, J. A., Tinklenberg, J. R. & Pfefferbaum, A. (1995) Arch Neurol. 52, 392–402. 35. Fox, N. C., Warrington, E. K. & Rossor, M. N. (1999) Lancet 353, 2125. 36. Linn, R. T., Wolf, P. A., Bachman, D. L., Knoefel, J. E., Cobb, J. L., Belanger, A. J., Kaplan, E. F. & D’Agostino, R. B. (1995) Arch Neurol. 52, 485–490. 37. Krause, B. J., Schmidt, D., Mottaghy, F. M., Taylor, J., Halsband, U., Herzog, H., Tellmann, L. & Muller-Gartner, H. W. (2001) Brain 122, 255–263. 38. Maguire, E. A., Frith, C. D. & Morris, R. M. (1999) Brain 122, 1839–1850. 39. Maddock, R. J., Garrett, A. S. & Buonocore, M. H. (2001) Neuroscience 104, 667–676. 40. Rossor, M. N., Garrett, N. J., Johnson, A. L., Mountjoy, C. Q., Roth, M. & Iversen, L. L. (1982) Brain 105, 313–330. 41. Braak, H. & Braak, E. (1997) Neurobiol. Aging 18, S85–S88.
1. 2. 3. 4. 5. 6. 7. 8. 9. 10. 11. 12. 13. 14. 15. 16. 17. 18. 19. 20. 21.
Scahill et al.
PNAS 兩 April 2, 2002 兩 vol. 99 兩 no. 7 兩 4707
NEUROBIOLOGY
younger than many AD cohorts. Although this means that our findings may not necessarily apply to older patients, it does limit the possibility that comorbidity (such as vascular load) may be influencing the results. Technical aspects. Possible sources of error may be related to the analysis techniques. The SPM protocol aims to compare the same anatomical regions between groups. Any variability between individuals reduces the sensitivity of a statistical technique designed to detect consistent group changes. One potential source of such increased variability is that as atrophy progresses, there may be increasing variability in both the shape of a particular structure (e.g., the hippocampus) and its anatomical position relative to neighboring structures. Small, irregularly shaped structures, with large surface-area-to-volume ratios, are also more likely to be affected by inaccuracies caused by smoothing. For these reasons, large, relatively anatomically invariant structures (e.g., the lateral ventricles) are more likely to show statistically significant change than smaller structures with more variable positions (e.g., perihippocampal spaces).