Summary for Policymakers
2005 Environmental Sustainability Index Benchmarking National Environmental Stewardship
Yale Yale Center Center for for Environmental Environmental Law Law and and Policy Policy Yale Yale University University Center Center for for International International Earth Earth Science Science Information Information Network Network Columbia Columbia University University
In In collaboration collaboration with: with: World World Economic Economic Forum Forum Geneva, Geneva, Switzerland Switzerland Joint Joint Research Research Centre Centre of of the the European European Commission Commission Ispra, Ispra, Italy Italy
Executive Executive Summary Summary The 2005 Environmental Sustainability Index (ESI) benchmarks the ability of nations to protect the environment over the next several decades. It does so by integrating 76 data sets – tracking natural resource endowments, past and present pollution levels, environmental management efforts, and a society’s capacity to improve its environmental performance – into 21 indicators of environmental sustainability. These indicators permit comparison across the following five fundamental components of sustainability: Environmental Systems; Environmental Stresses; Human Vulnerability to Environmental Stresses; Societal Capacity to Respond to Environmental Challenges; and Global Stewardship. The issues reflected in the indicators and the underlying variables were chosen through an extensive review of the environmental literature, assessment of available data, rigorous analysis, and broad-based consultation with policymakers, scientists, and indicator experts. The ESI provides a powerful environmental decisionmaking tool tracking national environmental performance and facilitating
comparative policy analysis. It enables a more data-driven and empirical approach to policymaking. While absolute measures of sustainability remain elusive, many aspects of environmental sustainability can be measured on a relative basis with results that provide a context for policy evaluations and judgments. Such comparisons are especially important in the new context of worldwide efforts to advance the environmentrated aspects of the Millennium Development Goals. Higher ESI scores suggest better environmental stewardship. The five highest-ranking countries are Finland, Norway, Uruguay, Sweden, and Iceland – all countries that have substantial natural resource endowments, low population density, and have managed the challenges of development with some success. The lowest ranking countries are North Korea, Iraq, Taiwan, Turkmenistan, and Uzbekistan. These countries face numerous issues, both natural and manmade, and have not managed their policy choices well.
A number of core policy conclusions emerge from the ESI analysis: • The ESI provides a valuable tool for benchmarking environmental stewardship and permits comparative policy analysis. • Environmental stewardship demands attention to a wide range of pollution control and natural resource management issues. • Developing and developed countries face distinct environmental challenges – the pollution pressures of industrialization on one hand and the stresses of poverty and incapacity on the other. • Economic success contributes to the potential of environmental success but does not guarantee it. Environmental stewardship depends on both policy efforts and a society’s over-arching social, political, and economic systems. • While it appears that no country is on a fully sustainable trajectory, at every level of development, some countries are managing their environmental challenges better than others. • Measures of governance, including the rigor of regulation and the degree of cooperation with international policy efforts, correlate highly with overall environmental success. This result suggests that emphasis on good governance may be justified. • The lack of reliable data to measure performance on a number of issues and across many countries hinders attempts to move toward more data-driven and empirical decisionmaking.
Environmental Environmental Sustainability Sustainability Index Index –– Rankings Rankings and and Scores Scores
ES I Country Name Rank 1
ES I S core
NonOECD OECD Rank Rank
Finland
75.1
1
2
Norway
73.4
2
3
Uruguay
71.8
4
S weden
71.7
5
Iceland
6
Canada
ES I Country Name Rank
NonES I OECD OECD S core Rank Rank
ES I Country Name Rank
NonES I OECD OECD S core Rank Rank
50
Cameroon
52.5
32
99
Azerbaijan
45.4
73
Kenya
45.3
74
51
Ecuador
52.4
33
100
52
Laos
52.4
34
101 India
45.2
3
53
Cuba
52.3
35
102
P oland
45.0
70.8
4
54
Hungary
52.0
103
Niger
45.0
76
64.4
5
55
Tunis ia
51.8
36
104
Chad
45.0
77
6
56
Georgia
51.5
37
105
Morocco
44.8
78
57
Uganda
51.3
38
106
Rwanda
44.8
79
7
S witzerland
63.7
8
Guyana
62.9
9
Argentina
62.7
10
Aus tria
62.7
1
2 3 7
19
75 27
58
Moldova
51.2
39
107
Mozambique
44.8
80
59
S enegal
51.1
40
108
Ukraine
44.7
81
11
Brazil
62.2
4
60
Zambia
51.1
41
109
J amaica
44.7
82
12
Gabon
61.7
5
61
Bos nia & Herze.
51.0
42
110
United Arab Em.
44.6
83
13
Aus tralia
61.0
8
62
Is rael
50.9
43
111
Togo
44.5
14
New Zealand
60.9
9
63
Tanzania
50.3
44
112
Belgium
44.4
15
Latvia
60.4
6
64
Madagas car
50.2
45
113
Dem. Rep. Congo
44.1
16
P eru
60.4
7
65
Nicaragua
50.2
17
P araguay
59.7
8
66
United Kingdom
50.2
20 21
46
84 28 85
114
Banglades h
44.1
86
115
Egypt
44.0
87
18
Cos ta Rica
59.6
9
67
Greece
50.1
19
Croatia
59.5
10
68
Cambodia
50.1
20
Bolivia
59.5
21
Ireland
59.2
22
Lithuania
58.9
23
Colombia
58.9
13
72
24
Albania
58.8
14
73
25
Central Afr. Rep.
58.7
15
74
26
Denmark
58.2
75
27
Es tonia
58.2
16
28
P anama
57.7
29
S lovenia
57.5
30
J apan
57.3
12
79
S ri Lanka
48.5
56
128
Zimbabwe
41.2
99
31
Germany
56.9
13
80
Kyrgyzs tan
48.4
57
129
Lebanon
40.5
100
32
Namibia
56.7
19
81
Guinea
48.1
58
130
Burundi
40.0
101
33
Rus s ia
56.1
20
82
Venezuela
48.1
59
131 P akis tan
39.9
102
34
Bots wana
55.9
21
83
Oman
47.9
60
132
Iran
39.8
103
35
P . N. Guinea
55.2
22
84
J ordan
47.8
61
133
China
38.6
104
36
France
55.2
14
85
Nepal
47.7
62
134
Tajikis tan
38.6
105
37
P ortugal
54.2
15
86
Benin
47.5
63
135
Ethiopia
37.9
106
38
Malays ia
54.0
23
87
Honduras
47.4
64
136
S audi Arabia
37.8
107
39
Congo
53.8
24
88
Côte d'Ivoire
47.3
65
137
Yemen
37.3
108
40
Mali
53.7
25
89
S erbia & Mont.
47.3
66
138
Kuwait
36.6
109
41
Netherlands
53.7
90
Macedonia
47.2
67
139
Trinidad & Tob.
36.3
110
42
Chile
53.6
26
91
Turkey
46.6
24
140
S udan
35.9
111
43
Bhutan
53.5
27
92
Czech Rep.
46.6
25
141 Haiti
34.8
112
44
Armenia
53.2
93
S outh Africa
46.2
68
142
Uzbekis tan
34.4
113
45
United S tates
52.9
94
Romania
46.2
69
143
Iraq
33.6
114
46
Myanmar
52.8
29
95
Mexico
46.2
47
Belarus
52.8
30
96
Algeria
46.0
48
S lovakia
52.8
97
Burkina Fas o
49
Ghana
52.8
31
98
Nigeria
11
116
Guatemala
44.0
88
47
117
S yria
43.8
89 90
69
Italy
50.1
118
El S alvador
43.8
70
Bulgaria
50.0
48
119
Dominican Rep.
43.7
91
71
Mongolia
50.0
49
120
S ierra Leone
43.4
92
Gambia
50.0
50
121 Liberia
43.4
Thailand
49.7
51
122
S outh Korea
43.0
Malawi
49.3
52
123
Angola
42.9
Indones ia
48.8
53
124
Mauritania
42.6
95
76
S pain
48.8
125
Libya
42.3
96
17
77
Guinea-Bis s au
48.6
54
126
P hilippines
42.3
97
18
78
Kazakhs tan
48.6
55
127
Viet Nam
42.3
98
10 12
11
16
28 17
18
22
23
26
93 29 94
144
Turkmenis tan
33.1
115
70
145
Taiwan
32.7
116
45.7
71
146
North Korea
29.2
117
45.4
72
Note: The 2005 ESI scores are not directly comparable to the 2002 ESI scores. See Appendix A for details on methodological changes.
Constructing the ESI
76 Variables
The ESI is the equally weighted average of these 21 indicators*
21 Indicators
5 components
ESI Score
Components group indicator values into five thematic categories
Environmental Sustainability Index Country Scores by Quintile
*Note: While the equal weighting of the indicators has some affect on ESI Scores, sensitivity analysis demonstrates the relative robustness of the ESI structure.
76 Variables
21 Indicators
•Nitrogen dioxide concentration •Sulfur dioxide concentration
•Particulates concentration •Indoor air quality
Air Quality
•Ecoregions at risk •Threatened birds •Threatened mammals
•Threatened amphibians •National Biodiversity Index
Biodiversity
•Wilderness area
•Developed area
•Dissolved oxygen •Electrical conductivity
•Suspended solids •Phosphorus concentration
•Surface water availability
•Groundwater availability
•Coal consumption •Nitrogen oxide emissions •Sulfur dioxide emissions
•VOC emissions •Vehicles in use
•Forest cover change
•Acidification
•Population growth
•Total Fertility Rate
Reducing Population Pressures
•Ecological Footprint •Waste recycling rates
•Hazardous waste
Reducing Waste & Consumption Pressures
•Industrial organic effluents •Fertilizer consumption
•Pesticide consumption •Water stress
•Overfishing •Sustainably managed forests •Market distortions
•Salinization due to irrigation •Agricultural subsidies
•Deaths from waterborne diseases •Deaths from respiratory infections in children •Child mortality rate
Land
Water Quantity Reducing Air Pollution
Reducing Ecosystem Stress
Natural Resource Management
Environmental Health
•Deaths from environmental disaster vulnerability
•Natural hazard exposure
Environment-related natural disaster exposure
•Gasoline price •Corruption •Government effectiveness •Protected area •Environmental governance •Strength of rule of law •Local Agenda 21 initiatives
•Civil and political liberties •Sustainable development data gaps •International environmental engagement •Environmental knowledge creation •Democratic institutions
Environmental Governance
•Energy consumption/ GDP
•Renewable energy production
Eco-efficiency
•Corporate sustainability (Dow Jones) •Corporate sustainability (Innovest) •ISO 14001 certified companies
•ISO 14001 certified companies •Private sector environmental innovation •Responsible Care participation
Private Sector Responsiveness
•Innovation capacity •Digital Access •Female primary education
•University enrollments •Research scientists
•Intergovernmental environmental activities •Role in international environmental aid
•Participation in international environmental agreements
•Polluting-goods imports
Reducing Stresses
Reducing Water Stress
•Safe drinking water supply
•Transboundary sulfur dioxide spillovers
Environmental Systems
Water Quality
•Malnutrition
•Greenhouse gas emissions / GDP •Greenhouse gas emissions / capita
5 Components
Basic Human Sustenance
Reducing Human Vulnerability
Social and Institutional Capacity
Science and Technology
Participation in International Collaborative Efforts
Greenhouse Gas Emissions Reducing Transboundary Environmental Pressures
Global Stewardship
Cluster Analysis ESI Characteristic-Based Country Groupings
The ESI offers a mechanism for establishing “peer groups” of countries for the purpose of benchmarking environmental performance. The cluster analysis provides a statistically derived set of seven groupings that links countries based on their environmental characteristics. The clusters facilitate comparative analysis that helps to highlight leaders and laggards on an issue-by-issue basis and permits countries to gauge relative performance and identify best practices.
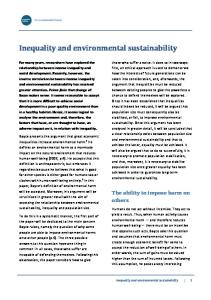
ESI – GDP Relationship
Critical Role of Governance
At every level of development some countries handle their pollution control and natural resource management issues better than others. Countries above the regression line show results that exceed income-based expectations; those below the line are underperforming given their level of development.
R2=0.23
80
FIN URY
60
NZL
CAF
AUS DNK
SVN
PNG
PRT
ESI
NLD
HUN
IRL
USA
GBR
50
BEL
KOR IRN
40
TTO UZB
TKM
Civil and political liberties
0.59
World Economic Forum Survey on environmental governance
0.54
Government effectiveness
0.51
Political institutions
0.50
Participation in international environmental agreements
0.49
ISL
CHE
ARG
Correlation Coefficient
NOR
SWE
70 GUY BRA
Variables Most Highly Correlated with the ESI
The top five correlations all reflect elements of governance, including variables related to domestic political structure, regulatory effectiveness, and engagement in global-scale environmental efforts. Although these results do not prove a causal relationship, they suggest that the recent policy emphasis placed on good governance may be justified.
TWN
30 0
10000
ARG: Argentina AUS: Australia BEL: Belgium BRA: Brazil CAF: Central Afr. Rep CHE: Switzerland DNK: Denmark FIN: Finland GBR: United Kingdom GUY: Guyana
20000
HUN: Hungary IRL: Ireland IRN: Iran ISL: Iceland KOR: South Korea NLD: Netherlands NOR: Norway NZL: New Zealand PNG: P. N. Guinea PRT: Portugal
30000
40000
SWE: Sweden SVN: Slovenia TKM: Turkmenistan TTO: Trinidad & Tobago TWN: Taiwan URY: Uruguay USA: United States UZB: Uzbekistan Not Labeled: 107 countries
The full ESI Report, including methodological appendices and all data, is available at:
www.yale.edu/esi An interactive version of the ESI permitting the user to adjust the weighting of the indicators is under development.
The ESI in action… “As a conceptual framework and analytic tool, the Environmental Sustainability Index has now been introduced to the policymaking discourse in the Philippines. As Chair of the Committee on Ecology in the House of Representatives, I have called on the government to be more serious about measuring the efficacy of programs and policies -- and the ESI provides a way to benchmark our performance and identify successful strategies." Neric Acosta Congressman and Chair of the Committee on Ecology Manila, The Philippines
Yale Yale Center Center for for Environmental Environmental Law Law and and Policy Policy Yale Yale University University 205 205 Prospect Prospect Street Street New NewHaven, Haven, CT CT 06511 06511 USA USA (1-203) (1-203) 432-3123 432-3123 Fax Fax(1-203) (1-203) 432-6597 432-6597
[email protected] [email protected] www.yale.edu/envirocenter www.yale.edu/envirocenter
Center Center for for International International Earth Earth Science Science Information Information Network Network Columbia University Columbia University
PO PO Box Box 1000 1000 61 61 Route Route 9W 9W Palisades, Palisades, NY NY 10964 10964 USA USA (1-845) (1-845) 365-8988 365-8988 Fax Fax(1-845) (1-845) 365-8922 365-8922
[email protected] [email protected] www.ciesin.columbia.edu www.ciesin.columbia.edu
World World Economic Economic Forum Forum 91-93 91-93 route route de de la la Capite Capite 1223 1223 Cologny/Geneva Cologny/Geneva Switzerland Switzerland (41-22) (41-22) 869-1212 869-1212 Fax Fax(41-22) (41-22) 786-2744 786-2744 www.weforum.org www.weforum.org
[email protected] [email protected]
Joint Joint Research Research Centre Centre of of the the European European Commission Commission
Enrico Enrico Fermi Fermi 11 TP TP 361, 361, 21020 21020 Ispra Ispra Italy Italy (39-0332)-785287 (39-0332)-785287 Fax Fax(39-0332)-785733 (39-0332)-785733
[email protected] [email protected] www.jrc.cec.eu.int/uasa/home.asp www.jrc.cec.eu.int/uasa/home.asp
For a copy of the complete 2005 ESI Report, visit:
www.yale.edu/esi