Document of
The World Bank Report No.: 97131
PROJECT PERFORMANCE ASSESSMENT REPORT NICARAGUA EDUCATION PROJECT (IDA-39780; TF-53991; TF-57311)
June 12, 2015
IEG Public Sector Evaluation Independent Evaluation Group
ii
Currency Equivalents (annual averages) Currency Unit = Córdoba (C$) 2005 2006 2007 2008 2009 2010 2011 2012
US$1.00 US$1.00 US$1.00 US$1.00 US$1.00 US$1.00 US$1.00 US$1.00
C$16.70 C$17.60 C$18.40 C$19.40 C$20.30 C$21.40 C$22.40 C$23.50
Abbreviations and Acronyms AM CAS CPS DCA EFA-FTI EGRA EGMA ESS GER GPE HIPC IBRD ICR IEG IEGPS IADB IDA IERR INDEC INIDE JICA LLECE M&E MECD MINED MINSA MoE NER NERA PAD PAPSE PASEN I PASEN II PDO POA PREAL
Aide Memoire Country Assistance Strategy Country Partnership Strategy Development Credit Agreement Education for All – Fast Track Initiative Early Grade Reading Assessment Early Grade Math Assessment Education Sector Strategy Gross Enrollment Rate Global Partnership in Education Heavily Indebted Poor Country International Bank for Reconstruction and Development Implementation Completion and Results Report Independent Evaluation Group IEG Public Sector Evaluation Inter-American Development Bank International Development Association Internal Economic Rate of Return National Institute of Statistics and Censuses (Instituto Nacional de Estadísticas y Censos) National Institute of Development Information (Instituto Nacional de Información de Desarrollo) Japan International Cooperation Agency American Laboratory for Assessment of the Quality of Education Monitoring and Evaluation Ministry of Education, Culture and Sports (until 2007) Ministry of Education (from 2007 onward) Ministry of Health Ministry of Education (denomination used to refer to both MECD and MINED) Net Enrollment Rate Adjusted Net Enrollment Rate Project Appraisal Document Budget Support Program in the Education Sector (Programa de Apoyo Presupuestario Sectorial para la Educación) First Education Sector Support Project Second Education Sector Support Project Project Development Objective Annual Operation Plan (Plan Operativo Annual) Partnership for Educational Revitalization in the Americas
PROASE PROSEN PPAR SWAP SERCE TERCE TEPCE UNESCO
Education Sector Support Programme Education Sector Support Project Project Performance Assessment Report Sector-Wide Approach Second Regional Comparative and Explanatory Study Third Regional Comparative and Explanatory Study Educational Evaluation, Planning and Training Workshop United Nations Educational, Scientific and Cultural Organization
Fiscal Year Government:
January 1 – December 31
Director-General, Independent Evaluation Director, IEG Public Sector Evaluation Manager, IEG Public Sector Evaluation Task Manager PPAR Author
: : : : :
Mr. Richard G. Scobey (Acting) Mr. Marvin Taylor-Dormond (Acting) Mr. Mark Sundberg Mr. Erik A. Bloom Ms. Cecilia Zanetta
v
Contents Principal Ratings ............................................................................................................... vii Key Staff Responsible....................................................................................................... vii Preface................................................................................................................................ ix Summary ............................................................................................................................ xi 1. Background and Context................................................................................................. 1 Socio Economic and Political Context in Nicaragua ...................................................... 1 2. Objectives, Design, and their Relevance ........................................................................ 3 Project Development Objectives..................................................................................... 3 Relevance of Objectives ................................................................................................. 5 Project Design ................................................................................................................. 6 Relevance of Design ....................................................................................................... 6 3. Implementation ............................................................................................................... 9 4. Achievement of the Objectives ..................................................................................... 10 Objective 1 .................................................................................................................... 10 Objective 2 .................................................................................................................... 13 Objective 3 .................................................................................................................... 16 Objective 4 .................................................................................................................... 20 Objective 5 .................................................................................................................... 23 5. Efficiency ...................................................................................................................... 24 6. Ratings .......................................................................................................................... 26 Outcome ........................................................................................................................ 26 Risk to Development Outcome ..................................................................................... 27 Bank Performance ......................................................................................................... 28 Borrower Performance .................................................................................................. 30 Monitoring and Evaluation Implementation ................................................................. 32 7. Lessons .......................................................................................................................... 33 References ......................................................................................................................... 35 Annex A. Basic Data Sheet ............................................................................................... 37 Annex B. Additional Tables ............................................................................................. 40 Annex C. List of Persons Met ........................................................................................... 43 Annex D. Borrower Comments ........................................................................................ 45 This report was prepared by Erik A. Bloom and Maria Cecilia Zanetta, who assessed the project in July 2014. The report was peer reviewed by Susan Ann Cáceres and panel reviewed by Judyth L. Twigg. Viktoriya Yevsyeyeva provided administrative support.
vi
Tables Table 2.1. Original and Revised PDOs and Corresponding Activities Supported under the Project ................................................................................................................................. 8 Table 4.1. PASEN I’s Actions Contributing toward Increased Enrollment ..................... 11 Table 4.2. PASEN I’s Actions Contributing toward Increased Quality of Learning ....... 14 Table 4.3. PASEN I’s Actions Contributing toward the Development of a Learning Assessment System ........................................................................................................... 15 Table 4.4. Summary Results from National Assessment Tests, 2009-2010 ..................... 16 Table 4.5. PASEN I’s Actions Contributing toward Enabling Conditions of Governance ........................................................................................................................................... 17 Table 4.6. Governance and Accountability System before and after 2007 ...................... 20 Table 4.7. PASEN I’s Actions Contributing toward Harmonized Donor Assistance ...... 21 Table 4.8. PASEN I’s Actions Contributing toward Improved Institutional Management Capacity ............................................................................................................................ 23 Table 6.1. PASEN I’s Overall Outcome ........................................................................... 27
Figures Figure 4.1. Net Enrollment for Preschool, Primary and Secondary Education, 2004-2011 ........................................................................................................................................... 12 Figure 4.2. Dropout Rates for Pre-school, Primary and Secondary Education, 2004-2011 ........................................................................................................................................... 12 Figure 4.3. Repetition and Completion Rates for Primary and Secondary Education, 2004-2011 ......................................................................................................................... 13 Figure 4.4. MoE’s Budget Execution by Type of Expenditure and Source of financing, 2004-2011 ......................................................................................................................... 24
vii
Principal Ratings ICR* Moderately Satisfactory
ICR Review* Moderately Unsatisfactory
PPAR Moderately Satisfactory
Moderate
Moderate
Moderate
Bank Performance
Moderately Satisfactory
Moderately Unsatisfactory
Moderately Satisfactory
Borrower Performance
Moderately Satisfactory
Moderately Unsatisfactory
Moderately Satisfactory
Outcome Risk to Development Outcome
* The Implementation Completion Report (ICR) is a self-evaluation by the responsible Bank department. The ICR Review is an intermediate IEGWB product that seeks to independently verify the findings of the ICR.
Key Staff Responsible Project Appraisal Completion
Suhas D. Pandekar
Division Chief/ Sector Director Eduardo Vélez Bustillo
Michael Drabble
Chingboon Lee
Task Manager/Leader
Country Director Jane Armitage Carlos Felipe Jaramillo
viii
IEG Mission: Improving World Bank Group development results through excellence in evaluation. About this Report The Independent Evaluation Group assesses the programs and activities of the World Bank for two purposes: first, to ensure the integrity of the Bank’s self-evaluation process and to verify that the Bank’s work is producing the expected results, and second, to help develop improved directions, policies, and procedures through the dissemination of lessons drawn from experience. As part of this work, IEG annually assesses 20-25 percent of the Bank’s lending operations through field work. In selecting operations for assessment, preference is given to those that are innovative, large, or complex; those that are relevant to upcoming studies or country evaluations; those for which Executive Directors or Bank management have requested assessments; and those that are likely to generate important lessons. To prepare a Project Performance Assessment Report (PPAR), IEG staff examine project files and other documents, visit the borrowing country to discuss the operation with the government, and other in-country stakeholders, and interview Bank staff and other donor agency staff both at headquarters and in local offices as appropriate. Each PPAR is subject to internal IEG peer review, Panel review, and management approval. Once cleared internally, the PPAR is commented on by the responsible Bank department. The PPAR is also sent to the borrower for review. IEG incorporates both Bank and borrower comments as appropriate, and the borrowers' comments are attached to the document that is sent to the Bank's Board of Executive Directors. After an assessment report has been sent to the Board, it is disclosed to the public. About the IEG Rating System for Public Sector Evaluations IEG’s use of multiple evaluation methods offers both rigor and a necessary level of flexibility to adapt to lending instrument, project design, or sectoral approach. IEG evaluators all apply the same basic method to arrive at their project ratings. Following is the definition and rating scale used for each evaluation criterion (additional information is available on the IEG website: http://worldbank.org/ieg). Outcome: The extent to which the operation’s major relevant objectives were achieved, or are expected to be achieved, efficiently. The rating has three dimensions: relevance, efficacy, and efficiency. Relevance includes relevance of objectives and relevance of design. Relevance of objectives is the extent to which the project’s objectives are consistent with the country’s current development priorities and with current Bank country and sectoral assistance strategies and corporate goals (expressed in Poverty Reduction Strategy Papers, Country Assistance Strategies, Sector Strategy Papers, Operational Policies). Relevance of design is the extent to which the project’s design is consistent with the stated objectives. Efficacy is the extent to which the project’s objectives were achieved, or are expected to be achieved, taking into account their relative importance. Efficiency is the extent to which the project achieved, or is expected to achieve, a return higher than the opportunity cost of capital and benefits at least cost compared to alternatives. The efficiency dimension generally is not applied to adjustment operations. Possible ratings for Outcome: Highly Satisfactory, Satisfactory, Moderately Satisfactory, Moderately Unsatisfactory, Unsatisfactory, Highly Unsatisfactory. Risk to Development Outcome: The risk, at the time of evaluation, that development outcomes (or expected outcomes) will not be maintained (or realized). Possible ratings for Risk to Development Outcome: High, Significant, Moderate, Negligible to Low, Not Evaluable. Bank Performance: The extent to which services provided by the Bank ensured quality at entry of the operation and supported effective implementation through appropriate supervision (including ensuring adequate transition arrangements for regular operation of supported activities after loan/credit closing, toward the achievement of development outcomes. The rating has two dimensions: quality at entry and quality of supervision. Possible ratings for Bank Performance: Highly Satisfactory, Satisfactory, Moderately Satisfactory, Moderately Unsatisfactory, Unsatisfactory, Highly Unsatisfactory. Borrower Performance: The extent to which the borrower (including the government and implementing agency or agencies) ensured quality of preparation and implementation, and complied with covenants and agreements, toward the achievement of development outcomes. The rating has two dimensions: government performance and implementing agency(ies) performance. Possible ratings for Borrower Performance: Highly Satisfactory, Satisfactory, Moderately Satisfactory, Moderately Unsatisfactory, Unsatisfactory, Highly Unsatisfactory.
ix
Preface This is a Project Performance Assessment Report (PPAR) focusing on Nicaragua’s Education Project. This project was financed through IDA Credit No. 3978 in the amount of US$15.0 million equivalent and a planned Government contribution of US$0.7 million equivalent. The credit was approved on September 2, 2004 and became effective on March 17, 2005. It was restructured on June 30, 2008 and was closed on June 30, 2011, three years after the original closing date. This PPAR was prepared by Cecilia Zanetta, IEG consultant who finalized the PPAR with the support of Erik Bloom (TTL) and Mark Sundberg (Manager). A three-day mission to Washington, D.C. was conducted on July 16-18, 2014 during which the consultant met with Bank management and staff that had participated in the Project. In addition, a one-week mission to Nicaragua was conducted on July 21-25, 2014. The mission met with current and former education authorities, as well as school administrators, teachers, and parents in the three schools that were visited. A list of persons met is presented in Annex B. The mission also examined: i) World Bank project files; ii) project-related reporting and evaluation; and iii) education studies with data by government and other Development Partners (DPs); as well as relevant research literature. The IEG team gratefully acknowledges the logistical assistance and support of the staff in the Managua Office of the World Bank for expediting and supporting the work of the mission. Ministry officials were generous with their time and in arranging visits to project sites. Following standard IEG procedures, a copy of the draft PPAR was sent to the relevant government officials and agencies for their review and feedback, and comments received from the Government have been included in Annex D.
xi
Summary This report assesses the development effectiveness of Nicaragua’s Education Project, which was approved on September 2, 2004 for total cost of US$15.7 million equivalent financed by an International Development Association (IDA) credit of US$15.0 million equivalent with the rest financed by the Government. Nicaragua is a low-income country with per capita income of around US$1,780 in 2013. Its population of 6.08 million grows at about 1.5 percent per year. Nicaragua is still one of Latin America’s least developed countries. Poverty, although declining steadily in recent years, remains high and more than 80 percent of Nicaragua’s poor live in rural areas, many in remote communities where access to basic services is still a daily challenge. The country’s economy, once besieged by political turmoil and still vulnerable to natural hazards, has been growing on average with Latin America over the past decade. Nicaragua has made substantial strides toward improving education outcomes. Illiteracy rates have decreased from 18.8 percent in 2005 to 10.5 percent in 2010-2011. Likewise, the average years of schooling in the total population increased from 5.6 years in 2005 to 6.8 years in 2011-2012. The rural-urban gap decreased during the same period, from 3.4 to 3 years of educational attainment (PREAL, 2014). Despite these improvements, Nicaragua’s education system still faces several challenges, including further increases in access and retention, enhancing education quality, and addressing the substantial inequities in education outcomes that still persist, not only between urban and rural areas but also between richer and poorer households and between regions. Nicaragua’s First Education Project PASEN I’s original Project Development Objectives (PDOs) as described in the Development Credit Agreement (DCA) were to: i) increase the enrollment of students for preschool, primary and secondary education in the Borrower's schools; ii) improve the quality and relevance of the learning process taking place in said schools; iii) improve the Ministry of Education, Culture and Sports' systems of governance and accountability and strengthen the community participation in the Borrower's education sector; and iv) harmonize donor assistance in the Borrower's education sector. The operation was restructured on June 30, 2008. The operation’s revised PDOs as described in the Amended DCA were to: i) improve the quality of education through monitoring and disseminating student learning outcomes; ii) improve systems of governance and accountability, including measures to strengthen community participation in the education sector; iii) harmonize donor assistance in the borrower's education sector; and iv) improve institutional management capacity and information systems to improve service delivery. The relevance of objectives is deemed Substantial for both the pre- and postrestructuring periods. The original and revised objectives addressed key challenges of Nicaragua’s education sector, including limited access, low student learning levels,
xii limited capacity in the Ministry of Education (MoE) to manage the system, and the fragmented nature of external assistance. While the objective of expanding access was eliminated during the restructuring, it continued to be a high priority for Nicaraguan authorities and continued to receive support under several other projects with multiple sources of financing. The original design included four components focusing on: i) strengthening MoE’s institutional capacity; ii) developing a monitoring and evaluation system; iii) implementing the Autonomous School Model; and iv) piloting a community preschool program. The restructuring introduced a reduction in the number of components from four to two, and in their scope, concentrating the focus of the operation on two areas: i) institutional strengthening of administrative and management capacity; and ii) improving the quality of primary and secondary education. The relevance of the original design is considered to be Modest. Although the original components and corresponding activities were supportive of the original PDOs, the design exhibited several shortcomings, including an overly ambitious scope given the lack of institutional capacity, operational weaknesses in the expansion of the Autonomous School Program being supported under the operation, and the lack of inputs (teacher training, learning materials) to support quality improvements. The relevance of the revised design is considered to be Substantial. The revised components and corresponding activities were largely supportive of the revised PDOs and more limited in scope. The project provided direct support to improve quality through teacher training and the development and provision of textbooks and other learning materials. The change in government administration that took place in 2007 and the new government decided to end the Autonomous School Model. The education policies of the new administration constituted a drastic departure from the previous decentralization strategy built around the Autonomous School Model and other activities, such as Report Cards, that had been central to the Bank's portfolio in the education sector for over a decade. Project activities were put on hold for over two years, during which there were no disbursements. During this time, the MoE reshaped its strategic priorities, which received support under the restructured operation in June 2008. At restructuring, the closing date was also extended from the original date of June 30, 2008 to December 30, 2009 to allow for the implementation of the revised activities and the full disbursement of the credit proceeds. The operation’s efficacy with respect to PDO 1 – Enrollment, is deemed Substantial, as there was a substantial increase in enrollment during the operation’s lifetime, particularly at the pre-school and secondary levels between 2004 and 2011. Several actions supported under this operation contributed to increased enrollment, including capitation grants for autonomous schools at the primary and secondary levels, a summer school-readiness program for children who had not attended preschool, an enrollment and retention program for children at risk, as well as incentives for teachers in community pre-schools. The operation also made an important contribution toward PDO 4- Harmonization of donor assistance in education, with efficacy in this area being deemed High. In particular, the operation was critical in moving away from a project-centered approach managed by independent implementation units to a sector-wide approach managed by the MoE. The operation was also critical in ensuring the transition from disjointed to
xiii harmonized and coordinated support from all donors in the education sector. These achievements were not the result of a specific set of actions but rather the way in which the project was prepared and implemented and the Bank overall leadership exhibited. The operation made a substantial contribution to PDO 5 - Institutional strengthening of the MoE. The project supported efforts to improve communication and information sharing between the Ministry and local education authorities. While this investment did not lead to better budget execution, which was the PDO indicator, it did lead to a better flow of information and communication. In particular, the National Management Information System (now called the Work System for Planning, Monitoring, Evaluation and Education Statistics) has continued to evolve, reportedly leading to evidence-based decision-making and enhanced planning, M&E, and procurement capacity. In addition, the quality and timeliness of education statistics has improved. Conversely, outcomes related to PDO 2 - Quality of learning and PDO 3 - Governance and accountability were below expectations and efficacy in both areas is deemed Modest. While the project supported several actions implemented that can be expected to have contributed to increasing quality and relevance of learning however there is little data and it is unclear whether the progress made in this area has indeed translated into actual gains in quality of learning. For governance, the PPAR argues that while information on performance has improved, there was no progress on other elements of governance—namely on standards, incentives, or accountability The operation’s Efficiency is considered Substantial based on both the cost-efficiency of implementation and the Project’s expected economic return in the long term. The operation’s IERR presented in the ICR (2011) was estimated at 13 percent, denoting a significant return on the investment over the long term. The assumptions made in 2011 are still valid. In addition, the IERR calculated in the ICR reflects a lower-bound estimation of the operation’s actual economic impact, as the benefits do not include the impact of increased enrollment in pre-school and secondary education under the operation, or the incipient gains in student performance. The project implementation was delayed which resulted in the life of the Project being almost twice as long as originally anticipated. While this indicates that the use of Bank’s financial resources was less than optimal, the Bank and the government were proactive in restructuring the project to ensure that it could achieve new objectives. The operation is rated Moderately Satisfactory under the original objectives to reflect its substantial relevance of objectives, modest relevance of design, modest-to-high efficacy, and Substantial efficiency. The operation is also rated Moderately Satisfactory under the revised objectives to reflect its Substantial relevance of objectives, Substantial relevance of design, Modest-to-High efficacy, and Substantial efficiency. Thus, the operation’s overall rating is Moderately Satisfactory. Lessons Based on the experience of this project, several lessons can be drawn: Flexibility by the Bank in the face of changing government policy may be needed to secure continued development impact. When faced with the change in the political economy, the Bank engaged in a long and frank dialogue to understand how the
xiv project could best be restructured to remain relevant. This required a major change in the underlying logical framework of the project and the willingness for the Bank to accept a new approach. Without this willingness to be flexible and to significantly adjust the project design, the project would have likely been unsuccessful after the policy shift. Ultimately, the sustainability of an education reform depends on information transparency, communications, and buy-in from stakeholders. While the school autonomy model was developed incorporating strong technical support from the World Bank, there appeared to be little attempt to build consensus around the model or to debate alternatives. This led to political opposition that made it vulnerable to early cancellation. The lack of data systems weakened the capacity of policy makers to understand what was working. Likewise, communities had little information about the impact of the reform. Information, including evidence on the impact of the reform, could have been used along with community outreach programs to address community concerns. This contributed to the lack of consensus about the new model and ultimately to its demise. World Bank support needs to go beyond technical aspects. In developing the project, the World Bank provided strong technical support to design the school autonomy model. However it appears that Bank did not provide sufficient support to the logistic elements of the reform, such as piloting an information system or building local capacity. Likewise it appears that the government and Bank did take into account the political economy behind the reform. While technical support is important for the design of reforms, its implementation needs different types of support that also need to be developed during the design phase. Donor coordination and a SWAP can continue, and even be strengthened in the face of adversity and significant policy change. One of the project’s objectives was to strengthen donor coordination and reduce fragmentation in the education sector. The changes in policy had the potential to reduce donor coordination as different donors look for new alternatives in the education sector. The Bank was able to work with others to strengthen coordination during the time of uncertainty. The work done to establish protocols and agreements contributed to keeping development partners together. The use of country systems contributed to the long-term sustainability of World Bank support to the education sector in Nicaragua. The project successfully supported the use of country systems as one of its initiatives. This type of initiative is usually justified as reducing transaction costs for the government. However in the case of Nicaragua, it also appeared to have contributed to the stability of the World Bank’s and the development community’s support for the education sector. Interviews suggest that this initiative facilitated the restructuring and the development of the Education Sector Strategy.
Caroline Heider Director-General Evaluation
1
1. Background and Context 1.1 This report assesses the development effectiveness of Nicaragua’s Education Project (PASEN I), which was approved on September 2, 2004 for a total cost of US$15.7 million equivalent, financed by an IDA credit of US$15.0 million equivalent, with the rest financed by the Government.
Socio Economic and Political Context in Nicaragua 1.2 Nicaragua is a low-income country with a per capita income of around US$1,780 in 2013. Its population of 6.08 million grows at about 1.5 percent per year. Nicaragua is still one of Latin America’s least developed countries, and has the second lowest per capita income in the Western Hemisphere. Although poverty has been declining steadily in recent years, over half of the population still lives below the poverty line, and one out of every five Nicaraguans lives in extreme poverty. Poverty is heavily concentrated in rural areas and along the Atlantic Coast, with many of Nicaragua’s poor living in remote communities with little access to basic services (INID, 2005a; 2005b). 1.3 The country’s economy, once afflicted by political turmoil, has been growing on average with Latin America. Disciplined macroeconomic policies since 2001 helped Nicaragua to weather the global financial crisis in 2008-2009. Since then, Nicaragua has made significant progress toward consolidating its fiscal position and keeping inflation under control, resulting in an average annual growth of 3.4 percent between 2001 and 2013 (World Development Indicators, 2014). Prudent policies implemented during 20122013, including tax reform and progress toward the strengthening of the electricity sector that had been a source of fiscal vulnerability, have contributed to further strengthening macroeconomic stability (IMF, 2013). Education in Nicaragua 1.4 During the past decade, Nicaragua has made substantial strides toward improving education outcomes. Illiteracy rates have decreased from 18.8 percent in 2005 to 10.5 percent in 2010-2011 (INIDE/MINSA, 2013; INEC, 2006). Likewise, the average years of schooling in the total population increased from 5.6 years in 2005 to 6.8 years in 20112012. The rural-urban gap decreased during the same period, from 3.4 to 3 years of educational attainment (PREAL, 2014),1 although substantial inequities in education outcomes still persist, not only between urban and rural areas but also between richer and poorer households and between regions. 1.5 The progress in education outcomes reflects the significant strides made toward expanding coverage, with adjusted net primary enrollment rates at 92 percent or above since 2006. From 2005 to 2013, net enrollment in preschool and secondary education also increased significantly, from 39.5 to 56.8 percent and from 42 to 50.1 percent, respectively. While access to primary education is in line with the regional average, Nicaragua still lags behind other countries in the region in terms of access to pre-school 1
Between 2005 and 2011-2012, years of schooling in urban areas went from 7.0 to 7.9 years, while in rural areas from 3.6 to 4.9 years.
2 and secondary education. Preschool net enrollment rates are similar to those of El Salvador and Guatemala, with Nicaragua far below the 73 percent average for Latin America. At the secondary level, Nicaragua is performing worse than other neighboring countries in Central America, where the net enrollment rate is above 60 percent (with the exception of Guatemala), as well as Latin American countries as a whole, which had a 72 percent net enrollment rate in 2010 (UNESCO, 2012). 1.6 In addition to the challenge of ensuring continued expansion in access, there is still a great need to improve retention. In 2012, only 57 percent of students completed primary education in Nicaragua, compared to 75 percent for Central America and above 80 percent for Latin America. At the secondary level, the completion rate is also low (i.e., 54.7 percent in 2012), with the percent of youth aged 20 to 24 who manage to complete secondary education ranking last in Central America, along with Honduras, and among the last in Latin America (PREAL, 2014). 1.7 High poverty levels affect the demand for education. About a third of the estimated 300,000 families with children living in extreme poverty have at least one child aged 7-12 out of school. The 2008 World Bank Poverty Assessment shows that education is a major determinant of poverty. It estimates that at least 11 years of education are needed to break out of the cycle of poverty. Despite this, 72 percent of the population in Nicaragua does not attain complete secondary education and consequently earns wages below the poverty line (World Bank, 2008). 1.8 In terms of quality, Nicaragua ranked below the regional average on UNESCO’s Second Regional Comparative and Explanatory Study (SERCE) in 2006. In addition, the 2009 national standardized evaluations showed that learning outcomes in grades 4 and 6 were strongly correlated with poverty levels, rural schooling, and low retention rates in primary. While Nicaragua is still developing the instrument to apply a standardized test in grade 11, test results from university applications provide some indication of the quality challenge in secondary education (World Bank, 2008). 1.9 Many teachers in Nicaragua still lack adequate training. In preschool, 64.2 percent of teachers are non-formal community volunteers with little training in early-age learning processes. At the primary and secondary levels, 42.4 and 24.4 percent of teachers lack teaching certification (“empíricos”), with the vast majority working in rural areas where technical support is scarce (Guzmán, 2007). The Autonomous School Model 1.10 The Autonomous School Model was first adopted in Nicaragua in 1993 under the coalition government of President Violeta Chamorro, when the then-Minister of Education Humberto Belli envisioned decentralization and greater participation of teachers and parents at the school level. This was seen as a promising strategy to tackle the challenges facing the educational system, which had annual dropout rates of 19 percent at the primary level and only 26 percent enrollment at the secondary level. A pilot program was first implemented in 20 secondary schools, in which School Management Councils (Consejos Directivos Escolares) were given legal status and assigned key management tasks. By 1995, the Autonomous School Model, which by then included
3 over 100 secondary schools, was extended to primary schools, adopting a similar modality for urban schools and a cluster modality for rural schools (the so-called Núcleos Educativos Rurales Autónomos). As of December 1995, there were 200 single autonomous primary schools and 42 autonomous rural clusters consisting of two to four schools each (King et al, 1998). In 2002, the Law of Participative Education (Law No. 413; Ley de Participación Educativa) formally adopted the governance mechanisms that had been developed under the Autonomous School Model. 1.11 The Autonomous School Model continued to expand with support from the World Bank. In particular, the approval of a school autonomy law was one of the conditions established under the Completion Point for the Heavily Indebted Poor Country (HIPC) initiative with joint support from the World Bank and the International Monetary Fund. In addition, actions related to the continuous expansion of the Autonomous School Model were supported under Nicaragua’s Development Credit (Loan No 4521-NI) and the Poverty Reduction Support Credit I (IDA-3850-NI). The continuous expansion of the Autonomous School Model was also a central component of the PASEN I operation, with the main disbursement mechanism being capitation grants to Autonomous Schools. 1.12 The School Autonomy Model was abandoned by a new government that took office in January 2007, which prioritized free access to education to all Nicaraguan children and abolished the user fees adopted under the Autonomous School Program. User fees had indeed been the most contentious and controversial component of the program. While user fees—supposedly mandatory at the secondary level and supposedly voluntary at the primary level—provided schools with much needed financial resources to complement transfers from the MoE, they were widely questioned on equity grounds and raised strong social and political opposition. 1.13 While in primary school the fees were voluntary by law, there were instances of teachers refusing to administer exams to non-paying primary school students, and even cases of teachers or principals refusing to admit students. Even though in these cases the MoE delegates and the mayors “reminded” school staff that the fees were voluntary, many argued that the user-fee policy contributed to creating a class-based social environment within the institutions. User fees may also have exacerbated differences among schools serving students from different socio-economic backgrounds. Schools exhibited a broad range of fee collection strategies that was loosely based on MoE’s guidelines. Total fee collection varied widely across schools, ranging from 0 to 160 percent of the monthly transfer from the MoE. While the ability of individual schools was linked to their effort to collect user fees, collection levels can also be expected to reflect students’ socio-economic conditions, thus generating the potential for inequalities among schoolsn (Gershberg et al., 1998).
2. Objectives, Design, and their Relevance Project Development Objectives 2.1 Nicaragua’s Education Project (PASEN I) was approved on September 2, 2004 and became effective on March 17, 2005. The operation’s original Project Development Objectives (PDOs) as described in the Development Credit Agreement (DCA) were to:
4 i) increase the enrollment of students for preschool, primary and secondary education in the Borrower's schools; ii) improve the quality and relevance of the learning process taking place in said schools; iii) improve the Ministry of Education, Culture and Sports' systems of governance and accountability and strengthen the community participation in the Borrower's education sector; and iv) harmonize donor assistance in the Borrower's education sector (DCA, Schedule II, p. 22, Sept. 17, 2004). 2.2 While PDO definitions in the Project Appraisal Document (PAD) and DCA had minor differences in wording, the definitions were substantively equivalent (PAD, pp. 3,40; March 28, 2004). One difference pertains to PDO 2 – Quality and Relevance of Learning. While the wording in the PAD’s main text was rather vague (i.e., “improve attention to quality and relevance of learning”) and could be interpreted as pointing to the development of an evaluation and monitoring system, the definition in the PAD’s Project Result Framework and DCA unequivocally pointed to enhancing the quality and relevance of education (i.e., “improve the quality and relevance of the learning process”). 2.3 The operation was restructured on June 30, 2008. The operation’s revised PDOs as described in the Amended DCA were to: i) improve the quality of education through monitoring and disseminating student learning outcomes; ii) improve systems of governance and accountability, including measures to strengthen community participation in the education sector; iii) harmonize donor assistance in the borrower's education sector; and iv) improve institutional management capacity and information systems to improve service delivery (Schedule II, p. 5-6, June 30, 2008). 2 2.4 For the purpose of this PPAR, the original and revised PDOs are based on the DCA and its subsequent amendment.3 Specifically, the original PDOs adopted for this PPAR are: i) increase enrollment for preschool, primary and secondary education; ii) improve quality and relevance of learning; iii) improve the system of governance and accountability, including community participation in the education sector; and iv) harmonize donor assistance in the sector. The revised PDOs adopted for this PPAR are: i) improve quality and relevance of learning; ii) improve the system of governance and accountability, including community participation in the education sector; iii) harmonize donor assistance in the sector; and iv) improve institutional management capacity and information systems to improve service delivery.
2
The Project Restructuring Paper (p. 4, June 30, 2008) presents the same definition as the Amended DCA. The definitions adopted for this PPAR also coincide with the PDO definitions utilized in IEG’s ICR review. The only exception is the PDO referring to quality and relevance of learning, which in the IEG review was disaggregated into two separate objectives: quality and relevance. For the purpose of the PPAR, quality and relevance of education are considered to be roughly equivalent given that the operation’s focus is on basic education, in which a relevant basic education curriculum is one that focuses on language, math, and some combination of social and physical sciences, such as the one in Nicaragua and most other countries. 3
5
Relevance of Objectives 2.5 The original and revised objectives are considered to have continuous relevance; thus relevance of objectives is deemed Substantial for both the pre- and post-restructuring periods. The original and revised objectives addressed key challenges of Nicaragua’s education sector, including limited access, low student learning levels, limited capacity in the Ministry to manage the system, and the fragmented nature of external assistance. The operation’s objectives remained mainly unchanged during the restructuring, except that access was eliminated, with the operation during the post-restructuring period focusing exclusively on governance and quality outcomes. Nevertheless, ensuring and expanding access to basic education continued to be a high priority for Nicaraguan authorities as illustrated by the abolition of school fees and continued to receive support under several other programs in the context of the Annual Common Work Program with multiple sources of financing.4 2.6 The operation’s PDOs were consistent with the previous and current Bank’s Country Partnership Strategy (CPS). The CPS 2008-2012 that was effective at closing date cited improved access to education services and improved education outcomes as a Country Development Goal (p. 39). The CPS stressed four key policy areas: i) more education to achieve full primary enrollment and expand access to pre-primary, secondary, technical, and vocational school; ii) better quality education; iii) holistic and integral education; and iv) decentralization of school management and community participation (p. 14). Given that the country is dependent on aid, with over 30 percent of its budget coming from Overseas Development Assistance, the CPS also noted the need for donor harmonization (p. 21). The original PDOs are also relevant under the current CPS 2013-2017, as it supports government priorities in two key areas of engagement: i) raising welfare by improving access to quality basic services; and ii) raising incomes by improving productivity and enhancing competitiveness. 2.7 The original and revised objectives are consisted with those under the Government of Nicaragua’s current Education Sector Strategy (ESS) for 2011-2015, which reflects the current administration’s policy priorities in the education sector. The ESS aims to improve: i) the coverage and quality of preschool education, (ii) completion of primary education; and iii) the coverage and quality of secondary education. In turn, the ESS is aligned with the Government of Nicaragua’s medium-term economic strategy, which aims to achieve equitable growth, financial stability, and poverty reduction as reflected in the National Plan for Human Development (Plan Nacional de Desarrollo Humano, Gobierno de Reconciliacion y Unidad Nacional, 2007-2011). Under this plan, the government has set a pro-poor strategy and agenda that emphasizes the delivery of both infrastructure and social services, including education. Finally, the revised PDOs
4
The education sector’s Common Work Program received financial support from the World Bank (PASEN I), the European Commission (Programa de Apoyo Presupuestario Sectorial para la Educación - PAPSE) and Canada, Denmark and the Netherlands (Education Sector Support Programme - PROASE) as well as EFA-FTI funds.
6 and associated Project Outcome Indicators remained aligned to the EFA-FTI initiative and indicative framework indicators in Nicaragua.
Project Design 2.8 The original design included four components. Component 1 supported the institutional strengthening of the Ministry of Education (MoE) at the central and municipal levels. Component 2 supported the development of a monitoring and evaluation system compilation, including the analysis and dissemination of educational statistics as well as the periodic valuation of competencies in language and math for primary and secondary school students and testing of teacher practices. Component 3 provided support for the continuous implementation of the Autonomous School Model, including capitation transfers to individual schools. Component 4 supported a Pilot Program for community preschools. 2.9 The restructuring introduced a reduction in the number of components from four to two, and in their scope, concentrating the focus of the operation on two areas: i) institutional strengthening of administrative and management capacity, and ii) improving the quality of primary and secondary education (see Table B.2). The revised activities addressed the key concerns of the new administration and eliminated those that were no longer its priorities, particularly the School Autonomous Model and the School Report Card. The revised design included some of the original elements (i.e., strengthening of management capacities, student learning assessments, governance mechanisms, and harmonized donor activities) and added school inputs to improve education quality (e.g., learning materials, textbooks, and teacher workshops). The restructured project also placed greater emphasis on improving the quality of service delivery in remote rural communities.
Relevance of Design 2.10 Design under the original objectives: Modest – The relevance of design under the original objectives is considered to be Modest. The original components and corresponding activities were largely supportive of the original PDOs. Increased access was to be accomplished through the incorporation of additional schools to the Autonomous School Model, which, as mentioned earlier, had been the main component of the Government of Nicaragua’s decentralization strategy in the education sector. In this context, school capitation grants to autonomous schools were expected to provide financial incentives for primary and secondary schools to actively increase enrollment. The implementation of a pilot community preschool program, including incentives to community teachers, was expected to increase enrollment at the preschool level. 2.11 However, the expansion strategy of the Autonomous School Model exhibited significant weaknesses. Specifically, parents, teachers and administrators in Autonomous Schools should have been provided training and support to ensure they had the skills needed to fully capitalize on the potential benefits of school autonomy. In addition, stronger auditing mechanisms should have been put in place to ensure the accurate reporting of student enrollment by individual schools. Finally, it would have been of critical importance to ensure the equity of the Autonomous School Model, both within
7 and across individual schools, by guaranteeing the voluntary nature of parents’ financial contributions at the primary level and providing complementary financial support to schools serving students from more disadvantageous socio-economic backgrounds, which were likely to have a smaller potential for fee collection. While the operation’s PDOs did not explicitly include equity as an objective, affordability considerations were critical to ensure retention of newly enrolled students (see among others, Birdsall et al., 2006). 2.12 Improvement in quality and relevance of learning was expected to result from the dissemination of student performance results, as accurate and timely information on student performance was considered a critical pillar of the ongoing decentralization process and a vital input supporting the oversight function of both local stakeholders and the MoE. However, although municipal-level pedagogical support was provided under the operation, no teacher training activities were included under the original design to ensure that teachers utilized data from student assessments to improve teaching. In addition, School Report Cards were intended to provide comparable school-level performance information so that communities could hold teachers and administrators accountable for improving education quality. However, no additional inputs were provided to teachers and administrators under the operation (e.g., training, textbooks) to improve quality. 2.13 Improvements in governance and accountability were to be accomplished through the professionalization of MoE staff and the MoE’s institutional restructuring, as well as institutional strengthening at the municipal level in accordance with the decentralization strategy that was in place at appraisal. In retrospect, given the lack of any significant progress in this regard, it is obvious that the scope of this PDO was overly ambitious and that the needed political commitment to carry it out successfully was lacking. 2.14 While there were no components specifically related to donor harmonization, this objective was to be accomplished through the project implementation arrangements, such as memoranda of understanding, donor meetings, and working groups. In this case, the PDO appropriately capitalized upon the strong commitment exhibited by the MoE and the donor community to achieve harmonization in the framework of the Paris Declaration. 2.15 Design under the revised objectives: Substantial – The relevance of design under the revised objectives is considered to be Substantial. The revised components and corresponding activities were largely supportive of the revised PDOs and more limited in scope. Improved quality received direct support through teacher training and the development and provision of textbooks and other learning materials. Improved governance and accountability was to be achieved by the periodic measurement of student performance and the dissemination of results. Improved institutional management capacity was to be achieved through the development of a decentralized and participative education management model at the central, departmental and municipal levels. 2.16 While no specific activities were included in either the original or revised designs to support donor harmonization, this objective was to be accomplished by the Bank’s proactive role in facilitating the coordination of Development Partners operating in Nicaragua’s education sector as part of the operation’s implementation. Original and
8 revised implementation arrangements supported the harmonization of donor assistance through bi-annual supervision missions under the umbrella framework of joint review sessions with participation of all donors and lenders who provided support to Nicaragua’s education sector. Leadership of the joint review missions remained the full responsibility of the MoE, while its Annual Operation Plan and Budget continued to be used as a tool to guide the joint implementation reviews, in a manner consistent with the Paris Declaration to improve development effectiveness. Several new indicators were included in the operation’s Project Result Framework. Table 2.1. Original and Revised PDOs and Corresponding Activities Supported under the Project Original PDOs and Corresponding Actions Supported under the Project PDO1 Increase enrollment for preschool, Component 3. Continuous implementation of primary and secondary education Autonomous Model, including capitation transfers to individual schools as financial incentives Component 4. Implementation of a pilot community preschool program PDO2 Improve quality and relevance of learning
Component 2. Development of a national evaluation strategy to monitor learning effectiveness and foster accountability
PDO3 Improve the system of governance and Component 1. Institutional strengthening at accountability, including community the central and municipal level participation in the education sector PDO4 Harmonize donor assistance in the sector
No specific activities were included. It was to be archived through the implementation modality
Revised PDOs and Corresponding Actions Supported under the Project PDO1 Improve quality and relevance of learning
Component 2. Educational inputs for preschool, primary and secondary education, including teacher training and textbooks
PDO2 Improve the system of governance and Component 2. Development of a national accountability, including community evaluation strategy to monitor learning participation in the education sector effectiveness and foster accountability PDO3 Harmonize donor assistance in the sector
No specific activities were included. It was to be archived through the implementation modality
PDO4 Improve institutional management capacity and information systems to improve service delivery
Component 1. Establishment of a decentralized and participative education management model, including at the department and municipal levels
9
3. Implementation 3.1 Although the operation was declared effective within six months of Board approval, the pace of implementation was slow during the first year of implementation, with the disbursement lag reaching almost 40 percent in February 2006. Various factors contributed to the operation’s slow implementation start. First, there was a significant reduction in the available funds supporting the implementation of the education sector’s Common Work Program during 2005, as a result of a temporary decrease in external financial resources and an increase in teacher salaries that absorbed most of the national resources.5 This situation required the adjustment of the Annual Operating Plan for 2005, giving priority to activities outside the operation, such as EFA-FTI activities. Second, there were changes in leadership at the MoE. Although incoming authorities ratified the priorities and strategies supported under PASEN I, including the reorganization of the MoE, the school autonomy program and the development of a student assessment system, broad changes in management and technical staff changes in early 2006 resulted in operational delays. Third, while the incorporation of schools to the Autonomous Model showed progress as planned, it did not go hand in hand with increases in enrollment at the primary level. This, in turn, was an obstacle for implementation given that disbursements based on transfers to schools were tied to enrollment. The pace of implementation accelerated in mid-2006, as the flow of external financial resources was restored and the original capitation formula was modified, shifting the focus from marginal enrollment to real expenditures (i.e., teacher costs). While the new formula succeeded in addressing the bottleneck in disbursements, it somewhat eroded the enrollment incentives as originally envisioned. Some of the activities supported under the operation, such as the MoE reengineering, continued to lag behind. 3.2 The change in administration that took place in 2007 and the abandonment of the Autonomous School model was undoubtedly the most important factor affecting implementation. The transition period was difficult, as the education policies of the new administration constituted a drastic departure from the previous decentralization strategy built around the Autonomous School Model and other activities, such as Report Cards, that had been central to the Bank's portfolio in the education sector for over a decade. Project activities were put on hold for over two years, during which there were no disbursements.6 During this time, the MoE reshaped its strategic priorities, which received support under the restructured operation in June 2008. At restructuring, the closing date was also extended from the original date of June 30, 2008 to December 30, 2009 to allow for the implementation of the revised activities and the full disbursement of the credit proceeds. 3.3 Despite the strong ownership of the restructured operation on the part of MoE’s authorities, implementation continued to present serious challenges, including the lack of qualified staff within the MoE. A second 12-month extension to the closing date was granted until December 31, 2010 in response to the implementation delays. However, a wave of dismissals and appointments at the highest level of the MoE in early 2010 5
The reduction in external financial resources was due to the temporary suspension of disbursements from the European Community and delays in the achievement of conditions of effectiveness of PROASE. 6 Disbursements remained unchanged at USD7.17 million between Dec. 2007 and July 2009.
10 created new institutional challenges, and eventually resulted in a six-month extension of the closing date until June 30, 2011. Under a new management team at the MoE, the pace of implementation as well as disbursements accelerated during the last year of implementation, with credit proceeds being fully disbursed by March 2011. The last year of implementation also served to support the preparation of a follow-on operation, the Second Education Support Project (PASEN II), which was approved in January 2012.7
4. Achievement of the Objectives 4.1 In this review, and in line with the Bank’s Harmonized Guidelines, the original and revised PDOs are assessed over the entire project period, with the ratings weighted according to the percentage of the credit disbursed at the time of restructuring.
Objective 1 “To increase enrollment for preschool, primary and secondary education (Original Objective)” 4.2 The operation’s contribution to increasing enrollment for pre-school, primary and secondary education is deemed substantial. The increase in effective enrollment during the Project’s lifetime was primarily the result of increases in enrollment, which offset an increase in dropout rates. Net enrollment trends experienced a sustained increase during the Project’s lifetime, particularly at the pre-school and secondary levels between 2004 and 2011. 4.3 Several actions supported under this operation can be expected to have contributed to increased enrollment, including capitation grants provided to autonomous schools at the primary and secondary levels, a summer school-readiness program for children who had not attended preschool and an aggressive enrollment and retention program focusing on children at risk, as well as incentives provided to teachers in community pre-schools (see Table 4.1).
7
Nicaragua’s Second Education Support Program - PASEN II (P126357; US$25 million).
11 Table 4.1. PASEN I’s Actions Contributing toward Increased Enrollment School Readiness Program
A school readiness program focusing on children ages 6-7 that had not attended preschool was implemented between Nov. 2005 and Jan. 2006. Ninety percent of the 17,000 that participated in the program enrolled in first grade in 2006.8
Capitation grants to Autonomous Schools transferred to 1,182 administrative units Capitation grants can be expected to have created incentives for Capitation grants Autonomous Schools to increase enrollment, contributing to an increase in to Autonomous effective enrollment of 17,687 in autonomous schools, from a baseline of Schools 75,425 students in 2003 to 83,8361 in 2006 equivalent to 3.5% annual increase (target exceeded). This indicator was no longer monitored from 2007 onward An aggressive enrollment and retention campaign was implemented during Tuition Recovery 2005-2006, resulting in the enrollment of 42,929 children—i.e., 10,872 in pre-school and 32,057 in grade 1 (PREAL, 2007). Plan Backpacks with school supplies were distributed to 55,000 children. Source: Developed by the author based on ICR (2012) and additional data provided by the Bank.
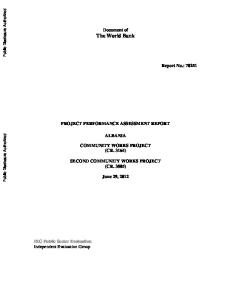
4.4 In terms of impact, a positive trend in enrollment was observed during the operation’s lifetime. As shown on Figure 4.2, the net enrollment rate (NER) for preschool increased from 36.3 to 57.4 percent between 2004 and 2011, with the community preschools contributing largely to the increase.9 There was also a significant increase in NER at the secondary level, from 39.9 to 46.1 percent during the same period. At the primary level, the increase in enrollment has been less dramatic, as shown by a slight increase in the adjusted net enrollment rate from 89.8 to 94. 6 percent between 2004 and 2011.10
8
The School Readiness Program received US$220,000 from the Project and US$58,000 from UNICEF. With support from the IADB and Norway, the Comprehensive Childcare Program (Programa de Atención Integral a la Niñez) supported community pre-schools in rural and marginal urban areas. 10 The Adjusted Net Enrollment Rate (NERA) is the total number of students of the official school age group who are enrolled, as a percentage of the corresponding population. The Net Enrollment Rate (NER) is the enrollment of the age group for a given level of education as a percentage of the corresponding population. 9
12 Figure 4.1. Net Enrollment for Preschool, Primary and Secondary Education, 20042011
Source: PREAL (2014).
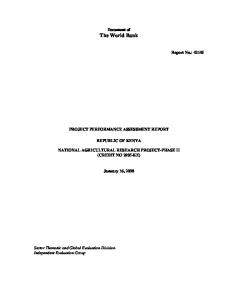
4.5 Despite the increases in enrollment, keeping students in the system continued to be a challenge. In the case of primary and secondary education, dropout rates experienced an absolute increase during the Project’s lifetime, from 6.5 and 10.5 percent in 2004 to 8.3 and 13.9 percent in 2011, respectively (see Figure 2). There was a particularly sharp increase during 2004-2006 and, although the trend was reverted from 2007 onward, the subsequent decrease did not offset the initial hike. The same general trend was observed in the case of preschool education, with dropout rates in 2011 being only slightly lower than in 2004—9 and 9.5 percent, respectively.11 Figure 4.2. Dropout Rates for Pre-school, Primary and Secondary Education, 20042011
Source: PREAL (2014).
11
The elimination of school fees in 2007 might have contributed toward the subsequent decrease in dropout rates, as keeping schools affordable has been identified in the literature as an effective strategy toward increasing retention (see, for example, Birdsall et al., 2006).
13 4.6 In the case of Autonomous Schools, which was a central area of intervention during the pre-restructuring period, the increase in effective enrollment12 was significant—equivalent to an annual increase of 3.5 percent, exceeding the original target of 3 percent per year over the three years anticipated at Appraisal.13 Specifically, there was an increase in effective enrollment of 82,936 students in autonomous schools, from a baseline of 755,425 students in 2003 to 838,361 students in 2006 (including 15,193 students for pre-school, 11,007 for primary, and 56,736 for secondary). 4.7 At the system level, increased enrollment also goes hand in hand with improvements in other efficiency measures during the operation. Repetition rates at both the primary and secondary level decreased during the project, from 10.5 and 6.7 percent in 2004 to 7.7 and 5.5 percent in 2011, respectively (see Figure 4.3). Likewise, there was a substantial increase in the percentage of children that completed primary education, from 45.9 in 2004 to 58.1 in 2011. However, there was a decrease in the percentage of students completing secondary education, from 59.6 in 2004 to 53.1 in 2011. Figure 4.3. Repetition and Completion Rates for Primary and Secondary Education, 2004-2011
Source: PREAL (2014).
Objective 2 “To improve quality and relevance of learning (Original and Revised Objective)” 4.8 The operation’s contribution toward improving quality and relevance of learning is deemed modest, as gains in terms of quality and relevance of learning cannot be ascertained. However, several actions implemented under the operation can be expected to have contributed to increasing quality and relevance of learning (see Table 4.2). In addition to the School Readiness Program, other actions focusing on quality of learning included: i) training of rural teachers; ii) design of primary and secondary textbooks with 12 Increase in effective enrollment—also denominated increased total net enrollment—refers to the increase in total enrollment for a given school year net of the dropouts from the preceding school year (PAD, p. 40). 13 Data on effective enrollment was not longer monitored after the program was abolished in 2007.
14 the newly adopted competency-based curriculum with the participation of local authors; and iii) the printing and distribution of textbooks from grades 1-3. The first set of secondary books provided to public secondary students in Nicaragua was developed under this operation. Table 4.2. PASEN I’s Actions Contributing toward Increased Quality of Learning
Curriculum changes
Textbook development and provision
Teacher training
Under the Autonomous School Model, School Education Councils had the ability to adapt the curriculum to local conditions. After 2007, the contextualization of the curriculum was still to be done at the local level through a newly established mechanism—i.e., the Evaluation, Programming and Training Workshops (Talleres de Evaluación, Programación y Capacitación Educativa). However, in practice, these workshops have focused mainly on programming. A competency-based curriculum developed with IADB and USAID support and other DPs was adopted in 2008 after an ample consultation with key actors in the education sectors and civil society at large.14 Local authors participated in the design and validation of textbooks for primary and secondary education, ensuring they reflected national culture, values and conditions (target achieved). A total of 19 textbooks for grades 1-6 as well as 25 textbooks for secondary education were designed. Secondary textbooks, which are currently being printed, will be the first ones to ever be distributed to public secondary schools in Nicaragua. A total of 1,120,252 textbooks for grades 1 to 3 were printed and reportedly distributed (target exceeded). The textbook-to-student ratio for grades 1 to 3 of primary school was improved to one textbook for every child based on the number of printed textbooks (target achieved). There was no independent verification of whether the textbooks have reached all schools and their students, although the Bank team reported verifying their distribution on time for the 2010 school year (ISR May 2010). A total of 34,350 teaching guides in Spanish and Mathematics for grades 3 and 6 were distributed in 9,000 primary schools (target partially achieved). Over 1,400 rural teachers were trained in pedagogical techniques for multigrade settings (target exceeded). Workshops were held for rural multi-grade teachers in planning and evaluation of curricular activities (target exceeded). Over 1,350 pedagogical advisors were trained in classroom techniques, statistics, management, communication, and leadership (target exceeded).
Source: Developed by the author based on ICR (2012), additional data provided by the Bank and collected in PPAR mission.
4.9 It is also important to note the considerable progress made under PASEN I toward the development of a student learning assessment system, including the administration of national and international learning assessments and the dissemination of results (see Table 4.3). The development of such a system is precondition toward monitoring trends in student performance, which is an input in the design evidence-based policies and interventions. However, it is unclear whether the progress made in this area has translated 14
Gran Consulta Nacional del Currículo,” March 2007 to March 2008.
15 into actual gains learning. Although the dissemination of results from student assessments among school administrators and teachers has the potential to contribute toward correcting learning deficiencies in the classroom, training focusing on how to improve teaching in areas that exhibited particular weaknesses was not contemplated under the operation. Thus, the virtuous cycle of detecting weaknesses, making educators aware of the weaknesses, and providing them with tools to address them was left incomplete. Table 4.3. PASEN I’s Actions Contributing toward the Development of a Learning Assessment System Systematic measurement of student learning
Dissemination of results from student learning assessment
National student assessments National student learning assessment for grades 4 and 6 was carried out in 2006. National student learning assessments for grades 4, 6 and 9 focusing on newly adopted competency-based curricula were developed and carried out in 2009 and 2010. Bank of items for national student learning assessments for grade 11 was prepared. EGRA/EGMA assessments With USAID support, EGRA was carried out in 2008 and 2009. The MoE has continued to apply the EGRA on an annual basis with own-source financing. With JICA support, EGMA was carried out in 2011. Regional assessments With project support, Nicaragua participated in UNESCO’s Second Regional Comparative and Explanatory Study (SERCE) in 2006. The third regional assessment (TERCE) was carried out in 2013, after the Project’s closing, with national financing. National student assessments Twenty-two workshops were disseminated results from the 2006 national student assessment, with the participation of 1,648 teachers and administrators, and 768 schools receiving a detailed performance report (target achieved). Results from the 2009 national student assessment were disseminated in 2011. Departmental and school reports were prepared and disseminated. The 2010 student test results were disseminated end-2012 with support from the follow-up operation PASEN II, which is under implementation since 2012. EGRA/EGMA assessments EGRA/EGMA results from 2008-2011 were disseminated with the support of the Project-related trust fund. Results from the annual EGRA tests being applied by the MoE in subsequent years have not been made public. Regional assessments Eleven workshops were conducted to disseminate 2006 SERCE results, with the participation of 777 teachers and administrators and 239 schools.
Source: Developed by the author based on ICR (2012), additional data provided by the Bank and collected in PPAR mission.
16 4.10 As mentioned earlier, currently there is no data series available to measure quality over the period of Project implementation; thus, the operation’s impact on quality of learning cannot be adequately assessed. The national assessment tests administered in 2009 and 2010 provide the only comparable data on learning outcomes during the operation’s lifetime. As could be expected, the change was not considerable over just a one-year period, showing an incipient gain in student performance in Spanish for all grades (4, 6, 9) and in Math for grade 4, and deteriorating scores in Math in grades 6 and 9 (see Table 4.4).15 However, gains in quality and relevance of learning might become evident as data for successive time periods becomes available. Table 4.4. Summary Results from National Assessment Tests, 2009-2010 Performance LEVEL
Spanish 2009
Math
2010
2009
2010
Difference 2009-2010 SPANISH
Grade 4 Basic or below
63.0
59.0
42.3
39.0
-4.0
Above Basic
37.1
41.0
57.7
60.9
3.9
Basic or below
43.5
38.7
49.9
52.8
-4.8
Above Basic
56.4
61.2
50.0
47.1
4.8
24.9
42.2
-3.3 3.2
2.9 -2.9
Grade 9 35.9
Grade 6
Basic or below
MATH
48.7
-11.0
6.5
Source: MINED (2012).
Objective 3 “To improve the system of governance and accountability, including community participation in the education sector (Original and Revised Objective)” 4.11 The operation’s contribution toward improving governance and accountability, including community participation in the education sector, is considered modest. While the importance of enhancing governance and accountability in Nicaragua’s education sector was underscored in the PAD, there is no explicit definition. For the PPAR, the assessment of progress made toward this objective uses the four enabling conditions of governance described by Lewis et al (2009): i) the existence of standards; ii) information on performance; iii) incentives for good performance; and iv) accountability.
15
Although national standardized tests were applied in 2002, 2006, 2009 and 2010. They constitute two non-comparable sets of two measurements in time (i.e., 2002-2006, and 2009-2010), as the first set of tests focused on the previous standard-based curricula, while the second set of tests focused on a competencybased curriculum. The first set is not being used for the purpose of this PPAR since the 2006 results do not allow for enough time to capture the operation’s impact and they are not comparable with second set.
17 Table 4.5. PASEN I’s Actions Contributing toward Enabling Conditions of Governance Enabling conditions of governance and definitions
Governance related actions under PASEN I
Standards: Transparent and publicly known criteria or Professionalization of the benchmarks used to assess civil service. and inform education policy, provision, and performance.
Governance related intermediate outcomes under PASEN I There was no progress toward hiring using public recruitment process.
Development and implementation of a national student assessment strategy.
Significant progress (see PDO2 for more extensive discussion).
School Report Cards.
A pilot School Report Card program was piloted during the pre-restructuring period but was subsequently dismantles.
Information on performance: Clear definition of outputs and outcomes combined with accurate data on performance and results Report “The State of collected at regular intervals. Education in Nicaragua” published and disseminated on an annual basis.
Studies were conducted during the pre-restructuring period on education performance variation among autonomous schools with results were disseminated. Education statistics were collected, analyzed, and disseminated on MoE’s website during the pre-restructuring period, including publication of “State of the Nicaragua Education – 2005” (MEDC, 2006).
Incentives: Financial or non-financial factors that motivate a specific type of behavior or action.
Fiscal transfers to schools based on a non-discretionary formula of capitation financing to promote enrollment.
Increased the percentage of primary and secondary schools classified as autonomous schools to 80 percent by 2006 (target of 100 percent). Fiscal capitation-based transfers to Autonomous Schools were implemented in the prerestructuring period (target achieved). Autonomous School Model was subsequently abandoned.
Accountability: The act of holding public officials answerable for processes and outcomes, with sanctions if outputs and outcomes are not delivered.
Strengthening of accountability through decentralization and community participation.
Signed 50 performance agreements between MoE and municipalities, achieving the target. Increase in school autonomy was reversed when the model ended.
Source: Developed by the author based on Lewis at al. (2009), PASEN I PAD (2004), PASEN I Project Restructuring Paper (2008), ICR (2012), additional data provided by the Bank and collected in PPAR mission.
18 4.12 As shown in Table 4.5, several actions under the PASEN I operation provided support for these enabling conditions through: i) the adoption of merit-based hiring and promotion practices for MoE staff; ii) the implementation of non-discretionary capitationbased fiscal transfers to Autonomous Schools; iii) the development of systems to collect and disseminate information on educational outcomes at regular intervals; and iv) the continuous decentralization of the education system. 4.13 Under PASEN I, there was negligible progress toward the advancement of these enabling conditions, except for the progress made toward the development of a learning assessment system to provide critical information on the performance of Nicaragua’s education sector. 4.14 Standards – No substantial progress: There was no progress made toward hiring and promotion on a competitive basis, including recruiting staff using public recruitment process 4.15 Information on performance – Partial Achievement: With PASEN I support, the assessment function has been successfully assimilated within the MoE and, as already discussed under PDO 2, important steps have been taken toward the development of a national student assessment system, mainly the design and application of national and international student learning assessments, the participation in regional learning assessments and the dissemination of results among teachers and administrators (see Table 4.3). Such a system, in turn, has the potential to enhance accountability and governance within the education sector. 4.16 During the pre-restructuring period, education statistics were regularly disseminated on the MoE’s website together with annual reports on the state of Nicaragua’s education sector as well as other analytical studies. However, this practice was discontinued during the post-restructuring period, with the last “The State of Education in Nicaragua” being published in 2006. 4.17 There were some efforts to generate information on performance at the school and municipal level, but they were not sustained. At the school level, a pilot of the School Report Card initiative was implemented but later abandoned. Likewise, variation in performance among autonomous schools was assessed in 2006 and disseminated in 2007. A study on municipal performance in education was conducted and disseminated in 2005. 4.18 Incentives – No substantial progress: As originally conceived, the operation provided financial support for fiscal transfers to Autonomous Schools based on a nondiscretionary formula of capitation financing that provided a direct incentive to schools to enroll more students and to retain the enrolled students. This formula was subsequently modified in 2006, somewhat weakening the enrollment incentives.16 Transfers to schools were eventually stopped in 2007, when the MoE regained control over the education budget. Currently, there are no systems of incentives in place to reward schools, teachers or administrators for increased enrollment, retention, or student performance.
16
The modified formula continued to be non-discretionary, but focused instead on the number of teachers required based on the reported enrollment rather than on the number of students enrolled.
19 4.19 Accountability – No substantial progress: While there was a drastic transfer of responsibilities from the national level to school councils under the Autonomous School Model, this transfer was reverted once the model ended. Under the current model, decentralization seems to have resulted in improved coordination among the various line ministries, local governments, and school levels. However, gains in terms of accountability are not apparent. 4.20 During the pre-restructuring period, the Autonomous School Model relied heavily on local governance and accountability mechanisms, which, in the case of Nicaragua, had been established under the Law of Participative Education (Law No. 413; Ley de Participación Educativa) that was approved in February 2002. This legislation established the foundations for shared responsibility in education, under which schoolbased communities were given higher levels of autonomy in the development and implementation of education programs and school management. Elected School Directive Councils (Consejos Directivos Escolares) with representation from school administrators, parents, teachers and students (only at the secondary level) had strong executive powers, including hiring and firing of personnel, budgetary decisions, classroom structure and schedule, purchase of textbooks, and curriculum adaptation (see Table 4.6). In addition, the legislation established Municipal Educational Councils as the entities responsible for ensuring the adequate implementation of education programs at the municipal level. 4.21 During the post-restructuring period, the Autonomous School Model was discontinued17 as well as the governance and accountability mechanisms that supported it at the school level. While School Directive Councils appear to still be functioning,18 they serve primarily to mobilize voluntary community support to schools. A new decentralized governance structure—the so-called nuclear educational (Nuclearización Educativa)— was conceived in 2007 with a focus on municipalities rather than individual schools. Although this governance structure was originally envisioned as an alternative strategy toward decentralization, in practice the national level has retaken many of the functions that had been previously devolved to schools and municipalities (see Table 4.6). 4.22 As reported by administrators interviewed during the PPAR mission, the Education Councils that have been established under the new governance structure have been instrumental in coordinating support at the school level from various sector ministries (i.e., education, health, social work) as well as departmental and municipal governments. However, community involvement has diminished under the new decentralization strategy, except for the Food Coordination Committees, in which parents administer food supplies provided to individual schools. Further definition of the
17
Ministerial Decree No. 017-2007, approved on January 11, 2007 declared the annulment of those Ministerial Agreements, Autonomy Agreements, Manuals, Regulations and other administrative provisions issued before the publication of Law No. 413 "Law of Participative Education.” Since this decree applied only to agreements prior to the publication of the 2002 Law, the legal status of those schools that became autonomous after February 2002, is unclear. 18 This was the case in the schools visited during the PPAR mission in July 2014. Moreover, school administrators consistently reported their critical importance in channeling community resources—i.e., financial resources, labor, construction materials, etc.--to ensure schools’ operation.
20 Government of Nicaragua’s decentralization strategy is still pending, as the nuclear education strategy was largely abandoned after the change in MoE authorities in 2011. Table 4.6. Governance and Accountability System before and after 2007 Time Period
Responsibility
Hiring and firing of teachers
Decisions over teacher salaries Budget decisions, including allocations and spending Decision over textbooks Decision over curriculum Decision on schedule and classroom organization Decision for grate promotion
X
Municipal
School Council (CDE)
Comments
X
X
CDE in autonomous schools. Local delegations in other schools
X
Decision taken by the CDE and ratified by municipal delegation
X
By CDE in autonomous schools
X
Until 2006 From 2007
Promotion of teachers
Department
Until 2006 From 2007
Hiring and firing of participants
National
X X
X
Until 2006
X
With participation of the Teachers Union – ANDEN
From 2007
X
X
Until 2006
X
From 2007
X
Until 2006
X
From 2007
X
Until 2006
X
From 2007
X
Until 2006
X
From 2007
X
Until 2006
X
From 2007
X
Until 2006
X
At the national level
From 2007
X
At the national level
At national level X
CDE, in autonomous schools
X
CDE in autonomous schools to purchase additional textbooks
X
CDE in autonomous schools
X
CDE in autonomous schools
Source: PREAL (2007).
Objective 4 “To harmonize donor assistance in the sector (Original and Revised Objective)” 4.23 The operation’s contribution toward the harmonization of donor assistance in education is considered high. During both the pre- and post-restructuring periods, the
21 operation was critical in moving away from the project-centered approached managed by rather independent implementation units within the MoE to a sector-wide approach managed by the MoE. The operation was also critical in ensuring the transition from disjointed to harmonized, coordinated support from all donors active in the education sector. These achievements were not the result of a specific set of actions but rather the way in which it was prepared and implemented as well as the overall leadership exhibited by the Bank in Nicaragua’s education portfolio (see Table 4.7). Table 4.7. PASEN I’s Actions Contributing toward Harmonized Donor Assistance
Harmonized donor assistance
A Memorandum of Understanding was signed by all donors with formal acceptance of a 3-year rolling Common Work Plan, achieving the target. During 2006, the Government of Nicaragua promoted training for public officials in the principles of the Paris Declaration on Aid Effectiveness, the sector-wide approach and the use of the new aid delivery instruments by means of short workshops and two editions of a diploma course in Ownership, Alignment and Harmonization. Financial management arrangements were shared by all donors in the education sector (target exceeded). A single audit was also adopted as part of harmonization efforts. Joint missions were held, with all donors in the education sector (target exceeded). Joint missions also provided a forum to discuss key education policies, upcoming programs, joint program implementation, and monitoring of education indicators corresponding to, first, the Common Work Program and subsequently to the ESS. Increased Development Partner participation signaled a more integrated sector approach in implementation of activities/actions and monitoring and evaluation of outcomes/impacts.
Source: Developed by the author based on ICR (2012), additional data provided by the Bank and collected in PPAR mission.
4.24 During preparation, the Bank took a proactive role in supporting the MoE’s efforts to prepare a SWAP strategy for the education sector and building close working relationships among donors. During the pre-restructuring period, the Common Work Program served as the instrument utilized to integrate the instruments of national education policies and financial contributions from Development Partners to the sector. Specifically, the Common Work Program and supporting Annual Operating Plans (Planes Operativos Anuales) focused on policy priorities of the Government of Nicaragua in basic and middle education—pre-school, primary, secondary and adult education as outlined in the Education Plan 2001-2015. The Common Work Program received financial support from the World Bank (PASEN I), the European Commission (Programa de Apoyo Presupuestario Sectorial para la Educación - PAPSE) and Canada, Denmark and the Netherlands (Education Sector Support Programme - PROASE) as well as EFA-FTI funds. 4.25 As part of the SWAP strategy prepared by the Bank, a formal agreement was subscribed with individual DPs, which established the principles guiding external assistance to the education sector. Under these agreements, DPs expressed their
22 commitment to: i) provide support to the goals and targets identified under the Government of Nicaragua’s Education Plan; ii) homogenize of reporting and budgeting; iii) recognize the MoE’s leadership; iv) work jointly with the MoE and other DPs; and v) ensure that assistance from Development Partners was in line with Nicaragua’s National Education Plan, the EFA Plan, MoE’s educational policies, and the financing gaps identified by the Bank in the Joint Financing Agreement. Protocols were developed to establish the frequency, focus and framework of joint missions, as well as interactions between the DPs’ local representatives and the MoE, which included regular meetings with top authorities. Workshops and working groups were set up and operated regularly. The Education Sector Roundtable (Mesa Sectorial de Educación) constituted by representatives from the DPs, MoE, and civil society, was responsible for monitoring the implementation of Annual Operation Plans (Planes Operativos Anuales - POAs). 4.26 In the post-restructuring period, support from Development Partners under the Bank’s leadership focused on the 2011-2015 Education Sector Strategy (ESS) that was published in August 2011. The new ESS provided a reference point for all activities in the education sector, including a grant co-financed by the European Community and the Global Partnership in Education (GPE) focusing on preschool education (US$15.0 million); a grant from the European Community (EU) in support of the Education Sector Support Project (PROSEN) focusing on secondary education (EUR32.0 million); and the Bank-financed PASEN II focusing on primary education (US$25.0 million). The ESS has also served to guide the activities of other DPs, including the Spanish Aid Agency and UNICEF. From 2007 onward, the MoE has been more stringent regarding its acceptance of credits and donations, conditioning them on being fully aligned with its priorities as reflected in the ESS. 4.27 The Bank supported the utilization of national systems, including financial administration, under the SWAP harmonized approach adopted for the education sector. In 2005, Nicaragua adopted the a new Financial Administration and Budget Regime Law, which specifically prohibits public institutions from using resources for which no provision is made in the General Budget of the Republic.19 Thus, from 2006 onward, all external financing in the education sector was included in the National Budget System and National Management Information System regardless of the type of financing (i.e., budget support, common fund or project). Another positive experience in the alignment of national procedures is the use of a single financial audit for the entire annual budget, including treasury resources and all external resources registered. This single audit, conducted in 2006 and 2007, represented a considerable easing of the workload of the Government of Nicaragua’s Administrative and Financial Directorate and helped reduce transaction costs. It has also increased coordination between donors and provided all stakeholders with better-quality information for expenditure assessment. 4.28 In addition to the Bank-financed PASEN II, the World Bank is also managing the GPE-and EU-funded programs to reduce transaction costs and to harmonize
19
The Financial Administration and Budget Regime (Law No. 550) was enacted in 2005. It was applied for the first time in 2006, and is still in force.
23 implementation, supervision and disbursement procedures, in line with the Paris Declaration. 4.29 During the pre-restructuring period, Bank-led joint missions were conducted regularly focusing on the implementation of the Common Work Program in line with the SWAP approach. Joint missions had access to top national authorities, including the MoE and the President. They included representatives from bilateral agencies (including Canada, Denmark, Spain, and the United States), the European Union, IADB, and the World Bank. There was a sustained increase in the participation of DPs in joint missions—for example, over 30 participants representing 13 DPs participated in the August 2006 joint mission. Joint missions, as well as meetings of the Education Sector Roundtable, continued to be conducted during the post-restructuring period.
Objective 5 “To improve institutional management capacity and information systems to improve service delivery (Revised Objective)” 4.30 The operation’s contribution toward improving the MoE’s institutional management capacity and information systems to improve service delivery is deemed substantial. Several outputs were delivered under the operation focusing on the MoE’s institutional strengthening, including the partial implementation of the MoE modernization plan; training at central, departmental, municipal and school levels; the implementation of the National Management Information System within the MoE; and the implementation of an Intranet and e-mail system for MoE employees (see Table 4.8). Table 4.8. PASEN I’s Actions Contributing toward Improved Institutional Management Capacity Improved institutional management capacity
The first phase of the modernization plan was implemented including: i) in-depth institutional assessment; ii) conceptual design of a reengineering plan; iii) design of organizational systems to improve functions; and iv) institutional processes and transactions to improve planning and management. All departmental delegations and municipalities were equipped with information communication technology (target achieved). Thirty-one modules of the National Management Information System were designed and implemented (target exceeded). A total of 290 local technicians were trained in statistical analysis. The purchase of mainframe computers, servers, and networks has resulted in email accounts for all employees and an Intranet.
Source: Developed by the author based on ICR (2012), additional data provided by the Bank and collected in PPAR mission
4.31 In line with the revised Project Result Framework, budget execution is considered to be a proxy for the MoE’s institutional performance. As shown in Figure 4.4 and Table 4.8, budget execution of the MoE did not show meaningful improvement during the operation’s lifetime, with the percentage of execution of the total MoE budget increasing only slightly from 92 to 93.4 percent between 2004 and 2011 (i.e., below the 96 percent end-project target). More specific dimensions of budget execution yield even less
24 conclusive results. Specifically, the level of execution of capital expenditures, which arguably offers a better reflection of institutional capacity than current expenditures since it does not include personnel expenditures, remained largely unchanged between 2004 and 2011. The execution of budget expenditures financed by external sources, which can also be expected to be a better reflection of the MoE’s implementation capacity, show a significant decrease, from 78.3 to 55.9 percent between 2004 and 2011. 4.32 At the same time, this needs to be weighed against MoE’s greater capacity to manage information and use data for decision-making., MoE staff consistently reported during the PPAR mission that these tools have contributed greatly to more efficient communication and administration at the central, departmental, and municipal levels of the education system, as well as individual schools. In particular, the National Management Information System (now called the Work System for Planning, Monitoring, Evaluation and Education Statistics) has continued to evolve, reportedly leading to evidence-based decision-making and enhanced planning, M&E, and procurement capacity.20 In addition, it is clear that the quality and timeliness of education statistics has improved. The operation’s Project Result Framework, in the preparation of the Education Sector Plan 2008-2011 and the ESS 2011-2015. Figure 4.4. MoE’s Budget Execution by Type of Expenditure and Source of financing, 2004-2011
Source: MoE (2014).
5. Efficiency 5.1
Efficiency is deemed substantial.
5.2 In the long run, the Project can be expected to have a significant economic return given the high economic return of education outcomes. The economic justification for the 20
For example, the current system has an “Early Warning” feature that reports online data on enrollment and attendance on a daily basis, allowing the MoE to take timely actions and prevent dropouts.
25 operation as originally designed, with a focus on the expansion of the School Autonomy Model and the adoption of a sector-wide framework for the education sector, was grounded in the economic findings presented in the World Development Report for 2003 on “Making Services Work for Poor People.” The core economic argument made at appraisal departed from the traditional labor earnings or growth models approach. Instead, the PAD made the case that Nicaragua’s education sector was characterized by systemic problems of inequity and poor quality, which could only be tackled by drastically improving governance and accountability. Although no Internal Rate of Economic Return (IEER) was calculated, data from labor earnings and growth regressions were presented that indicated the importance of investment in the education sector (PAD, 2004). The operation’s contributions to the economic outcomes associated with increased educational attainment are both direct and indirect. Direct contributions include changes in effective enrollment (i.e., PDO 1) and quality of learning (i.e., PDO 2) as a result of actions supported under the operation, while indirect contributions include changes in educational attainment as a result of the enhanced effectiveness in the sector in general under the SWAP, as well as the harmonized strategy facilitated under the operation (i.e., PDO 5). 5.3 The operation’s IERR presented in the ICR (2011) was estimated at 13 percent, denoting a significant return on the investment over the long term.21 The benefits were estimated based on the upward trend observed in education attainment of the school-age population between 2005 and 2009 and the associated increase in lifetime earnings. Specifically, the economic analysis calculated potential changes in income for those students that entered school at the start of the operation in 2005. Based on the changes in education attainment registered in 2009 (i.e., a larger share of students completing primary education and starting secondary education), it was estimated that the educational attainment for that particular cohort would result in an additional 0.53 years of education. In turn, the improvement in education attainment was expected to translate into a discounted increase in income of US$500 over a lifetime (up to age 65), while the additional cost to the education system of providing the extra education was estimated at US$100. An IERR of 13 percent was obtained when these costs and benefits are applied to the total number of students. 5.4 The assumptions made in 2011 are still valid. Educational attainment has continued to increase. Between 2005 and 2011-2012, the average years of schooling in the total population had increased by an additional 1.2 years, more than twice what was assumed in the ICR’s economic analysis. Likewise, economic growth has continued to be strong, at an average growth rate of 4.6 percent between 2010 and 2013, which is expected to eventually translate into greater earnings. Thus, the estimated US$500 in discounted life income utilized in the ICR’s analysis is considered to be reasonable. In addition, the IERR calculated in the ICR reflects a lower-bound estimation of the operation’s actual economic impact, as the benefits do not include the impact of increased enrollment in pre-school and secondary education under the operation, or the incipient gains in student performance. Moreover, the full impact of some of the operation’s intermediate outcomes was not evident at closing. For example, textbooks and teacher
21
This section is based on the economic analysis presented in the operation’s ICR (Annex 3, pp. 27-28).
26 guides were printed and distributed toward the operation’s closing, too late for their impact on quality and retention to be captured. 5.5 The project implementation was delayed which resulted in the life of the Project being almost twice as long as originally anticipated.22 Part of this delay was due to the discussions of how to restructure project and the associated time to approve the agreed restricting. While this indicates that the use of Bank’s financial resources was less than optimal, the Bank and the government were proactive in restructuring the project to ensure that it could achieve new objectives.
6. Ratings Outcome 6.1
As the project was restructured, the phases of the project are separately weighted.
6.2 Original objectives: The operation is rated Moderately Satisfactory during the pre-restructuring period to reflect its Substantial relevance of objectives; Modest relevance of design; High efficacy for PDO 4, Substantial for PDO 1, and Modest for PDOs 2 and 3; and Substantial efficiency (a rating of 4 on the 6-point scale). 6.3 Revised objectives: The operation is rated Moderately Unsatisfactory during the post-restructuring period to reflect its Substantial relevance of objectives; Substantial relevance of design; High efficacy for PDO 4, Substantial for PDO 5 and Modest for PDOs 2 and3; and Modest efficiency (a rating of 3 on the 6-point scale). 6.4 The overall outcome of Moderately Satisfactory is based on the pre- and postrestructuring ratings, weighted by the amount of the total loan disbursed before (48 percent) and after (52 percent) restructuring (see Table 6.1).
22
Originally, Project implementation was anticipated to be 39 months, from Effectiveness in March 2005 to the original Closing date in June 2008. Actual Project implementation lasted 75 months, from Effectiveness in March 2005 to the actual Closing date in June 2011.
27 Table 6.1. PASEN I’s Overall Outcome Dates
Pre-Restructuring Period
Post-Restructuring Period
March 2005 to June 2008
July 2008 to June 2011
7.17
8.55
48.0%
52.0%
Disbursement US$ Million Percentage
Relevance of Objectives and Design Objective Design
Substantial
Substantial
Modest
Substantial Efficacy
Objective 1: Enrollment
Substantial
Objective 2: Quality and relevance of learning
Modest
Modest
Objective 3: Governance and accountability
Modest
Modest
High
High
Objective 4: Donor harmonization Objective 5: Institutional management capacity
Substantial Efficiency
Efficiency
Substantial
Substantial Overall Outcome
Outcome Score (1 to 6) Weighted score Total weighted score Overall Outcome
Moderately Satisfactory
Moderately Satisfactory
4
4
1.92
2.08 4.0 Moderately Satisfactory
Risk to Development Outcome 6.5 The overall risk to the development outcomes of the restructured Project is deemed moderate. Education is a top priority across the entire political spectrum, including the current administration, as shown by the sustained increase in own-source resources (“Recursos del Tesoro”) allocated to education, which increased dramatically from US$88 to US$222 million between 2004 and 2011. 6.6 The sustainability of the operation’s achievements in terms of enrollment, quality, institutional capacity and donor harmonization is considered to be likely. Enrollment (PDO 1) as well as the overall efficiency of the education sector is poised for further improvement, as a broad set of actions are being implemented under the ESS 2011-2015 aimed at increasing retention and quality of learning at all levels of education, including the “Love for the Little Ones” program (“Amor por los más Chiquitos”) focusing on preschool, the “Battle for the 6th Grade (“Batalla por el 6to grado”) focusing on primary, and the “Battle for the 9th Grade” (“Batalla por el 9to grado”) focusing on secondary education. In terms of quality of learning (PDO 2), the PAESE, PASEN II and PROESA Programs continue to support actions to improve quality of education at the pre-school, primary and secondary levels. While strengthening the institutional capacity of the MoE
28 (PDO 5) continues to be a challenge, it is being supported by PASEN II. Finally, while Nicaragua’s education sector continues to be heavily dependent on external assistance, Development Partners are committed to supporting the MoE in enhancing educational outcomes in a harmonized, coordinated manner (PDO 4). 6.7 In the areas of governance and accountability (PDO 3), the government has demonstrated its commitment toward the systematic assessment of student learning, as indicated by the regular application of national assessment exams and its continuous participation in regional examinations.23 However, now that the MoE is undergoing a period of institutional stability and capacity issues are being addressed, it would be important to resume the regular production, analysis and dissemination of education statistics in general to ensure transparency, accountability as well as the effective coordination of actions of all actors working in the education sector. In addition, as noted earlier, the “nuclear education model” that replaced the Autonomous School Model in 2007 was not implemented according to its original design, resulting in a greater concentration of responsibility at the national level than originally envisioned. Thus, it would be important to revisit the current decentralization strategy and the corresponding governance and accountability mechanisms, including community participation.
Bank Performance QUALITY AT ENTRY: Moderately Unsatisfactory
6.8 During preparation, the Bank provided strong leadership and technical support in the development of the SWAP strategy building upon the principles of the 2005 Paris Declaration on Aid Effectiveness. Donor coordination was built gradually by introducing opportunities for dialogue to discuss the country's priorities and identify opportunities to satisfy them with the resources of the international community. 6.9 The design of the PASEN was highly innovative, incorporating new lessons from research on improving service delivery and accountability through community involvement and creation of incentives for individual schools, along the lines of the World Bank 2004 World Development Report “Making Services Work for Poor People.” Other analytical work that informed project design included a comprehensive Development Economics Vice Presidency research study of case studies in multiple countries on the impact of decentralization in the education sector, the extensive research on Nicaragua’s autonomous schools that had been carried out jointly by the MoE and the Bank,24 as well as a social assessment of the needs of Indigenous Peoples. 6.10 A central component of the operation was the expansion of the Autonomous School Model, which had been under implementation in one form or another in Nicaragua since 1993. Providing support to the Autonomous School Model was consistent with the strong ownership of the MoE at the time of preparation as well as its 23
The fact that the Government of Nicaragua is now paying the TERCE participation fees out of own-source resources is indicative of its ownership. Previously, participation fees in regional examinations were funded by Development Partners.
24
The impact evaluation of Nicaragua’s Autonomous Schools Model was conducted by the Development Research Group of the World Bank. See, among others, King et al. (1998, 2001).
29 full endorsement by the Bank and the Development Partners in general. Although the Bank team built upon the extensive research that had been conducted on Nicaragua’s Autonomous School Model since the 2000s, including a comprehensive Development Economics research study of case studies in multiple countries regarding the impact of decentralization in the education sector, greater attention should have been paid to operational aspects. Weaknesses in some of these operational aspects included the definition and operationalization of the per capita funding formula, setting in place appropriate mechanisms for monitoring enrollment reported by schools, providing support to autonomous schools to enable them to fully exercise their new autonomy, ensuring that voluntary school fees did indeed remained voluntary, and addressing potential distortions of the Autonomous School Model in terms of equity both within and across schools. Likewise, a more in-depth analysis of the adequacy of the formula determining capitation grants would have been merited, considering that only a year into implementation this formula had to be modified in view of the distortions it generated. 6.11 The operation is considered to have been overly ambitious for simultaneously tackling the large-scale expansion of the Autonomous School Model and the MoE’s institutional strengthening. A phased approach would have been more appropriate, focusing first on strengthening the MoE’s institutional capacity and accountability mechanisms at the central, departmental and municipal levels, while piloting the implementation of fiscal transfers in a limited number of Autonomous Schools. In addition, the MoE’s capacity in terms of fiduciary and procurement issues was severely underestimated, particularly given that the operation did not rely on a self-standing Project Implementation Unit as did the preceding Bank projects in the education sector. Inadequate MoE capacity resulted in chronic implementation delays. Weaknesses in the operation’s scope, sequencing of the substantive reforms, and operational aspects of the Autonomous School Model are deemed major shortcomings that hindered quality at entry. QUALITY OF SUPERVISION: Moderately Satisfactory
6.12 The Bank team conducted two or more supervision missions annually, including joint ones with other Development Partners. These missions included appropriate technical specialists and provided an opportunity for in-depth review of the progress being made as well as the identification of implementation bottlenecks. The Project Task Team exhibited a strong commitment toward the harmonization of donor assistance, and its steadfast leadership was critical to the success attained in this area. In addition, the Bank Team was responsible for the supervision of the two EFA-FTI grants for US$24 million, which were fully disbursed. 6.13 The difficulties encountered during the transition period illustrate the challenges of striking a sound balance between flexibility and continuity in Bank-supported policies. As mentioned earlier, for more than a decade the Bank had been a key partner of the previous administrations in the development and implementation of the Autonomous School Model, providing support through an array of investment and policy operations as well as HIPC debt release. While the Bank continued supervision activities and dialogue with the incoming administration, the first two years after the change in administration were a difficult transition period. Incoming authorities perceived the Bank as rigid and
30 unresponsive due to its insistence on the need to implement according to the Credit Agreement. On the other hand, there was little the Bank Task team could do without a major restructuring which, at that point, was not possible due to the lack of a clear policy agenda for the education sector and mistrust of the Bank on the part of the MoE authorities. A more clear, coordinated position on the part of the Bank country and sector management with respect to the drastic change in policy would have been helpful for all parties involved, including the Bank Task Team. Eventually, 18 months after the change in administration, the operation was restructured to reflect the priorities of the new administration. Although the restructuring exhibited some weaknesses (e.g., it would have been prudent to revise some of the indicators that were poorly defined in the original Project Result Framework), the restructured Project provided an initial programmatic response to the new administration’s Implementation Sector Plan 20082011. Equally important, it permitted continuation of the sector dialogue in coordination with other Development Partners. 6.14 Supervision efforts became more intense during the post-restructuring period, and more frequent supervision missions were carried out in order to accelerate implementation and prevent further delays. Weekly meetings were held between the MoE and the Bank local staff to review the Project's implementation performance. In addition, the Bank hired consultants to monitor and supervise the procurement and distribution of textbooks and learning materials and the professional development training activities, which are the critical activities. Finally, the Bank team effectively capitalized on the postrestructuring implementation period to engage the new administration in the preparation of the ESS 2011-2015 and build a substantial education portfolio in coordination with other DPs. 6.15 Although the Bank team repeatedly called attention to ongoing procurement weaknesses and ongoing technical support was provided to the MoE in planning and implementation, more focused support in the areas of procurement, financial reporting requirements, and monitoring and evaluation would have been appropriate given the MoE’s limited capacity. OVERALL BANK PERFORMANCE: Moderately Satisfactory
6.16 Overall Bank performance is deemed Moderately Satisfactory given the moderately unsatisfactory performance in ensuring quality at entry and moderately satisfactory performance during supervision.
Borrower Performance GOVERNMENT PERFORMANCE: Satisfactory
6.17 Education was a top priority for both the previous and current administrations, both of them having demonstrated high commitment toward the objectives supported by the operation in the pre- and post-restructuring periods. While the key policy objectives remained relevant under the incoming administration, there was a drastic departure from the previous decentralization strategy built around the Autonomous School Model and other activities, such as Report Cards that had been central to the Bank's portfolio in the education sector for over a decade. The transition period was challenging, resulting in
31 freezing project disbursements and putting various activities on hold for approximately two years. During this time, the MoE reshaped its strategic priorities, which received support under the restructured operation. The Government handled the transition to a new strategy well, and that the new strategy itself was appropriate. 6.18 The Ministry of Finance provided strong support on matters related to fiduciary issues throughout the operation’s lifetime, and counterpart funds were made available as anticipated. The Government of Nicaragua met all key loan covenants, with the exception of one that called for the presentation of terms of reference for a management firm specializing in the management of change. IMPLEMENTING AGENCY PERFORMANCE: Moderately Unsatisfactory
6.19 Project implementation was the responsibility of the MoE—named Ministry of Education, Culture, and Sports (MoECS) under the previous administration and Ministry of Education (MINED) under the current one. During appraisal, the need for strengthening the MoE’s institutional capacity was correctly identified as a critical weakness of Nicaragua’s education sector that needed to be explicitly addressed under the operation. The lack of capacity did indeed prove to be an implementation bottleneck throughout the operation’s lifetime. At times, this inherent weakness was compounded by the frequent change in MoE authorities and key technical staff. 6.20 As mentioned earlier, during the pre-restructuring period, the performance of the education sector was regularly monitored based on supporting M&E data and presented in the “State of Basic and Secondary Education” annual reports. In additional, analytical studies were regularly conducted on various aspects of education provision, such as municipal performance, which, together with education statistics, were publicly disseminated in the MoE’s website. The M&E function, however, has been weak during the post-restructuring period, as currently there is a lack of official education data being made publicly available.25 6.21 Throughout implementation, the MoE exhibited weaknesses in its internal control systems, inadequate coordination between technical and financial management areas within the MoE, unreliable financial information mainly due to high staff turnover, and some delays in payments to providers. Weaknesses in procurement also hampered project implementation. After a two-year hiatus in the operation’s implementation, the restructuring resulted in renewed emphasis in the MoE’s implementation efforts. However, continued staff turnover, lack of clarity about policies, lack of project implementation experience, and lack of familiarity with World Bank procurement rules and procedures continued to be implementation barriers. As a result, the operation’s closing date had to be extended three times for a total of three years.
25
Obtaining basic education statistics—e.g., enrollment, dropout, repetition, completion rates, etc.—during the PPAR mission required a written request in the form of an email to MoE staff responsible for coordinating external financing detailing the statistics that were been requested, and a meeting with the head of the MoE statistics department. Some of the requested statistics were not provided (i.e., dropout rates), for which other sources, such as PREAL reports, had to be used as sources of data.
32 OVERALL BORROWER PERFORMANCE: Moderately Satisfactory
6.22 Overall Borrower performance is deemed Moderately Satisfactory given the Government’s satisfactory performance and the implementing agency’s moderately unsatisfactory performance.
Monitoring and Evaluation Implementation M&E DESIGN 6.23 The original and revised Project Result Framework exhibited several weaknesses. First, there were weaknesses in the definition of PDOs. Specifically, PDOs were not clearly defined. Some definitions were ambiguous and included more than one dimension (e.g., “improved attention to quality and relevance”). Moreover, in the original Project Result Framework there were internal inconsistencies between the PDO definitions in the PAD and those in the DCA. In both the original and revised Project Result Framework, there were inconsistencies between the main text and the corresponding annexes in the PAD and Project Restructuring Paper. 6.24 Second, there were weaknesses in the definition of the original and revised PDO indicators. Specifically, some operational definitions of PDO indicators focused on outputs rather than outcomes. For example, the indicators related to donor harmonization did not indicate the anticipated results, such as decreased transaction costs and decreased staff time, but focused instead on measurable outputs, such as the number of donors providing support to the Government of Nicaragua’s Common Work Program and participating in joint missions. Other PDO indicators lacked precision and/or had no clear link with the actions being supported under the operation (e.g., “reduced percentage of unqualified teachers in rural schools and disadvantaged regions”). In addition, some PDO indicators were missing; in particular, there were none related to relevance. Finally, some of the intermediate indicators were not adequate measures of the corresponding PDOs. For example, percentage of reduction in centralized expenditures of the Ministry can be sensitive to many factors and is not a gauge of improvements in governance and accountability in the education sector. 6.25 Third, the M&E strategy was only partially defined. While the PAD specified which departments within the Ministry were responsible for data collection, it did not present a strategy for collecting and analyzing the data. M&E IMPLEMENTATION
6.26 Baseline and follow-on data were collected and monitored by the MoE using its information and monitoring system. However, data monitoring was less frequent than required, resulting in monitoring delays throughout the operation’s lifetime. Under the new administration, there was insufficient emphasis on ensuring the continuity of the M&E function, both within the operation and at the ministry level. Collection of data related to activities that were not priorities of the new government or to its policies was interrupted. 6.27 Another important shortcoming was the lack of comparability between the national student assessments carried out during the pre- (2002 and 2006) and post-
33 restructuring periods (2009 and 2010). Although the lack of comparability reportedly resulted from the shift from standards to competencies in the old and the new curriculum, the exams were applied to different grades and it is not clear whether the assessments were consistent in terms of level of content and complexity of questions or whether the proficiency levels were lowered. The need to ensure a minimum level of comparability by selecting some comparable items to be measured with both instruments was properly noted by the Bank at restructuring.26 The processing of student achievement data was not automated, which in turn caused additional delays. Some of the evaluations anticipated at appraisal (i.e. teachers' pedagogical practices; analysis of variation in performance across schools; surveys of school councils; and evaluation of the pilot preschool) were not implemented. M&E UTILIZATION
6.28 At the operational level, MoE officials consistently reported during the ICR mission that the National Management Information System developed under the operation (now called the Work System for Planning, Monitoring, Evaluation and Education Statistics) has led to evidence-based decision-making and enhanced planning, M&E, and procurement capacity. One notable example is the “Early Warning System” that reports online data on enrollment and attendance on a daily basis, allowing the MoE to take timely actions and prevent dropouts. At the policy level, the operation’s Project Result Framework, were important inputs in the preparation of the Education Sector Plan 2008-2011 and the ESS 2011-2015. 6.29 In terms of accountability, data from national learning assessments were provided to schools, and workshops were held with principals and teachers. Data was also shared with Development Partners and publicly disseminated. As mentioned earlier, explicitly training teachers to address performance weaknesses would have been important to increase the quality of learning. M&E QUALITY RATING: Modest
6.30
M&E quality is deemed Modest for the reasons articulated above.
7. Lessons 7.1 Flexibility by the Bank in the face of changing government policy may be needed to secure continued development impact. When faced with a major change in government policy, the Bank engaged in a long and frank dialogue to understand how the project could best be restructured to remain relevant. This required a major change in the underlying logical framework of the project and the willingness for the Bank to accept a new approach. Without this willingness to be flexible and to significantly adjust the project design, the project would have likely been unsuccessful after the policy shift. 7.2 Ultimately, the sustainability of an education reform depends on information transparency, communications, and buy-in from stakeholders. While the school autonomy model was developed incorporating strong technical support from the World 26
Project Restructuring Paper (p. 11)
34 Bank, there appeared to be little attempt to build consensus around the model or to debate alternatives. This led to political opposition that made it vulnerable to early cancellation. The lack of data systems weakened the capacity of policy makers to understand what was working. Likewise, communities had little information about the impact of the reform. Information, including evidence on the impact of the reform, could have been used along with community outreach programs to address community concerns. This contributed to the lack of consensus about the new model and ultimately to its demise. 7.3 World Bank support needs to go beyond technical aspects. In developing the project, the World Bank provided strong technical support to design the school autonomy model. However it appears that Bank did not provide sufficient support to the logistic elements of the reform, such as piloting an information system or building local capacity. Likewise it appears that the government and Bank did take into account the political economy behind the reform. While technical support is important for the design of reforms, its implementation needs different types of support that also need to be developed during the design phase. 7.4 Donor coordination and a SWAP can continue, and even be strengthened in the face of adversity and significant policy change. One of the project’s objectives was to strengthen donor coordination and reduce fragmentation in the education sector. The changes in policy had the potential to reduce donor coordination as different donors look for new alternatives in the education sector. The Bank was able to work with others to strengthen coordination during the time of uncertainty. The Bank and the donor community established protocols and agreements that played an important role in keeping development partners together. 7.5 The use of country systems contributed to the long-term sustainability of World Bank support to the education sector in Nicaragua. The project successfully supported the use of country systems as one of its initiatives. This is usually justified as reducing transaction costs for the government. However in the case of Nicaragua, it also appeared to have contributed to the stability of the World Bank’s and the development community’s support for the education sector. Interviews suggest that this initiative facilitated the restructuring and the development of the Education Sector Strategy.
35
References Akerman, J. 2005. “Social Accountability in the Public Sector: A Conceptual Discussion, Social Development Papers, Participation and Civic Engagement,” Paper No. 82, World Bank, Washington, DC. Arcia, G., Porta, E., and J.R. Laguna. 2004. Otro vistazo a la autonomía escolar de Nicaragua: Aceptación y percepción en 2004. Ministerio de Educación, Cultura y Deportes, Managua. Birdsall, N., Levine, R. and A. Ibrahim. 2006. “UN Millennium Project 2005. Toward Universal Primary Education: Investments, Incentives, and Institutions. Task Force on Education and Gender Equality.” London, Sterling, Va: Earthscan. Gershberg, A. and M. Jacobs. 1998. Decentralization and Recentralization: Lessons from the Social Sectors in Mexico and Nicaragua, Working Paper No. 379, Office of the Chief Economist, Inter-American Development Bank, Washington DC. Guzmán, J. L. (2013), Políticas Docentes para mejorar la educación en Centroamérica: Tendencias Regionales, cited in PREAL (2014). IEG. 2013. Nicaragua - Education Project (PASEN) ICR Review posted May 28, 2013. Washington, DC: World Bank. INIDE. 2005a. IV Nicaragua’s Household Census. Managua. _____. 2005b. VIII Nicaragua’s Population Census. Managua. Instituto Nacional de Estadísticas y Censos (INEC). 2006. Encuesta Nacional de Hogares sobre Medición de Nivel de Vida 2005. Managua. Instituto Nacional de Información de Desarrollo (INIDE), and Ministerio de Salud (MINSA). 2013. Encuesta Nicaragüense de Demografía y Salud 2011/12. Managua. IMF. 2013. Nicaragua: Staff Report for the 2013 Article IV Consultation. Jané, E. 2008. “Assessment of the sector-wide approach in the education sector in Nicaragua.” Background paper prepared for the “Education for All Global Monitoring Report 2009 - Overcoming Inequality: Why Governance Matters,” 2009/ED/EFA/MRT/PI/10, Education For All Global Monitoring Report, UNESCO, Paris. King, E., and B. Ozler. 1998. What’s Decentralization Got to Do with Learning, The Case of Nicaragua's Autonomy Reform, Working paper Series on Impact Evaluation of Education Reforms, No. 9, World Bank, Washington, DC. King, E., Ozler, B. and L. Rawlings. 2001. Nicaragua's School Autonomy Reform: Fact or Fiction? Working paper Series on Impact Evaluation of Education Reforms, No. 19, World Bank, Washington, DC. Lewis, M. and G. Petterson. 2009. Governance in Education: Raising Performance, December 22, 2009, World Bank Human Development Network Working Paper, World Bank, Washington, DC. Ministerio de Educación. 2010. Plan Estratégico de Educación 2011-2015. Managua. Ministerio de Educación, Cultura y Deportes. 2006. Estado de la Educación Básica y Media 2005, Dirección General de Prospección y Políticas. Managua. Ministerio de Educación, Cultura y Deportes. 2006. Plan Común de Trabajo del MECD - Prioridades Estratégicas para el periodo 2005 – 2008. Managua. Porta, E., Gutiérrez, R. and J.R. Laguna. 2005. Estado del Sistema Educativo Nicaragüense: Una Perspectiva Municipal, Dirección General de Prospección y Políticas, Ministerio de Cultura, Educación y Deporte. Managua. _____. 2007. Apostar por la Educación: Informe de Progreso Educativo – Nicaragua, Informe del Foro Educativo Nicaragüense EDUQUEMOS. Managua. _____. 2014. Calidad y Equidad para el Desarrollo Humano: Informe de Progreso Educativo – Nicaragua, Informe del Foro Educativo Nicaragüense EDUQUEMOS. Managua.
36 UNESCO. 2012. Compendio Mundial de la Educación 2012: Oportunidades perdidas: El impacto de la repetición y de la salida prematura de la escuela. Paris. UNICEF. 2012. Completar la Escuela en Nicaragua, UNICEF, Asociación Civil Educación Para Todos. Managua. World Bank. 2004. “Project Appraisal Document on a Nicaragua - Education Project (PASEN).” Report no. 29042. Washington, DC. http://documents.worldbank.org/curated/en/2004/05/5182924/nicaragua-education-project-pasen _____. 2007. Nicaragua - Country partnership strategy for the period FY08-FY12, World Bank, Washington, DC. _____. 2008a. “Nicaragua - Education Project.” Project Paper. Report no. 44291. Washington, DC. http://documents.worldbank.org/curated/en/2008/06/9576921/nicaragua-education-project _____. 2008b. “Nicaragua: Poverty Assessment.” Volume 1. Main Report. Report no. 39736-NI. Washington, DC. http://documents.worldbank.org/curated/en/2008/05/9648177/nicaragua-povertyassessment-vol-1-3-main-report _____. 2009. “Nicaragua Development Policy Credit Implementation Completion and Results Report.” Report no. ICR1307. Washington, DC. http://documents.worldbank.org/curated/en/2009/09/18265221/nicaragua-development-policy-creditnicaragua-development-policy-credit _____. 2010. “Nicaragua - Education Project (PASEN).” Project Paper. Report no. 58451. Washington, DC. http://documents.worldbank.org/curated/en/2010/12/13259855/nicaragua-educationproject-pasen-restructuring-vol-1-2-main-report _____. 2011a. “Nicaragua - Education Project (PASEN).” Implementation Completion and Results Report. Report no. CR1897. Washington, DC. http://documents.worldbank.org/curated/en/2011/12/15650543/nicaragua-education-project-pasen) _____. 2011b. “Project Appraisal Document on a Nicaragua - Second Support to the Education Sector Project.” Report no. 64618 Washington, DC. http://documents.worldbank.org/curated/en/2011/12/15581862/nicaragua-second-support-education-sectorproject _____. 2012a. “Nicaragua - Country Partnership Strategy for the Period FY08-FY12: IEG CPSCR Review. Washington, DC: World Bank Group. _____. 2012b. “Nicaragua - Country Partnership Strategy for the Period FY13-FY17.” Report no. 69231. Washington, DC. http://documents.worldbank.org/curated/en/2012/10/16870670/nicaraguacountry-partnership-strategy-period-fy13-fy17 _____. 2014. World Development Indicators 2014. Washington, DC.
37
Annex A. Basic Data Sheet NICARAGUA EDUCATION PROJECT (LOAN IDA-39780 TF-53991 TF-57311) Key Project Data (amounts in US$ million) Appraisal estimate 15.00
Actual or current estimate 15.72
Actual as % of appraisal estimate 104.80
Loan amount
15.00
15.72
104.80
Cancellation
0.00
0.16
0.00
Total project costs
Cumulative Estimated and Actual Disbursements FY05 FY06 FY07 FY08 FY09 FY10 FY11
FY12
Appraisal estimate (US$M)
2.14
6.42
10.71
14.46
15.00
15.00
15.00
15.00
Actual (US$M)
0.00
4.60
7.16
7.16
7.16
12.32
13.88
15.72
Actual as % of appraisal
0.00
71.65
66.80
49.51
47.73
82.13
92.53 104.80
Date of final disbursement: 11/03/2011
Project Dates Initiating memorandum
Original 02/19/2003
Actual 12/15/2003
Negotiations
05/20/2004
05/20/2004
Board approval
08/12/2003
09/02/2004
Signing
09/17/2004
09/17/2004
Effectiveness
03/17/2005
03/17/2005
Closing date
06/30/2008
06/30/2011
ANNEX A
38
Staff Time and Cost Stage of Project Cycle
Staff Time and Cost (Bank Budget Only) No. of staff weeks
US$ Thousands (including travel and consultants costs)
FY03
22
119.12
FY04
45
123.94
FY05
3
22.97
70
266.03
FY05
16
59.26
FY06
31
108.24
FY07
21
75.86
FY08
26
82.82
FY09
35
148.26
FY10
41
119.89
FY11
45
138.44
FY12
1
2.991
214
735.77
Lending
Total: Supervision/ICR
Total: Task Team Members Names
Title
Unit
Responsibility/ Specialty
Lending Christina Alquinta
Consultant
ECSHD
Education
Angela Demas
Sr. Education Specialist
LCSHE
Education
Suhas D. Parandekar
Sr. Education Economist
EASHE
Task Team Leader 1
Maria Paula Savanti
E. T. Consultant
DECWD
Luis Tineo
Sr. Infrastructure Specialist
GPOBA
Infrastructure
Manuel Antonio Vargas Madrigal
Sr. Financial Management Specialist
OPCFM
Financial Mgmt.
Alfonso F. de Guzman
Consultant
AFTED
Education
Solange A. Alliali
Sr. Counsel
LEGLA
Legal
Christina Alquinta
Consultant
ECSHD
Education
Ariana Castillo
Consultant
Maria Vanessa Castro
Consultant
LCSHE
Pedro Cerdan-Infantes
E. T. Consultant
EASHE
Education
Michael Drabble
Sr. Education Specialist
LCSHE
Task Team Leader 3
Supervision/ICR
39
ANNEX A
Irani G. Escolano
Consultant
LCSPT
Procurement
Sergio Espana
Consultant
LCSHE
Education
Deon P. Filmer
Lead Economist
DECHD
Macro-economy
Marta Valeska Garcia Argenal
E. T. Consultant
LCCNI
Jose Ramon Laguna Torres
Consultant
EASHD
Alvaro Larrea
Sr. Procurement Specialist
LCSPT
Procurement
Coleen R. Littlejohn
Sr. Operations Officer
AFCW1
Operations
Asako Maruyama
Consultant
LCSHE
Education
Brenda Mendieta-Arroyo
Consultant
LCCNI
Education
Miriam Matilde Montenegro Lazo
Operations Officer
LCSH S
Operations
Anemarie GuthProite
Procurement Specialist
LCSPT
Procurement
Enrique Antonio Roman
Financial Management Specialist
LCSFM
Financial Mgmt.
Luis Tineo
Sr. Infrastructure Specialist
GPOBA
Infrastructure
Morag N. Van Praag
Sr. Finance Officer
CTRDM
Finance
Alexandria Valerio
Sr. Economist
HDNED
Task Team Leader 2
Manuel Antonio Vargas Madrigal
Sr. Financial Management Specialist
OPCFM
Financial Mgmt.
Eduardo Velez Bustillo
Sector Manager
EASHE
Education
Aracelly G. Woodall
Sr. Program Assistant
LCSTR
Admin. Support
Alfonso F. de Guzman
Consultant
AFTED
Education
Michael Drabble
Sr. Education Specialist
LSHE
TTL
Javier Luque
Sr. Education Economist
LCSHE
Education
Debora Brakarz
Consultant
LCSHE
Julie B. Nannucci
Sr. Program Assistant
LCSHE
Education
Other Project Data Borrower/Executing Agency: Follow-on Operations Operation Second Support to the Education Sector Project (PASEN II)
Credit no. P126357
Amount (US$ million) 25.0
Board date January 17, 2012
40
Annex B. Additional Tables Table B.1. Original Project Components Original Project Components Component 1 - Strengthen the MoE’s Stewardship Capacity (US$3.14 million at appraisal; actual US$1.51 million)
Subcomponent 1.1 - Stewardship at the Central Level Support to the MoE in its transition from an organization staffed by political appointees to professional civil servants so that jobs of MECD officials were clearly defined, and hiring, promotion, and firing decisions were made on the basis of merit. As functions were handed over to municipalities, the size of the central unit of MECD was to be reduced by providing incentive packages for voluntary retirement of staff and offering more attractive salaries for qualified staff. Policymaking, planning, and budget formulation process of the MECD were to be strengthened, and responsibilities defined between central, municipal, and local levels. Subcomponent 1.2 - Stewardship at the Municipal Level Support the Government's policy of decentralization of administrative and pedagogical supervision of Autonomous Schools, including financial support to a central unit at the MoE to implement the decentralization policy. Capacity assessment of municipalities and strengthening of municipal capacities to provide administrative and pedagogical support to schools
Component 2 - Program Monitoring, Evaluation, and Continuous Auditing System (US$3.89 million at appraisal; actual US$0.41 million)
Subcomponent 2.1 - Compilation, Analysis and Dissemination of Educational Statistics Support to provide accurate and timely information about student learning and process of continuous audit of student enrollment data. Support to the development of Report Cards to give information to schools and municipalities and emphasize the use of educational statistics in the preparation of school development plans by autonomous schools and by municipal education agents. Subcomponent 2.2 - Evaluation of Competencies in Spanish and Mathematics for Primary and Secondary School students Support the MoE's policy of evaluating student performance to improve student learning, including the administration of a national student-testing program at a census level of all schools. Feedback from the test results back to the classrooms and the school communities. Testing of teacher instructional practices. Two separate benchmarking activities to be conducted to bring awareness of the performance of Nicaraguan students in comparison to the Latin American region and across the globe.
41 Component 3 - Implementation of the School Autonomy Program (US$8.28 million at appraisal; actual US$2.89 million)
Component 4. Pilot Program for Community Preschools (US$0.12 million at appraisal; actual US$0)
ANNEX B
Support to the implementation of a School Autonomy Program to provide grants directly to schools managed by an elected school council and a principal accountable to the local community. Financial support for capitation grants for enrollment increases in Autonomous Schools, on the condition that a performance agreement signed between the Ministry and the municipality. 1800 schools to be incorporated into the autonomy regime in 2006. Support to MoE central authorities to provide guidance to schools through standardized evaluation of student learning and pedagogical assistance to schools. Support to the revision of the strategy for providing services to the pre-school level, specifically changes in the regulations in place regarding the age at entry for primary school and better articulation with Early Childhood Development services provided by the MoE and financed by the Inter-American Development Bank (IADB). To be accomplished through incentive payments to community preschool teachers, provision of didactic materials for teachers and students, and training of community preschool teachers.
ANNEX B
42
Table B.2. Revised Project Components Revised Project Design Component 1 – MoE’s Institutional Strengthening of Management Capacities (US$0.64 million; actual US$1.39 million)
Component 2 - Quality Improvement of Preschool, Primary, and Secondary Education (US$8.05 million; actual US$9.46 million)
Support for institutional strengthening workshops at the department and municipal levels to implement and monitor the Decentralized and Participative Education Management Model, including the Autonomous Regional Education System. Support for the development of a technological platform for the establishment of a Management Information System and tools to map and determine the supply and demand for education.
Subcomponent 2.1 - Establishment and Implementation of a National Strategy for Learning Assessments Support to the collection, dissemination and use of student learning outcomes for quality improvement interventions and construction of baseline of learning outcomes to evaluate the curriculum transformation process that was underway. Subcomponent 2.2 - Development of Learning materials and Provision of Textbooks Support for textbooks for pre -school and primary education in Spanish and Literature, Environmental Sciences, Social Studies, and Life Skills, and the provision of primary school libraries. Subcomponent 2.3 – Quality Improvement Interventions in Targeted Rural Schools Support for teacher education workshops for multi-grade schools, as well as provision of classroom materials, development of training workshops for pedagogical advisors at the departmental level, and planning of workshops for rural school communities to develop local work plans specific to local issues and circumstances. Subcomponent 2.2 - Quality Improvement Interventions Targeted to the Last Two Grades of Secondary Education Design and distribution of study guides in Spanish and Math, and associated training of teachers.
43
Annex C. List of Persons Met Ministry of Education (MINED) David Otero (Director, Project Directorate, MINED) Maria Elsa Guillén (Director, Directorate of Secondary Education, MINED) Marina Moraga García (Directorate of Primary Education, MINED) Reyna Lopez (Office of Learning Assessment, MINED Francis Díaz Madriz (General Director, Directorate of Financial Administration, MINED) Manuel Guevara Martínez (Director, Office of Education Statistics, MINED) Elia Suárez Silva (Acting Director, Directorate of External Cooperation, MINED) Salvador Cruz Cohelo (Financial Director, Directorate of Financial Administration, MINED) Celia Catero (Accounting Specialist, Directorate of Financial Administration, MINED) Vilma Pantoja (Directorate of External Cooperation, MINED) Schools Ibaña Murillo, Director, Centro Escolar Modelo Morimbó, Masaya Urania Marenco, Director, Centro Escolar María Auxiliadora, Diriomito, and Escuela Gilberto Siles González, Comarca Ruíces Galana Lisseth del Socorro, Secretary, Escolar María Auxiliadora, Diriomito Bismar Carranza Pineda, Teacher, Escuela Gilberto Siles González Zaida López, Teacher, Escuela Gilberto Siles González José Félix Ruíz Cárdenas, Parent Council, Comarca Ruíces Galana Development Partners Sandra M. Peña (Adviser on Cooperation Issues, European Union Delegation in Central America and Panama) Roberto Paramo Sandino (Education Officer, Nicaragua Office, UNICEF) Alice Slate (Education Specialist, Nicaragua Office, USAID) Other Actors Luis Adolfo Medal (Former Advisor to the Ministry of Education) Emilio Porta (Former General Director, Ministry of Education) Carlos Lola (Former Director, General Directorate of Education Development, Ministry of Education) José Ramón Laguna (Former PASEN I Consultant to the Minister of Education) World Bank Staff Suhas D. Parandekar (Senior Education Economist, EASHE; former Team Task Leader, PASEN I) Alexandria Valerio (Senior Economist, HDNED; former Team Task Leader, PASEN I) Michael Drabble (Senior Education Specialist, Brazil CMU; former Team Task Leader, PASEN I) Sajitha Bashir (Sector Manager, Education, Eastern and Southern Africa) Janet Entwistle (Senior Operations Officer, LCSHE) Enrique Alasino (Education Officer, LCSHE) Patrick Philippe Ramanantoanina (Senior Operations Officer, LCSHE; co-Team Task Leader, PASEN II)
45
Annex D. Borrower Comments The Ministry of Education confirms that it is in agreement with the evaluation’s conclusions and its rating of moderately satisfactory, as well as with the lessons that it contains.
ANNEX D
46