Studies in Agricultural Economics 117 (2015) 126-130
http://dx.doi.org/10.7896/j.1527
POTORI Norbert* and STARK András‡
Do crude oil prices influence new crop sunflower seed futures price discovery in Hungary? The oil produced from sunflower seed is primarily used for human consumption. It can substitute for other edible vegetable oils, such as rapeseed oil, processed into biodiesel in the European Union. This paper assesses the influence of crude oil futures on new crop sunflower seed futures in Hungary during the growing seasons of sunflower by applying standard cointegration analysis for the period 2004-2013. Tests were performed for the entire period and each sunflower growing season. For comparison, the influence of Paris rapeseed futures on sunflower seed futures was also assessed. The contrasting estimations for the global and seasonal characteristics of the variables suggest that standard cointegration analysis may not be appropriate for multiannual price series of agricultural commodities with strong seasonality in production because it will not capture the periodical shocks in supply and demand. The results are briefly discussed from the aspect of the fundamentals of the sunflower seed market. Keywords: price cointegration, sunflower seed, crude oil, growing seasons * Agrárgazdasági Kutató Intézet, Zsil utca 3-5, 1093 Budapest, Hungary. Corresponding author:
[email protected] ‡ Current address: Budapest Bank Zrt., Budapest, Hungary.
Introduction Throughout the 2000s, particularly after the sharp rise in oil prices in 2008, public and private interest in diversifying energy sources intensified remarkably. The reasons for this included volatility in the prices of petroleum products, the finite nature of fossil fuels and increasing environmental concerns, especially related to greenhouse gas emissions. Also, more emphasis was placed on novel ways to add value to agriculture and to promote growth poles which could deliver ‘green’ jobs in non-carbon intensive sectors of the economy. These factors reinforced interest in renewable energy sources, including biofuels (UNCTAD, 2014). Global production of biofuels increased dynamically, primarily due to policies that stimulated the use of fuel ethanol and biodiesel. The emerging biofuels market generated significant demand for some agricultural commodities, especially food crops, including oilseeds, strengthening the linkages between agricultural commodity markets and fossil fuel markets, and between different agricultural commodity markets (FAO, 2008). The European Union (EU), initially a leader in biofuels legislation, accounted for around 40 and 45 per cent respectively of global production and consumption of biodiesel in 2013 (calculations based on F.O. Licht, 2015). The EU started to implement biofuel-related targets in 2003 with Directive 2003/30/EC. This Directive set indicative biofuel penetration targets of 2 per cent by the end of 2005 and 5.75 per cent by the end of 2010. By 2020, on the basis of the Renewable Energy Directive (RED) 2009/28/EC, the EU aims to have 10 per cent of the energy used in transport in every EU Member State come from renewable sources including biofuels. Biodiesel is a nontoxic and biodegradable renewable fuel. Conventional or ‘first generation’ biodiesel is produced from vegetable oils (i.e. rapeseed oil, soybean oil, palm oil etc.), used cooking oils and animal fats through transesterification. In the transport sector, biodiesel is used in its pure form or blended with fossil diesel fuel. In the EU, the global leader both in rapeseed production and crushing, the biodiesel industry relies primarily on rapeseed oil as feedstock. 126
Recently, however, the share of rapeseed oil in the feedstock mix has decreased from 73 per cent in 2010 to 58 per cent in 2013, mostly due to the increasing use of hydrotreated palm oil and recycled vegetable oils (Flach et al., 2014), the latter counting double in the RED target in many EU Member States. In 2013, the 5.6 billion litres of rapeseed oil processed by the EU biodiesel industry represented around half of the total output of the EU Member States. Although sunflower seed has the highest oil content (up to 55 per cent) among oilseeds, its suitability for biodiesel production is limited by the high content of linoleic acid (Lewandowski, 2013). Sunflower oil is primarily used for human consumption and it has applications in the cosmetics industry too. According to the European Biomass Industry Association, only around 1-2 per cent of the biodiesel produced in the EU is derived from sunflower seed oil. World sunflower seed production is characterised by strong seasonality. As the statistics of Oil World (ISTA Mielke GmbH) show, in recent years more than three quarters of the global crop were harvested during September and October. The largest producers in the Northern Hemisphere include the EU, Ukraine, Russia, China, Turkey and the United States. Since its accession to the EU in 2004, Hungary has been one of the major sunflower seed producing Member States in the EU, ranking fourth after France, Romania and Bulgaria1 during the period 2004-2013. The country has been a net exporter of sunflower seed, and of both raw and edible sunflower oil, mainly to other EU Member States. Hungary is the only country in the EU where sunflower seed futures are traded. Since sunflower oil can substitute for other edible vegetable oils processed into biodiesel in significantly larger quantities, the sunflower seed market could be interlinked with the crude oil market indirectly. Therefore, we hypothesised that crude oil futures prices influence new crop sunflower seed futures price discovery in Hungary. Despite the wide literature on the relationship between agricultural commodity and fossil fuel prices, only a very small number of authors have considered sunflower seed or sunflower oil in 1
Romania and Bulgaria accessed the EU only in 2007.
30
12
25
10
20
8
15
6
10
4
5
2
0
Harvested seed (million tonnes)
their analysis. For sunflower seed, these include Nazlioglu and Soytas (2011) showing neutral impacts of low-frequency monthly crude oil prices in Turkey for the period January 1994 to March 2010. For sunflower oil, these include Yu et al. (2006) finding no influence of weekly crude oil prices on sunflower oil prices quoted in Hamburg for the period January 1999 to March 2006, and Hassouneh et al. (2011) providing evidence of a single cointegration relationship among weekly crude oil, biodiesel and sunflower oil prices in Spain for the period November 2006 to October 2010. To test our hypothesis, we applied standard cointegration analysis for a multiannual time period but were also interested in examining the strength of the possible linkage between these markets in the individual growing seasons of sunflower as these often exhibit, by nature, substantial changes in the market fundamentals. For comparison, the influence of Paris rapeseed futures on sunflower seed futures was also assessed.
Crushed seed (million tonnes)
Crude oil price influence on sunflower seed futures price discovery
0 2004 2005 2006 2007 2008 2009 2010 2011 2012 2013
Rapeseed
Sunflower seed
Hungary
EU
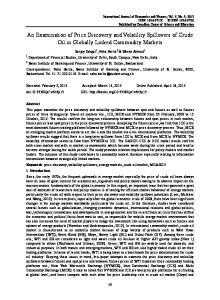
Figure 1: Sunflower seed production of Hungary and the EU-27 during the period 2004-2013, and EU-27 crushing of rapeseed and sunflower seed in the 2003/04-2012/13 crop years (OctoberSeptember) which include the sunflower growing seasons (AprilOctober).
Methodology
Data sources: Hungarian production data: Hungarian Central Statistical Office; other data: Oil World (ISTA Mielke GmbH)
Statistical methods
robust results than other more advanced techniques in the case of seasonal segmentation of the data. We refrained from the use of models which recognise the presence of structural breaks in order to avoid over-segmentation of the time series, as well as of threshold cointegration techniques due to the possible complexity of the SETAR-based approach. Our calculations were made using version 3.1.1 of the R software; for the ADF, the KPSS and the Johansen tests version 0.10-32 of the tseries package and version 1.2-8 of the urca were applied, respectively.
To assess the influence of crude oil and rapeseed futures on new crop sunflower seed futures prices in Hungary, firstly the Augmented Dickey-Fuller test (ADF) (Dickey and Fuller, 1979) and the Kwiatkowski-Phillips-Schmidt-Shin test (KPSS) (Kwiatkowski et al., 1992) were applied for the entire 2004-2013 period and each individual sunflower growing season to verify whether the price series used were integrated. (Individual variables, which permanently change due to many developments, are integrated when their differences of order d are stationary, and d > 0.) Secondly the Johansen Maximum-Eigenvalue test for cointegration (Engle and Granger, 1987; Johansen, 1988) was performed for the entire 2004-2013 period and each individual sunflower growing season where the ADF test and the KPSS test provided strong evidence that the particular price series were integrated. (Individual variables are cointegrated when a long-run equilibrium relationship represented by some linear combination of them exists.) Recent applications of the Johansen test for assessing the possible linkages between energy and agricultural commodity markets include Natanelov et al. (2013) for crude oil, ethanol and maize, Pala (2013) for crude oil and the FAO food price index, and Harri et al. (2009) for crude oil, agricultural commodities and exchange rates. All these studies provide evidence for the existence of a long-run equilibrium relationship between crude oil prices and some of the agricultural commodity prices. In general, the standard cointegration test is often performed for fragments of longer time periods where breaks are usually adjusted to the occurrence of certain macroeconomic phenomena (see e.g. Natanelov et al., 2013; Pala, 2013). However, we are not aware of any attempt to use this method while splitting the time series according to the production seasons of the agricultural commodity involved in the analysis. The standard cointegration test was considered appropriate to test the equilibrium relationship since it provides more
Data Relevant seed production and crushing data for the period 2004-2013 are presented in Figure 1. During this period, the average sunflower seed production per year of Hungary was 1.24 million tonnes, which represented an 18.3 per cent share of the total EU output. The 2010 season saw the lowest level of production in Hungary since EU accession with 970 thousand tonnes, representing 80.1 per cent of the average for the preceding five years, i.e. 2004-2009. Total crushing of rapeseed and sunflower seed in the EU increased from 18.6 million tonnes in the 2002/04 crop year (October-September) to a peak of 26.9 million tonnes in the 2009/10 crop year, thereafter remaining fairly constant. For the analysis, the daily closing price series of November sunflower seed futures listed at the Budapest Stock Exchange (BÉT) Grain Section, of November Brent crude oil futures listed at the Intercontinental Exchange (ICE), and of November rapeseed futures listed at the Paris Bourse (MATIF) were used from the first exchange trading day in April until the expiry of the November Brent crude oil futures around the middle of October for the period 2004-20132. In Hungary, sunflower is sown in April, and this is when expectations regarding the new crop begin to be formed. The choice of 2004 as the first year of the time period for the analysis is justified by the fact that Hungary adopted the EU mechanisms of agricultural market regulation fully upon its accession to the EU on 1 May 2004.
2
127
Potori Norbert and Stark András
log(USD price)
3
2
1 01/04/2004
16/10/2013
ICE Brent crude oil
BÉT sunflower seed
MATIF rapeseed
Figure 2: The daily log-price series of BÉT sunflower futures for November delivery, ICE Brent crude oil futures for November delivery and MATIF rapeseed futures for November delivery converted to USD per tonne or barrel equivalents in the sunflower growing seasons (April-October) during the period 2004-2013. Note: weekends are excluded from the x axis Source: own calculations
The sunflower harvest ends around the middle of October, thus the price series used cover sunflower growing seasons adequately. In respect of sunflower seed futures (and rapeseed futures too), by using only one contract, in this case the November contract price series instead of the continuous front month price series, the data are clean of the usual seasonal drop in prices when old crop futures switch (often asynchronously between the different markets) to new crop futures (normal backwardation). Furthermore, the November contract price series of sunflower seed represent the anticipated harvest time price of the new crop only little distorted by the cost of carry. Missing data for exchange trading holidays not longer than one day were linearly interpolated, and weekends were excluded from the series. Thus the number of days for the individual growing seasons (n1-n10) analysed varied from 140 to 143, and totalled 1,412 (N) for the period 2004-2013. All prices were converted to their USD per tonne or barrel equivalents using the official daily exchange rates published
by the European Central Bank and then, to avoid problems of scale, further converted to their natural logarithms (Figure 2).
Results The ADF test and the KPSS test verified that the price series used were I(1) or I(2) for the entire 2004-2013 period and most of the individual sunflower growing seasons (Tables 1 and 2). Following the ADF test results, no cointegration tests were performed for the ICE and BÉT pairs of price series in 2006 and in 2013, and also for the MATIF and BÉT pairs of price series in 2006. The results of the Johansen test (Table 3) suggest the existence of a long-run equilibrium relationship between ICE Brent crude oil futures for November delivery and BÉT sunflower seed futures for November delivery during the sunflower growing seasons of the period 2004-2013 at the 5 per cent significance level. This finding supports the hypoth-
Table 1: Values of the ADF and KPSS statistics for the daily log-price series of BÉT sunflower futures for November delivery, ICE Brent crude oil futures for November delivery, and MATIF rapeseed futures for November delivery converted to USD per tonne or barrel equivalents for the entire 2004-2013 period, and each individual sunflower growing season (April-October). Time period Apr 2004 to Oct 2013 (N = 1,412) Apr 2004 to Oct 2004 (n1 = 140) Apr 2005 to Oct 2005 (n2 = 141) Apr 2006 to Oct 2006 (n3 = 140) Apr 2007 to Oct 2007 (n4 = 142) Apr 2008 to Oct 2008 (n5 = 143) Apr 2009 to Oct 2009 (n6 = 142) Apr 2010 to Oct 2010 (n7 = 140) Apr 2011 to Oct 2011 (n8 = 140) Apr 2012 to Oct 2012 (n9 = 141) Apr 2013 to Oct 2013 (n10 = 143)
BÉT ADF -1.34 -1.55 -0.56 -4.07* -1.82 -1.04 -2.08 -1.74 -1.83 -1.06 -0.88
ICE KPSS 0.53 0.19 0.53 0.13** 0.42 0.71 0.47 0.46 0.40 0.25 0.35
ADF -2.07 -1.88 -1.80 -1.50 -1.66 0.10 -1,96 -1.94 -3.23 -1.59 -4.12*
MATIF KPSS 2.41 0.25 0.27 0.56 0.16 0.70 0.38 0.42 0.07** 0.60 0.23
ADF -1.39 -2.63 -2.62 -2.23 -2.53 -0.73 -2.71 -1.88 -2.77 -2.09 -1.27
KPSS 1.09 0.08** 0.49 0.40 0.45 0.67 0.35 0.34 0.27 0.32 0.30
For testing the null hypothesis, the ‘constant with linear trend’ statistics of the ADF and KPSS tests were used. The optimal lag parameters were calculated by R based on the Akaike information criterion ADF critical values: -3.96 (1%); -3.41 (5%); -3.12 (10%) KPSS critical values: 0.22 (1%); 0.15 (5%); 0.12 (10%) * Indicates rejection of the null hypotheses at 5 per cent significance level (ADF null hypothesis: the time series have unit root) ** Indicates acceptance of the null hypotheses at 5 per cent significance level (KPSS null hypothesis: the time series are stationary) Source: own calculations
128
Crude oil price influence on sunflower seed futures price discovery Table 2: Values of the ADF and KPSS statistics for the differentiated daily log-price series of BÉT sunflower futures for November delivery, ICE Brent crude oil futures for November delivery and MATIF rapeseed futures for November delivery converted to USD per tonne or barrel equivalents for the entire 2004-2013 period, and each individual sunflower growing season (April-October). Time period Apr 2004 to Oct 2013 (N = 1,412) Apr 2004 to Oct 2004 (n1 = 140) Apr 2005 to Oct 2005 (n2 = 141) Apr 2006 to Oct 2006 (n3 = 140) Apr 2007 to Oct 2007 (n4 = 142) Apr 2008 to Oct 2008 (n5 = 143) Apr 2009 to Oct 2009 (n6 = 142) Apr 2010 to Oct 2010 (n7 = 140) Apr 2011 to Oct 2011 (n8 = 140) Apr 2012 to Oct 2012 (n9 = 141) Apr 2013 to Oct 2013 (n10 = 143)
BÉT ADF -25.13* -7.34* -4.89* -5.39* -7.14* -6.73* -3.67* -11.67* -3.54* -7.24* -9.25*
ICE KPSS 0.11 0.23 0.64** 0.23 0.08 0.76** 0.27 0.15 0.10 0.45 0.30
ADF -25.89* -7.73* -8.22* -6.12* -6.32* -5.83* -6.69* -4.02* -10.28* -7.61* -7.89*
MATIF KPSS 0.15 0.29 0.04 0.28 0.19 1.27** 0.16 0.27 0.19 0.19 0.31
ADF -26.98* -5.82* -8.51* -7.99* -3.60* -6.06* -8.93* -4.17* -9.18* -8.14* -9.20*
KPSS 0.25 0.08 0.11 0.29 0.25 0.92** 0.09 0.38 0.22 0.24 0.28
For testing the null hypothesis, the ‘without trend and drift’ statistics of the ADF and KPSS tests were used. The optimal lag parameters were calculated by R based on the Akaike information criterion ADF critical values: -2.58 (1%); -1.95 (5%); -1.62 (10%) KPSS critical values: 0.74 (1%); 0.46 (5%); 0.35 (10%) * Indicates rejection of the null hypotheses at 5 per cent significance level (ADF null hypothesis: the time series have unit root) ** Indicates rejection of the null hypotheses at 5 per cent significance level (KPSS null hypothesis: the time series are stationary) Source: own calculations
Table 3: Statistics of the Johansen Maximum-Eigenvalue test for cointegration of the daily log-price series of BÉT sunflower futures for November delivery versus ICE Brent crude oil futures for November delivery and MATIF rapeseed futures for November delivery converted to USD per tonne or barrel equivalents for the entire 2004-2013 period, and each individual sunflower growing season (April-October). Time period Apr 2004 to Oct 2013 (N = 1,412) Apr 2004 to Oct 2004 (n1 = 140) Apr 2005 to Oct 2005 (n2 = 141) Apr 2006 to Oct 2006 Apr 2007 to Oct 2007 (n4 = 142) Apr 2008 to Oct 2008 (n5 = 143) Apr 2009 to Oct 2009 (n6 = 142) Apr 2010 to Oct 2010 (n7 = 140) Apr 2011 to Oct 2011 (n8 = 140) Apr 2012 to Oct 2012 (n9 = 141) Apr 2013 to Oct 2013 (n10 = 143)
ICE 18.56 12.80 4.53 20.02 14.35 14.08 13.87 13.23 11.43 -
MATIF 10.45 7.65 11.30 19.87 10.69 12.07 17.02 12.48 17.32 19.35
Critical values: 20.20 (1%); 15.67 (5%); 13.75 (10%) Source: own calculations
esis that crude oil prices influence new crop sunflower seed futures price discovery in Hungary. However, as opposed to this global characteristic of these two price series, Brent crude oil and sunflower seed futures were estimated as being cointegrated only in the 2007 sunflower growing season, also at the 5 per cent significance level. This implies that crude oil prices influence new crop sunflower seed futures price discovery only occasionally, under special circumstances. In contrast to the above, the same test revealed the lack of a long-run equilibrium relationship between MATIF rapeseed futures for November delivery and BÉT sunflower seed futures for November delivery during the sunflower growing seasons of the period 2004-2013 (Table 3). Again, as opposed to this global characteristic of these two price series, rapeseed and sunflower seed futures were estimated being cointegrated in the 2007, 2010, 2012 and 2013 sunflower growing seasons, in all cases at the 5 per cent significance level. Consequently, it would be inappropriate to conclude that no cointegration relationship exists between these
markets when MATIF rapeseed futures (with more liquidity than BÉT sunflower seed futures) could have served well for cross hedging price risks associated with sunflower seed production, processing and trade in Hungary in almost half of the growing seasons for which the cointegration test was performed.
Discussion From the aspect of sunflower seed market fundamentals, the seasonal cointegration between ICE Brent crude oil futures for November delivery and BÉT sunflower seed futures for November delivery in 2007 coincided with a record low in sunflower seed production in the EU-27 of 4.97 million tonnes (Figure 1). This represented a 22.6 per cent drop compared to 2006, and it fell short of the 2004-2006 average by 19.1 per cent. Whether this exceptional decline in supply impacted on this particular price relationship indeed needs further exploration. In respect of the seasonal cointegration between MATIF rapeseed futures for November delivery and BÉT sunflower seed futures for November delivery, we note that sunflower seed production in the EU-27 decreased compared to the previous year not only in 2007 (by 1.44 million tonnes or 22.5 per cent) but also in 2010 and 2012 (by 0.22 million tonnes or 3.2 per cent, and 1.21 million tonnes or 14.9 per cent respectively). Another common feature of these sunflower growing seasons was that total crushing of rapeseed and sunflower seed increased in the crop years (October-September) which included these particular growing seasons (Figure 1). A logical argument would be that an anticipated decline in sunflower seed supply paralleled by a growth in the combined current domestic demand of the two principal oilseeds produced in the EU apparently strengthens the seasonal connection between sunflower seed and rapeseed markets. Interestingly, 2005 is out of line here. Although sunflower seed production declined by 0.58 million tonnes or 9.2 per cent in the EU-27 (taking into account Bulgaria and Romania which 129
Potori Norbert and Stark András
accessed the EU in 2007, too) compared to 2004, and the combined current domestic demand of rapeseed and sunflower seed increased during the 2004/05 crop year, MATIF rapeseed futures and BÉT sunflower seed futures were not cointegrated. This finding, however, could be explained by the 0.68 million tonnes decrease in sunflower seed crushing in 2004/05. Finally, 2013 was quite different from 2007, 2010 and 2012: all-time record quantities of sunflower seed were harvested in the EU-27 (8.90 million tonnes, representing a 28.4 per cent increase compared to 2012, and exceeding the 20042012 average by 35.8 per cent), in Ukraine (10.94 million tonnes, or +30.5 per cent over the previous year) and in Russia (10.20 million tonnes, or +27.8 per cent over the previous year). These outputs contributed to the global production of sunflower seed surging to an unprecedented 43.25 million tonnes in the 2013/14 crop year (estimates by ISTA Mielke, 2015). During the sunflower growing season, the global oilseed and grain market was also anticipating new highs in the production of rapeseed and soybeans, as well as of wheat and maize for the 2013/14 crop year3. The general downward movement of prices may have caused the seasonal cointegration of rapeseed futures and sunflower seed futures again. The contrasting estimations for the global and seasonal characteristics of the variables indicate the weakness of the applied standard cointegration test when performed for the multiannual price series of an agricultural commodity with strong seasonality in production, namely it will not capture the periodical shocks in supply and demand. This can lead to misinterpretations of the test results: the existence of a longrun equilibrium relationship may be accepted with most of the individual growing seasons actually lacking the equilibrium, and vice versa. The Johansen test for cointegration assumes that the cointegrating vector is constant during the time period analysed. However, in reality, when prices of agricultural commodities with strong seasonality in production are cointegrated with prices of other commodities in certain growing seasons, the cointegrating vector representing the equilibrium relationship may be different in each of these time periods due to the substantial changes in the market fundamentals. This aspect may deserve further research because of the expected increase in the volatility of crop production and prices caused by increasing climate variability in the future. Although our results indicate the weakness of the applied standard cointegration test, they still have some policy implication. Namely, that policies based on the assumption of the long-run presence of a certain degree of linkage between energy markets and the market of food products which substitute for other food products used as energy feedstock, and between food products used as energy feedstock and their substitutes for food exhibiting strong seasonality in production, would require to be flexible in order to be effective. The periodical shocks in the supply and demand of these agricultural commodities deserve consideration as they may substantially influence the strength of market interlinkages from one production season to the next. 3 ISTA Mielke (2015) estimated the global production of rapeseed in 2013/14 to be 69.62 million tonnes (+8.7 per cent compared to the previous crop year) and that of soybeans to be 281.92 million tonnes (+5.9 per cent). USDA (2015) estimated the global production of wheat to be 716.82 million tonnes (+8.8 per cent) and that of maize to be 988.70 million tonnes (+13.9 per cent).
130
References Dickey, D.A. and Fuller, W.A. (1979): Distribution of the Estimators for Autoregressive Time Series with a Unit Root. Journal of the American Statistical Association 74, 427-431. Engle, R.F. and Granger, C.W.J. (1987): Cointegration and error correction: Representation, estimation, and testing. Econometrica 55, 251-276. http://dx.doi.org/10.2307/1913236 FAO (2008): Soaring food prices: facts, perspectives, impacts and actions required. Document HLC/08/INF/1, accompanying the High-Level Conference on World Food Security: The Challenges of Climate Change and Bioenergy, Roma, Italy, 3-5 June 2008. Flach, B. Bendz, K. and Lieberz, S. (2014): EU Biofuels Annual 2014. GAIN Report NL4025. Washington DC: USDA Foreign Agricultural Service. F.O. Licht (2015): World Ethanol & Biofuels Report, 14 April 2015. Ratzeburg, Germany: F.O. Licht. Harri, A., Nalley, L. and Hudson, D. (2009): The relationship between oil, exchange rates, and commodity prices. Journal of Agricultural and Applied Economics 41, 501-510. http://dx.doi. org/10.1017/S1074070800002959 Hassouneh, I., Serra, T., Goodwin, B.K. and Gil, J.M. (2011): Non-parametric and parametric modeling of biodiesel, sunflower oil, and crude oil price relationships. Paper presented at the 2011 European Association of Agricultural Economists (EAAE) Congress, Zurich, Switzerland, 30 August – 2 September 2011. ISTA Mielke (2015): Oil World Annual 2015, volume 1 – up to 2014/15. Hamburg: ISTA Mielke. Johansen, S. (1988): Statistical analysis of cointegration vectors. Journal of Economic Dynamics and Control 12, 231-254. http://dx.doi.org/10.1016/0165-1889(88)90041-3 Kwiatkowski, D., Phillips, P.C.B., Schmidt, P. and Shin, Y. (1992): Testing the null hypothesis of stationarity against the alternative of a unit root. Journal of Econometrics 54, 159-178. http:// dx.doi.org/10.1016/0304-4076(92)90104-Y Lewandowski, I. (2013): Soil carbon and biofuels: multifunctionality of ecosystem services, in R. Lal, K. Lorenz, R.H. Hüttl, B.U. Schneider and J. von Braun (eds), Ecosystem Services and Carbon Sequestration in the Biosphere. Dordrecht: Springer Netherlands, 333-356. http://dx.doi.org/10.1007/978-94-0076455-2_14 Natanelov, V., McKenzie, A.M. and van Huylenbroeck, G. (2013): Crude oil-corn-ethanol – nexus: a contextual approach. Energy Policy 63, 504-513. http://dx.doi.org/10.1016/j.enpol.2013.08.026 Nazlioglu, S. and Soytas, U. (2011): World oil prices and agricultural commodity prices: evidence from an emerging market. Energy Economics 33, 488-496. http://dx.doi.org/10.1016/j. eneco.2010.11.012 Pala, A. (2013): Structural breaks, cointegration, and causality by VECM analysis of crude oil and food price. International Journal of Energy Economics and Policy 3, 238-246. UNCTAD (2014): The global biofuels market: Energy security, trade and development. Policy Brief No. 30, October 2014. USDA (2015): World Agricultural Supply and Demand Estimates WASDE-541. Washington DC: USDA. Yu, T.H., Bessler, D. and Fuller, S. (2006): Cointegration and causality analysis of world vegetable oil and crude oil prices. Paper presented at the American Agricultural Economics Association Annual Meeting, Long Beach, California, 23-26 July 2006.