Tropical Ecology 50(2): 295-304, 2009 © International Society for Tropical Ecology www.tropecol.com
ISSN 0564-3295
Distribution pattern of aboveground biomass in natural and plantation forests of humid tropics in northeast India 1
1*
RATUL BAISHYA , SAROJ KANTA BARIK 1
& KRISHNA UPADHAYA
2
Centre for Advanced Studies in Botany, School of Life Sciences, North-Eastern Hill University, Shillong 793022, Meghalaya, India 2 Department of Basic Sciences and Social Sciences, School of Technology, North-Eastern Hill University, Shillong 793022, Meghalaya, India Abstract: Tree aboveground biomass (AGB) distribution and carbon storage in different DBH (diameter at breast height) classes were compared between natural semi-evergreen forest and sal plantation forest in the humid tropical region of northeast India. The natural forest had lower AGB (323.9 Mg ha-1) than the plantation forest (406.4 Mg ha-1). About 49% of the AGB was present in > 60 cm dbh trees in the natural forest against 24% in the plantation forest. The carbon storage was highest in 60-80 cm and 40-60 cm dbh classes in the natural forest and plantation forest, respectively. The differential AGB and carbon distribution pattern has been related to past disturbance history and age of the forests. Although both the forests had potential for carbon sequestration due to presence of large number of trees belonging to small dbh classes, the plantation forest had an edge over the natural forest because of better silvicultural practices. Resumen: La distribución de la biomasa arbórea aérea (BAA) y los almacenes de carbono en diferentes categorías de DAP (diámetro a la altura del pecho) fueron comparados entre un bosque natural subperennifolio y una plantación de sal en la región tropical húmeda del nordeste de la India. El bosque natural tuvo una BAA menor (323.9 Mg ha-1) que la plantación (406.4 Mg ha-1). Alrededor de 49% de la BAA se concentró en árboles con DAP > 60 cm en el bosque natural, contra 24% en la plantación. Los almacenes de carbono fueron más grandes en las categorías diamétricas de 60-80 cm y de 40-60 en el bosque natural y la plantación, respectivamente. El patrón diferencial en la distribución de BAA y de carbono estuvo relacionado con la historia de disturbio y la edad de los bosques. Si bien ambos bosques tienen el potencial de secuestrar carbono debido a la presencia de un gran número de árboles en las categorías diamétricas pequeñas, la plantación está en ventaja sobre el bosque natural debido a la aplicación de mejores prácticas silvícolas. Resumo: A distribuição da biomassa arbórea aérea (AGB) e fixação de carbono para diferentes classes de DAP (diâmetro à altura do peito) foram comparadas entre a floresta natural semi-sempreverde e plantações florestais de “meranti” na região tropical húmida do nordeste da Índia. A floresta natural apresenta mais baixo AGB (323,9 Mg ha-1) do que a floresta plantada (406, 4 Mg ha-1). Cerca de 49% do AGB encontrava-se em árvores com DAP > 60 cm na floresta natural contra 24% na floresta plantada. A fixação de carbono era a mais alta nas árvores das classes de DAP de 60-80 cm e 40-60 cm na floresta natural e plantada, respectivamente. O padrão diferencial de distribuição do AGB e carbono foi relacionado com a história de perturbação e a idade das florestas. Embora ambas as florestas tenham o potencial para o sequestro de carbono devido à presença de um grande número de árvores pertencente às pequenas classes de DAP, a floresta plantada tem uma vantagem sobre a natural por causa das melhores práticas silvícolas.
*
Corresponding Author; e-mail:
[email protected]
296
ABOVEGROUND BIOMASS IN HUMID TROPICAL FORESTS
Key words: Aboveground biomass, carbon storage, northeast India, sal plantation forest, silvicultural practices, tropical semi-evergreen forest.
Introduction The tropical forests spread over 13.76 million sq. km area worldwide account for 60% of the global forests (FAO 1988, 2005) and play a key role in global C cycle both in terms of C flux and the volume of C stored. The significant influence of tropical forests on carbon cycle is attributed to the high rate of primary production besides the large pool and flux sizes (Brown & Lugo 1982, 1984). Because of higher net productivity, the tropical forests are more effective in carbon sequestration than any other forests (Brown et al. 1989; Soni 2003). The tropical forests store large quantities of carbon in vegetation and soil, exchange carbon with the atmosphere through photosynthesis and respiration. These forests account for 37% of the total 90% of the world’s terrestrial C that is stored in forests (Houghton 1996). Very few tropical forests are at their maximum potential level of biomass density because of prevailing or past cultural disturbances, and therefore, have a larger additional carbon sequestration capacity and have the potential to increase the global carbon store beyond the present value (Iverson et al. 1993). Consequently tropical forests have attracted a great deal of experimental and theoretical attention in recent years (Malhi et al. 1999; Malhi & Grace 2000). The Amazonian tropical forests have the highest carbon sequestration as well as release among all the ecosystems, because of large area and high productivity associated with large scale deforestation, burning, and fast rate of decomposition and landuse changes (Fearnside 1997). The tropical forests act as sources of atmospheric carbon if disturbed by anthropogenic activities or natural calamities. However, they become atmospheric carbon sinks during land abandonment, forest regrowth after disturbance and due to afforestation, reforestation and forest conservation. Therefore, the role of tropical forests as overall CO2 sink or source is scale-dependent and site-specific. The need for generating data at high spatial resolution for both above- and belowground phytomass, soil and other pools and
fluxes of C has been emphasized by several workers for improving quantification of global C pools and fluxes (Chhabra & Dadhwal 2004). As a mitigation measure to global climate change due to greenhouse gas emission, it is required to cut the rate of emission either through reducing tropical deforestation or to enhance the natural carbon sequestration potential of degraded forests through forest regeneration and afforestation. The degraded areas have a large potential to sequester carbon in the soil; storage in vegetation is preferable due to their longer residence time and less risk of rapid release to the atmosphere (Lal 2001). This can only be achieved through afforestation or reforestation of such areas. The protection of existing forests, regeneration of degraded forests and raising of forest plantations in India have been contributing to enhanced carbon stock (Ravindranath et al. 2008). The major C pools such as phytomass, soil, litter, and fluxes of C due to litterfall and landuse changes have been estimated for India based on very coarse resolution data and extrapolation, as the primary data for many regions of the country are either non-existent or over-estimated (Dadhwal & Nayak 1993). The data available on carbon sequestration i.e. net woody biomass accumulation in trees for long term storage in tropical forests are extremely limited and incomplete. Because of the lack of reliable data on standing biomass and rates of forest degradation, the net annual carbon emission estimates for India have also been highly variable (Ravindranath et al. 1997). Thus, the improved quantification of C pools and fluxes in tropical forest ecosystems is important for understanding the contribution of these forests to net C emissions and their potential for carbon sequestration (Chhabra & Dadhwal 2004). The potential of tropical forests for increased carbon sequestration capability can be assessed either through the amount of carbon stored or estimating the annual carbon sequestration rate (Iverson et al. 1993). The studies on carbon sequestration have been focusing on and
296
ABOVEGROUND BIOMASS IN HUMID TROPICAL FORESTS BAISHYA, BARIK & UPADHAYA
expressing the sequestration in terms of biomass and carbon stock. The design and evaluation of global scale carbon models require field estimates of forest biomass. Among the phytomass components i.e. aboveground, belowground and dead wood, the live aboveground wood biomass is the most important because it is involved in the regulation of atmospheric carbon concentration and constitutes about 60% of total phytomass. Therefore, estimation of aboveground biomass (AGB) is the most important aspect of studies of carbon sequestration (Ketterings et al. 2001). Estimation of AGB is also a useful measure for comparing structural and functional attributes of forest ecosystems across a wide range of environmental conditions (Brown et al. 1999). The most reliable technique for estimating forest carbon stock is through forest inventories followed by developing allometric relationships between the aboveground biomass (AGB) of a tree and its trunk diameter (Brown 1997; Brown et al. 1989; Clark et al. 2001). The potential changes in the other carbon pools of the ecosystem such as litter, coarse woody debris, root biomass and soil organic matter are subsequently added to the estimations to obtain the size of the total tree carbon pool. Because AGB represents a large fraction of total forest carbon stock, its estimation offers a practical and reliable way of evaluating the carbon balance of tropical forest. Several studies have concluded that matured tropical forests with high AGB, contain a large proportion of their aboveground biomass in large trees (Brown et al. 1995; Brown & Lugo 1992; Clark & Clark 1996). In contrast, several other workers have argued that old growth forests have less potential for carbon sequestration as the constituent older trees cease to grow (Terakunpisut et al. 2007). Similarly, in absence of precise data, it is believed that the potential for carbon sequestration of natural forests is manifold greater than the plantation forests. Since most tropical forests are now affected by one or the other form of human interventions, the densitydiameter distribution of trees would be an important determinant of the carbon stock in these forests. It is not clear whether (i) carbon sequestration potential is greater in natural forests than the plantation forests, and (ii) young trees have greater carbon sequestration potential than the old trees in a natural forest.
297
The north-eastern region of India with 99,260 km2 of tropical forests (Roy & Joshi 2002) that spread up to an elevation of 900 m asl in the Eastern Himalayas and sub-Himalayan areas offers appropriate situation for examining the above two questions. The forests of the region include undisturbed evergreen and semi evergreen forests, secondary forests developed following shifting cultivation and forest degradation, and plantation forests raised by various agencies. Baring a few pockets of undisturbed forests, most tropical forests of the region were affected by one or the other form of cultural disturbances. Therefore, the present work aims to quantify carbon sequestration through estimation of aboveground carbon storage and AGB distribution pattern in different diameter classes in a natural and a plantation forest. The study would not only provide the distribution pattern of carbon in different tree size classes but would also fill the AGB data gap for the tropical forests of northeast India.
Materials and methods Site description The study was conducted in two forests viz., tropical semi-evergreen forest and sal (Shorea robusta) plantation forest. These two forest types were selected due to the fact that tropical semievergreen forests constitute the majority of natural tropical forests of northeast India and sal plantation forests dominate the planted forest in the region. The two forests are part of humid tropical forest of Nongkhyllem wildlife sanctuary in Meghalaya, northeast India. The experimental plots lie between 25º55.578’ - 25°56.062' N latitude and 091º46.453’ - 91º46.546'E longitude. The area was declared as a wildlife sanctuary in 1981 prior to which it was part of the reserve forest. It covers 29 km2 area on a steep hill slope (20º to > 65º) with an elevation ranging from 208 to 295 m and is 79 km from Shillong, the state capital of Meghalaya. The sal plantation was created during the year 1972 and is well-protected. On the other hand, the natural forest is an old growth forest, where the past disturbance in the form of selective logging took place at least 80 years ago prior to its declaration as a wildlife sanctuary. The forest is currently undisturbed and is characterized by
298
BAISHYA, BARIK UPADHAYA ABOVEGROUND BIOMASS IN & HUMID TROPICAL FORESTS
dense canopy. Such forests constitute about 21% of the total sanctuary area.
Climate The climate of the area is monsoonic with distinct warm-wet (May-October) and cold-dry (December-February) periods. The rainy season starts from May and extends up to October. About 90% of the total annual rainfall occurs during this period. The meteorological data were collected from the meteorological station of District Horticulture office, Government of Meghalaya located at Nongpoh, about 10 km from the study site. The total annual rainfall was 1355 mm during the year 2006-2007. The mean maximum temperature of 35ºC was recorded in August and mean minimum temperature of 14ºC was recorded in January.
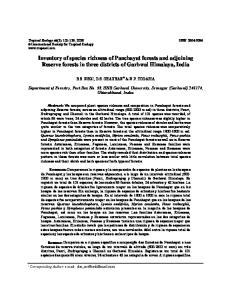
Forest inventory The different types of forests were mapped using IRS LISS III imageries through supervised classification and a forest type map within the wildlife sanctuary was prepared (Fig.1a). Sampling of vegetation in the two forests was carried out by belt transect method. Since the natural and plantation forests were continuous and each forest type was represented by a clearly demarcable single patch, an area of 10 ha was demarcated in each forest and was divided into four quarters of 250 m x 100 m each. In each quarter, a transect of 250 m x 20 m was laid laterally (Fig.1b) (Adapted from Alves et al. 1997). Thus four transects with a total 2 ha area were laid in each forest that was considered adequate for sampling, given the structure and size of each forest type. The transects were further divided into 10 x 10 m plots. In each plot, all individuals > 5 cm dbh (diameter at breast height) were tagged, measured and identified. The girth and height of each individual were measured. The plant specimens were identified with the help of regional floras (Balakrishnan 1981-83; Haridasan & Rao 1985-87; Joseph 1982; Kanjilal et al. 1934-40). The herbarium at Botanical Survey of India, NorthEastern Circle, Shillong and North-Eastern Hill University, Shillong, were consulted for confirmation. Frequency, density, basal area and importance value index (IVI) were calculated following Misra (1968) and Muller-Dombois & Ellenberg (1974). Trees were grouped into six dbh
297
classes i.e. >5-20 cm, 20-40 cm, 40-60 cm, 60-80 cm, 80-100 cm and > 100 cm, and the density and AGB distribution under each dbh class were analyzed. 91º46 0 E
91º48 0 E
91º50 0 E
(a)
25º54 0 N
25º54 0 N
25º52 0 N
25º52 0 N
25º50 0 N
25º50 0 N
91º46 0 E
91º48 0 E
91º48 0 E
(b)
Fig. 1. (a) Map showing different forest types in Nongkhyllem wildlife sanctuary, Meghalaya, northeast India prepared based on IRS LISS III 2006 imagery and (b) diagrammatic presentation of the sampling procedure.
Biomass regression equations Because of high species richness in tropical forests, it is difficult to use species-specific regression models, as used in the temperate zone (Brown & Schroeder 1999; Shepashenko et al. 1998; Ter-Mikaelian & Korzukhin 1997). Therefore, mixed species tree biomass regression models were used for AGB estimation of natural and plantation forests. The regression models for tree biomass used in the studies of Brown (1997), Brown et al. (1989), Chambers et al. (2001), Chave et al. (2001) and Brown & Iverson (1992) were evaluated based on prediction errors, residual analysis, and logical behavior of the models, R2, and simplicity of the models (Table 1). Diameter at breast height i.e. at 1.37 m above the ground level, and individual tree height were measured during
298
ABOVEGROUND BIOMASS IN HUMID TROPICAL FORESTS BAISHYA, BARIK & UPADHAYA
the study using diameter tape and clinometer. These two parameters were used as inputs to the ten models and the best-fit model was selected. The model Y= exp [-0.37 + 0.33 ln(D) + 0.933 ln(D)2 0.122 ln(D)3] developed by Chambers et al. (2001) was used to estimate the aboveground biomass in the two forests. The best R2 values of 0.93 and 0.91 were obtained for the natural forest and plantation forest, respectively.
299
greater in the 40-60 cm diameter class in plantation forest and in 60-80 cm dbh class in natural forest (Fig. 3). The AGB contribution by subsequent higher diameter classes got reduced in both the forests. The contribution of trees having >60 cm diameter to AGB was greater in natural forest (6.6%) than the plantation forest (5.6%).
Estimation of AGB The AGB in different tree diameter classes in each forest was estimated using the above mentioned model, where the variable biomass was AGB. The aboveground biomass for all diameter classes was summed to arrive at the total aboveground biomass in each of the two forests. The values for the natural and the plantation forests were compared using t test.
Estimation of carbon
Fig. 2. Tree density in different diameter classes in natural and plantation forests of northeast India.
The aboveground biomass carbon stock was calculated by assuming that the carbon content is 50% of the total aboveground biomass (Brown & Lugo 1982; Cannel et al. 1995; Dixon 1994; Ravindranath et al. 1997; Richter et al. 1995; Schroeder 1992).
Results Stand characteristics Ninety four species were recorded from the natural forest, and 67 species were recorded from the plantation forest. The density of woody species (>5cm dbh) was greater in plantation forest (1028 trees ha-1) than the natural forest (996 trees ha-1). Based on density, Antidesma acuminatum (120 trees ha-1) and Polyalthia jenkinsii (108 trees ha-1) were the dominant species in the natural forest and these two species accounted for 21% of the total stand density. In plantation forest, Shorea robusta (386 trees ha-1) and Litsea monopetala (102 trees ha-1) were the dominant and codominant species, respectively. The basal area was greater in the plantation forest (89.92 m2ha-1) than the natural forest (73.41 m2ha-1) (Table 2).
Fig. 3. Aboveground biomass in different tree diameter classes in natural and plantation forests of northeast India.
Aboveground biomass distribution Although the young individuals belonging to 520 cm dbh class dominated both forests in terms of density (Fig. 2), the AGB accumulation was
Fig. 4. Carbon storage in different tree diameter classes in natural and plantation forests of northeast India.
BAISHYA, BARIK & UPADHAYA ABOVEGROUND BIOMASS IN HUMID TROPICAL FORESTS
300
295
Table 1. Regression models run to obtain best fit for estimation of biomass in natural and plantation forests of northeast India. Model
Regression equation
FAO. 3.2.3. (1997) FAO. 3.2.4. (1997) FAO. 3.2.5. (1997) Brown et al. (1989) Brown et al. (1989) Chave et al. (2001) Chambers et al. (2001) Brown & Iverson (1992) Brown et al. (1989)
Y= 42.69-12.800(D) + 1.242(D2) Y= exp {-2.134+2.530*ln (D)} Y= 21.297- 6.953 (D) + 0.740(D2) Y= exp [-3.114+0.972*ln (D2H)] Y= exp [-2.409+0.952*ln (D2HS)] Y= exp (-2.00+2.42) ln (D) Y= exp [-0.37+0.33 ln (D) + 0.933 ln(D)2 0.122 ln(D)3] Y= 1.276+0.034 (D2*H) Y= 38.4908-11.7883 (D) + 1.1926 D2
Table 2. Stand characteristics of plantation forests of northeast India.
natural
and
Forest types Natural Plantation
Variables
Species richness (No. of species) 94 Stand density (trees ha-1) 996 Density of dominant tree species (trees ha-1) Antidesma acuminatum Wall. ex Wt. 120 Dysoxylum gobara (Buch.-Ham.) Merr. 36 Elaeocarpus tectorius (Lour.) Poir. 58 Leea alata Edgew. 90 Litsea monopetala (Roxb.) Pers. Mesua ferrea Linn. 60 Polyalthia jenkinsii Benth. & Hk. f. 108 Schima wallichii (DC.) Korth. 38 Shorea robusta Gaertn. 73.4 Basal area (m2 ha-1)
67 1028
34 44 102 24 40 46 386 89.9
Total aboveground biomass and carbon stock The total AGB was significantly greater (p 70 cm dbh). On the other hand, Brown et al. (1997) reported that smaller trees contribute to most AGB in forests with < 300 Mg ha-1 aboveground biomass. Analyses have shown that forests with reduced biomass either had their large trees removed by past human disturbance or represent regenerating secondary forests which do not yet have large trees. The distribution of biomass in large trees, therefore, could be an indicator of the presence or absence of past anthropogenic disturbance (Brown 1996). A higher proportion of AGB in the higher diameter classes in natural forest does indicate the important role of large trees in carbon storage, but does not undermine the role of small trees (