Distribution and clinal trends of the ABO and Rh genes in select Middle Eastern countries E.S. AlSuhaibani1, N.A. Kizilbash2, K. Afshan3 and S. Malik3 Department of Zoology, College of Science, King Saud University, Riyadh, Saudi Arabia 2 Department of Biochemistry, Faculty of Medicine and Applied Medical Sciences, Northern Border University, Arar, Saudi Arabia 3 Human Genetics Program, Department of Animal Sciences, Faculty of Biological Sciences, Quaid-i-Azam University, Islamabad, Pakistan 1
Corresponding authors: S. Malik / N.A. Kizilbash E-mail:
[email protected] /
[email protected] Genet. Mol. Res. 14 (3): 10729-10742 (2015) Received December 12, 2014 Accepted June 27, 2015 Published September 9, 2015 DOI http://dx.doi.org/10.4238/2015.September.9.12
ABSTRACT. An understanding of the ABO and Rh blood group systems is important for blood transfusions and is also pertinent due to their potential association with certain morbidities and susceptibilities to infections. To investigate the diversity and differentiation of the ABO and Rh loci in Middle Eastern populations, data from twelve representative Middle Eastern populations were analyzed. Six populations were in conformity with Hardy-Weinberg equilibrium at the ABO locus. The pooled heterozygosity at both loci was calculated to be highest in the sample from Jordan and lowest in Bahrain. Heterogeneity was pronounced in the Northern compared to the Southern Middle Eastern populations. Overall, the absolute gene diversity was 0.0046 and gene differentiation was calculated to be 0.0100. Genetic diversity of the studied loci across all populations (HT) was estimated to be 0.4594, while the diversity within the populations (HS) was 0.4548. Nei’s genetic distance analyses revealed highest affinities between the Genetics and Molecular Research 14 (3): 10729-10742 (2015)
©FUNPEC-RP www.funpecrp.com.br
E.S. AlSuhaibani et al.
10730
populations of Kuwait and Qatar, Oman and Yemen, and between Qatar and the United Arab Emirates. These results were displayed through a UGPMA dendrogram and principal component analyses, which established clustering of certain populations. Clinal trends of the allelic systems were observed by generating contour maps that allow a detailed appreciation of the distributions of alleles across the geography of the Arabian Peninsula and the Middle East. Taken together, these analyses are helpful in understanding the differentiation of blood group loci and for designing prospective studies for establishing the associations of these loci with health variables in the populations studied. Key words: ABO; Rh; Blood groups; Gene diversity; Clinal analyses; Genetic heterogeneity; Allelic polymorphisms
INTRODUCTION ABO and Rhesus (Rh) blood groups are clinically important in blood transfusions and organ transplantations. They have also been employed as genetic markers in population genetics and anthropological studies. They have become widely available as genetic markers due to easy and inexpensive typing, their polymorphic nature, and the elucidation of their genotypes from phenotypic data. The distribution of ABO and Rh blood types has been investigated in a number of populations around the globe. The proportions of these blood groups show considerable variation across geographic locations demonstrating the underlying genetic and ethnic diversity of human populations (Cavalli-Sforza et al., 1994). Studies describing the genetic structure of populations in the Arabian Peninsula are scarce. However, ABO and Rh blood groups polymorphisms have been reported for most of the countries in this region. For example, Al-Arrayed et al. (2001) reported the distribution of ABO and Rh blood types in a sample of 5675 individuals from Bahrain. Mahmood (2013) observed the distribution of blood types in the Iraqi (Arab Baghdadi) population. Blood group data of other Iraqi populations (i.e., Basrah, Thi-Qar, Sabians, Tal Afar, and Kurdistan) have also been reported (Jaff, 2010; Mahmood, 2014). Taha (2012) reported the distributions of blood types in the population of the United Arab Emirates (UAE). Bener and Yousafzai (2014) observed the blood group diversity in the Qatari population and Al-Arrayed et al. (2001) reported blood groups distributions in the population of Bahrain. Kamel et al. (1980) studied 10 erythrocyte polymorphic systems in the indigenous population of Abu Dhabi, and concluded that the prevalence of most blood groups were consistent with those of neighboring Arabs. Yip et al. (2006) carried out genotyping in Kuwaiti subjects and detected the distribution of sub-types of the ABO blood groups. Hanania et al. (2007) reported the blood types of the population of Jordan. Sakharow and Nofaľ (1996) observed the blood groups in the population of Syria. Different estimates of blood group distributions are also available for the Palestinian population; for example, Skaik et al. (2007) reported these data from the population of Palestine (Gaza). Most of these estimates have been reported from the major cities of the respective countries. On the other hand, few researchers have employed molecular markers to explore the genetic structure of regional Arab ethnicities. Of these, Barni et al. (2007) studied 15 autosomal microsatellite markers in the Iraqi population and compared their distributions with those in the neighboring populations. Sinha et al. (1999) typed eight short tandem repeat markers in Genetics and Molecular Research 14 (3): 10729-10742 (2015)
©FUNPEC-RP www.funpecrp.com.br
ABO and Rh genes in select Middle Eastern countries
10731
the population of Saudi Arabia and explored the differentiation of the studied loci. Similarly, Alshamali et al. (2005) examined short tandem repeats to elucidate the diversity of nine ethnic groups residing in Dubai. In this study, the diversity and heterogeneity of the ABO and Rh blood group loci have been elucidated in the Arab populations of the Arabian Peninsula and the Middle East. In order to draw a broader picture of the diversity of these loci, we have assembled the data of blood groups from the prominent populations of this region. Different indices were employed to observe the diversity and differentiation of blood group loci among these populations, and an attempt was made to determine the affinities between these populations based upon these serological polymorphisms. Furthermore, we have carried out clinal analyses to appreciate the geographic distribution of the alleles studied.
MATERIAL AND METHODS The ABO and Rh blood group records of 12 Arab populations of the Arabian Peninsula and the Middle East were retrieved from the literature. The populations included seven representative populations from the Arabian Peninsula, i.e., Bahrain, Kuwait, Oman, Qatar, Saudi Arabia, UAE, and Yemen (Danubio and Anelli, 1987; Al-Arrayed et al., 2001; Al-Bustan et al., 2002; Bahaj, 2003; Anonymous, 2014; Bener and Yousafzai, 2014), and five from the Middle East, i.e., Iraq, Jordan, Lebanon, Palestine (Gaza), and Syria (Sakharov and Nofaľ 1996; Hanania et al., 2007; Skaik et al., 2007; Mahmood, 2013). From the multiple records available for a particular population only the most recent data with the largest sample sizes were retained for analyses. Missing data were retrieved from online repositories or extrapolated from the nearest neighboring population (Anonymous, 2014). The maximum likelihood method was used to calculate the allele frequencies at the ABO locus, and the frequency of the Rh(d) allele was calculated from the square-root of the recessive phenotype (Mather, 1964). Hardy-Weinberg equilibrium (HWE) was checked at the ABO locus (Silva, 2002; Malik and Amin-ud-Din, 2013). Heterozygosity at the individual ABO and Rh loci and the combined heterozygosity was assessed (Nei, 1987). To observe the variability at the allelic systems, the coefficients of variance (CoVs) were calculated. To facilitate the meaningful grouping of populations, the homogeneity between the samples was tested (Neel and Schull, 1954), and the degree of differentiation was estimated at the ABO and Rh loci (Nei, 1987). The populations studied were divided into Northern and Southern groups and differentiation was checked in both groups independently as well as among the total populations. Nei’s genetic distances (DAs) were calculated using the allelic frequencies (Nei and Roychoudhury, 1982). A dendrogram was constructed by using the unweighted pair group method with arithmetic mean (UGPMA) and was based on the DA matrix (Sneath and Sokal, 1973; Ota, 1993). In order to appreciate the geographic distributions of the allelic systems studied, contour maps were generated with the help of Surfer (Golden Software, Inc., Ver.9.9.785). The populations studied were tagged on the map approximating their geographic coordinates. Owing to the extended geography of Saudi Arabia and to observe the continuous flow of alleles, eight data points/populations were employed from the Saudi Peninsula: Abha, Al-Khobar, Al-Qurayat, Domah, Jeddah, Riyadh, the Southern region, and Tabuk (AlSuhaibani et al., 2015). Data were also extrapolated for the neighboring regions that were not included in the analyses. Five maps were generated which showed the distributions of the alleles studied of the ABO and Rh loci. Genetics and Molecular Research 14 (3): 10729-10742 (2015)
©FUNPEC-RP www.funpecrp.com.br
10732
E.S. AlSuhaibani et al.
RESULTS Allele frequencies and locus heterozygosity At the ABO locus, the frequency of the p[A] allele ranged from 0.140 in Bahrain to 0.291 in Syria, the q[B] allele between 0.078 in Lebanon to 0.206 in Iraq, and the r[O] allele between 0.594 in Iraq to 0.726 in Oman (Table 1). At the Rh locus, the D allele exhibited the lowest frequency estimates (0.593) in Lebanon and the highest (0.766) in Bahrain. Six populations were concordant with HWE assumptions at the ABO locus. The most significant deviations from HWE were observed in the samples from Kuwait and Oman (c2 =26.82 and 24.46, respectively), followed by Syria, Yemen, and Qatar (Table 1). Table 1. Distribution of allelic frequencies at ABO and Rh loci and Hardy-Weinberg Equilibrium at ABO locus among the Arab populations studied.
ABO Locus
Population
p[A]
q[B]
Bahrain Iraq Jordan Kuwait Lebanon Oman Palestine (Gaza) Qatar Saudi Arabia Syria UAE Yemen
0.140 0.157 0.703 0.200 0.206 0.594 0.261 0.134 0.605 0.172 0.156 0.672 0.243 0.078 0.679 0.164 0.110 0.726 0.229 0.157 0.614 0.188 0.145 0.668 0.169 0.124 0.707 0.291 0.085 0.624 0.156 0.149 0.695 0.175 0.100 0.725
HWE Test Statistics; P value
r[O]
Rh Locus Rh+(D)
0.550 0.956 0.000 26.824* 0.045 24.455* 5.437* 4.937* 0.000 10.687* 0.006 5.577*
0.766 0.689 0.642 0.726 0.593 0.738 0.672 0.700 0.714 0.695 0.701 0.734
Rh-(d) 0.234 0.311 0.358 0.274 0.407 0.262 0.328 0.300 0.286 0.305 0.299 0.266
UAE = United Arab Emirates. *significantly deviating from HWE expectations.
Heterozygosity was established at the studied loci. At the ABO locus, heterozygosity was observed to be the highest in Iraq (0.565) and the lowest in Yemen (0.434) (Table 2; Figure 1). At the Rh locus, heterozygosity was the highest in Jordan (0.46) and the lowest in Bahrain (0.359). The average heterozygosity was the highest in Jordan (0.504 ± 0.044) and Bahrain (0.410 ± 0.052). The comparison of individual and combined heterozygosity among the samples is depicted in Figure 1. CoVs were estimated for the allelic frequency estimates prevalent in the populations. The CoV was found to be the highest for allele q[B] (22%), followed by alleles p[A] and r[O] at the ABO locus (25 and 7%, respectively) (Figure 2). At the Rh locus, the CoVs were 15 and 7% at alleles Rh(d) and Rh(D), respectively.
Gene diversity analysis and the DA matrix To observe the differentiation of the ABO and Rh loci, DAs were calculated among the populations (Table 3). The populations were split into Northern and Southern groups, which were essentially based on their geographic neighborhoods. The Northern group comprised the populations of the Middle East, i.e., Iraq, Jordan, Lebanon, Palestine (Gaza), and Syria. The Southern group comprised the populations of the Arabian Peninsula, i.e., Bahrain, Kuwait, Oman, Qatar, Saudi Arabia, UAE, and Yemen (Table 3). Genetics and Molecular Research 14 (3): 10729-10742 (2015)
©FUNPEC-RP www.funpecrp.com.br
ABO and Rh genes in select Middle Eastern countries
10733
Table 2. Heterozygosities at loci studied in Arabian/Middle East populations. Heterozygosity Population
ABO
Rh
Average
Bahrain Iraq Jordan Kuwait Lebanon Oman Palestine (Gaza) Qatar Saudi Arabia Syria UAE Yemen
0.461 0.565 0.548 0.494 0.474 0.434 0.546 0.498 0.456 0.519 0.470 0.434
0.359 0.428 0.460 0.398 0.483 0.387 0.441 0.420 0.409 0.424 0.419 0.391
0.410 ± 0.052 0.497 ± 0.068 0.504 ± 0.044 0.446 ± 0.048 0.479 ± 0.004 0.411 ± 0.024 0.493 ± 0.053 0.459 ± 0.039 0.433 ± 0.024 0.472 ± 0.047 0.445 ± 0.026 0.413 ± 0.022
UAE = United Arab Emirates.
Figure 1. Comparison of individual and combined heterozygosities at ABO and Rh loci in studied Arab populations of Arabian peninsula/Middle East.
Heterogeneity was higher in the Northern populations compared to the Southern group, which appeared more stratified (Table 3). The coefficient of inter-population gene differentiation (GST) was much higher in the Northern in contrast to the Southern group (0.0070 vs 0.0024). Absolute gene diversity (DST) was almost three times higher in the Northern than Genetics and Molecular Research 14 (3): 10729-10742 (2015)
©FUNPEC-RP www.funpecrp.com.br
10734
E.S. AlSuhaibani et al.
in the Southern group (0.0034 vs 0.0011). Among the total samples, DST was 0.0046 and DST was 0.0100. Genetic diversity across all groups (HT) was estimated to be 0.4594, while the diversity within the populations (HS) was 0.4548 (Table 3). It is worthwhile to mention that the HT of the ABO locus was higher than that of the Rh locus in the total samples as well as among the Northern and Southern groups.
Figure 2. Box and Whisker plots depicting the ranges of allele frequencies at ABO and Rh loci in the Arab populations. Table 3. Gene diversity analyses of ABO and Rh loci in Arabian/Middle East populations. Population Locus Northern group Southern group All populations
HT
HS
DST
GST
ABO Rh Pooled
0.5342 0.4499 0.4921
0.5302 0.4471 0.4887
0.0040 0.0076 0.0028 0.0062 0.0034 0.0070
ABO Rh Pooled ABO Rh Pooled
0.4651 0.3982 0.4317 0.4968 0.4220 0.4594
0.4640 0.3973 0.4306 0.4916 0.4181 0.4548
0.0011 0.0024 0.0009 0.0023 0.0011 0.0024 0.0052 0.0106 0.0039 0.0093 0.0046 0.0100
Genetics and Molecular Research 14 (3): 10729-10742 (2015)
©FUNPEC-RP www.funpecrp.com.br
10735
ABO and Rh genes in select Middle Eastern countries
DAs were estimated and the DA matrix was generated. There appeared to be highest affinities between the samples obtained from the populations of Kuwait and Qatar (0.0001), Oman and Yemen (0.0001), and Qatar and UAE (0.0002) (Table 4). The least similarities were observed between the samples from Bahrain and Lebanon (0.0157), Bahrain and Syria (0.0118), and Iraq and Lebanon (0.0114) (Table 4). The most heterogeneous populations (with the highest aggregated DA scores) were Lebanon, Syria, and Bahrain, whereas Qatar and Saudi Arabia were the least heterogeneous among the remaining populations. Table 4. Genetic distance matrix showing the affinities between Arab populations.
Bahrain
Iraq
Jordan
Kuwait Lebanon Oman
Palestine (Gaza) Qatar
Saudi Arabia Syria
UAE
Iraq 0.0052 Jordan 0.0105 0.0036 Kuwait 0.0010 0.0021 0.0050 Lebanon 0.0157 0.0114 0.0031 0.0098 Oman 0.0016 0.0066 0.0072 0.0013 0.0088 Palestine (Gaza) 0.0062 0.0012 0.0007 0.0022 0.0056 0.0049 Qatar 0.0022 0.0017 0.0026 0.0001 0.0064 0.0013 0.0008 Saudi Arabia 0.0017 0.0043 0.0050 0.0006 0.0071 0.0003 0.0030 0.0003 Syria 0.0118 0.0088 0.0024 0.0071 0.0037 0.0065 0.0038 0.0047 0.0058 UAE 0.0015 0.0029 0.0052 0.0004 0.0085 0.0013 0.0026 0.0002 0.0004 0.0079 Yemen 0.0025 0.0072 0.0066 0.0018 0.0075 0.0001 0.0048 0.0015 0.0005 0.0052 0.0018
A dendrogram was constructed on the basis of the DA distance matrix. An outlier, with equal allele frequencies at both loci, was included in the analyses. Two main clusters emerged among the recruited populations. One cluster comprised the populations of the Arabian Peninsula, i.e., Kuwait, Qatar, UAE, Saudi Arabia, Oman and Yemen, while Bahrain joined the cluster as a distant member (Figure 3). Another cluster comprised Iraq, Jordan, and Palestine (Gaza), while Lebanon and Syria appeared as a separate sub-group (Figure 3). These results were iterated by principal component analyses (Figure 4). The highest affinities were evident between Kuwait and UAE, and between Oman and Yemen. The most distantly located populations across the X-Y coordinates were Lebanon, Syria, Bahrain, and Iraq (Figure 4).
Figure 3. Dendrogram based upon DA-UPGMA showing the genetic relationships between the Arab populations of Arabian peninsula/Middle East. Genetics and Molecular Research 14 (3): 10729-10742 (2015)
©FUNPEC-RP www.funpecrp.com.br
10736
E.S. AlSuhaibani et al.
Figure 4. Scatter plot representing the output of Principal Component Analyses. Clustering of populations corresponds with the results obtained in dendrogram.
Pearson correlation coefficients were calculated between the allelic systems and a correlation matrix was generated. Significantly negative correlation was observed between the p[A] and r[O] alleles at the ABO locus (Pearson = -0.833; P = 0.001) (Table 5). Remarkable correlations were also observed between the p[A] and Rh(D) alleles (Pearson = -0.687; P = 0.014), and between r[O] and Rh(D) (Pearson = 0.516; P = 0.086). Table 5. Correlation matrix between the allelic systems. p[A] q[B] r[O] D d
p[A]
ABO Locus q[B]
r[O]
Rh Locus D
1 -0.375 1 -0.833 -0.201 1 -0.687 0.351 0.516 1 0.687 -0.351 -0.516 -1.000
d
1
Contour maps and clinal analyses Geographic distributions of the allelic systems studied were established by generating contour maps. At the ABO locus, there was a high prevalence of allele p[A] in the Middle East, which depicted a declining trend towards the South and the South-East (Figure 5). There Genetics and Molecular Research 14 (3): 10729-10742 (2015)
©FUNPEC-RP www.funpecrp.com.br
ABO and Rh genes in select Middle Eastern countries
10737
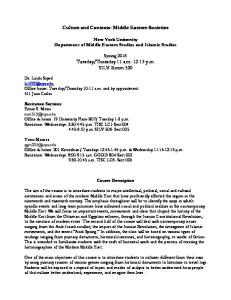
was concentration of allele p[A] in Syria and a declining clinal trend was observed up to the central region of Saudi Arabia. Allele q[B] was shown to be the most prevalent in the NorthEastern region, i.e., Iraq and North Saudi Arabia, and decreased Southwards (Figure 6). Allele q[B] was least prevalent in the Southern extremes including the Yemen region. Allele r[O] was correspondingly more prevalent in the Southern region and less so in the North-Eastern region (Figure 7). At the Rh locus, the D allele showed a high concentration in the North-Western region with its highest concentration in Northern Saudi Arabia (Figures 8 and 9).
Figure 5. Interpolated contour map of allele p[A] at ABO locus showing the clinal trend of distribution. Sampling points are tagged on the map as black points. Distribution of allele was also predicted beyond the geography of populations studied.
Figure 6. Contour map of allele q[B] at ABO locus. Genetics and Molecular Research 14 (3): 10729-10742 (2015)
©FUNPEC-RP www.funpecrp.com.br
E.S. AlSuhaibani et al.
10738
Figure 7. Contour map of allele r[O] at ABO locus.
Figure 8. Interpolated contour map of allele D at Rh locus.
Figure 9. Interpolated contour map of allele d at Rh locus. Genetics and Molecular Research 14 (3): 10729-10742 (2015)
©FUNPEC-RP www.funpecrp.com.br
ABO and Rh genes in select Middle Eastern countries
10739
DISCUSSION Samples of six of the studied Arab populations deviated from HWE expectations at the ABO locus, which could be due to uneven sampling strategies, higher representations of male individuals in the blood group records, and increased homozygosity due to consanguinity. The analyses of gene diversity revealed that loss of heterozygosity could be observed, particularly in the populations of the Arabian Peninsula. In addition, the samples from Bahrain, Oman, Saudi Arabia, and Yemen displayed very low heterozygosity. The samples from the Middle Eastern populations, i.e., Iraq, Jordan, and Palestine (Gaza) had relatively higher estimates of heterozygosity than did the other samples. Collectively, heterozygosity among the populations studied was slightly higher than that of the Saudi Arabian population alone (AlSuhaibani et al., 2015), but was very low when compared to estimates for the Pakistani population (Malik and Amin-ud-Din, 2013; Ali and Malik, 2014; Rehman et al., 2014). Likewise, GST and DST at both loci were much lower in the populations of the Arabian Peninsula/Middle East compared to the Pakistani population. The present analyses, however, did not allow the elucidation of factors that could be responsible for the reduced heterozygosity at these loci. The pattern and frequency distributions of blood phenotypes varies across populations (Cavalli-Sforza et al., 1994; O’Neil, 2012). The current analyses revealed that the populations with a high frequency of the p[A] allele are primarily clustered in the Northern region of the studied geography, i.e., the Middle East. Allele p[A] (and correspondingly the blood group A) exhibited a Southwards decrease in frequency, becoming minimal in the Central region of Saudi Arabia. The middle strip of Saudi Arabia, from east to west, is represented by large cosmopolitan cities, which have multi-ethnic assemblages. Similarly, Allele q[B] (and correspondingly the blood phenotype B) was observed to be most frequent in the North-Eastern part of the Arabian Peninsula. Allele q[B] was concentrated in the Domah region of Saudi Arabia and Iraq, and demonstrated a sharp Southward decline showing minimal frequency in the Abha region of Saudi Arabia. A somewhat reciprocal pattern was observed for allele r[O] (and the blood phenotype O) which was concentrated in the South-Western tip of the Arabian Peninsula and demonstrated a North-Eastern decay in frequency. It was observed to be lease prevalent in Iraq and the Middle East. On the other hand, the patterns of alleles D and d at the Rh locus were mosaic and discontinuous. Allele D was seen to be concentrated in the Domah region of Saudi Arabia. It was also observed to be more prevalent at the South-Eastern and South-Western tips of the Arabian Peninsula, i.e., Yemen and Oman, respectively. Allele d was observed to be most prevalent in Lebanon and Jordan. It is worthwhile to mention that the patterns of distribution of alleles p[A] and r[O] at the ABO locus appeared to be antagonistic in the studied geography. This observation corresponds with a significant inverse correlation between p[A] and r[O] allele frequencies among the studied populations (Pearson = -0.833; P = 0.001) (Table 5). The nature of this allelic relationship and the selective forces shaping this phenomenon await further investigation. The underlying reasons for the differences observed in the distributions of allele frequencies among the studied Arab populations remain to be elucidated. Several theories have been proposed to explain the distribution of blood groups globally. For instance, migrations and population admixtures could be the sources of blood group differentials. In particular, the geographic clines of allele distributions could be readily explained by human migrations. Furthermore, selection pressures conferred by pathogen-driven blood group antigen changes could be one of the factors responsible for the current distribution of blood types (Storry and Olsson, 2009; Zhang et al., 2012). Genetics and Molecular Research 14 (3): 10729-10742 (2015)
©FUNPEC-RP www.funpecrp.com.br
E.S. AlSuhaibani et al.
10740
Data regarding blood group distribution is useful in medicine, such as for blood transfusions and organ transplantation. Certain blood types exhibit associations with diseases and infections. Sharara et al. (2006) observed a higher incidence of blood type A in individuals with gastric malignancy than in healthy individuals. The frequency of blood type O was higher in patients with paratyphoid, typhoid, and cholera, whereas blood type B has been shown to have an increased prevalence in patients suffering from urinary tract infections and gonorrhea (Lomberg et al., 1992). Increased prevalence of blood type A has been witnessed among patients with meningococcal meningitis (Blackwell et al., 1986). A study in Lahore, Pakistan Siddiqui et al. (2011) showed that blood group A and Rh-negative status were significantly higher and blood group AB was significantly lower in patients with angina pectoris. In a study in Pakistan, the prevalence of male infertility in subjects with blood group O was higher than in those with all other ABO blood types. Al-Ghamdi (2009) explored the association between ABO blood types and severity levels of chronic periodontitis, and found that patients with blood group B had a higher prevalence of the more severe form of periodontitis. More recently, genome-wide association studies have identified potential association of the ABO locus with myocardial infarction, thrombosis, and multiple cardiovascular variables. However, the underlying cellular and physiological mechanisms explaining these associations await further research (Zhang et al., 2012; Liumbruno and Franchini, 2013). Even though these studies establish the association of blood group types with certain diseases/ morbidities, the countrywide or global patterns of association have not been emphasized. It would be interesting to know whether the blood type and disease associations are a regional or ethnicity-specific phenomenon or exist in wider populations and geographies. In this context, the contour maps of the allele frequencies of blood groups could be an important step forward. These maps could be very helpful in estimating the burden of certain diseases in a particular population. Furthermore, clinal trends could also be useful in correlating the infections and various susceptibilities prevalent in populations with blood groups and alleles. Heterozygosity and gene diversity at the ABO and Rh loci were low among the studied Arab populations. This study reported contour maps of the allelic systems at the ABO and Rh loci, which allowed a comprehensive appreciation of the distributions of alleles across the geography of the Arabian Peninsula and the Middle East. Owing to the established associations of blood group types with certain diseases and morbidities, these analyses might be very useful in estimating the burden of disease in particular regions or nations.
Conflicts of interest The authors declare no conflict of interest.
ACKNOWLEDGMENTS Research supported by the DeanShip of Scientific Research at King Saud University (#IRG14-05).
REFERENCES Al-Arrayed S, Shome DK, Hafadh N, Amin S, et al. (2001). ABO blood group and Rhd phenotypes in Bahrain: results of screening school children and blood donors. Bahrain Med. Bull. 23: 112-115.
Genetics and Molecular Research 14 (3): 10729-10742 (2015)
©FUNPEC-RP www.funpecrp.com.br
ABO and Rh genes in select Middle Eastern countries
10741
Al-Bustan S, El-Zawahri M, Al-Azmi D and Al-Bashir AA (2002). Allele frequencies and molecular genotyping of the ABO blood group system in a Kuwaiti population. Int. J. Hematol. 75: 147-153. Al-Ghamdi AST (2009). Association between ABO blood groups and severity of chronic periodontitis. JKAU: Med. Sci. 16: 31-41. Ali S and Malik S (2014). Phenotypic distribution, allelic diversity and degree of differentiation at ABO and Rh loci in the population of Haripur District, Khyber Pakhtunkhwa, Pakistan. Pakistan J. Zool. 46: 1-7. Alshamali F, Alkhayat AQ, Budowle B and Watson ND (2005). STR population diversity in nine ethnic populations living in Dubai. Forensic Sci. Int. 152: 267-279. AlSuhaibani ES, Kizilbash NA and Malik S (2015). Heterogeneity and diversity of ABO and Rh blood group genes in select populations of Saudi Arabia. Genet. Mol. Res. 14: 7850-5863. Anonymous (2014). Stay Negative! - The Rh Negative Weblog. Available at [http://www.rhesusnegative.net/]. Bahaj AA (2003). ABO and Rhesus blood groups distribution in Hadhramout population. Hadhramout Stud.Rsrch. 4: 53-58. Barni F, Berti A, Pianese A, Boccellino A, et al. (2007). Allele frequencies of 15 autosomal STR loci in the Iraq population with comparisons to other populations from the middle-eastern region. Forensic Sci. Int. 167: 87-92. Bener A and Yousafzai MT (2014). The distribution of the ABO blood groups among the diabetes mellitus patients. Niger. J. Clin. Pract. 17: 565-568. Blackwell CC, Jonsdottir K, Hanson M, Todd WT, et al. (1986). Non-secretion of blood group antigens redisposing to infection by Neisseria meningitidis and Streptococcus pneumonia. Lancet 2: 284-285. Cavalli-Sforza LL, Menozzi P and Piazza A (1994). The history and geography of human genes. Princeton University Press, Princeton. Danubio ME and Anelli A (1987). ABO, Rh(D) and haptoglobin distribution in in a sample from Sultanate of Oman. Int. J. Anthropol. 2: 77-81. Hanania SS, Hassawi DS and Irshaid NM (2007). Allele frequency and molecular genotypes of ABO blood group system in Jordanian population. J. Med. Sci. 7: 51-58. Jaff MS (2010). ABO and rhesus blood group distribution in Kurds. J. Blood Med. 1: 143-146. Kamel K, Chandy R, Mousa H and Yunis D (1980). Blood groups and types, hemoglobin variants, and G-6-PD deficiency among Abu Dhabians in the United Arab Emirates. Am. J. Phys. Anthropol. 52: 481-484. Liumbruno GM and Franchini M (2013). Beyond immunohaematology: the role of the ABO blood group in human diseases. Blood Transfus. 11: 491-499. Lomberg H, Jodal U, Leffler H, De MP, et al. (1992). Blood group non-secretors have an increased inflammatory response to urinary tract infection. Scand. J. Infect. Dis. 24: 77-83. Mahmood AE (2013). Genetic analysis of ABO and Rh (D) blood groups in Arab Baghdadi ethnic groups. Al-Mustansiriyah J. Sci. 24: 37-46. Mahmood AE (2014). Frequency of ABO and Rhesus blood groups among Tal Afar population, Iraq. Al-Mustansiriyah J. Sci. 25: 17-26. Malik S and Amin-ud-Din M (2013). Genetic heterogeneity and gene diversity at ABO and Rh loci in the human population of southern Punjab, Pakistan. Pakistan J. Zool. 45: 1185-1190. Mather WB (1964). Principles of Quantitative Genetics. Burgess Publishing Co, Minneapolis. Neel JV and Schull WJ (1954). Human Heredity. University of Chicago Press, Chicago. Nei M (1987). Molecular Evolutionary Genetics. Columbia University Press, New York. Nei M and Roychoudhury AK (1982). Genetic relationship and evolution of human races. Evol. Biol. 14: 1-59. O’Neil D (2012). Modern Human Variation: an introduction to contemporary human biological diversity. Available at: http://anthro.palomar.edu/vary/Default.htm. Ota T (1993). DISPAN: Genetic distance and phylogenetic analysis. Pennsylvania State University, University Park. Rehman AU, Wahab ZU, Khattak MNK and Malik S (2014). ABO and Rh (D) blood groups polymorphism in four Tehsils of Bajaur Agency (Federally Administered Tribal Areas), Pakistan. Anthropologist 18: 259-261. Sakharov RS and Nofaľ KhK (1996). The frequency of ABO blood groups and the expression of group antigens and isohemagglutinins in Syrian Arabs. Sud. Med. Ekspert. 39: 34-36. Sharara AI, Abdul-Baki H, ElHajj I, Kreidieh N, et al. (2006). Association of gastroduodenal disease phenotype with ABO blood group and Helicobacter pylori virulence-specific serotypes. Dig. Liver Dis. 38: 829-833. Siddiqui ZH, Chaudhry MA, Nigar M and Butt H (2011). A study of association between ABO and Rh blood groups, sex, age and angina pectoris. Sci. Int. (Lahore). 23: 113-116. Silva PJN (2002). ABO estimator. Faculdade de Ciencias da Universidade de Lisboa, Lisboa, Portugal. Sinha S, Amjad M, Rogers C, Hamby JE, et al. (1999). Typing of eight short tandem repeat (STR) loci in a Saudi Arabian population. Forensic Sci. Int. 104: 143-146.
Genetics and Molecular Research 14 (3): 10729-10742 (2015)
©FUNPEC-RP www.funpecrp.com.br
E.S. AlSuhaibani et al.
10742
Skaik YAW, Alhawary AS, Shbair AS and Hamouda BB (2007). Frequency of ABO and Rh(d) blood groups in five governorates in Gaza-strip. Pakistan J. Med. Sci. 23: 924-927. Sneath PHA and Sokal RR (1973). Numerical Taxonomy. WH Freeman and Company, San Francisco. Storry JR and Olsson ML (2009). The ABO blood group system revisited: a review and update. Immunohematology 25: 48-59. Taha JY (2012). Rh Antigen and Phenotype Frequency in Kalba Region, UAE. Bahrain Med. Bull. 34: 1-5. Yip SP, Choi PS, Lee SY, Leung KH, et al. (2006). ABO blood group in Kuwaitis: detailed allele frequency distribution and identification of novel alleles. Transfusion 46: 773-779. Zhang H, Mooney CJ and Reilly MP (2012). ABO blood groups and cardiovascular diseases. Int. J. Vasc. Med. 2012: 641917.
Genetics and Molecular Research 14 (3): 10729-10742 (2015)
©FUNPEC-RP www.funpecrp.com.br