Dissolved organic carbon and dissolved nitrogen in soil under different fertilization treatments S.S. Gonet1, B. Debska2 1Department
of Soil Science, Nicolaus Copernicus University in Torun, Poland of Environmental Chemistry, University of Technology and Agriculture in Bydgoszcz, Poland
2Department
ABSTRACT The objective of the study was to evaluate the effects of long-term fertilization of a sandy soil with differentiated doses of cattle slurry as well as its after-effect action on the possibilities of migration of dissolved organic carbon (DOC) and dissolved nitrogen (DNt) down to deeper layers of the soil profile. DOC and DNt were extracted with borate buffer and 0.004M CaCl2 solution. Evaluation of effects of cattle slurry on the content of DOC and DNt was done in comparison with mineral fertilization. It was shown that the use of cattle slurry in the doses of 100 and 200 m3/ha caused a significant increase of labile organic matter in the 0–25 and 25–50 cm layers of soil. As compared with mineral fertilization the application of slurry increased also the amounts of extracted DNt, but only in the surface layer. The DNt content in the deeper soil horizons did not depend on the kind of fertilization. Concentrations of DOC and DNt in the extracts depended not only on their content in soil but it was also modified substantially by the extractant used. Keywords: cattle slurry; dissolved organic carbon; dissolved nitrogen; washing out
Soil organic matter consists of organic material at different phases of decomposition and of macromolecular compounds of very specific properties. It is part soluble in water or in salt solutions of pH ~ 7 (dissolved organic matter) is the most mobile. It may contain carbohydrates, proteins, fats, hydrocarbons and their derivatives, fractions of humic acids of low molecular weight as well as other numerous simple organic compounds. Quantification of soluble organic matter, i.e. fraction soluble in water or in salt solutions of reaction close to neutral is a complex process depending on a number of factors, connected first of all with the extraction procedure. The amount of soluble carbon assayed in extracts depends among others on the kind of extractant, time of extraction, sample moisture, the soil-extractant ratio as well as method of organic carbon assessing in the extracts (Zsolnay and Gorlitz 1994). The labile organic matter fraction expressed as so called dissolved organic carbon (DOC) plays an important role in the soil environment: (1) it can be leached to deeper horizons of the soil profile and ground waters; an important process especially in sandy soils; (2) it can be transported in erosion PLANT SOIL ENVIRON., 52, 2006 (2): 55–63
processes; (3) its components, especially low-molecular organic compounds and low-molecular humus fraction, may play the role of stimulators or inhibitors of the plant growth and plant development; (4) it can be an energetic material easily accessible by microorganisms. The content of organic matter soluble in water in arable soils depends on agrotechnical factors, first of all on the kind of organic material introduced into soil (Reinersten et al. 1984, Hadas et al. 1993, McKenney et al. 1993, Černý et al. 2003). According to Asmar et al. (1994) the addition of fresh organic material to soil always increases the amount of water-soluble organic matter. As a consequence of more and more popular nonbedding animal production manure as a fertilizer has been gradually replaced by slurry. Mineral and organic fertilization capacity of slurry is in stake for its agricultural application. That is why slurry is being compared both with manure and mineral fertilizers. In general fertilization with slurry increases yields of the cultivated plants, concentration of organic carbon and total nitrogen in soils (Einland 1981, Mackowiak 1994, Aoyama and Kumakura 2001). However, there 55
are a number of controversies connected first of all with the possibilities of migration of carbon mobile compounds released during mineralisation of organic material down the soil profile. Another important factor connected with the use of slurry are sometimes really big losses of nitrogen resulting from its leaching down the soil profile, even to ground waters (Mazur and Budzynska 1994, Periago et al. 2000). The objective of this paper was to evaluate the effect of long-term fertilization of light soil with differentiated doses of cattle slurry and its sequential activity as well as possibilities of migration of labile carbon and nitrogen compounds down the soil profile. The evaluation of fertilization of cattle slurry on the content of dissolved organic carbon (DOC) and DNt in soil was done in comparison with mineral fertilization alone. The amount of DOC as well as that extracted with borate buffer of pH 7 and DNt were compared with labile forms of carbon and nitrogen obtained after extraction with 0.004M CaCl 2. MATERIAL AND METHODS The experiment was carried out on isolated (concrete barriers) plots of 1 m 2 filled in upper layer (1 m) with soil material of loamy sand grain size and clay at the bottom. In 1973–1989 cattle slurry was used at the calculation rates of 25 [G(25)], 50 [G(50)], 100 [G(100)] and 200 [G(200)] m 3
per ha yearly – variants abbreviated as G1, or as a double rate every two years – variants abbreviated as G2. Every variant was repeated using slurry with extra nitrogen added as mineral fertilizers (NH4NO3, variants abbreviated as G1+N; G2+N). In order to make comparisons between the slurry and mineral fertilizers activity four parallel variants of mineral fertilisation were also included into the experiment (NPK1–NPK4) – Table 1. In this case the doses corresponded with 50% of the components being introduced into soil with cattle slurry. Average composition of the slurry was (in % of the fresh weight): N – 0.31%, P 2O 5 – 0.16%, K 2O – 0.41%, CaO – 0.23%, dry matter – 9.1%. There were 4 replications for every experimental variant. The after effect was studied after stopping fertilisation with cattle slurry in 1990 and using corrected mineral fertilisation only, on all the plots up to 1999. An optional crop rotation system was used over the whole experimental period. In 1973–1989 (17 years) the following plants were cultivated on the plots: potato, winter wheat, rye for green chop, corn for grains, oats, fodder beet, corn for grain, corn for silage, winter rape, sugar beet, spring barley, corn for grain, spring wheat, corn for grain, fodder cabbage, corn for grain, spring barley and potato. After the use of slurry, in 1990–1999 (10 years) the following plants were cultivated: sugar beet, corn for grain, oats, corn for grain (for two years), corn for silage (for two years), mustard for green chop, and corn for grain
Table 1. Experimental system Treatment
Single dose of slurry (m 3/ha)
Treatment
Single dose of slurry (m3/ha)
NPK1
–
NPK2
–
G1(25)
25
G1(50)
50
G1+N(25)
25
G1+N(50)
50
G2(25)
50
G2(50)
100
each two years G2+N(25)
50
each two years G2+N(50)
each two years
each two years
NPK3
–
NPK4
–
G1(100)
100
G1(200)
200
G1+N(100)
100
G1+N(200)
200
G2(100)
200
G2(200)
400
each two years G2+N(100)
200 each two years
56
100
each two years G2+N(200)
400 each two years
PLANT SOIL ENVIRON., 52, 2006 (2): 55–63
tures under study were determined by correlation coefficients and regression equations with the use of STATISTICA software.
for the last two years (Maćkowiak 2000). After the harvest plant residues were left behind. All the cultivations measures were done by hand. Soil samples were air dried and sieved (φ < 2 mm). Organic matter content (TOC) in soil samples of the 0–25 cm, 25–50 cm, 50–75 cm and 75–100 cm layers was assayed with the Primacs SC analyser (Skalar, Breda, the Netherlands), while total nitrogen content Nt was determined with the standard Kjeldahl method. Dissolved organic carbon (DOC) and dissolved nitrogen (DNt) concentrations were measured in solutions obtained after extraction with borate buffer (pH = 7). The extraction was done using the soil sample to extractant ratio of 1:10 over 1 h. DOC and DNt content were assayed with the TOCN Formacs autoanalyser (Skalar, Breda, Holland). The results were analysed using variation analysis with Tukey test at the significance level of α = 0.05, for multi-factor experiments with ANALWAR software. The system of factors was as follows: Factor I – year (sampling time: 1989, 1999) Factor II – fertilizer dose (25, 50, 100, 200), for instance 25 indicates the variant of mineral fertilization NPK1 and all variants with the slurry used in the dose 25 m 3/ha/year [G1(25), G1+N(25), G2(25) and G2+N(25)] Factor III – kind of fertilization (NPK, G1, G1+N, G2, G2+N) DOC and DNt contents determined by extraction with borate buffer were compared with their contents determined by extraction with 0.004M CaCl2 solution. The dependencies among the fea-
16
0–25 cm
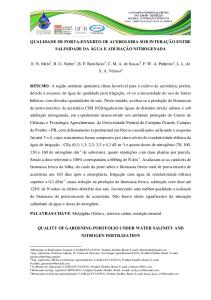
RESULTS AND DISCUSSION Long-term fertilization with cattle slurry (1973– 1989 – first step of the experiment) with doses ranging 50–200 m3/ha/year caused an increase of soil resources of organic matter. The introduction of slurry in the doses of 100 and 200 m 3/ha/year produced a clear surplus of TOC existing even 10 years after the treatment, while fertilization with 50 m 3 slurry per ha maintained humus content at the level of the starting data (7.9 g/kg). Experimental fertilization did not change carbon content in the soil layers deeper than 50 cm (Figure 1). The application of slurry requires a close observation of changes in nitrogen concentration because of numerous opinions indicating that the major part of nitrogen introduced with the slurry which is not used by the plants undergoes leaching and/or is released to the atmosphere. Only a small portion of nitrogen remains in the soil (Mazur and Budzynska 1994). In our experiment fertilization with slurry increased by 27 to 108% total nitrogen content in the surface soil layer. Earlier fertilization with slurry in doses of 50–200 m 3 /ha/year resulted in the after effect observed as an increase of nitrogen concentration ranging 29–105% as compared with this element content in soil fertilized only with NPK. Nitrogen
25–50 cm
50–75 cm
75–100 cm
1989
TOC (g/kg)
12
1999
8 4
G(200)
G(50)
NPK
G(200)
G(50)
NPK
G(200)
G(50)
NPK
G(200)
G(50)
NPK
0
Figure 1. Average TOC content in soil fertilized only with minerals (NPK) and slurry doses of 25, 50, 100 and 200 m 3/ha [G(25), G(50), G(100) and G(200), respectively]; 1989, 1999 – years of sampling PLANT SOIL ENVIRON., 52, 2006 (2): 55–63
57
2 0–25 cm
25–50 cm
50–75 cm
75–100 cm
Nt (g/kg)
1.5
1989 1999
1 0.5
G(200)
G(50)
NPK
G(200)
G(50)
NPK
G(200)
G(50)
NPK
G(200)
G(50)
NPK
0
Figure 2. Average Nt content in soil fertilized only with minerals (NPK) and slurry doses of 25, 50, 100 and 200 m 3/ha [G(25), G(50), G(100) and G(200), respectively]; 1989, 1999 – years of sampling
content in the 50–100 cm soil layers did not depend on the kind and dose of fertilizers (Figure 2). Dissolved organic carbon (DOC) The content of DOC extracted with borate buffer of pH = 7 in soil samples taken from the 0–25 and 25–50 cm soil layers significantly depended on the kind and amount of the fertilizer used. However, it was not related to the mode of slurry application (Table 2). In 1989, fertilization of soil with slurry in the doses of 100 and 200 m3/ha significantly increased DOC content in the layers 0–25 and 25–50 cm as compared with fertilization with NPK (Table 3). As compared with the data of 1989, surface soil sampled in 1999 from the plots fertilized earlier with cattle slurry and soil samples fertilized only with NPK contained less DOC (on average by 32% and 34%, respectively). The highest concentrations of DOC extracted with borate buffer were found in soil samples fertilized with slurry doses of 100 and 200 m3/ha. In 1999 the highest concentration of DOC in the 25–50 cm layer was shown in case of soil with earlier fertilization with slurry dose of 200 m 3/ha. No effect of lower doses of slurry (less than 200 m3/ha) on dissolved organic matter was observed (Table 3). Observations recorded for DOC content in soil layers lower than 50 cm were different. Statistical analysis did not show effects neither of fertilizers nor of the way of slurry application on the content of the most labile fraction of organic matter in 58
those horizons. Moreover, DOC concentration in soils taken from the 75–100 cm layer did not depend on the dose of fertiliser, too (Table 2). In the case of the 50–75 cm layer the highest contents of DOC were found in soil samples on which both slurry and mineral fertilizers were used in their highest doses. In 1999 DOC content in that soil layer decreased on average by about 26% as compared with its concentration noted in 1989 (Table 2). Slurry application usually brings about threats of movements of labile carbon compounds toward deeper layers of the soil profile or even to ground waters. As compared with soil fertilized only with NPK the soil fertilized with 100 and 200 m 3 of slurry per ha showed a significant increase of DOC but only in the layer 25–50 cm, while application of the highest dose of 200 m3/ha resulted in higher content of DOC in that part of soil even after 10 years from the completed use. The effect of enrichment of lower soil layers with extractable organic carbon did not depend on the kind of fertilization. DOC content assessed in the surface soil in 1989 comprised on average 2.4% of TOC (Table 2). No effects of kind of fertilization and fertilizer dose on the percentage of this organic matter fraction in the 0–25 cm layer. A higher DOC share was found in soil organic matter in the 25–50 cm soil layer, while the percentage of TOC in this layer depended on the fertilizer dose reaching the highest values in the variants NPK4 and G(200). Over the experimental years the amount of DOC found in the 50–75 cm soil layer comprised on average PLANT SOIL ENVIRON., 52, 2006 (2): 55–63
Table 2. Results of variance analysis of DOC content (mg/kg) in soil and DOC content as percent of TOC Soil layer
Factor
0–25 cm
25–50 cm
50–75 cm
75–100 cm
DOC (mg/kg) Factor I year Factor II dose of fertilizers
Factor III mode of fertilization
1989
261
1999
175
25
169
50
197
100
222
200
283
235
181
136
NPK
167
157
141
130
G1
232
197
148
133
G1+N
228
G2
229
193
155
125
G2+N
234
191
153
127
LSD = 18.3
233 140
LSD = 11.9
160 LSD = 35.3
LSD = 42.3
161 190
195
172 127
LSD = 6.1
131 LSD = 21.6
LSD = 25.9
140 148
142 110
LSD = 7.7
125 LSD = 11.7
151
ns
116 127
LSD = 14.9
122
ns
Interactions I/II; II/I
36.6; 49.9
ns
13.6; 19.8
ns
I/III; III/I
ns
ns
ns
17.3; 25.3
II/III; III/II
ns
ns
ns
33.3; 35.7
DOC content as percent of TOC Factor I year Factor II dose of fertilizers
Factor III mode of fertilization
1989
2.4
1999
2.2
25
2.3
50
2.3
100
2.3
200
2.2
4.5
6.4
5.4
NPK
2.4
3.9
5.2
5.7
G1
2.2
4.1
5.9
5.7
G1+N
2.1
G2
2.3
4.1
5.7
5.1
G2+N
2.3
3.9
6.0
5.1
LSD = 0.16
4.3 3.7
LSD = 0.26
4.0 ns
ns
3.8 3.8
4.0
5.7% TOC. The percentage of DOC in the bulk of organic carbon determined in the 75–100 cm layer was similar to that observed for this carbon fraction in the 50–75 cm layer (Table 2). Some controversies can arise because of more than doubled percentage of the DOC fraction in soil layers below 50 cm as compared with the share of the same fraction in the surface soil. The observation suggested a migration of dissolved organic matter occurring in the surface soil down the soil profile. However, a higher percentage of DOC in the PLANT SOIL ENVIRON., 52, 2006 (2): 55–63
5.8 5.5
ns
5.3 LSD = 0.50
ns
5.5 5.3
5.6
5.7 4.9
LSD = 0.62
5.4 ns
ns
5.4 5.3
5.0
ns
ns
50–100 cm soil layer was not the result of the way of fertilization used and it did not depend of doses of fertilizers. Therefore, with some approximation it can be stated that organic matter of deeper soil layers is genetically richer in DOM fractions, what is a consequence of a high mobility of dissolved organic matter and/or a lower tendency of its mineralization. However, there is no doubt that because of fertilization and crop rotation certain enrichment in dissolved organic matter occurred in the 25–50 cm soil layer (Tables 2 and 3). 59
Table 3. Average DOC content (mg/kg) in soil layers (cm) after two study periods Treatment
1989
1999
0–25
25–50
50–75
75–100
0–25
25–50
50–75
75–100
NPK1
180
181
143
121
145
115
115
105
NPK2
215
170
156
129
140
124
117
84
NPK3
206
185
150
131
112
128
128
91
NPK4
210
215
162
168
137
138
157
135
G(25)*
184
206
159
139
158
120
103
117
G(50)*
235
209
167
133
169
120
114
103
G(100)*
270
254
172
149
206
143
128
112
G(200)*
411
308
209
150
212
193
162
113
*average of four fertilization combinations (G1, G1+N, G2 and G2+N)
While analysing samples collected from longterm field experiments Debska (2004), Debska and Gonet (2002) showed that under fixed fertilization and crop rotation conditions the content of DOC in TOC is about the same depending directly on total organic matter concentration in soil. In our experiment the percentage of DOC in total organic carbon in surface soil ranged 2.2–2.4% and did not depend on any of the analysed factors. Therefore, the observed relations seem to corroborate with earlier findings. Dissolved total nitrogen (DNt) Nitrogen in slurry occurs in organic and mineral compounds. Among nitrogen organic ones one should mention proteins, aminoacids, urea, hippuric acid, ureic acid, etc. Inorganic nitrogen occurs mainly as ammonium (NH 4+) and nitrate (V) (NO 3–) nitrogen. About 50% of total nitrogen found in slurry is present in water-soluble forms, that is crucial for its high availability to plants as well as possibilities for penetration to lower soil layers and ground waters (Mackowiak 1994). The content of total nitrogen extracted with borate buffer from the 0–25 cm layer depended on the kind and dose of the fertilizer used (Table 4). In 1989 after 17 years of fertilization with slurry, the highest DNt were found in soil fertilized with the dose 200 m3/ha. Also the highest NPK dose caused in soil an increase of total extractable nitrogen. After completing the second experimental step (1999) a higher DNt content were noted on plots fertilized with 100 and 200 m 3 slurry/ha (Table 5). Concentration of nitrogen in extracts obtained from samples taken from the 25–50 cm layer de60
pended exclusively on the dose of fertilized and was by about 79% higher in 1989 than in 1999 (Table 4). In 1989 the highest concentration of DNt was observed in soil samples with the highest doses of both slurry and NPK. After the second step of the experiment (1999) the concentration of DNt was still higher in soil after the treatment with high doses of the fertilizers. Soil samples treated with the highest slurry dose collected in 1989 from the 50–75 and 75–100 cm layers contained the highest content of DNt (Table 5). The percentage of DNt in the 0–25 cm layer sampled after the first step of the experiment (1989) was significantly higher as compared with corresponding samples collected after the second step in 1999. However, no univocal effect of fertilizer dose on the percentage of DNt fraction in the surface soil was noted. In the soil layers lower 25 cm the highest DNt percentage was observed after application of 200 m3 slurry/ha and the highest NPK dose. The analysis of the DNt content expressed as absolute values and as percentage of the total nitrogen revealed that slurry doses strongly surpassing nutritional needs of plants (200 m 3 /ha, understood as a discarding dose) can cause an enrichment of deeper soil horizons with dissolvable nitrogen forms, similarly to overstated mineral fertilization. The effect of extractant on the content of DOC and DNt As can be found in the literature, the amount of extracted organic matter depends a great deal PLANT SOIL ENVIRON., 52, 2006 (2): 55–63
Table 4. Results of variance analysis of DNt content (mg/kg) in soil and DNt content as percent of Nt Soil layer
Factor
0–25 cm
25–50 cm
50–75 cm
75–100 cm
DNt (mg/kg) Factor I year Factor II dose of fertilizers
Factor III mode of fertilization
1989
72
1999
36
25
47
50
42
100
53
200
73
46
27
29
NPK
49
35
18
18
G1
53
36
22
20
G1+N
56
G2
50
32
19
20
G2+N
61
31
20
23
LSD = 4.7
43
LSD = 4.7
24 29
LSD = 9.0
LSD = 10.9
26 13
LSD = 3.0
17
27
LSD = 9.0
33
35
ns
16 18
30 11
LSD = 4.3
16 LSD = 5.8
20
ns
15 20
LSD = 8.2
21
ns
Interactions I/II; II/I I/III; III/I
ns
9.3; 12.7
6.0; 8.2
8.5; 11.6
10.5; 15.4
ns
ns
ns
ns
ns
ns
ns
II/III; III/II DNt content as percent of Nt Factor I year Factor II dose of fertilizers
Factor III mode of fertilization
1989
7.8
1999
5.9
25
7.7
50
6.1
100
6.7
200
6.9
9.6
10.4
9.2
NPK
8.6
9.4
7.5
6.6
G1
6.1
8.7
8.1
7.5
G1+N
6.2
G2
6.3
8.1
7.7
7.1
G2+N
7.0
7.9
7.6
7.5
LSD = 0.69
8.2
ns
8.7 8.0
LSD = 1.32
LSD = 1.59
7.8 8.3
7.6
ns
7.6 6.6
LSD = 1.60
8.0
ns
6.3 7.3
7.7 6.6
LSD = 1.01
6.2 LSD = 1.53
7.4
ns
6.0 7.2
LSD = 1.94
6.9
ns
Interactions I/II. II/I
1.37; 1.87
ns
ns
2.02; 2.75
I/III. III/I
1.54; 2.25
ns
1.77; 2.59
ns
ns
ns
ns
ns
II/III. III/II
on the kind and concentration of the extractant used (David et al. 1989, Zsolnay and Gorlitz 1994). In order to limit extraction of clay fraction and to get close with ionic strength to the one of pore water solutions of salts of divalent cations (for instance CaSO 4, NaNO 3, KCl, CaCl 2) of low PLANT SOIL ENVIRON., 52, 2006 (2): 55–63
concentration are applied for DOM extraction. The use of distilled water favors extraction of clay fraction, what in turn makes direct measurements (chromatography, spectrometry) of the solutions containing DOM difficult. Gonet et al. (2002) showed that after using borate buffer of pH = 7 61
Table 5. Average DNt content (mg/kg) in soil layers (cm) after two study periods Treatment
1989
1999
0–25
25–50
50–75
75–100
0–25
25–50
50–75
75–100
NPK1
71
43
27
20
22
20
9,9
10
NPK2
69
40
18
14
27
22
12
8.7
NPK3
68
47
22
38
18
24
16
8.8
NPK4
85
60
23
33
32
24
16
13
G(25)*
64
36
23
23
30
21
11
11
G(50)*
56
32
22
22
25
20
11
11
G(100)*
69
38
23
29
42
26
13
9.6
G(200)*
97
64
41
44
56
30
17
13
*average of four fertilization combinations (G1, G1+N, G2 and G2+N)
solutions containing amounts of DOC similar to its content in water extracts could be obtained. Such extracts carry much lower amount of clay fraction. However, calcium chloride is the compound most often used in DOM extractions. The content of DOM and DNt of soil samples fertilized with NPK and slurry in solutions obtained after extraction with 0.004 M CaCl2 (Debska 2004) was on average by 57 and 22% lower than the content of these fractions in borate buffer extracts, respectively. The relationship between amounts of DOC and DNt assessed in borate buffer and their concentration in 0.004M CaCl 2 solutions is described by the equations below: DOC (CaCl 2) = 0.548·DOC (buffer) – 1.96 r = 0.926 DNt (CaCl 2) = 0.856·DNt (buffer) – 0.194 r = 0.979 The amount of dissolved organic carbon extracted and the content of nitrogen in the extracts, independently from the extractant used, significantly correlated with concentration of organic carbon and Nt, respectively: – for borate buffer: DOC (mg/kg) = 14.7·TOC (g/kg) + 98.6 r = 0.798 DNt (mg/kg) = 62.5·Nt (g/kg) + 4.70 r = 0.880 – for 0.004M CaCl 2: DOC (mg/kg) = 9.55·TOC (g/kg) + 27.0 r = 0.876 DNt (mg/kg) = 54.6·Nt (g/kg) + 1.58 r = 0.873 While assaying dissolved organic matter in soils it is necessary to consider the fact that its absolute amount depends on the kind (properties) of the 62
extractant. Our results also indicate a possibility for parallel assessing the content of dissolved organic carbon and nitrogen in the extracts. The DNt parameter appears to be an important index of the quality of soil organic matter, especially because of potential losses of nitrogen connected both with its volatilisation and leaching down the soil profile. On the basis of experimental results it can be concluded: Under the conditions of fertilization and crop rotation of the experiment a significant increase of the mobile organic matter fraction was observed after the use of 100 and 200 m3 slurry per ha as compared with its content in soil after application only of NPK. Soil treatment with 200 m3 slurry per ha resulted in an increased concentration of this carbon fraction maintained as long as after 10 years. DOC concentration in soil layers lower than 50 cm did not depend on the kind of fertilizer (slurry, NPK). A comparison of the results of application of slurry and NPK indicated an increase of DNt concentration in the surface soil. DNt content in the 25–100 cm soil layer depended only on the dose of the fertilizer used. Therefore it can be assumed that fertilization with slurry is a decisive factor for the migration of organic carbon compounds down the soil profile, while compared with mineral fertilization did not increase the leaching of nitrogen compounds. The assessed amount of DOC and DNt in the extracts depends on the properties of the extractant used. Concentrations of DOC and DNt found after the extraction with of borate buffer of pH = 7 were higher as compared with extraction with 0.004M CaCl 2. PLANT SOIL ENVIRON., 52, 2006 (2): 55–63
REFERENCES Aoyama M., Kumakura N. (2001): Quantitive and qualitative changes of organic matter in an Ando soil induced by mineral fertilizer and cattle manure applications for 20 years. Soil Sci. Plant Nutr., 47: 241–252. Asmar F., Eiland F., Nielsen N.E. (1994): Effect of extracellular-enzyme activities on solubilization rate of soil organic nitrogen. Biol. Fert. Soils, 17: 32–38. Černý J., Balík J., Pavlíková D., Zítková M., Sýkora K. (2003): The influence of organic and mineral nitrogen fertilizers on microbial biomass nitrogen and extractable organic nitrogen in long-term experiments with maize. Plant Soil Environ., 49: 560–564. David M.B., Vance G.F., Rissing J.M., Stevenson F.J. (1989): Organic carbon fractions in extracts of O and B horizons from a New England Spodosol: Efects of acid treatment. J. Environ. Qual., 18: 212–217. Debska B. (2004): Properties of humic substances of soil fertilized with slurry. [Dissertation 110.] Univ. Technol. Agr., Bydgoszcz, Poland. (In Polish) Debska B., Gonet S.S. (2002): The effect of crop rotation, manuring and nitrogen fertilisers on the DOC content in soil. Fertil. Fertil., 1: 209–216. (In Polish) Einland F. (1981): Organic manure in relation to microbiological activity in soil. 16th Colloq. Int. Potash Inst. Agricultural Yield Potentials in Continental Climates, Warsaw: 137–146. Gonet S.S., Debska B., Zaujec A., Tobiasova E. (2002): Properties of humus from soils incubated with post-
harvest residues. In: Proc. 11th IHSS Meet., Boston: 345–347. Hadas A., Feigenbaum S., Sofer M., Molina J.A.E., Clapp C.E. (1993): Decomposition of nitrogen-15 labelled wheat and cellulose in soil modeling tracer dynamics. Soil Sci. Soc. Am. J., 57: 996–1010. Mackowiak Cz. (1994): Principles of slurry utilization. Recommendations for fertilization. IUNG, Pulawy. (In Polish) Mackowiak Cz. (2000): Comparison of fertilization capacity of slurry and mineral fertilizers. Fertil. Fertil., 4: 110–118. (In Polish) Mazur T., Budzynska D. (1994): Nitrogen leaching from soil fertilized with animal slurry, manure and NPK. Pol. J. Soil Sci., 37: 151–157. McKenney D.J., Wang, S.W., Drury C.F., Findlay W.I. (1993): Denitrification and mineralization in soil amended with legume grass and corn residues. Soil Sci. Soc. Am. J., 57: 1013–1020. Periago L.E., Delgado A.N., Diaz-Fierros F. (2000): Groundwater contamination due to cattle slurry: modelling infiltration on the basis of soil column experiments. Water Res., 34: 1017–1029. Reinersten S.A., Elliott L.F., Cochran V.L., Campbell G.S. (1984): Role of available carbon and nitrogen in determining the rate of wheat straw decomposition. Soil Biol. Biochem., 16: 459–464. Zsolnay A., Gorlitz H. (1994): Water extractable organic matter in arable soil: Effects of drought and long-term fertilization. Soil Biol. Biochem., 26: 1257–1261. Received on January 17, 2005
Corresponding author: Prof. dr. hab. Slawomir S. Gonet, Nicolaus Copernicus University, Department of Soil Science, 30 Sienkiewicza St., 87-100 Torun, Poland e-mail:
[email protected]
PLANT SOIL ENVIRON., 52, 2006 (2): 55–63
63