Digital Image Processing for Pavement Distress Analyses Egemen Teomete Department of Civil, Construction and Environmental Engineering Iowa State University 192 Town Engineering Building Ames, IA 50011
[email protected] Viren R. Amin Center for Nondestructive Evaluation Iowa State University 283 ASC II Ames, IA 50014
[email protected] Halil Ceylan Department of Civil, Construction and Environmental Engineering Iowa State University 482B Town Engineering Building Ames, IA 50011
[email protected] Omar Smadi Center for Transportation Research and Education Iowa State University 2901 South Loop Drive, Suite 3100 Ames, IA 50011
[email protected]
ABSTRACT Local agencies have to collect distress data of their network system for building and implementing pavement management programs. Data collection for the whole network is expensive, time consuming, and dangerous, if pursued by traditional field surveys. Developments in computer technology, digital image acquisition, and image processing allow local agencies to use digital image processing for pavement distress analyses. In this project, pavement images obtained from the Long-Term Pavement Performance Program (LTPP) are used to detect horizontal and vertical cracks, crack lengths, and severity. The results are favorable for many images. Further development of the technique may allow adaptation to additional conditions in the images, such as more types of cracks, lane markings, etc. Key words: digital image processing—pavement distress analyses
Proceedings of the 2005 Mid-Continent Transportation Research Symposium, Ames, Iowa, August 2005. © 2005 by Iowa State University. The contents of this paper reflect the views of the author(s), who are responsible for the facts and accuracy of the information presented herein.
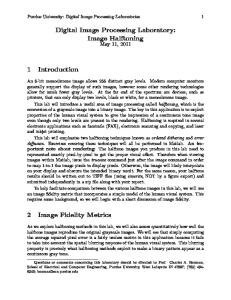
PROBLEM STATEMENT Local agencies have to collect distress data of their network system for building and implementing pavement management programs. Data collection for the whole network is expensive, time consuming, and dangerous, if pursued by traditional field surveys. Every year, $17 billion are spent for pavement maintenance in the United States. The limited budget of local agencies with respect to the financial weight of data collection forces them to implement automated distress survey methods. The developments in computer technology, digital image acquisition, and image processing allow local agencies to use digital image processing for pavement distress analyses (McGhee 2004). In the literature, different techniques are presented for crack detection, identification, and severity determination. These techniques generally use image processing and pattern recognition techniques together to enhance the image and to get the related information from the image. Chan et al. (1992) used statistical data of the image, such as mean, standard deviation, and variance, to detect cracks and their types. A vertical and horizontal projection histogram of the image is used to get the vertical and horizontal shape factors, and by using other statistical data obtained from the image, a crack detection algorithm was developed. The developed algorithm has a reliability of 70% and 60% for asphalt concrete pavement (ACP) and a seal coat surface, respectively, while 70% accuracy is obtained for continuously reinforced concrete pavement (CRCP). The algorithm has problems detecting multiple cracks in one image and in detecting longitudinal cracks in ACP because of wheel path noise. Cheng and Miyojim (1998) worked on enhancing the pavement image by removing non-uniform illumination. Thresholding and skeletonization are applied. The number of longitudinal, transverse, and diagonally oriented pixel pairs are obtained and put into a fuzzy classification system to obtain crack type. The authors claim 100% accuracy to be obtained on 42 images. Wang (2004) applied stereovision to detect other distresses, such as rutting or faulting, that need the definition of 3D morphology. His research is in progress. RESEARCH OBJECTIVES In this project, pavement images obtained from the Long-Term Pavement Performance (LTPP) program are used to detect horizontal and vertical cracks, crack length, and severity. The developed algorithm mainly has three parts: pre-process, detection, and post-process algorithms. The results are favorable for many images. Further development of the technique may allow adaptation to additional conditions in the images, such as more types of cracks, lane markings, etc. RESEARCH METHODOLOGY Chan et al. (1992) developed algorithms for ACP and CRCP pavement crack detection. Four types of cracks were detected: longitudinal, transverse, block, and alligator. Images were subdivided into 48x48pixel blocks and vertical and horizontal projection histograms were applied, as presented in Figure 1.
Teomete, Amin, Ceylan, Smadi
2
Figure 1. Horizontal and vertical projection histogram For demonstration purposes, only a 4x4-pixel block was used in Figure 1. The average of the pixels in each row was subtracted from 255 and recorded as a horizontal histogram and than smoothed with a running average of 2 pixels (in the main system, a 7-pixel running average is used: 3 pixels previous, 3 pixels after, and 1 pixel itself). The mean of the sub-block is calculated. Spread is found as the number of pixels greater than the mean, around peak. This is shown graphically on the right in Figure 1. The shape factor is calculated in Equation 1.
ShapeFactor =
( peak − meanofblock ) spread
(1)
The same calculations are applied for the vertical histogram. The horizontal shape factor is 32, while the vertical shape factor is zero. The comparison of shape factors leads us to the conclusion that the block has a horizontal crack. Chan et al. (1992) compared the shape factors with respect to each other and to a threshold value. Thus, if the horizontal shape factor is greater than the vertical shape factor and the threshold, there is horizontal cracking, and vice-versa for vertical shape factors. A projection histogram technique is used in this work with many modifications to detect crack type. Other techniques are used to enhance the input image and to detect crack length and severity in post-processing. These techniques will be presented in the following sections.
Teomete, Amin, Ceylan, Smadi
3
Data from LTPP Images LTPP is a project of the Federal Highway Administration (FHWA), and consists of a database including 2,400 pavement sections in the United States and Canada. Climatic, structural, and traffic load data for these pavement sections have been collected periodically. Images of pavement sections were collected using 35-mm film and digitized (Elkins 2003). One pavement section is 150 meters long and is represented by 23 digital images. The digital images are 2048x3072 pixels in dimension. An example is shown in Figure 2.
Figure 2. Original image from LTPP database The images include different types of cracks, noise, lane markings, oil stains, illumination problems, and patches. Each of them is a challenge to work on. The 256x256 pixel images that have only one type of crack were cropped for this project. See Figure 3 for an example.
Figure 3. Cropped image (256x256) Twelve cropped images having high-severity to low-severity cracks were prepared. All images have vertical cracks, and the algorithm may rotate the image before processing to generate horizontal cracks. Software Design The algorithms were developed in the MatLab programming environment. The software consists of one m file that reads the image and call functions with other m files.
Teomete, Amin, Ceylan, Smadi
4
A block diagram of the software is presented in Figure 4. From begin.m, the image is sent to preprocess.m, where contrast stretching and thresholding is applied. The image is sent to morf.m to remove noise using morphological operations. The returning data is an enhanced image. The enhanced image is sent to detect2.m, where the modified projection histogram technique is applied. Vertical and horizontal shape factors and spreads are calculated and used to characterize a crack. The output of detect2.m is processed in function postprocess.m to identify crack type, length, and severity.
Begin.m
Function Preprocess.m
Function Morf.m
Function Detect2.m
Function Postprocess.m
Figure 4. Software block diagram To be clearer, the functions and their intermediate results will be presented with an example. Begin.m m file As shown in Figure 4, begin.m provides the structure for the program. begin.m reads the images and calls the functions preprocess.m, detect2.m, and postprocess.m. No calculations are done in the script. All the images used in development are of vertical cracks. To test horizontal cracks, an option can be selected to transpose the image array, as seen in Figure 5. The image is sent twice to preprocess.m, once with the image and once with the image transposed. The result of the first call is an enhanced image that is said to favor horizontal. The second result is transposed upon receipt to preserve proper orientation, and is said to favor vertical. Figure 6 displays this. The reason for these favored directions is explained in section morf.m.
Figure 5. Vertical crack and horizontal (transposed) crack
Teomete, Amin, Ceylan, Smadi
5
Figure 6. Enhanced image, favoring horizontal (left), favoring vertical (right) The next step within begin.m is to select the sub-block size in pixels used in the projection histogram technique. This size is sent along with an enhanced image to detect2.m. Because there are two enhanced images, favoring horizontal or vertical, there are two calls to detect2.m. The result of this step is two color images that characterize the crack of the original input image. See Figure 7. They are obtained with a modified version of the projection histogram technique. Again, the first resulting image favors horizontal and the second favors vertical.
Figure 7. Results of modified projection histogram technique The last step in the algorithm is postprocess.m. Here, crack type, length, and a measure of severity are calculated. An image, seen in Figure 8, showing the calculated size and shape of the crack is also produced. These are the primary products of the project.
Figure 8. Identified crack with thinned line for finding crack length Function Preprocess.m The input to this function is an image and the output is an enhanced binary image ready for detect2.m. Contrast stretching is applied to the image by using the p-code intrans.p of the DIPUM book. The intrans.p uses Equation 2 for contrast stretching (Gonzalez et al 2004).
Teomete, Amin, Ceylan, Smadi
6
s = T (r ) =
1 E 1 + (m r )
(2)
The gray scale of the image is scaled to [0 1] and the m is determined as 0.1 minus the mean of the image. The slope of the curve is determined by E, which is taken as 50. The values of these parameters have been determined by trial and error. A thresholding value of 230 is used to produce a binary image. The image is outsourced to function morf.m, described below, where the noise is reduced. The result obtained after running this function is presented in Figure 9. The output of morf.m is passed unchanged as the output of preprocess.m. Input Image
Stretched Image
Thresholded Image
After Morph. Ops
Figure 9. Result of the preprocess.m function
Function Morf.m The morphological operations consist of a series of closing and opening operations with a horizontal line element of varying length. The input to this function is a binary image and the output is a binary image with less noise. The initial task is to compliment the image. The first operation is closing using a medium-sized structural element and opening with a slightly smaller element to restore the remaining objects. The goal is to remove the small, single-pixel noise. Another closing-opening operation is performed with larger structural elements. This step removes most of the remaining noise.
Teomete, Amin, Ceylan, Smadi
7
However, the pixels that hopefully represent the crack are joined in the process. To retain only the original pixel data, the morphological result is multiplied with the binary input to the function. The pixels are again complimented to return to a black and white image. A sample of results of morf.m is shown in Figure 10.
Compliment of Input Image
Closing
Opening
Closing
Opening
Compliment
Figure 10. Results of morphological operations The contrast stretching of preprocess.m and morphological operations performed in morf.m give clear images that have less background noise. The result of morf.m is said to favor horizontal. This is because much of the information characterizing a vertical crack will be removed. A horizontal crack will have nearly all of its pixels retained. To get favorable results with a vertical crack, the image must be rotated 90° or transposed. Function detect2.m The detect2.m function is the backbone of the software as it evaluates the projection histograms and gives an output of shape factors and spreads. The input to this function is a preprocessed image and the size of sub-blocks. Sequentially, the algorithm works in the following way: 1. The algorithm determines the maximum number of sub-blocks and truncates the image to ensure an integer number of sub-blocks are used. 2. The image is divided into sub-blocks. 3. Within each block, the algorithm calculates the horizontal and vertical spread and shape factor.
Teomete, Amin, Ceylan, Smadi
8
4. The algorithm creates a color image for visualization of each sub-block: red for the horizontal spread and shape factor, and blue for the vertical spread and shape factor. The stripes represent the spreads and the stripe color intensity reflects the shape factor. Figure 11 shows an example. 5. The algorithm combines color visualizations into a full-sized composite image. See Figure 12. Spreads
Figure 11. Visualization of spread and shape factor for a single sub block
Figure 12. Results of detect2.m: favoring horizontal and favoring vertical There are two preprocessed images. Therefore, detect2.m is called twice. Two color images are obtained. The first favors horizontal and the second favors vertical. Function Postprocess.m The decisions are made in postprocess.m. However, the first steps are additional processing of the color images. The values of the red channel of each pixel are summed for the image that favors horizontal. Likewise, the values of the blue channel are summed. The crack type is determined by these sums. If the red sum is higher, the crack is horizontal. If the sum of the blue channel is higher, a vertical crack is present. This is the first and simplest product of the project. The postprocess.m function next takes the winning channel, red if horizontal or blue if vertical, and thresholds. The resulting binary image is input to the MatLab function bwlabel(). This function identifies connected groups of pixels and labels them sequentially from 1 to n. The background is set to zero. These groups are further processed one by one. Each group is thinned using bwmorph(), which removes pixels around the edges of the group until a line width of one pixel remains. The number of pixels in this line is also the length of the line. This value is used as the length of the crack. This is another product of the algorithm.
Teomete, Amin, Ceylan, Smadi
9
The area of each group of connected pixels is found with MatLab’s find() and numel() functions. This area is divided by the crack length to find the average thickness of each group. This can be interpreted as a measure of the severity of a crack. This is the final numerical product, as seen below. VertCrop\190101i20021017_11V10.JPG Crack Type: Horizontal IDnumber Length Area Severity 1 241 3438 14.266
A visual output, which represents the shape and area of the image covered by the crack, is produced by displaying all groups of connected pixels. For visualization purposes, the thinned line used to find the crack length is included as a black line within each group. See Figure 13.
Figure 13. Visualization of crack shape and area and thinned line used for length calculation GUI: Crevas The algorithm developed above was implemented with a graphical user interface with the aid of MatLab’s guide. The user interface was kept simple, requiring only the selection of an image from a list and an option to transpose the image to analyze a horizontal crack. This GUI is displayed in the following section. See the images there for a visualization. KEY FINDINGS For many images, the results of the algorithm are encouraging. However, some images caused poor performance. The reason for this, in many cases, is elusive. In Figure 14, the program takes an image with a thick crack and returns a strong response. The shape of the detected crack matches the crack in the input image very well. The numerical output is as follows. VertCrop\190101i20021017_11V10.JPG Crack Type: Horizontal IDnumber Length Area Severity 1 241 3438 14.266
Teomete, Amin, Ceylan, Smadi
10
Figure 14. Strong, thick, single crack The algorithm is able to find more than one crack, giving numerical statistics for each. The numbers calculated for Figure 15 are favorable results. In particular, note the length of the cracks. VertCrop\190101i20021017_03V1.JPG Crack Type: Vertical IDnumber Length Area Severity 1 135 1602 11.867 2 65 576 8.8615
Figure 15. Strong, intermittent crack While the roadway marking surprisingly causes little noise, the algorithm is very sensitive to noise that the human eye does not perceive as significant. See Figure 16. Below is the numerical output for this image. Note that the largest value in the length column corresponds to the actual crack of the input image (IDnumber 5).
Teomete, Amin, Ceylan, Smadi
11
VertCrop\190103i20021017_02V3.JPG Crack Type: Vertical IDnumber Length Area Severity 1 141 1062 7.5319 3 190 1998 10.516 5 264 3186 12.068 8 117 1080 9.2308 9 154 1566 10.169 10 27 360 13.333 11 27 342 12.667 13 118 936 7.9322 14 100 1134 11.34 15 39 972 24.923 18 261 2448 9.3793 21 30 234 7.8 23 48 468 9.75 24 28 324 11.571
Figure 16. Strong crack, but noisy results SUMMARY AND CONCLUSION In this paper, we have taken the projection histogram technique developed by Chan et al. and made several modifications that improve its performance. Pavement images from the state of Iowa, supplied from LTPP/FHWA, were used in this study. Before using the technique, the images were preprocessed by binerization and morphological operations. Modifications to the technique allow more accurate characterization of the crack. Post processing allows detection of multiple cracks and the calculation of length and average width, which can be a measure of a crack’s severity. The current algorithm performs very well for many images. In almost all cases, the crack in the input is detected in the output. There are cases, however, for which noise causes false detections. These false cracks can be large in number and cause unacceptable clutter in the numerical results and the output image. Further work focuses on two areas: improving the current algorithm and changing detection techniques to be able to detect distresses from whole images with high accuracy.
Teomete, Amin, Ceylan, Smadi
12
ACKNOWLEDGMENTS The authors would like to thank to John Rush from LTPP/FHWA for providing the Iowa pavement images. REFERENCES Chan, P., L.L. Rao, and R.L. Lytton. 1992. Development of Image Algorithms for Automated Pavement Distress Evaluation System. FHWA Report TX-92/1189-2F. TX: Texas Transportation Institute, Texas A and M University. Elkins, G.E., P. Schmalzer, T. Thompson, and A. Simpson. 2003. Long-Term Pavement Performance Information Management System: Pavement Performance Database User Reference Guide. FHWA –RD-03-088. VA. Gonzalez, C.R., R.E. Woods, and S.L. Eddins. 2004. Digital Image Processing Using MATLAB. Beijing: Prentice Hall. H. D. Cheng and M. Miyojim 1998. Novel System for Automatic Pavement Distress Detection. Journal of Computing in Civil Engineering 12.3. McGhee, K.H. 2004. Automated Pavement Distress Collection Techniques. NCHRP Synthesis 334. Washington, DC: Transportation Research Board, National Research Council. Wang, K.C.P. 2004. Automated Pavement Distress Survey through Stereovision. Final Report for Highway IDEA Project 88. Washington, DC: Transportation Research Board, National Academies.
Teomete, Amin, Ceylan, Smadi
13