Dietary surveys in risk assessment Data challenges to improve dietary exposure assessment
Senior Adviser Sisse Fagt, National Food Institute, Technical University of Denmark
Long tradition of Danish nationwide dietary surveys Surveys in 1985 (adults) and 1995 (children and adults)
DAnish National Survey of Diet and physical Activity (DANSDA)
• 4-75 y: 2000-2002, 2003-2008 and 2011-2013 – 12000 participants, simple random sample – Participation rate 54% (2011-13) – One week of recording – >160.000 eating occasions (2011-13) • ½-3 y: 2006-2007 and 2014-2015 – 3000 participants, simple random sample in 5 age intervals – Participation rate 54% (2006-07) – One week of recording – >65.000 eating occasions (2014-15) DTU Food, Technical University of Denmark
Sisse Fagt, November 30th 2017
DANish Survey on Diet and Physical Activity (DANSDA)
AIM of DANSDA • Monitor intake of foods and nutrients to identify nutrition- and health- related problems in risk groups
• Perform research on associations between diet, physical activity and health
• Estimate dietary exposure of contaminants, food additives, pesticide residues etc.
•
Analyze determinants of dietary habits and physical activity
DTU Food, Technical University of Denmark
Sisse Fagt, November 30th 2017
Interdisciplinary team Nutritionists, dieticians, food scientists, sociologists, data managers in close collaboration with statisticians, chemists, toxicologists and microbiologists.
Social science in combination with natural science keep us asking the right questions: • ”Is it possible for participants to answer the questions precisely ?” • ”Will the type and number of questions raise the respondent burden ?”
• ”Will we get valid answers?” DTU Food, Technical University of Denmark
Sisse Fagt, November 30th 2017
Continuously development and improvements • Continuously development and improvement of survey design and assessment methods • Increased use of dietary survey in risk assessment, but also ad hoc surveys in special groups • More details about foods • Increasing participation rate through change of design
• Participants feedback (focus group interviews) to improve future survey design and assessment methods
• Risk assessors of non-nutrients are asked about their needs before data collection DTU Food, Technical University of Denmark
Sisse Fagt, November 30th 2017
Merging of consumption data and data from chemical analysis – Continuously analyses for chemical contaminants and pesticide residues for control purposes which also to a large extent fulfil the need for monitoring – (no of samples 2.000-2.500/year)
Challenge – Not consumption data for all analysed foods
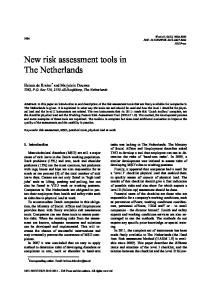
Summary of the 2016 Data Collection on Contaminant Occurrence Data. Number of reported data normalised by the country population
– We eat composite foods, but content often determined in raw product DTU Food, Technical University of Denmark
Sisse Fagt, November 30th 2017
The dietary questionnaire (pre-coded food diary) Dietary questionnaires cannot be specific on all foods eaten
– Too many questions (burden of participants) – Not enough knowledge about foods eaten
Need for combining different sets of data
DTU Food, Technical University of Denmark
Sisse Fagt, November 30th 2017
Dietary surveys 2000-2013 - use of other data sets Household panel/GfK/sales/market data
Recipes
Distribution between breakfast cereals, types of cheeses etc. (brandname, packaging size, distributor)
Database of recipes Distribution between types of fish: cold/hot smoked salmon, canned/fresh etc. (WHO, EU, governmental bureaus)
Exposure assessment of non-nutrients: Adjustment of data so food consumption data fit analytical data or vice versa DTU Food, Technical University of Denmark
Sisse Fagt, November 30th 2017
Average intake of foods aggregated/disaggregated (foods fit level of analysed data)
Average intake of foods per day or per meal
Individual level for performing probabilistic calculations
Group level (age, sex): Average intake of foods aggregated/disaggregated (foods fit level of analysed data).
Group level (age, sex): Average intake of foods
DTU Food, Technical University of Denmark
Increasing complexity in data retrieval
Examples of dietary data used in risk assessment of non nutrients
Chicken and salad at the same meal (cross contamination salmonella)
Foods with added sorbic acid e.g. fruit juice
Foods with added waxes Packaged foods (food contact materials) Meat products with added nitrite Smoked salmon or brown rice Salmon or rice
Sisse Fagt, November 30th 2017
Future 2014- : Web based technology
• More details on specific foods or facets about food preparation • Possible to ask more questions, but still limitations on level of details due to participants burden and knowledge
• Continuation of combining different data sets (more value for money) Validation study
• 2 x 24 h recall (recommended by EFSA) vs. 7 d pre-coded food diary (DANSDA) Future dietary surveys will provide more detailed food consumption data beyond nutritional aspects – enables better exposure risk assessment
DTU Food, Technical University of Denmark
Sisse Fagt, November 30th 2017
Thank you The interdisciplinary team behind DANSDA Jeppe Matthiessen, Anja Biltoft-Jensen, Ellen Trolle, Karin Hess Ygil Karsten Kørup, Tue Christensen, Sisse Fagt
DTU Food, Technical University of Denmark
Sisse Fagt, November 30th 2017