Development Economics Lecture 1 Anne Mikkola Partly using slides of Prof. Haaparanta
REQUIRED READINGS (preliminary) �
Debraj Ray (1998): Development Economics. Chapters 1-11.
�
Lecture notes Follow the course webpage as the course proceeds: http://www.valt.helsinki.fi/blogs/mikkola/post50.htm
Check the course binder at the department office of materials.
1
Other material used as a basis for lectures �
Charles I Jones (2002): Introduction to Economic Growth. Used in class on growth theories.
�
David N. Weil (2005): selected chapters covered in class
---------------------------------------------William Easterly (2001): The Elusive Quest for Growth. Economists’ Adventures and Misadventures in the Tropics.
�
�
Jeffrey Sachs (2005): The End of Poverty. Economic Possibilities of our time
�
Anne Mikkola – Carrie Miles (2007): Development and Gender Equality: Consequences, Causes, Challenges and Cures HECER Discussion Paper, No. 159. (downloadable from internet)
�
Exams
Dec and Jan options + faculty exam in the Spring for Univ. students.
2
What is development?
TOPICS (preliminary) 1. Development Economics: Overview (Ray, Chp. 1-2) 2. Economic Growth theories and empirical evidence: Why are some countries rich and others poor? (Ray Chps 3-4) 3. Population Growth, fertility and changing role of women in development (Ray Chp. 9, Mikkola, and/or Weil Chp. 4-5) 4. History, Expectations, Government, Culture and Development (Ray Chp. 5; Weil, Chp 12, 14) 5. Poverty and its functional impacts (Ray Chp. 8) 6. Inequality : Measuring inequality; Interconnections of Inequality and development (Ray Chp. 6-7) 7. Rural-urban interaction and migration and agriculture (Ray Chp. 1011)
3
Overview Why development economics? � World marching by: need for development � Measuring development � What is the development? � Solutions? � History of income growth �
Why development economics as a separate field of study? � � � � �
Many markets missing: labor, financial, insurance Institutions and public infrastructure may be missing: property rights, laws, transportation Development taking place when there is a developed world elsewhere: aid dependency, technology transfer. Speed of development differs from European experience (medical innovations, directly to the mobile phones) History of colonialism
4
GDP per capita in year 2000, USD, PPP exchange rates Source: David Weil: Economic Growth, 2005
Poverty The total number of people in extreme poverty has been reduced during the last decade. � The situation has improved basically because poverty has been reduced in South and East Asia. � Poverty has increased in Sub-Saharan Africa and Central Asia. � Poverty at household level. View from history: expenditure on food and basic necessities only. �
5
6
What happened in the developed countries? Technological changes (over the past 200 years) � � �
industrialization, specialization in the market production out of the household household technology. �
� �
Engines of liberation (of women). Greenwood et al, RES,2005
changing role of children declining fertility, falling mortality, longer lives, and rising population
Self-sufficient economies: clothing from farming to garment, food preparation from fields to bread, water, heating
7
Industrialization 1: Men leave homes, separate spheres of life for men and women
Industrialization 2: • Servants leave as homework reduces • not so many children needed (quantity to quality)
8
Industrialization 3: • Children bring utility rather than production services • Women’s work and its significance reduced Greenwood (2005): In the US, meal preparation, laundry, cleaning took 58 hours per week in 1900, 18 hours in 1975.
• Men’s work get valued monetarily (statistics measure) => Changes in the bargaining power within families
Industrialization 4: � Women to the labor market (and men’s towards home). � need for changing roles of women � ‘engine of liberation’
� Sexual division of labor starts to fall apart
9
Growth theories that we will study �
� �
were developed to explain the steady growth experience coinciding with the 200 years of western development. empirical data on incomes values only market based work. We will study these models, but it is good to keep in mind how and why they were developed.
Measuring development What do we mean by development? � Operational definitions: �
� Millenium Development
Goals (MDG’s) (to be
achieved by 2015) � Human Development Index (HDI): achievement of the goals or improvement in the index is a measure of development.
10
� 1. 2. 3. 4. 5. 6. 7. 8.
MDGs by the UN Eradicate extreme poverty and hunger. Achieve universal primary education. Promote gender equality and empower women. Reduce child mortality. Improve maternal health. Combat HIV/AIDS, malaria, and other diseases. Ensure environmental sustainability. Develop a global partnership for development.
�
HID Index, published by UNDP since 1990, is based on 3 measures of quality of life
1.
Life expectancy at birth (index of long and healthy life) (2/3) adult literacy rate + (1/3) (secondary and tertiary gross enrollment ratio) (index of knowledge) GDP/capita (index of a decent standard of living).
2.
3.
11
Amartya Sen: Development as Freedom (also a book by that name) �
We should look at people’s capabilities, i.e. their abilities and possibilities to live good life, make choices on one’s education, economic activities, freedom to participate in decision making. Avoiding starvation and premature death valued for their own sake. ⇒ development as freedom.
�
In the standard textbook economics many of these freedoms are assumed from the start. This is often not the case in developing countries, particularly for the women.
� Higher income, ceteris paribus, allows wider set of choices. �
Role of political freedoms.
“Least Livable” Countries by HDI, 2004 1.
Sierra Leone
16.
Tanzania
2.
Niger
17.
Benin
3.
Burkina Faso
18.
Guinea
4.
Mali
19.
Rwanda
5.
Burundi
20.
East Timor
6.
Guinea-Bissau
21.
Senegal
7.
Mozambique
22.
Eritrea
8.
Ethiopia
23.
Gambia
9.
Central African Republic
24.
Djibouti
10.
Congo, Dem. Rep. of the
25.
Haiti
11.
Chad
26.
Mauritania
12.
Angola
27.
Nigeria Madagascar
13.
Malawi
28.
14.
Zambia
29.
Yemen
15.
Côte d’Ivoire
30.
Kenya
12
“Most Livable” Countries by HDI, 2004 1.
Norway
16.
France
2.
Sweden
17.
Denmark
3.
Australia
18.
New Zealand
4.
Canada
19.
Germany
5.
Netherlands
20.
Spain
6.
Belgium
21.
Italy
7.
Iceland
22.
Israel
8.
United States
23.
Greece
9.
Japan
24.
Singapore
10.
Ireland
25.
Portugal
11.
Switzerland
26.
Slovenia
12.
United Kingdom
27.
Korea, South
13.
Finland
28.
Barbados
14.
Austria
29.
Cyprus
15.
Luxembourg
30.
Malta
Income is not everything �
Even though Sub-Saharan economies have not grown, they have advanced in many other respects (showing in HDI-indices as well). � expected
life-times at birth have increased, literacy rates have increased � better education � adult
�
The impacts of HIV/AIDS can be seen clearly (Zambia, Botswana).
13
What do these tell about the concept of development and problems of development? �
�
Development is seen as an improvement in incomes (and eradication in poverty), health, education, equality in incomes (both locally and globally), achievement of gender equality, and good environment. Problems in achieving development are seen as interlinked: low incomes go together with low education and high inequality, etc.
But what is the nature of linkage? Why are income levels and income inequality related? Or are they? � What do we mean by income, inequality, and poverty? � What type of policies are needed to achieve the goals? Does aid work? Does debt reduction help? What is the role of national policy making? �
14
Solutions? �
Easterly (2001): economists’ failed attempts decade after decade to help Africa to growth path � � � � �
�
investments on machines etc. � failure to produce education population control lending � debt problem debt forgiveness
Jeffrey Sachs (2005): end the poverty by increasing aid. � ‘Do
it all at once through the UN’
Some issues/problems with aid � �
multilateral vs. bilateral budget support vs. project aid �
�
�
NGO:s: ’alms bazaar’ � � �
�
project aid: creates competition for projects and between projects rather than gives incentives to develop the country � mutual benefits to keep projects running (jobs, funding for our group) budget support: how to prevent corruption or to avoid favoring the elite or certain ethnic group (compare Peter Uvin: Aiding Violence). Are the services delivered or do the funds disappear on the way? mutual interest keep projects running NGOs’ pursuing their agendas vs host country interest NGOs compete for government officials, the same educated people
Religious organisations �
’working for God’ (Ritva Reinikka, WB): religious organisations more effective than others, as they are more committed to the local communities.
15
Growth of income in the history - what do we learn? �
Long run development of GDP per capita reveals interesting aspects of development
Source for the figures is A. Maddison: The World Economy, Historical Statistics, OECD. The figures are US 1990 dollars at PPP exchange rates.
Year
Egypt
Sahel & W- A
Tanzania
Taiwan
Nepal
L-A
Mexico
Brazil
Finland
UK
1500
475
415
416
425
451
714
1700
475
415
527
568
638
1250
1820
475
415
692
759
646
781
1707
1366
678
1668
4450
1900
499
902 (1913)
550 (1870)
397
539 (1913)
1950
910
424
924
496
2356
1672
4253
6939
1960
991
459
1492
607
3155
2335
6230
8645
1970
1254
567
2980
653
4320
3057
9577
10767
1980
2069
593
5869
637
6289
5198
12949
12931
1990
2522
540
9886
808
6119
4923
16866
16430
2000
2920
524
16642
999
7218
5556
20235
19817
16
What do we learn from this? 1. by around 1500 income levels were quite equal around the world (with the exception of UK). 2. by 1700 the situation had changed: Latin America (North America also, US income 527 $ by 1700, Canada 800 $ for European immigrants, 400 $ for indigenous people) and Europe. The most dramatic increase in income in UK.
3. from 1800 on Europe (and North America) have grown much faster than other regions reaching very high relative incomes by 2000.
4. incomes in some other areas have also grown. E.g. Latin America and Egypt. The most dramatic change has taken place in South East Asia (example here is Taiwan. Earlier, Japan started to grow by late 1800’s).
5.
not all Asia has experienced sustained income growth: e.g. Nepal, though during the last two decades it has started to grow.
6.
the most serious trouble spot is Sub-Saharan Africa (presented here through Tanzania). Tanzania grew during the first decade of its independence, then growth first slowed down and finally stopped completely. A case of a “development trap”?
17
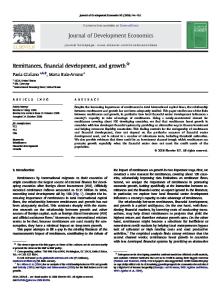
7. Many poor countries have experienced a decline in incomes also at least temporarily since 1970: here Brazil, Nepal and Tanzania. 8. All in all, “great divergence” in incomes at least since early 1800’s. How to explain the divergence and the diversity in individual country experiences? � South-Korea
and Tanzania had equally high incomes in 1960, but now South Korea is many times richer. Why?
The divergence of the rich and the poor Graph by Prof. Pertti Haaparanta
18