Developing ERP Systems Success Model for the Construction Industry BooYoung Chung1; Mirosław J. Skibniewski2; and Young Hoon Kwak3 Abstract: Recently, a significant number of major construction companies embarked on the implementation of integrated information technology solutions such as enterprise resource planning 共ERP兲 systems to better integrate various business functions. However, these integrated systems in the construction sector present a set of unique challenges, different from those in the manufacturing or other service sectors. There have been many cases of failure in implementing ERP systems in the past, so it is critical to identify and understand the factors that largely determine the success or failure of ERP implementation in the construction industry. This paper presents the process of developing an ERP systems success model to guide a successful ERP implementation project and to identify success factors for ERP systems implementation. The paper identifies factors associated with the success and failure of ERP systems, and develops a success model to analyze the relationships between key factors and the success of such systems. The proposed ERP systems success model adapts the technology acceptance model and DeLone and McLean’s information systems success model and integrates those with key project management principles. The goal of the ERP systems success model is to better evaluate, plan, and implement ERP projects and help senior managers make better decisions when considering ERP systems in their organization. DOI: 10.1061/共ASCE兲0733-9364共2009兲135:3共207兲 CE Database subject headings: Construction management; Construction industry; Models.
Introduction Traditionally, the construction industry has been faced with the problems of meeting project schedule, budget, and specifications set by the owner and architect/engineer. The proper utilization of internal and external resources is essential if construction companies are to make the best business decisions, maximize business goals, and survive in the competitive environment 共Shi and Halpin 2003兲. Although the construction industry is one of the largest contributors to the economy, it is considered to be one of the most highly fragmented, inefficient, and geographically dispersed industries. To overcome this inefficiency, a number of solutions have long been offered including adaptation of information technology 共IT兲 and information systems 共IS兲. Recently, major construction companies embarked on the implementation of integrated IT solutions such as enterprise resource planning 共ERP兲 systems to better integrate their various business functions, particularly those related to accounting procedures and practices. However, implementing these integrated
1
Principal Researcher, U-City Center of Excellence, Samsung SDS Co., Ltd., 159-9 Gumi-dong, Bundang-gu, Seongnam-si, Gyeonggi-do, Korea. E-mail:
[email protected] 2 A. J. Clark Chair Professor in Project Management, Dept. of Civil and Environmental Engineering, A. J. Clark School of Engineering, Univ. of Maryland, College Park, MD 20742. E-mail:
[email protected] 3 Associate Professor of Project Management, Dept. of Decision Sciences, School of Business, George Washington Univ., Washington, DC 20052. E-mail:
[email protected] Note. Discussion open until August 1, 2009. Separate discussions must be submitted for individual papers. The manuscript for this paper was submitted for review and possible publication on February 13, 2008; approved on September 16, 2008. This paper is part of the Journal of Construction Engineering and Management, Vol. 135, No. 3, March 1, 2009. ©ASCE, ISSN 0733-9364/2009/3-207–216/$25.00.
systems in the construction industry presents a set of unique challenges, different from those in the manufacturing or other service sectors. In general, the best way to achieve the full benefits from ERP systems is to make minimal changes to the software. Each construction project is characterized by a unique set of site conditions, project team, and the temporary nature of relationships between project stakeholders. As a result, construction companies are required to have extensive customization of preintegrated business applications from the vendors of ERP systems. Unfortunately, such extensive customizations result in a greater challenge in implementing ERP systems. Therefore, finding the best ERP systems implementation strategy is needed to maximize the benefits of such integrated IT solutions for construction companies. The main objective of this paper is to present guidelines for ensuring successful ERP systems implementation and providing factors associated with the success of ERP systems in engineering and construction firms. To do so, the paper identifies factors affecting the success or failure of ERP systems, and develops an ERP system success model to analyze the relationships between factors and the success of such systems. Two primary research questions are asked to address the research objectives: 共1兲 what are the factors affecting the success or failure of ERP systems implementation; and 共2兲 how can we define the success of ERP implementation? This study proposes an ERP system success model and validates the model by using relevant data. This study follows a three-phase approach to develop ERP systems success model, as shown in Fig. 1. In Phase I, the conceptual ERP success model was developed based on well established IS/IT theories and recommendations from industry experts. In Phase II, the ERP system success model was updated by incorporating the results of the pilot survey. Finally in Phase III, the development of the ERP success model was finalized based on the results of data analysis with the main survey.
JOURNAL OF CONSTRUCTION ENGINEERING AND MANAGEMENT © ASCE / MARCH 2009 / 207
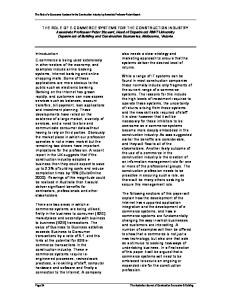
Fig. 2. Technology acceptance model 关adapted from Davis et al. 共1989兲兴
Fig. 1. ERP system success model development process
Information Systems/Information Technology Theories Since ERP systems are considered an innovative information system that integrates various business processes previous research on user acceptance models for IS can be a starting point to understand the success of ERP systems adaptation. This study incorporates two prevalent models related to IS acceptance: 共1兲 technology acceptance model 共Davis 1989兲; and 共2兲 DeLone and McLean 共D&M兲 IS success model 共DeLone and McLean 1992兲. In addition, the principles of the project management discipline are reviewed to identify the factors affecting an ERP systems implementation project. Technology Acceptance Model Davis 共1989兲 introduced the technology acceptance model 共TAM兲, adapting the theory of reasoned action 共TRA兲, specifically modified for modeling user acceptance of information systems 共Ajzen and Fishbein 1980; Fishbein and Ajzen 1975兲. The goal of TAM is to explain the determinants of computer acceptance related to user behavior across a broad range of end-user computing technologies and user populations. In addition, TAM provides a basis for tracing the impact of external variables on internal beliefs, attitudes, and intentions. TAM is formulated in an attempt to achieve these goals by identifying a small number of primary variables suggested by previous research dealing with the cognitive and affective determinants of IS acceptance, and using TRA as a theoretical background for modeling the theoretical relationships among these variables 共Davis et al. 1989兲. In this model, perceived usefulness and perceived ease of use are of primary relevance for IS acceptance behavior, as shown in Fig. 2.
TAM proposes that external variables indirectly affect attitude toward using, which finally leads to actual system use by influencing perceived usefulness and perceived ease of use. All the relations among the elements of TAM have been validated through many empirical studies. The tools used with TAM have proven to be of good quality and to yield statistically reliable results 共Legris et al. 2003兲. The main difference between TRA and TAM is the absence of subjective norm in TAM. Subjective norm is defined as “the person’s perception that most people who are important to him think he should or should not perform the behavior in question” 共Fishbein and Ajzen 1975兲. Davis did not include the variable subjective norms in TAM because of its uncertain theoretical and psychometric status, and negligible effect on perceived usefulness and ease of use 共Davis 1989兲. However, Hartwick and Barki 共2001兲 identified a mixed finding about subjective norm: after separating their respondents into voluntary and mandatory use contexts, they found that subjective norm had a significant impact on intention in mandatory system use but not in voluntary settings 共Hartwick and Barki 2001兲. For this reason, the updated TAM, also called TAM2, extended the original TAM by including subjective norm as an additional predictor of intention in the case of mandatory system use. Furthermore, TAM2 incorporated additional theoretical constructs including social influence processes and cognitive instrumental processes. The causal relationships and elements of TAM2 are described in Fig. 3 共Venkatesh and Davis 2000兲. DeLone and McLean IS Success Model In recognition of the importance in defining the IS dependent variables and IS success measures, DeLone and McLean proposed a taxonomy and an interactive model as a framework for organizing the concept of IS success 共DeLone and McLean 1992兲. They defined six major dimensions of IS success—system quality, information quality, use, user satisfaction, individual impact, and organizational impact. A total of 180 articles related to IS success were then reviewed using these dimensions to construct the model. DeLone and McLean’s IS success model 共D&M IS success model兲, as shown in Fig. 4, deals with both process and causal consideration. These six dimensions in the model are proposed to be interrelated rather than independent. Project Management Success Factors for ERP Implementation A construction project varies from one context to another depending on determinants including complexity, duration, budget, and quality. In ERP projects, the complexity depends on the project scope that includes the number of business functions affected and the extent to which ERP systems implementation changes business processes. ERP projects achieving real transformation usu-
208 / JOURNAL OF CONSTRUCTION ENGINEERING AND MANAGEMENT © ASCE / MARCH 2009
Fig. 3. Updated technology acceptance model 关adapted from Venkatesh and Davis 共2000兲兴
ally are from 1 to 3 years in duration. Resources required include hardware, software, consulting, training, and internal staff, with estimates of their cost ranging from $0.4 million to $300 million, with an average of about $15 million 共Koch 2002兲. Therefore, by viewing ERP implementation as a large project in general, we should consider the fundamentals of project management for achieving the success of ERP implementation. There is vast project management literature in the field of organizational research. Researchers have developed sets of fundamental project success factors that can significantly improve project implementation chances 共Pinto and Slevin 1987; Shenhar et al. 2002兲. Other researchers have identified the best practices and risks related to IS projects such as ERP implementation. Akkermans and Helden 共2002兲 provided success factors for ERP implementation based on a broad literature review followed by a rating of the factors by 52 senior managers from the U.S. firms that had completed ERP systems implementations. Ewusi-Mensan 共1997兲 identified reasons why companies abandon IS projects based on surveys of cancelled projects in Fortune 500 companies in the U.S. Keil et al. 共1998兲 proposed significant software project risks based on a Delphi study of experienced software-project managers in Hong Kong, Finland, and the U.S. Ferratt et al. 共2006兲 grouped the best practice questions forming four success factors for ERP implementation as follows:
Fig. 4. D&M IS success model 关adapted from DeLone and McLean 共1992兲兴
1.
Top-management support, planning, training, and team contributions; 2. Software-selection efforts; 3. Information systems area participation; and 4. Consulting capability and support. Ferratt et al. 共2006兲 validated these success factors through the empirical study of ERP projects. They also provided five outcome questions, which were shown to be significantly correlated and should, therefore, be combined to form a single outcome factor, effectiveness. Their regression analysis proved that all the success factors can affect the outcome significantly; therefore, these factors can be considered the representative success factors in ERP implementation.
Conceptual ERP Success Model Fig. 5 shows the proposed model, referred to as the conceptual ERP success model. As discussed in the previous sections, the success of ERP systems can be classified into two categories: the success of ERP adoption and the success of ERP systems implementation. For the successful ERP adoption, this research used already proven user acceptance models for IS such as TAM and D&M IS success model as the starting point. The model developed the rationale for the causal relationship based on these combined theoretical backgrounds and incorporated three main dimensions for identifying the truth about the success of ERP systems: success factors, intermediate constructs, and success indicators. The model also considered the success of ERP implementation based on the reviews on the project management fundamentals. The success factors suggested by Ferratt et al. 共2006兲 are used in the model because these were already validated in previous research and confirmed by several experts interviewed. This research hypothesized that these factors directly affect perceived usefulness, and finally lead to ERP success or failure. Furthermore, “project success” is included as an additional success indicator to clarify its impact on the other success indicators. Project
JOURNAL OF CONSTRUCTION ENGINEERING AND MANAGEMENT © ASCE / MARCH 2009 / 209
Fig. 5. Conceptual ERP success model
success is evaluated in terms of time, budget, quality, and scope as usual project management contexts are applied. One important point to be noted in this model is that “subjective norm” is included in the intermediate constructs because ERP systems are usually used in mandatory settings. The causal relationship related to this factor was also applied to TAM2, which was already validated.
Survey Design The survey instrument was designed based on the conceptual ERP success model proposed for this research. Each variable had at least two questions for reliability purposes. Most questions in the survey were primarily adapted from the relevant previous research related to IS acceptance or success. All items were measured on a seven-point Likert scale from strongly disagree to strongly agree. Detail items in the survey are described in the Appendix section. User-Related Variables A total of seven user-related variables were identified in this research. Among the user-related variables, four of them were adopted from TAM2, which are output quality, job relevance, image, and result demonstrability. The other three variables including compatibility, system reliability, and reporting capability were extracted from interviews with industry experts. All the user-related variables were hypothesized to have a positive impact on perceived usefulness directly, and then their relationships were verified later with the analysis of the following surveys. Output Quality The survey items about output quality were adapted from TAM2 共Venkatesh and Davis 2000兲. Output quality can be referred to as
how well the system performs tasks matching the user’s job goal 共Venkatesh and Davis 2000兲. These questions attempted to ask respondents the degree of output quality from the ERP system that they currently use. Job Relevance Job relevance is defined as an individual’s perception regarding the degree to which the target system is applicable to his or her job. It is also referred to as a function of the importance within one’s job of the set of tasks the system is capable of supporting 共Venkatesh and Davis 2000兲. There were three questions related to job relevance. Two of them were adapted from TAM2, and the other one was recommended by one of the interviewed industry experts. The questions were about how relevant usage of the ERP system is in each respondent’s job. Image Image is defined as the degree to which use of an information system is perceived to enhance one’s image or status in one’s social system 共Moore and Benbasat 1991兲. The items in variable “image” were also adapted from TAM2. The questions asked respondents if people who use the ERP system in their organization can have a better image so that they would intend to enhance their social status among peers with use of the ERP system. Result Demonstrability Moore and Benbasat 共1991兲 defined result demonstrability as “the tangibility of the results of using the system, including their observability and communicability.” There were three questions related to result demonstrability. All three questions were adapted from TAM2 共Vankatesh and Davis 2000兲. These questions were about how easily users can explain the consequences and results of using the ERP system.
210 / JOURNAL OF CONSTRUCTION ENGINEERING AND MANAGEMENT © ASCE / MARCH 2009
Compatibility Compatibility is referred to as the capability of an information system to exchange data with other systems. Many interviewees strongly recommended including this factor because compatibility issues of different systems are critical to the success of ERP systems implementation. These questions asked respondents about the capability of their ERP systems in importing and exporting data from/to other systems or software they currently use. System Reliability System reliability is defined as the degree to which the system ensures the delivery of data to the users. It was also recommended by industry experts reflecting their experience and lessons learned about ERP systems implementation. There were three questions that asked about data loss and system errors as well as the overall reliability of the ERP system that respondents currently use. Reporting Capability This factor was suggested by industry experts. They argued that the major benefits of ERP systems for the company are management and measurement reporting such as critical success factor 共CSF兲 and key performance indicator 共KPI兲. Two questions were developed to measure the reporting capability of respondents’ ERP systems and asking how useful these reports are. Project-Related Variables Four best-practice factors that impact the ERP project success derived by Ferratt et al. 共2006兲 were used to assess project-related variables. This research assumed that these factors impact both on “perceived usefulness” and “project success.” Internal Support Ferratt et al. 共2006兲 found that top-management support, planning, training, and team contributions can be grouped together to form a single factor from the results of their factor analysis and scale-reliability analysis. This new factor is named “internal support” in this study, and is defined as the degree of the company’s internal support for the ERP implementation project. Four questions were developed to identify the degree of internal support related to ERP systems implementation. Items include questions about the degree of top-management support, planning, training, and team contributions with respect to respondents’ ERP implementation projects. Software Selection Umble and Umble 共2002兲 advocated the importance of software capabilities. They found that if the software capabilities and needs are mismatched with a company’s business processes, this can lead the ERP implementation to failure. There were two questions related to software selection. The questions asked about how well the ERP software that the respondent’s company is using can support its business processes as well as the functionality of the software. Consultant Support Gargeya and Brady 共2005兲 identified that consultant support is one of the success and failure factors in ERP systems implementation. Two questions were developed to assess the degree of consultant support for the ERP implementation project. One question asked about the consultant capability and the other asked the degree of the consultant support during the ERP systems implementation project.
Information Systems Area Participation According to Ferratt et al. 共2006兲, identifying what information system should be included in ERP systems implementation was one of the most important factors that was highly associated with the success of ERP implementation projects. This factor should be matched with the company’s essential business functions. Two questions were related to the “information systems area participation” variable. These questions asked respondents to evaluate how well the functions of their ERP system are defined and how well these are matched with their company’s necessary business functions. Intermediate Variables Subjective norm and perceived ease of use is classified into this category. These two variables affect both perceived usefulness and intention to use/use directly as TAM previously verified. Subjective Norm The items in variable “subjective norm” are adapted from the survey items developed by Lucas and Spitler for the model of broker workstation use in a field setting 共Lucas and Spitler 1999兲. There were four questions with respect to the impact of subjective norm on the use of the ERP system. Two of them were for identifying the impact of respondents’ work group on their ERP system use, and the other two were about senior management’s impact on use. Perceived Ease of Use Perceived ease of use is defined as “the degree to which the prospective user expects the target system to be free of effort” 共Davis et al. 1989兲. It is considered a fundamental aspect of the technical quality of an information system 共Davis and Olson 1985兲. There were three questions related to perceived ease of use. These questions were adapted from TAM and TAM2 survey items. All items were intended to ask respondents how easy users can use their ERP systems. Perceived Usefulness Perceived usefulness is defined as “the degree to which a person believes that using a particular system would enhance his or her job performance.” The word useful refers to “capable of being used advantageously” 共Davis 1989兲. There were four questions with regard to perceived usefulness. These questions were also adapted from TAM and TAM2 survey items. Questions included the degree of usefulness in improving respondents’ performance, productivity, and effectiveness as well as overall perceived usefulness of the ERP system that they currently use. Success Indicators Intention to Use/Use This study assumed that the amount of use can have a positive impact on the degree of user satisfaction as well as the reverse being true as proposed in the DeLone and McLean 共1992兲 IS success model. There were a total of five questions to assess the degree of intention to use. Three of them were adopted from the survey items proposed in TAM2, which are directly related to user’s behavior in intention to use and actual system use. Another two questions were to identify respondent’s use hours and the most used functions of the system.
JOURNAL OF CONSTRUCTION ENGINEERING AND MANAGEMENT © ASCE / MARCH 2009 / 211
User Satisfaction DeLone and McLean 共1992兲 showed that user satisfaction is one of the most widely used success measures of information system success. Three questions were developed to assess user satisfaction of a respondent’s ERP system. Items include questions about satisfaction with information quality and performance of the ERP system that the respondent uses as well as the degree of overall satisfaction with the system. Individual Impact Possible indications that an information system has a positive individual impact include: better understanding of the decision context, improving user’s decision making productivity, producing a change in user activity, and changing the decision maker’s perception of usefulness of the system 共DeLone and McLean 1992兲. Two questions were developed to identify the degree of individual impact thanks to the ERP system. Items included questions about increasing efficiency and making effective decisions from the use of the ERP system. Organizational Impact Three questions were developed to assess organizational impact of the ERP system. Two questions were about operations cost savings and revenue increases. Another interesting question asked the organizational impact from the perspective of “stock price” as suggested by several experts. They mentioned that their companies’ stock price went up after their ERP implementation, so they believed that there is a positive relationship between the company’s stock price and ERP systems implementation. Project Success Project success factor was developed for assessing the success of an ERP systems implementation project as a success indicator. To determine how successfully an implementation project has been completed, the degree of project success should be assessed in terms of time, cost, quality, and scope as usual project management contexts applied. Therefore, four questions were developed to ask whether the ERP implementation project was completed on time, on budget, with good quality, and finally whether the scope of the system was well matched with the company’s needs.
Pilot Survey A pilot survey was executed before conducting the main survey. The purpose of the pilot survey was to examine whether or not the proposed model was well developed and suitable to analyze ERP success. It also examined how well the survey was designed for respondents to answer the questions properly. The conceptual ERP success model and contents of the main survey were modified based on the results of the pilot survey. Data Collection The pilot survey was developed by using Surveymonkey tools and was conducted as a web-based survey. The link to the survey was sent to the contacted individuals so that they could distribute it to other possible participants. A total of nine senior managers working for engineering and construction 共E&C兲 companies that currently use ERP or ERP equivalent systems were contacted for conducting the pilot survey. They were asked to take the pilot
survey and distribute it to their colleagues who currently use ERP systems and acquaintances who were involved in ERP systems implementation projects. A total of 57 responses from nine different E&C firms were received. The average experience years was 8.5 years, and over 60% of respondents had at least 6 years or more experience in the construction industry. Among the respondents, about 56% of them were managers or higher level. The average usage hours of the ERP system was 11.3 h, per week and 67% of the respondents used their ERP system at least 6 h per week. Data Analysis Data analyses with the pilot survey were conducted in three separate steps: Step 1—examining correlation and reliability of items within each variable; Step 2—initial adjustment based on factor analysis; and Step 3—testing new variables with correlation and reliability analysis. The first step was examining correlation and reliability between items within each variable so that we can identify which variables should be modified. Survey instruments used in social science are generally considered reliable if they produce similar results regardless of administrator and forms. Cronbach’s alpha is the most widely used as a measure of reliability. It indicates the extent to which a set of test items can be treated as measuring a single variable. Cronbach’s alpha generally increases when the correlations between the items increase. For this reason, items in each variable that are highly correlated should have a higher internal consistency of the test. The lower acceptable limit of 0.50– 0.60 was suggested by Kaplan and Saccuzzo; however, as a rule of thumb, a reliability of 0.70 or higher is required before an instrument will be used 共George and Mallery 2007; Kaplan and Saccuzzo 1993兲. The second step was data analysis with the pilot survey to make adjustments with the result of factor analysis. Factor analysis attempts to identify underlying variables, or factors, that explain the pattern of correlations within a set of observed variables. It is most frequently used to identify a small number of factors representing relationships among sets of interrelated variables. For this reason, factor analysis is considered a statistical data reduction technique that takes a large number of observable instances to measure an unobservable construct or constructs. It generally requires four basic steps: 共1兲 calculate a correlation matrix of all variables; 共2兲 extract factors; 共3兲 rotate factors to create a more understandable factor structure; and 共4兲 interpret results 共George and Mallery 2007兲. For new factors, we looked at variables extracted from factor analyses by examining correlation coefficients and reliability indicators. Fig. 6 illustrates the data analysis done with the pilot survey. Initially, there were four factors and 11 items associated with them. After factor analysis, two factors were extracted. Based on the result of factor loadings, “user satisfaction,” “individual impact,” and “organizational impact” can be a single factor named as “ERP benefits,” while “project success” remained as it was. The new factor, “ERP benefits” was examined for its consistency by conducting correlation and reliability test and added as a new variable for the main survey. After completing a series of data analyses with the pilot survey, the final adjustments are summarized as below: 1. Items job3, result3, interna3, and orgimpa3 were eliminated; 2. Variables “output quality” and “reporting capability” were
212 / JOURNAL OF CONSTRUCTION ENGINEERING AND MANAGEMENT © ASCE / MARCH 2009
Fig. 6. Example of factor analysis process
grouped together into the new variable “output”; Variables “software selection,” “consultant support,” and “system area participation” were merged into a single factor, “ERP evaluation”; 4. Variable “user satisfaction,” “individual impact,” and “organizational impact” are merged into the new factor, “ERP benefits”; and 5. Question 共use5 in Appendix兲 regarding the most used functions of the ERP system for each respondent was eliminated due to its low response rate. The new survey instrument that has been used in the main survey is described in Table 1 showing the variables with their 3.
Table 1. Summary of Adjustment in Survey Instrument after Pilot Survey Variable
Number of Items
Output
4
Job relevance Image Result demonstrability Compatibility System reliability Internal support
2 2 2
3
ERP Evaluation
6
Subjective Norm Perceived usefulness Perceived Ease of use Intention to use/use ERP benefits
Project success
4
2 3
Items report1, report2, output1, output2 job1, job2 image1, image2 result1, result2
Reliability 共␣兲 0.81 0.91 0.82 0.71 0.89 0.79
4
compa1, compa2 reliabl1, reliabl2, reliabl3 interna1, interna2, interna4 softwar1, softwar2, consul1, consul2, sysfun1, sysfun2 sn1, sn2, sn3, sn4
4
pu1, pu2, pu3, pu4
0.94
3
eou1, eou2, eou3
0.92
3 7
use1, use2, use3 satis1,satis2, satis3, indimpa1, indimpa2, orgimpa1,orgimpa2 prosucc1, prosucc2, prosucc3, prosucc4
0.78 0.92
0.76 0.92
contents of items and reliability. The revised ERP success model after adjustment with the pilot survey shown in Fig. 7 now looks much simpler than the conceptual model.
Final ERP Success Model Data Collection The targeted respondents of the survey were ERP system users who are currently working for the construction industry regardless of their company’s main business area. The list of targeted respondents was obtained from several sources, i.e., constructionrelated organizations, trade magazines, AEC-related websites, ERP vendor websites, and ERP related newsgroups. The main survey was conducted between May 14 and June 24, 2007, and a total of 281 responses were received. Barclay et al. 共1995兲 claimed that the sample size should have at least 10 data points per each factor that are required to statistically analyze the most complex construct in the model. We had initially a total of 19 factors and 281 responses, which surpass the minimum requirement for proper analysis. The survey was e-mailed to about 3,000 individuals, and about 30% of the e-mail was bouncing back and finally sent to approximately 2,100 individuals. Additionally, a total of approximately 100 directly contacted senior managers, vice presidents, and IT managers distributed the survey to five to 10 individuals per person, so we assumed that each distributed the survey to an average of 7.5 individuals. Therefore, the survey was sent to a total of approximately 2,850 individuals, and the response rate was about 10%.
0.84
0.83
Fig. 7. Modified ERP success model after pilot survey
JOURNAL OF CONSTRUCTION ENGINEERING AND MANAGEMENT © ASCE / MARCH 2009 / 213
Table 2. Summary of Final Factors Adjustment Variable
Number of items
Output
4
Job relevance Image Result demonstrability Compatibility System reliability Internal support
2 2 2 2 3 3
Function
4
Consultant support Subjective norm Perceived usefulness Perceived ease of use Intention to use/use ERP benefits
2 4 4 3 3 7
Project success— progress Project success— quality
2
report1, report2, output1, output2 job1, job2 image1, image2 result1, result2 compa1, compa2 reliabl1, reliabl2, reliabl3 interna1, interna2, interna4 softwar1, softwar2, sysfun1, sysfun2 consul1,consul2, sn1, sn2, sn3, sn4 pu1, pu2, pu3, pu4 eou1, eou2, eou3 use1, use2, use3 satis1,satis2, satis3, indimpa1, indimpa2, orgimpa1,orgimpa2 prosucc1, prosucc2,
2
prosucc3, prosucc4
Items
Reliability 共␣兲 0.84 0.90 0.87 0.84 0.88 0.83 0.69 0.90 0.75 0.83 0.96 0.93 0.85 0.92
0.88 0.89
Final Adjustment of Research Model Data analysis with the main survey was conducted with the same steps as the pilot survey. The first analysis looked at correlation and reliability between items within each variable to identify which variables should be modified. Variables were then modified based on the result of factor analysis. SPSS 15 was used for all the data analysis done with the main survey. After completing a series of data analyses with the main survey, the final adjustments are summarized below: 1. The new variable after the pilot survey “ERP evaluation” was divided into two factors “function” and “consultant support.” The new factor “functions” includes the items related to software selection and information systems area participation in the conceptual ERP success model. 2. Items in the factor “project success” was divided into two groups “progress” and “quality.” The new factor “progress” includes questions about project completion on time and within budget, while “quality” has questions related to system quality and the scope matched with the company’s needs. 3. Other variables remained the same as they were in the pilot survey. Compared to the result of the pilot survey, there were minor changes to the main survey. This indicates that the survey instrument was well developed to maintain the consistency of responses. Table 2 describes the summary of final factor adjustment showing the variables with their contents of items and reliability. The ERP success model after final adjustment with the main survey is shown in Fig. 8.
Discussions and Conclusions The main purpose of this research was to show the development process of the ERP success model and identify the factors and
Fig. 8. Final ERP success model
indicators associated with the ERP success. Most IT/IS research in construction management in the past developed surveys or proposed research models without IT/IS theories because this type of research approach is still relatively new in construction research. Previous researchers mainly identified the importance of factors by simply comparing the mean values of factors, and ranked the factors in accordance with their importance showing the higher mean value as the more important factor. However, the relationships between various factors could not be explained properly by ranking the factors in order. Regression analysis should be used to analyze the relationships of variables as well as finding the significance of each factor associated with the dependent variable. In addition, previous IT/IS systems implementation research in the construction field only identified direct relationships between independent and dependent variables, e.g., success factors— success. However, chances are, most factors indirectly impact on a given dependent variable by directly influencing mediating variables instead of directly affecting the dependent variable. These research shortcomings were due to the lack of sound theoretical foundations of IT/IS research. In most IT/IS implementation, related research using social science approaches, and solid theories are used in formulating the research model. Most ERP-related research in the other sectors has tried to identify the factors and formulate models without using the theoretically validated models such as TAM and D&M IS success model. This research was the first study attempting to identify the factors affecting ERP success with strong background theories in construction and IT/IS implementation-related research. Therefore, the academic contribution of this study can be found in a deliberate attempt to formulate the ERP success model for the engineering-construction sector where businesses are operated by projects. Although we did not show the detailed results of regression analyses in this study, we have identified that the results 共e.g., regression coefficients of factors, correlations between factors兲 were different between the groups of the respondents’ country, software used, years of experience in the construction industry, and use hours of their ERP systems. We also found that factors and their structural relationships in the success model of each group were almost identical. A more detailed discussion of regression analyses and their findings from such analyses are presented in a companion paper 共Chung et al. 2008兲. The model in this study can be applied to the case of a specific company although regression results will be different. Therefore, the proposed ERP success model will be helpful for the construction industry executives and decision makers to have a better understanding in regard to the success of ERP systems implemen-
214 / JOURNAL OF CONSTRUCTION ENGINEERING AND MANAGEMENT © ASCE / MARCH 2009
tation. Organizations can develop their own ERP success model and extract the factors specific to their company by using the proposed approach and the ERP success model presented in this paper would be used as a reference and a guideline.
Appendix. Items Used in the Survey Instrument 共Seven-point Likert scale: 1—strongly disagree, 2—moderately disagree, 3—somewhat disagree, 4—neutral, 5—somewhat agree, 6—moderately agree, 7—strongly agree兲. Note: items with italic bold characters 共job3, result3, interna3, use5, and orgimpa3兲 indicate that they were not used in the main survey. Items “use4” and “use5” were open-ended questions.
Project-Related Variables Internal Support interna1: Our top management supported ERP implementation project well. interna2: Training for the ERP system was very helpful for me to understand and use it. interna3: Someone asked me some questions and opinions related to the ERP system during its implementation. interna4: Our ERP implementation progressed well as was originally planned. Software Selection softwar1: The ERP software our company is using can support our business processes well. softwar2: The functionality of the ERP software our company is using is very good.
Success Factors User-Related Variables Output Quality output1: The quality of the output I get from the ERP system is high. output2: I have no problem with the quality of the ERP system’s output. Job Relevance job1: In my job, usage of the ERP system is important. job2: In my job, usage of the ERP system is relevant. job3: I have access to the ERP system, but I prefer to use non-ERP tools. Image image1: People in my organization who use the ERP system have more prestige than those who do not. image2: People in my organization who use the ERP system have a high profile. Result Demonstrability result1: I have no difficulty telling others about the results of using the ERP system. result2: I believe I could communicate to others the consequences of using the ERP system. result3: I would have difficulty explaining why using the ERP system may or may not be beneficial. Compatibility compa1: I have no difficulty in exporting data from the ERP system to other systems or software I currently use. compa2: I have no difficulty in importing data to the ERP system from other systems or software I currently use. System Reliability reliabl1: I think the ERP system is very reliable. reliabl2: I don’t worry about data loss when I use the ERP system. reliabl3: I don’t find system errors very often when I use the ERP system. Reporting Capability report1: The management reports from the ERP system are very useful. report2: The measurement reports 共CSF/KPI兲 from the ERP system are very useful.
Consultant Support consul1: I think consultants led us to the right direction during ERP implementation. consul2: I think consultants can help us to have a successful ERP implementation. Information Systems Area Participation sysfun1: The business functions of the ERP system are well defined. sysfun2: The ERP system covers our necessary business functions very well. Intermediate Variables Subjective Norm sn1: Others in my work group strongly support my using the ERP system. sn2: I would like very much to use the ERP system because others in my work group think I should use it. sn3: Senior management strongly supports my using the ERP system. sn4: I would like very much to use the ERP system because senior management thinks I should use it. Perceived Usefulness pu1: Using the ERP system improves my performance. pu2: Using the ERP system improves my productivity. pu3: Using the ERP system improves my effectiveness. pu4: Overall, using the ERP system is very useful in my job. Perceived Ease of Use eou1: I find the ERP system easy to use. eou2: I find it easy to get the ERP system to do what I want it to do. eou3: My interaction with the ERP system is clear and understandable. Success Indicators Intention to Use/Use use1: Assuming I have access to the ERP system, I intend to use it. use2: I have access to the parts of the ERP system when I need to do my job. use3: I heavily use the ERP system whenever I need it.
JOURNAL OF CONSTRUCTION ENGINEERING AND MANAGEMENT © ASCE / MARCH 2009 / 215
use4: About how many hours a week do you use the ERP system? use5: What are the three functions of the ERP system you use the most? User Satisfaction satis1: I am very satisfied with Information quality of the ERP system. satis2: I am very satisfied with performance of the ERP system. satis3: Overall, I am very satisfied with the ERP system. Individual Impact indimpa1: With the ERP system, I don’t need to do “repetitive work” again. indimpa2: The ERP system can help me make effective decisions. Organizational Impact orgimpa1: With the ERP system, my organization saves operating costs. orgimpa2: With the ERP system, my organization increases revenues. orgimpa3: After ERP implementation, the stock price of my organization went up. Project Success prosucc1: The ERP implementation project was completed on time. prosucc2: The ERP implementation project was completed within the budget as initially planned. prosucc3: I think the quality of our ERP system is very good. prosucc4: The scope of our ERP system is well matched with our company’s needs.
References Ajzen, I., and Fishbein, M. 共1980兲. Understanding attitudes and predicting social behavior, Prentice-Hall, Englewood Cliffs, N.J. Akkermans, H., and Helden, K. V. 共2002兲. “Vicious and virtuous cycles in ERP implementation: A case study of interrelations between critical success factors.” Eur. J. Inf. Syst., 11, 35–46. Barclay, D., Thompson, R., and Higgin, C. 共1995兲. “The partial least squares 共PLS兲 approach to causal modeling: Personal computer adoption and use as an illustration.” Tech. Stud., 2共2兲, 285–309. Chung, B., Skibniewski, M. J., Lucas, H. C., Jr., and Kwak, Y. H. 共2008兲. “Analyzing enterprise resource planning 共ERP兲 systems implementation success factors in the engineering-construction industry.” J. Comput. Civ. Eng., 22共6兲, 373–382. Davis, F. D. 共1989兲. “Perceived usefulness, perceived ease of use, and user acceptance of information technology.” MIS Q., 13共3兲, 318–340. Davis, F. D., Bagozzi, R. P., and Warshaw, P. R. 共1989兲. “User acceptance
of computer technology: A comparison of two theoretical models.” Manage. Sci., 35共8兲, 982–1003. Davis, G. B., and Olson, M. H. 共1985兲. Management information systems: Conceptual foundations, structure, and development, McGrawHill, New York. DeLone, W. H., and McLean, E. R. 共1992兲. “Information systems success: The quest for the dependent variable.” Entrepreneurship Theory Pract., 3共1兲, 60–95. Ewusi-Mensah, K. 共1997兲. “Critical issues in abandoned information systems development projects.” Commun. ACM, 40共9兲, 74–80. Ferratt, T. W., Ahire, S., and De, P. 共2006兲. “Achieving success in large projects: Implications from a study of ERP implementations.” Interfaces, 36共5兲, 458–469. Fishbein, M., and Ajzen, I. 共1975兲. Belief, attitude, intention, and behavior: An introduction to theory and research, Addison-Wesley, Reading, Mass. Gargeya, V. B., and Brady, C. 共2005兲. “Success and failure factors of adopting SAP in ERP system implementation.” Bus. Process Manage. J., 11共5兲, 501–516. George, D., and Mallery, P. 共2007兲. SPSS for Windows step by step: A simple guide and reference 14.0 update, Allyn and Bacon, Boston, Mass. Hartwick, J., and Barki, H. 共2001兲. “Communication as a dimension of user participation.” IEEE Trans. Prof. Commun., 44共1兲, 21–36. Kaplan, R. M., and Saccuzzo, D. P. 共1993兲. Psychological testing: Principles, applications and issues, Brooks/Cole Publishing, Pacific Grove, Calif. Keil, M., Cule, P. E., Lyytinen, K., and Schmidt, R. C. 共1998兲. “A framework for identifying software project risks.” Commun. ACM, 41共11兲, 76–83. Koch, C. 共2002兲. “ABC: An introduction to ERP: Getting started with enterprise resource planning 共ERP兲.” CIO. Legris, P., Ingham, J., and Collerette, P. 共2003兲. “Why do people use information technology? A critical review of the technology acceptance model.” Inf. Manage., 40, 191–204. Lucas, H. C., and Spitler, V. K. 共1999兲. “Technology use and performance: A field study of broker workstations.” Decision Sci., 30共2兲, 291–311. Moore, G. C., and Benbasat, I. 共1991兲. “Development of an instrument to measure the perceptions of adopting an information technology innovation.” Entrepreneurship Theory Pract., 2共3兲, 192–222. Pinto, J. K., and Slevin, D. P. 共1987兲. “Critical factors in successful project implementation.” IEEE Trans. Eng. Manage., EM34共1兲, 22– 27. Shenhar, A. J., Tishler, A., Dvir, D., Lipovetsky, S., and Lechler, T. 共2002兲. “Refining the search for project success factors: A multivariate, typological approach.” R&D Manage, 32共2兲, 111–126. Shi, J. J., and Halpin, D. W. 共2003兲. “Enterprise resource planning for construction business management.” J. Constr. Eng. Manage., 129共2兲, 214–221. Umble, E. J., and Umble, M. M. 共2002兲. “Avoiding ERP implementation failure.” Ind. Manage., 44共1兲, 25–33. Venkatesh, V., and Davis, F. D. 共2000兲. “A theoretical extension of the technology acceptance model: Four longitudinal field studies.” Manage. Sci., 46共2兲, 186–204.
216 / JOURNAL OF CONSTRUCTION ENGINEERING AND MANAGEMENT © ASCE / MARCH 2009